Genetic, cellular, and structural characterization of the membrane potential-dependent cell-penetrating peptide translocation pore
- Department of Biomedical Sciences, University of Lausanne, Switzerland
- Dalle Molle Institute for Artificial Intelligence Research, Università della Svizzera italiana, Scuola Universitaria Professionale della Svizzera Italiana, Switzerland
- PolitoBIOMed Lab Department of Mechanical and Aerospace Engineering, Politecnico di Torino, Italy
- Department of Fundamental Neurosciences, University of Lausanne, Switzerland
- CURML (University Center of Legal Medicine), Lausanne University Hospital, Switzerland
Figures
Figure 1 with 4 supplements
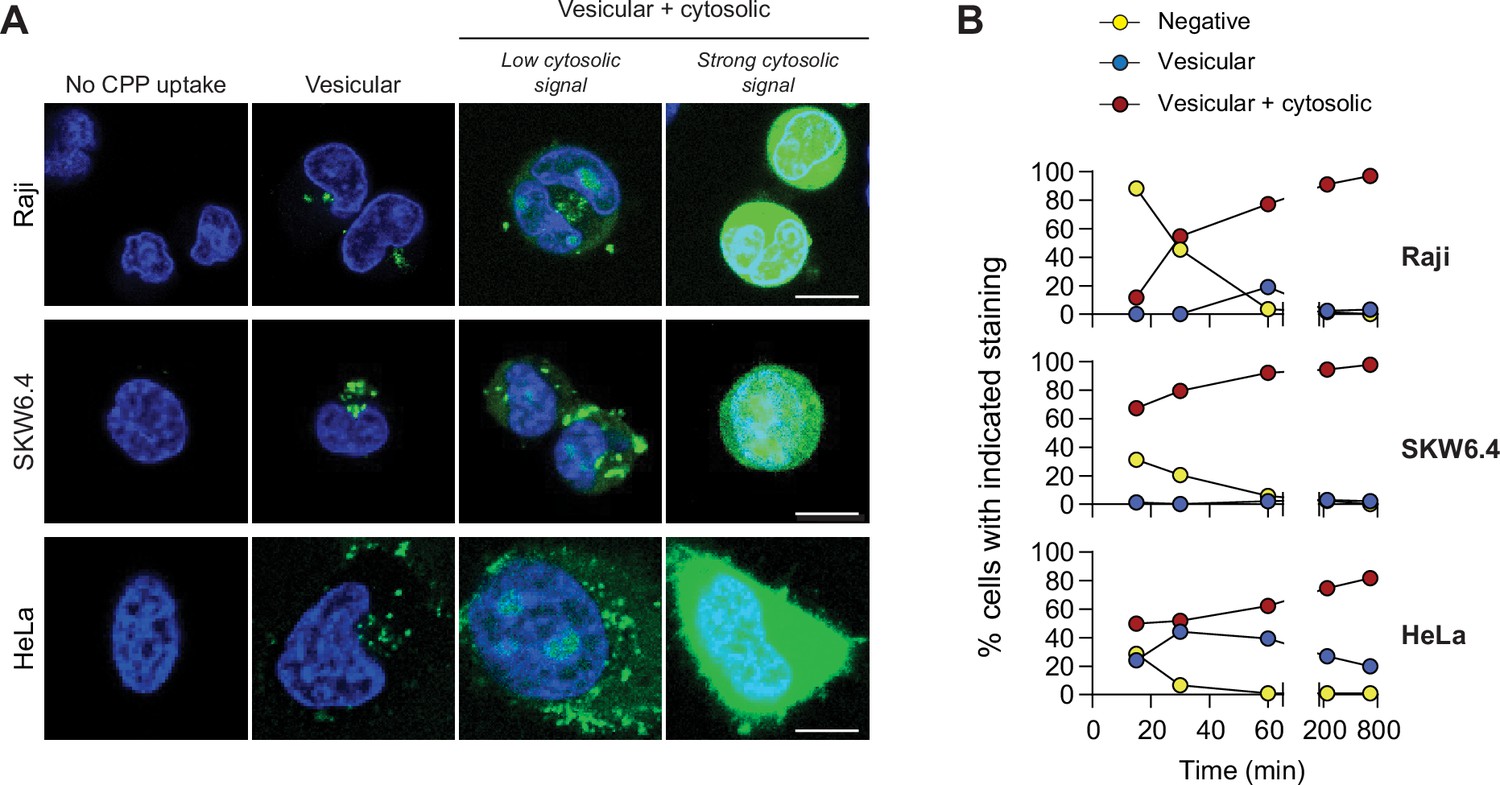
TAT-RaGAP317-326 cellular entry modes.
(A) Depiction of the different modes of cell-penetrating peptide (CPP) entry into cells. Confocal microscopy was performed on the indicated cell lines incubated for 1 hr with 40 μM FITC-TAT-RasGAP317-326 in RPMI, 10% fetal bovine serum (FBS). Cells were washed with PBS prior to visualization. Vesicular staining is indicative of CPP endocytosis while diffuse cytosolic staining is a consequence of CPP direct translocation into cells. Scale bar: 10 μm. (B) Quantitation of the different modes of CPP entry as a function of time (FITC-TAT-RasGAP317-326 continually present in the media) using the experimental conditions presented in panel A. Types of staining were visually quantitated as indicated in Figure 1—figure supplement 1A (n = 157 cells per condition). There was no indication of fluorescence quenching, due to endosomal acidification, preventing the detection of CPP-containing endosomes (in at least during the first hour of CPP exposure) (Figure 1—figure supplement 1B). TAT-RasGAP317-326 enters cells via endocytosis and direct translocation, but only direct translocation mediates its biological activity and leads to cell death (Figure 1—figure supplement 4). Results correspond to the average of three independent experiments.
Figure 1—figure supplement 1
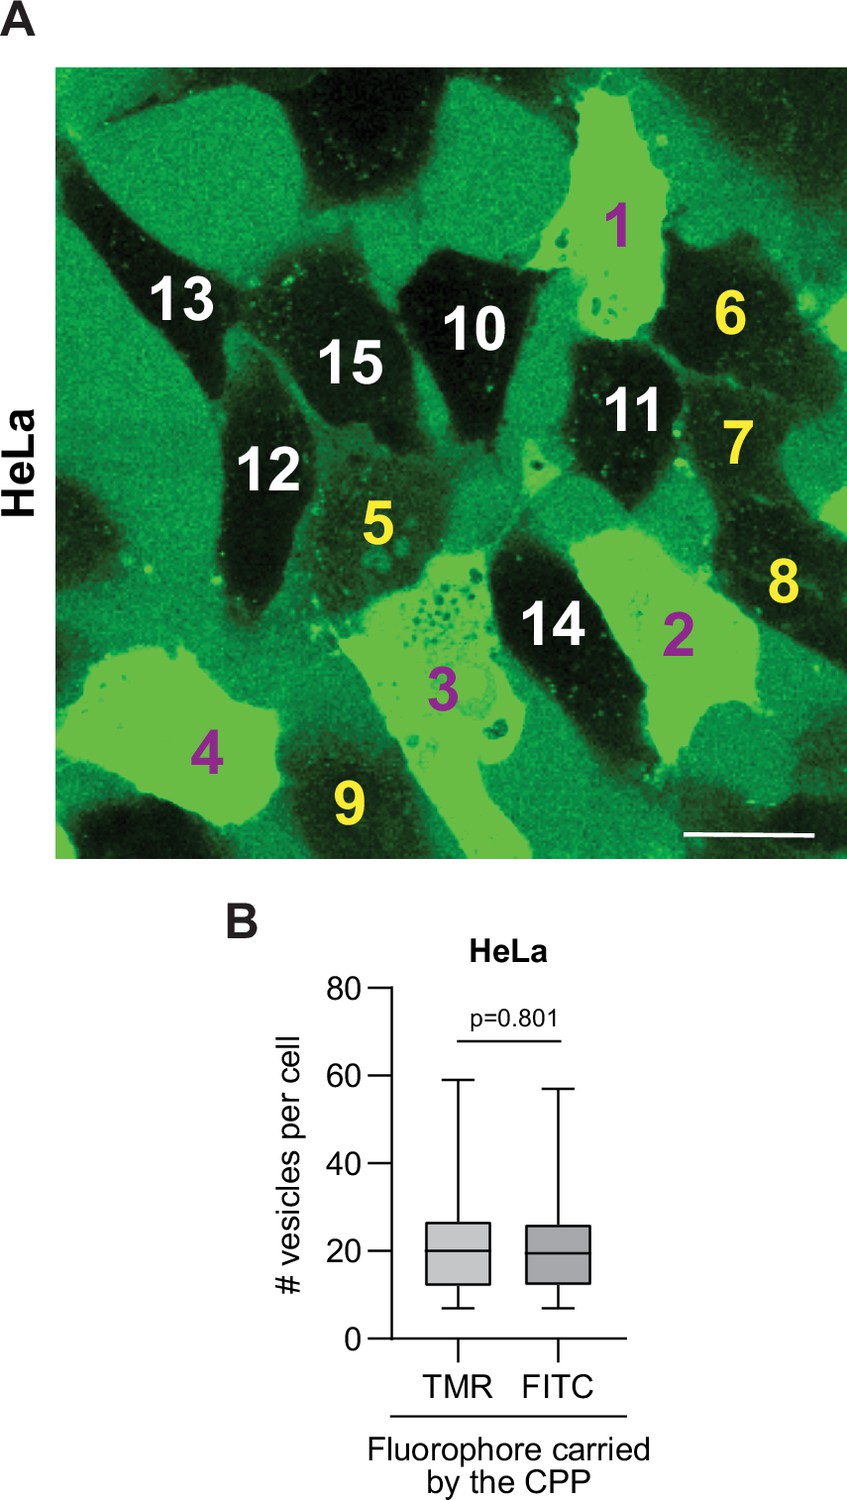
TAT-RasGAP317-326 internalization mode attribution and no impact of quenching for the detection of cell-penetrating peptide (CPP)-containing endosomes.
(A) Visual attribution of the various types of staining associated with FITC-CPP internalization in wild-type HeLa cells. Cells 1–9 took up the CPP through both direct translocation and endocytosis (cells 1–4 and cells 5–9 displaying strong and weak cytosolic signal, respectively); cells 10–15 acquired FITC-TAT-RasGAP317-326 in vesicles only, no cytosolic staining being detected. The experimental conditions are those of Figure 1A. Scale bar: 20 μm. (B) Potential fluorophore quenching does not prevent detection of CPP-containing endosomes. Wild-type HeLa cells were incubated for 1 hr at 37°C in the presence of 40 μM TAT-RasGAP317-326 labeled with either FITC (susceptible to quenching at low pH) or TMR (not quenched at low pH) fluorophores. The number of vesicles was visually determined based on confocal images. There were no fewer vesicles detected in cells when the peptide was labeled with FITC than when it was labeled with TMR.
Figure 1—figure supplement 2
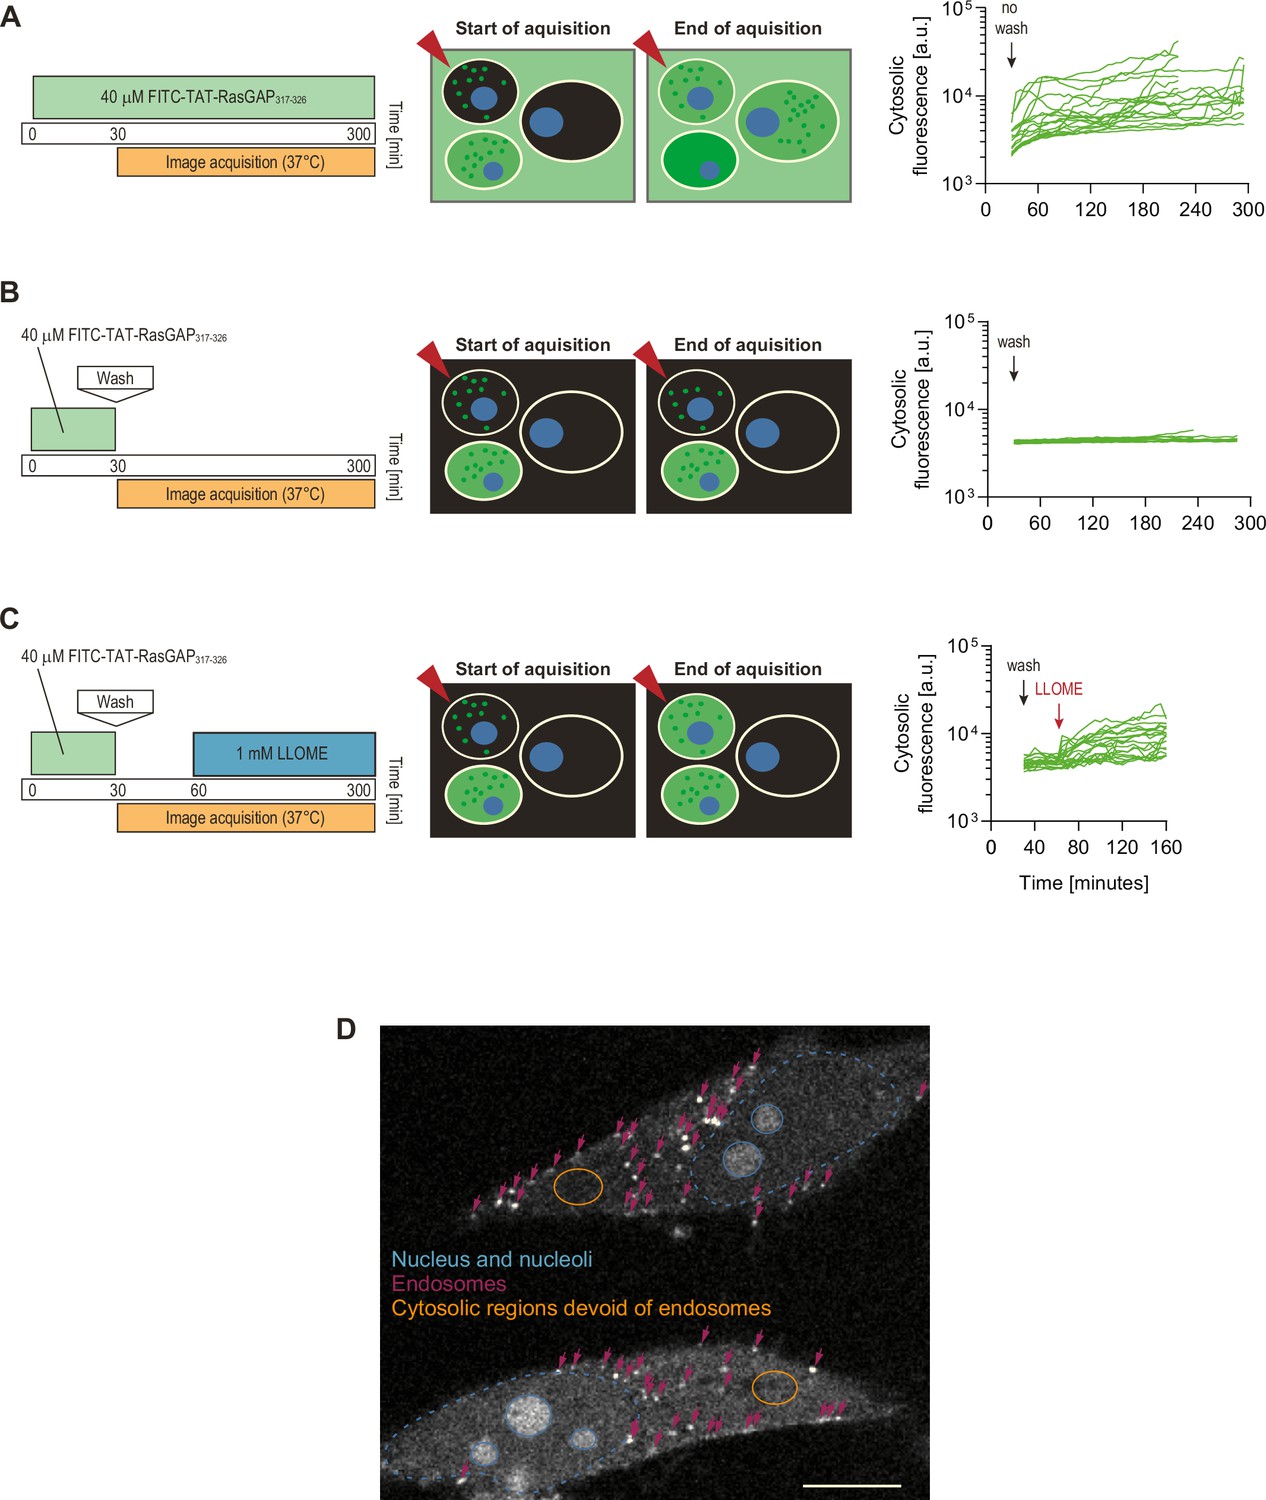
No evidence of endosomal escape from TAT-RasGAP317-326-containing endosomes.
To assess whether cytosolic peptide accumulation could be due to endosomal escape, we incubated cells with the indicated concentrations of FITC-TAT-RasGAP317-326 for 30 min, washed the cells, and then monitored the cytosolic cell-penetrating peptide (CPP) acquisition only in cells that had initially taken up the peptide by endocytosis, that is, cells that did not display, at the beginning of image acquisition, a cytosolic signal indicative of direct translocation (examples of such cells are indicated by red arrows in the scheme). The graphs show single cell quantitation of FITC-TAT-RasGAP317-326 cytosolic fluorescence (see panel D) according to the experimental setups shown on the left. The cell traces correspond to acquisitions gathered from three independent experiments (panel A, 19 cells, panel B, 16 cells, and panel C, 22 cells). As a control, when cells were not washed (i.e. the peptide was present in the medium), cytosolic acquisition increased over time (panel A; see also left panel in Video 4). However, no increase in the cytosolic signal was observed in washed out cells containing peptide-labeled endosomes (panel B and Video 4, right panel). An increase in cytosolic fluorescence could be detected when endosomal escape was artificially induced by the lysosome disruptor LLOME (Repnik et al., 2017) (panel C). In live cells therefore diffuse cytosolic TAT-RasGAP317-326 signal originates from direct translocation and not from endosomal escape. (D) Representative confocal image showing two FITC-TAT-positive cells. Nucleus is labeled in blue, endosomes with pink arrows and the orange-circled zone corresponds to a cytosolic region devoid of endosomes. Such regions are those that are used to record CPP cytosolic fluorescence signals. Scale bar: 10 μm.
Figure 1—figure supplement 3

Cytosolic acquisition of fluorophore-labeled cell-penetrating peptides (CPPs) is not a consequence of laser-induced cellular damage.
HeLa cells were incubated with 80 μM FITC-TAT-RasGAP317-326 for 30 min with the indicated frequencies of laser exposures (n = 133 cells per condition). Quantitation of the cytosolic fluorescence intensity after 30 min (n = 235 cells per condition) is shown on the left and the percentage of cells with cytosolic fluorescence is shown on the right. FITC-TAT-RasGAP317-326 translocation into cells occurred similarly after 30 min whether the cells were illuminated once or 60 times over the 30 min period. Even if one argues that a single illumination is sufficient to cause the internalization seen after a 30 min incubation period with the CPP, then the internalization should be the same whether the illumination is performed at 1 or 30 min. This is not what is observed: the internalization of the FITC-labeled CPP increases overtime independently of the number of times the cells are illuminated. The results correspond to three independent experiments.
Figure 1—figure supplement 4
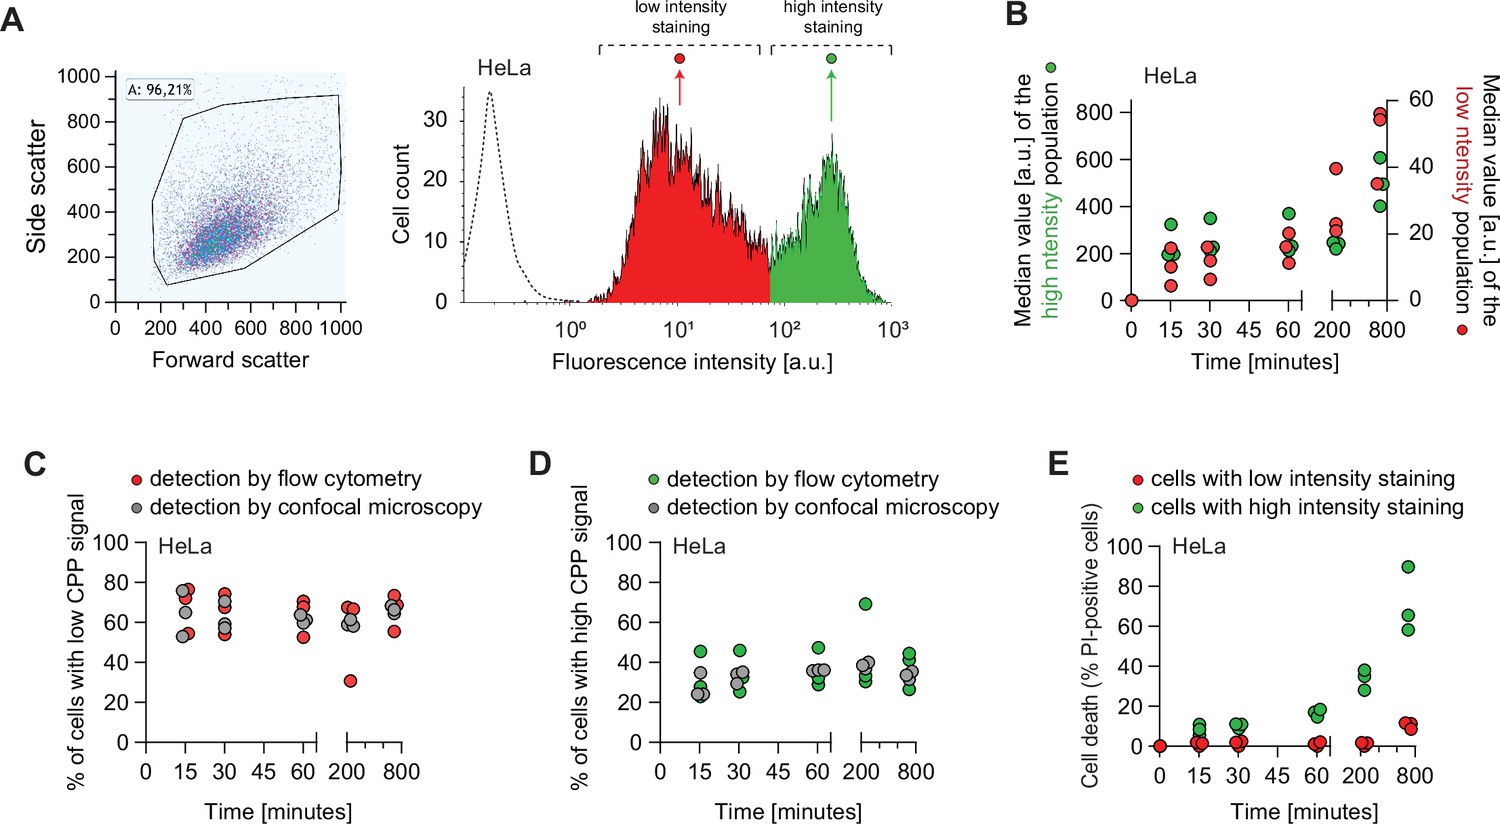
TAT-RasGAP317-326 enters cells via endocytosis and direct translocation, but only direct translocation mediates its biological activity.
(A–E) HeLa cells were incubated with 80 μM FITC-TAT-RasGAP317-326 in RPMI, 10% fetal bovine serum (FBS) for the indicated periods of time. Peptide internalization and cell death was assessed by flow cytometry. (A) Left: Representative flow cytometry dot plot showing the gating strategy used in flow cytometry experiments. Right: Representative flow cytometry histogram of HeLa cells incubated with FITC-TAT-RasGAP317-326 in RPMI, 10% FBS for 60 min. The dotted line represents cellular autofluorescence. (B) Variation over time of the low and high intensity peak values. Peptide internalization was assessed by flow cytometry. The results correspond to three independent experiments. Note the different scales used to plot the median values of the low and high intensity populations. (C) Quantitation of cells with low intensity peptide fluorescence and vesicular staining. Total peptide internalization was assessed by flow cytometry. The percentage of cells with low cell-penetrating peptide (CPP) cytosolic fluorescence was visually quantitated on confocal images (n = 164 cells per condition). The results correspond to three independent experiments. (D) Quantitation of the pattern of appearance of cells with high intensity peptide fluorescence and strong diffuse cytosolic staining. Data assessment as in panel C. The results correspond to three independent experiments. (E) Kinetics of FITC-TAT-RasGAP317-326-induced death in the two populations described in panel B. Cell death was assessed by propidium iodide (PI) staining. The results correspond to three independent experiments.
Figure 2 with 4 supplements
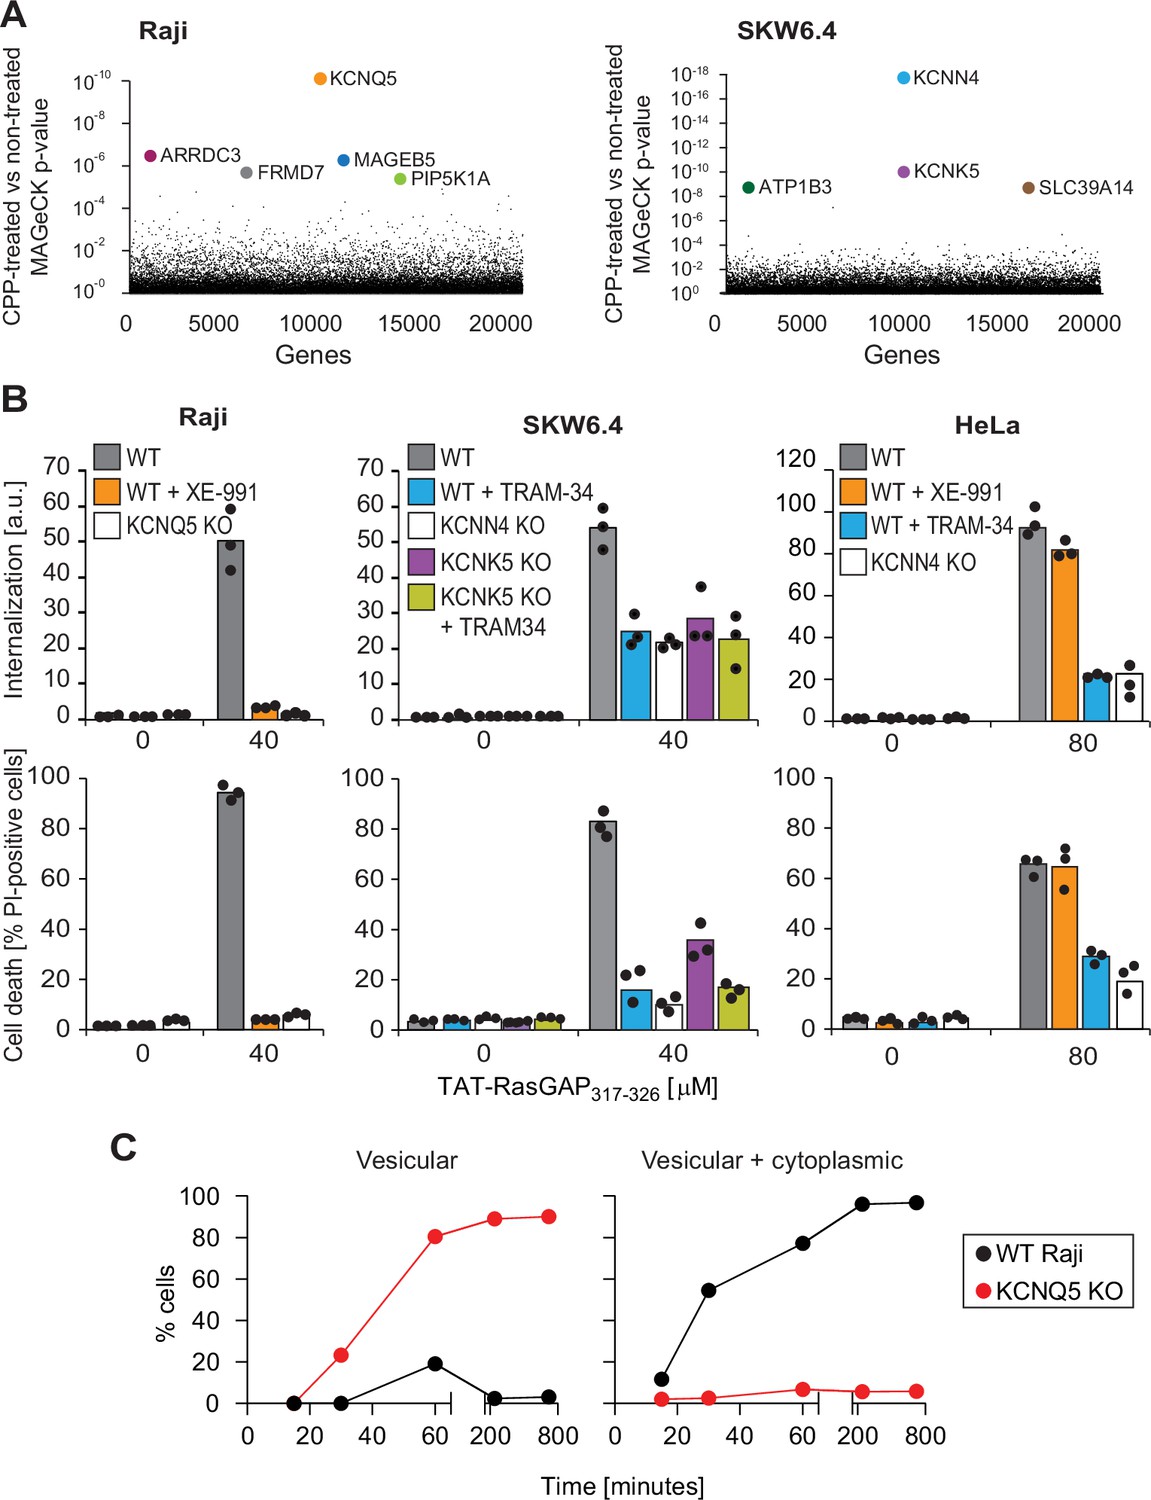
Identification of potassium channels as mediators of direct translocation of cell-penetrating peptides (CPPs) into cells.
(A) Identification of genes implicated in TAT-RasGAP317-326 internalization in Raji and SKW6.4 cells. The graphs depict the p-value (calculated using the MAGeCK procedure; see Materials and methods) for the difference in sgRNA expression between peptide-treated and control cells for the ~20,000 genes targeted by the CRISPR/Cas9 library. (B) Quantitation of TAT-RasGAP317-326 entry (top) and induced death (bottom) in wild-type (WT) and knock-out (KO) cells. The WT and the corresponding potassium channel KO versions of the indicated cell lines were pretreated or not for 30 min with 10 μM XE-991 or with TRAM-34 and then incubated (still in the presence of the inhibitors when initially added) with or without 40 μM (Raji and SKW6.4 cells) or 80 μM (HeLa cells) TAT-RasGAP317-326. Internalization was recorded after 1 hr and cell death after 16 hr (Raji and SKW6.4) or 24 hr (HeLa). Results correspond to the average of three independent experiments. TAT-RasGAP317-326 concentrations and time of incubation used were adjusted so that the CPP induced similar cell death (between 60% and 90%) in the WT versions of the different cell lines. (C) Quantitation of the modalities of TAT-RasGAP317-326 entry in WT and KCNQ5 KO Raji cells. Cells were incubated with FITC-TAT-RasGAP317-326 for various periods of time and peptide staining was visually quantitated on confocal images (n = 165 cells for each time-point). The high percentage of cells with vesicular staining in the KO cells results from the absence of strong diffuse staining masking endosomes. The results correspond to the average of three experiments.
Figure 2—figure supplement 1
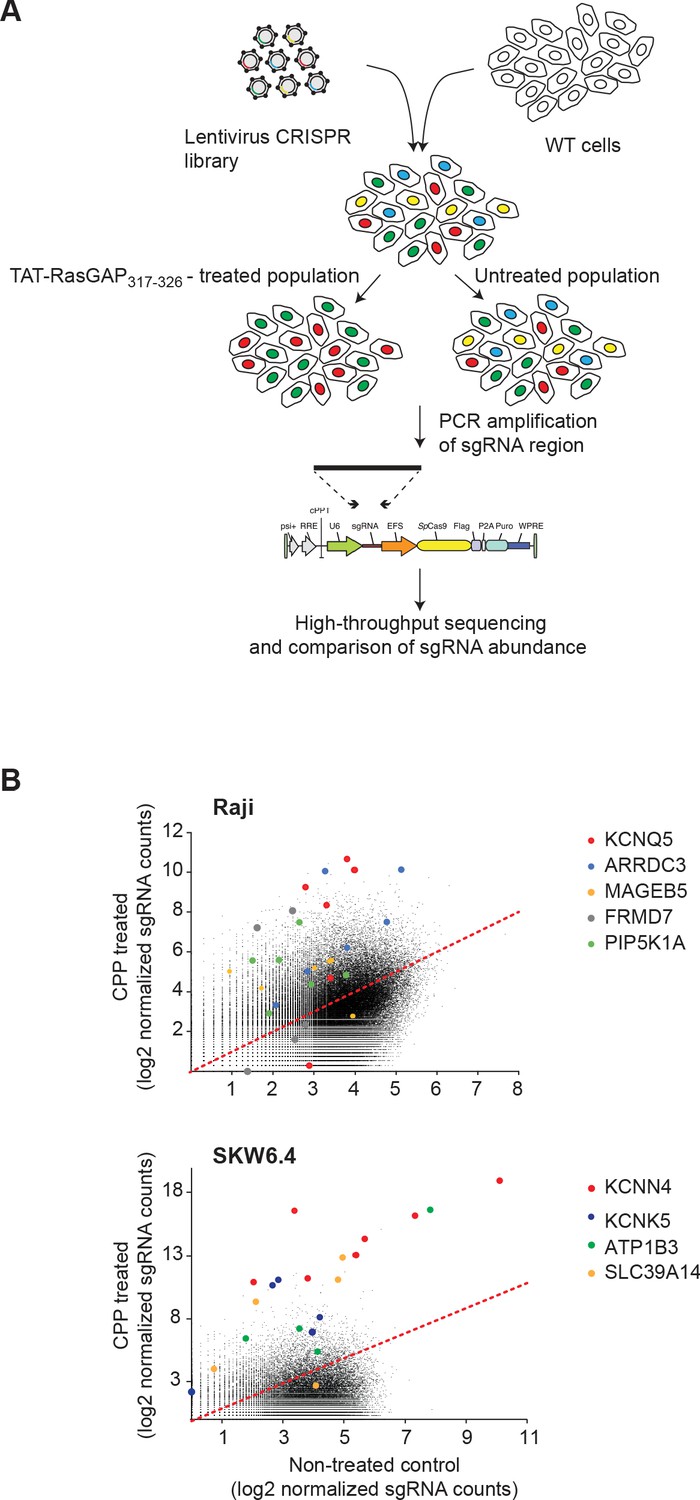
CRISPR/Cas9 screen and target gene identification.
(A) Scheme of the CRISPR/Cas9 screening strategy to identify genes involved in TAT-RasGAP317-326 cellular entry. Raji and SKW6.4 cells were infected with a single guide RNA (sgRNA) CRISPR/Cas9 lentiviral library in conditions favoring the expression of only one specific sgRNA per cell (which is indicated by differentially colored cells). The infected cells were then incubated with or without 40 μM TAT-RasGAP317-326 for 8 days (Raji) or 17 days (SKW6.4). The expression of sgRNAs in both populations was assessed by massive parallel sequencing to determine the enrichment or depletion in specific sgRNAs in the peptide-treated population. (B) Scatter-plot depicting the changes in sgRNA expression between the control and treated cell populations. The most significantly modulated sgRNA sets are color-coded.
Figure 2—figure supplement 2
Validation of the targets identified through the CRISPR/Cas9 screening.
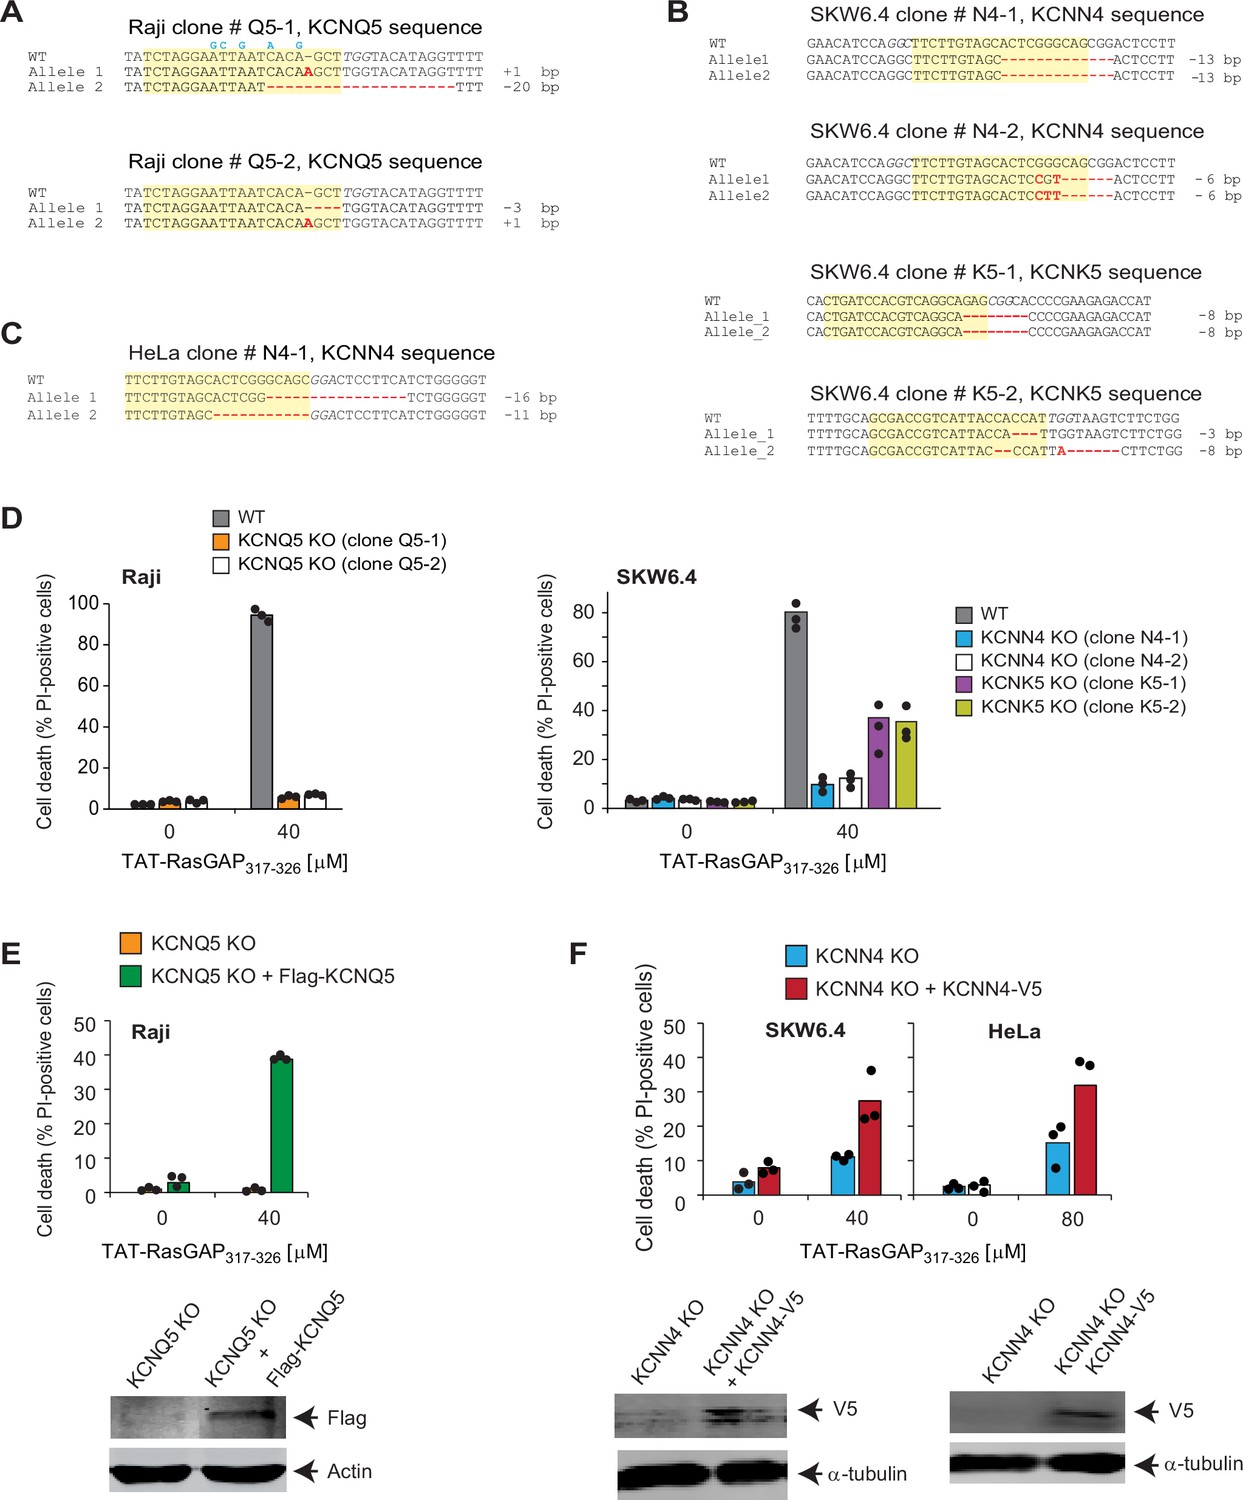
(A–C) Sequencing of the regions targeted by the single guide RNAs (sgRNAs) disrupting KCNQ5, KCNK5, and KCNN4 potassium channels in Raji (panel A), SKW6.4 (panel B), or HeLa cells (panel C). Mutations, insertions, and deletions induced by the CRISPR/Cas9 system are shown in red. Except the cases mentioned below, these mutations induce a frame shift and early termination of the open reading frame. The sequences targeted by the sgRNAs are highlighted in yellow. The sgRNA-induced mutations in the first allele of clone Q5-2, in the first allele of SKW6.4 cells clone N4-2, and in the first allele of clone K5-2 do not induce a frame shift but are located in critical domains necessary for potassium channel activity, such as the pore-forming region of KCNK5 (uniprot accession number: O95279), region adjacent to the pore of KCNQ5 (uniprot accession number: Q9NR82), or calcium recognition domain of KCNN4 (uniprot accession number: O15554). Hence, these alleles presumably encode non-functional channels. Clones Q5-1 in Raji, N4-1, and K5-1 in SKW6.4, and N4-1 in HeLa cells were those that were used in subsequent experiments. The blue nucleotides correspond to silent changes, aimed at reducing sgRNA targeting, introduced in the KCNQ5-encoding lentiviral vector used in panel E. PAM (protospacer adjacent motif) sequences are italicized. (D–F) The indicated wild-type (WT) and knock-out (KO) cells, infected or not with sgRNA-resistant FLAG-KCNQ5-encoding lentiviruses or KCNN4-expressing lentiviruses, were tested for their ability to be killed by TAT-RasGAP317-326. Cell death was assessed by flow cytometry of propidium iodide (PI)-stained cells after 16 hr (Raji and SKW6.4 cells) or 24 hr (HeLa cells). The results correspond to the average of three independent experiments. Expression of the FLAG-KCNQ5 and KCNN4-V5 constructs was detected by Western blotting using an anti-FLAG antibody and an anti-V5 antibody, respectively. Note that the Raji, SKW6.4, and HeLa KO cell lines still express Cas9 and the sgRNAs targeting the potassium channels. Hence, the ectopically expressed WT potassium channel-encoding cDNAs can be targeted by the CRISPR/Cas9 system but this nevertheless allows for a detectable expression of the FLAG- or V5-tagged constructs although to much lower levels than in similarly infected WT cells lacking Cas9 and sgRNAs (Figure 2—figure supplement 2—source data 1; compare last two lanes). In Raji cells, the re-expressed KCNQ5 channel contained five silent changes in the sgRNA recognition site (see panel A) but this proved insufficient to allow for a strong ectopic expression (compare lanes 2 and 4 in Figure 2—figure supplement 2—source data 3; Figure 2—figure supplement 2—source data 5).
-
Figure 2—figure supplement 2—source data 1
Uncropped blot and original full raw unedited blot corresponding to the anti-FLAG blot shown in Figure 2—figure supplement 2E.
- https://cdn.elifesciences.org/articles/69832/elife-69832-fig2-figsupp2-data1-v2.ai
-
Figure 2—figure supplement 2—source data 2
Uncropped blot and original full raw unedited blot corresponding to the anti-actin blot shown in Figure 2—figure supplement 2E.
- https://cdn.elifesciences.org/articles/69832/elife-69832-fig2-figsupp2-data2-v2.ai
-
Figure 2—figure supplement 2—source data 3
Uncropped blot and original full raw unedited blot corresponding to the anti-V5 blot shown in Figure 2—figure supplement 2F (left-hand side).
- https://cdn.elifesciences.org/articles/69832/elife-69832-fig2-figsupp2-data3-v2.ai
-
Figure 2—figure supplement 2—source data 4
Uncropped blot and original full raw unedited blot corresponding to the anti-α-tubulin blot shown in Figure 2—figure supplement 2F (left-hand side).
- https://cdn.elifesciences.org/articles/69832/elife-69832-fig2-figsupp2-data4-v2.ai
-
Figure 2—figure supplement 2—source data 5
Uncropped blot and original full raw unedited blot corresponding to the anti-V5 blot shown in Figure 2—figure supplement 2F (right-hand side).
- https://cdn.elifesciences.org/articles/69832/elife-69832-fig2-figsupp2-data5-v2.ai
-
Figure 2—figure supplement 2—source data 6
Uncropped blot and original full raw unedited blot corresponding to the anti-tubulin blot shown in Figure 2—figure supplement 2F (right-hand side).
- https://cdn.elifesciences.org/articles/69832/elife-69832-fig2-figsupp2-data6-v2.ai
Figure 2—figure supplement 3
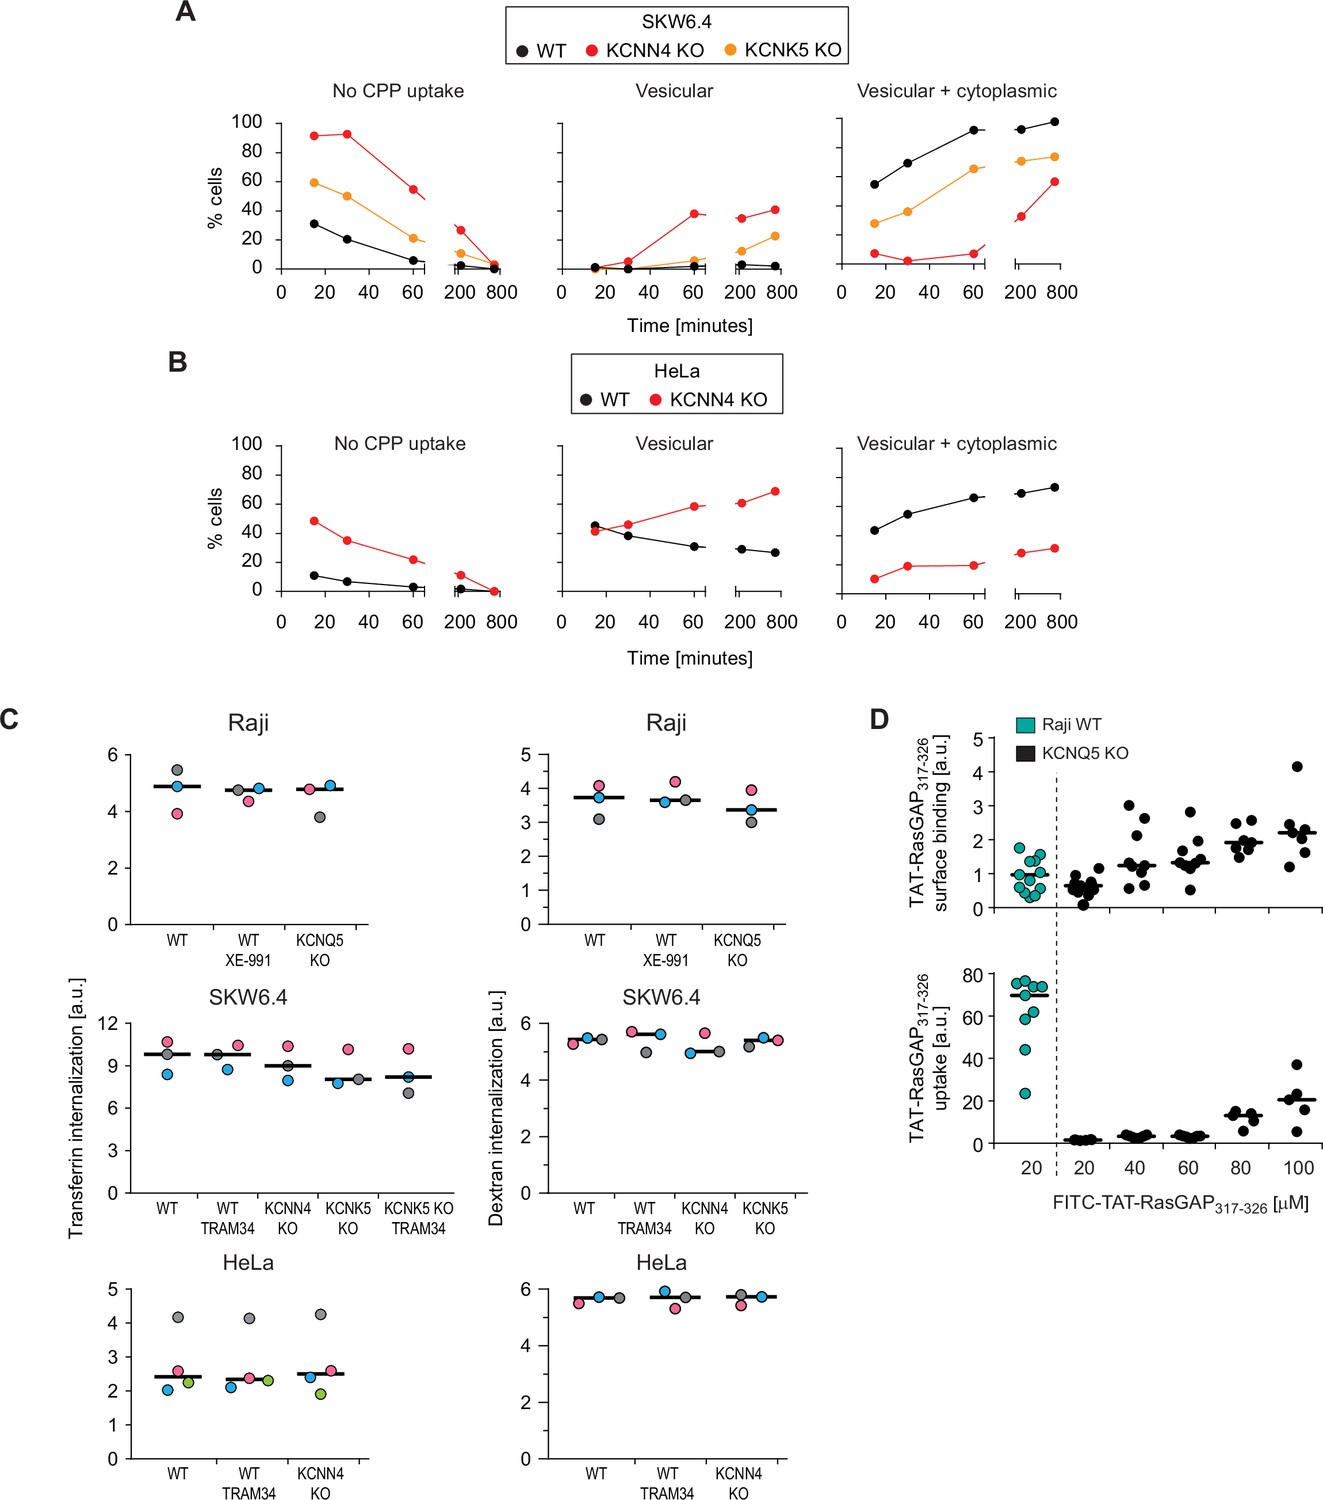
Potassium channels modulate direct cell-penetrating peptide (CPP) translocation, but not endocytosis.
(A) Same as Figure 2C, but for wild-type (WT), KCNN4 and KCNK5 SKW6.4 knock-out (KO) cells. The results correspond to the average of three independent experiments. (B) As panel A, but for WT and KCNN4 KO HeLa cells. The results correspond to the average of three independent experiments. (C) Quantitation by flow cytometry of 20 μg/ml AlexaFluor488-transferrin (left) or 200 μg/ml 10 kDa FITC-Dextran (right) internalization in the indicated WT cell lines and their corresponding KO versions, pretreated or not for 30 min with the XE-991 (10 μM) or TRAM-34 (10 μM) potassium channel inhibitors. Transferrin and dextran internalization was allowed to proceed for 60 min (still in the presence of inhibitors when these were used in the 30 min pre-incubation period). To quench membrane-bound fluorescence, cells were incubated with 0.2% trypan blue prior to flow cytometry analysis. The independent experiment replicates are color-coded. (D) Assessment of FITC-TAT-RasGAP317-326 cell surface binding on WT and KCNQ5 KO Raji cells after 60 s of incubation (top), as well as associated peptide internalization after 1 hr of treatment (bottom). The results correspond to at least five independent experiments.
Figure 2—figure supplement 4
Potassium channels regulate the cellular internalization of various TAT-bound cargos.
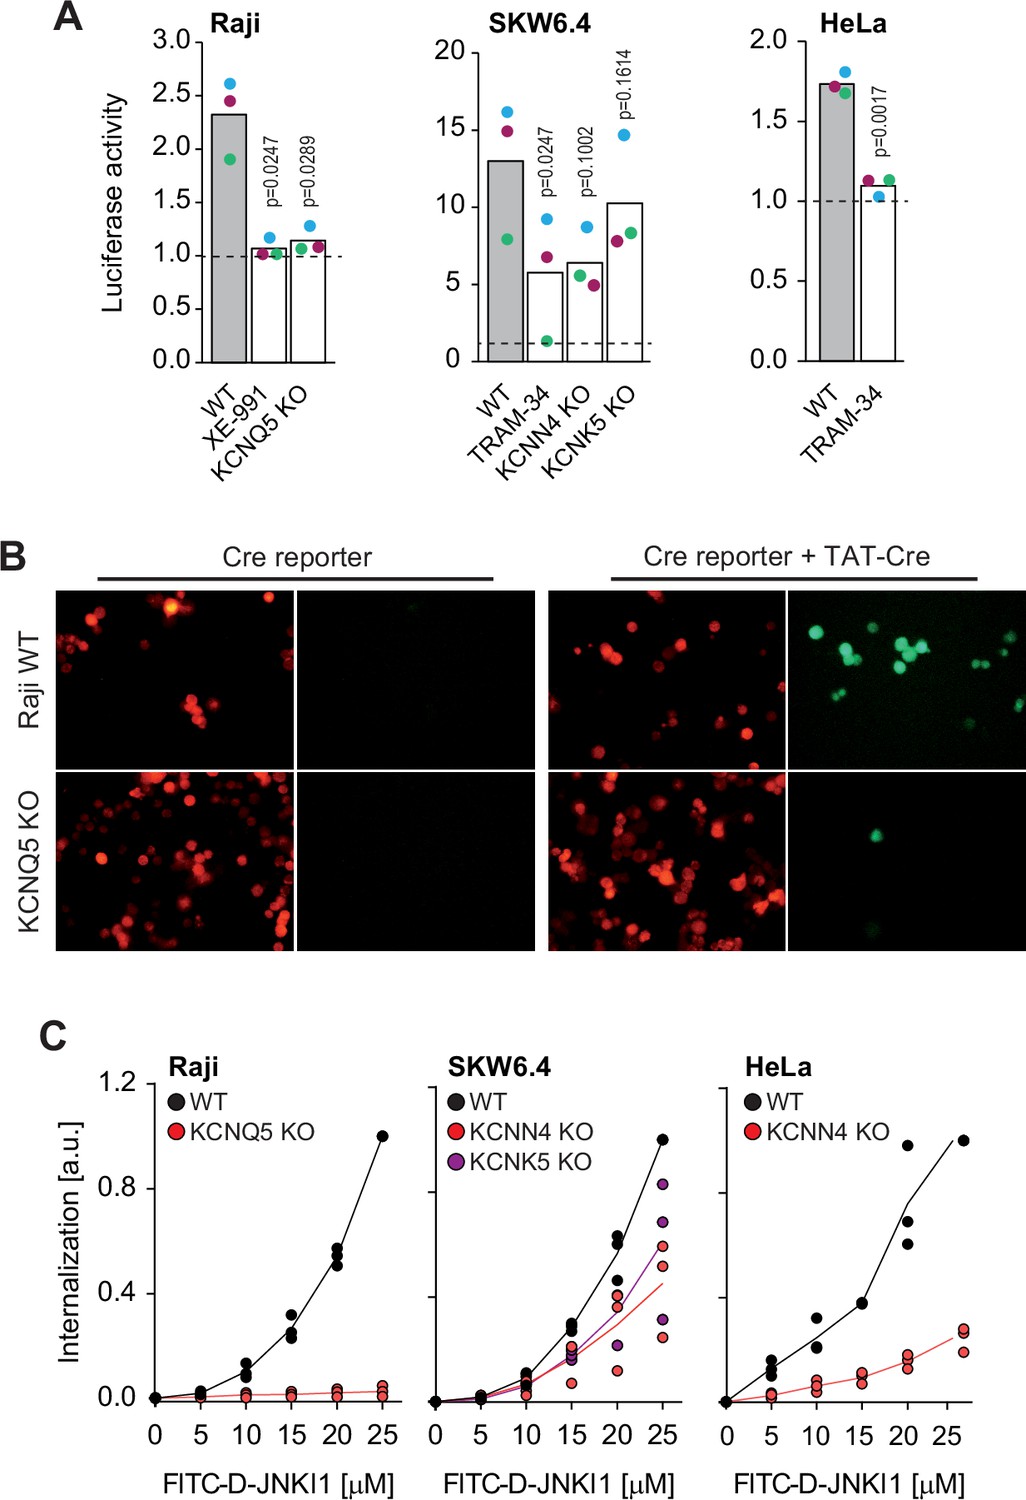
(A) TAT-PNA-induced luciferase activity in the indicated cell lines pretreated or not with potassium channel inhibitors (XE-991 or TRAM-34) or genetically invalidated for specific potassium channels. Results are normalized to non-stimulated cells (dashed lines). The independent experiment replicates are color-coded. The p-values correspond to the assessment of the significance of the differences with the control wild-type (WT) condition using ANOVA multiple comparison analysis with Dunnett’s correction. (B) Representative microscopy images of WT and KCNQ5 knock-out (KO) Raji cells expressing loxP-RFP-STOP-loxP-GFP and treated or not with 20 μM TAT-Cre for 48 hr. The results correspond to one of three independent experiments. (C) Internalization, recorded by flow cytometry, of FITC-D-JNKI1 after 1 hr of incubation in the indicated cell lines genetically invalidated (KO) or not (WT) for specific potassium channels. The results correspond to the median of three independent experiments.
Figure 3 with 5 supplements
Potassium channels maintain plasma membrane polarization that is required for cell-penetrating peptide (CPP) entry into cells.
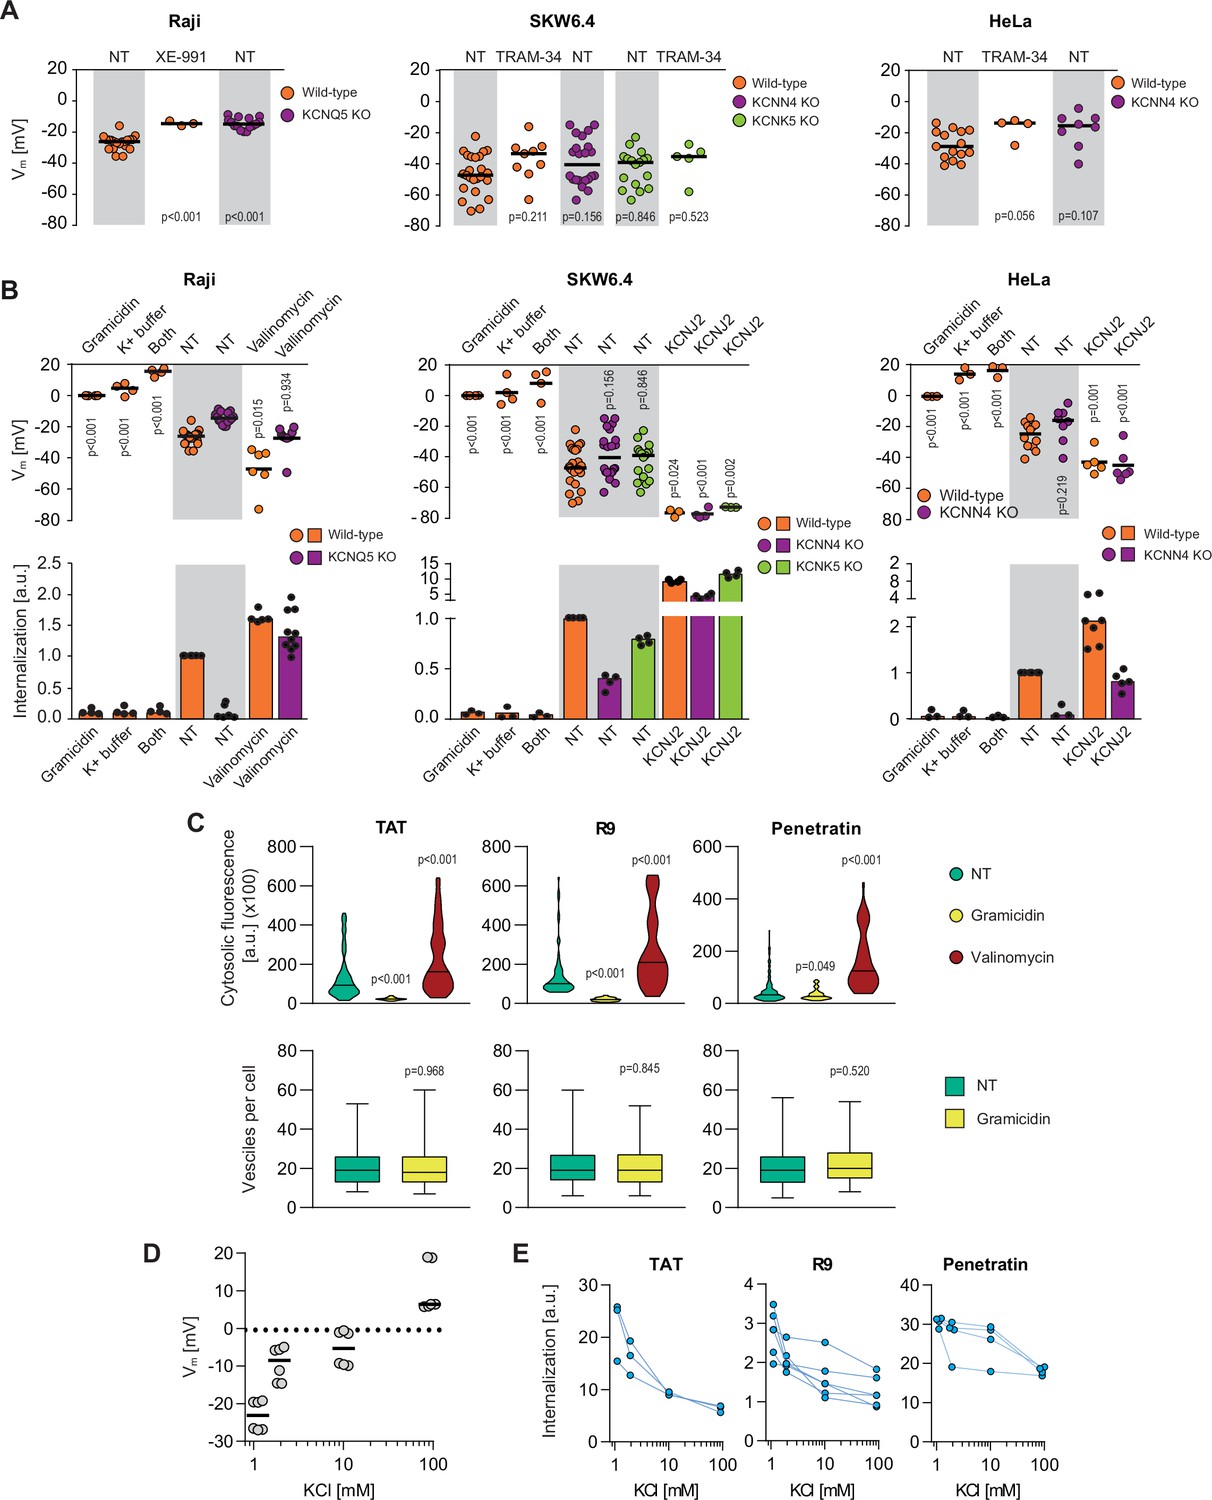
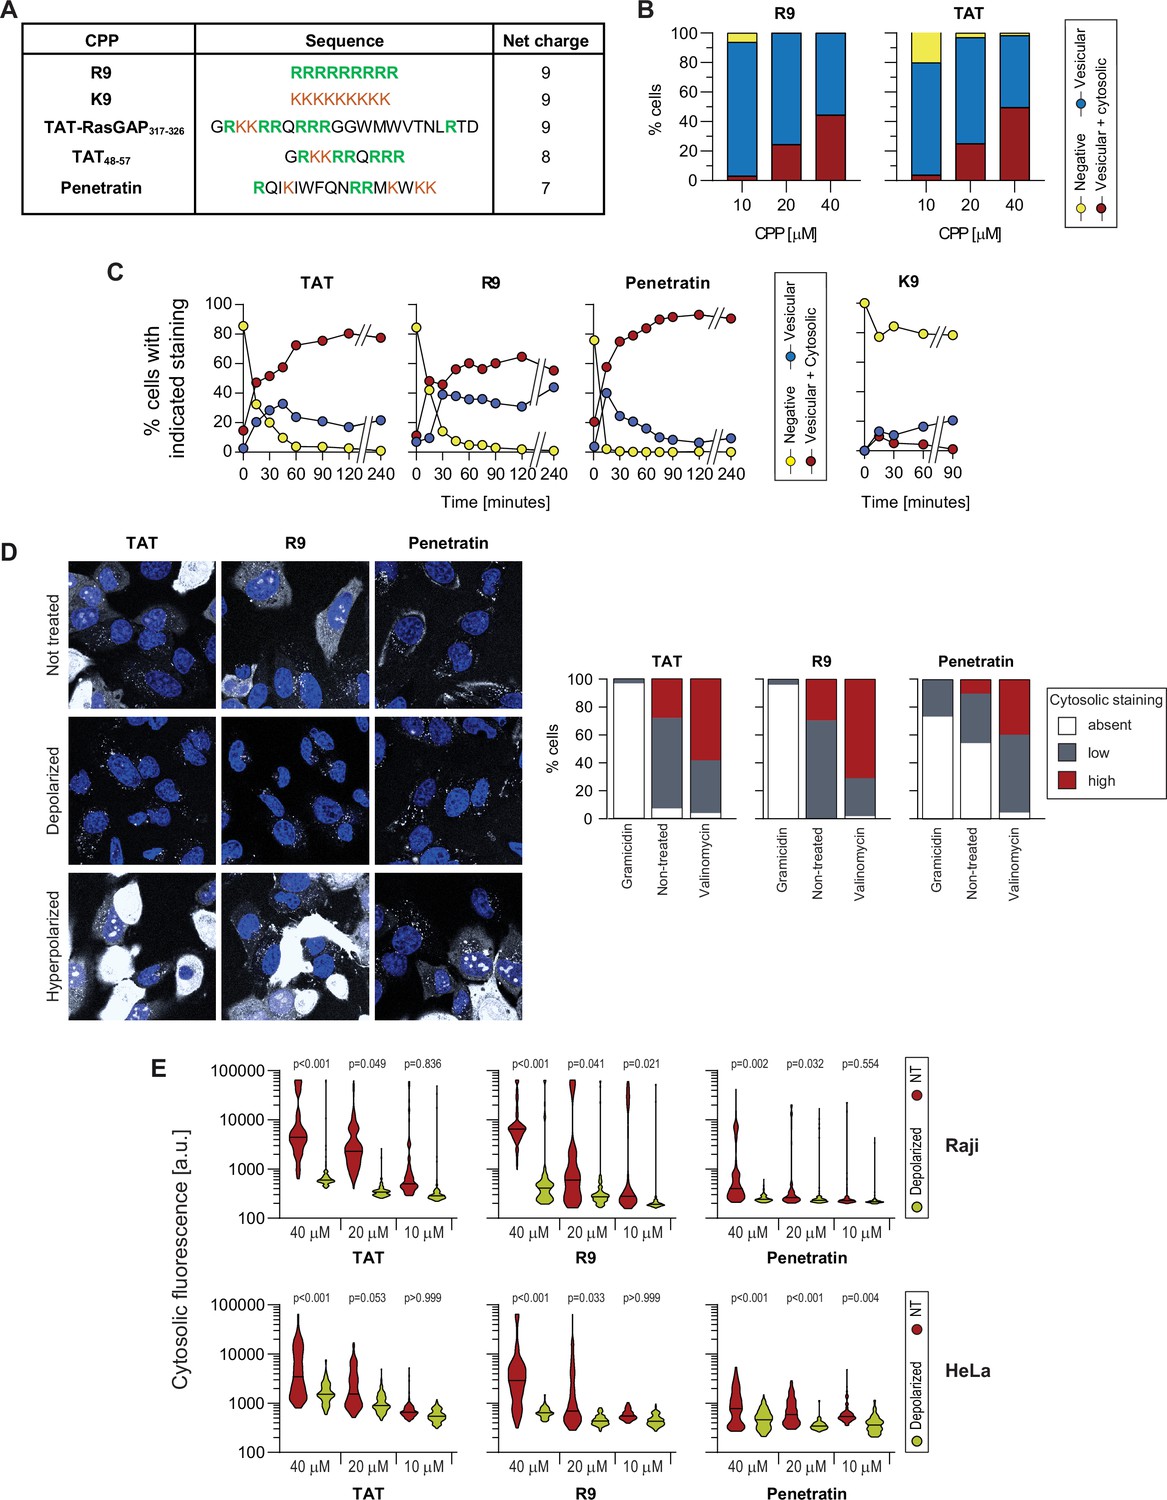
(A) Assessment of the resting plasma membrane potential in the indicated wild-type cell lines and the corresponding potassium channel knock-out (KO) clones in the presence or in the absence 10 μM XE-991 or TRAM-34. The gray and white zones correspond to non-treated cells and inhibitor-treated cells, respectively. NT, not treated. The p-values correspond to the assessment of the significance of the differences with the control wild-type condition using ANOVA multiple comparison analysis with Dunnett’s correction. Each dot in a given condition represents an independent experiment. (B) Effect of cellular depolarization (left of the gray zone) and hyperpolarization (right of the gray zone) on peptide internalization in the absence of serum. The indicated cell lines and the corresponding channel KO clones were pretreated or not with depolarization agents (2 μg/ml gramicidin for 5 min or high extracellular potassium buffer for 30 min) or with hyperpolarization inducer (10 μM valinomycin), followed by the addition of TAT-RasGAP317-326 for 1 hr. Alternatively, hyperpolarization was achieved by ectopic expression of the KCNJ2 potassium channel. Membrane potential and peptide internalization were then determined. Membrane potential was measured in the presence of DiBac4(3) by flow cytometry. Peptide internalization was measured by flow cytometry in the presence of 0.2% trypan blue. The p-values correspond to the assessment of the significance of the differences with the control wild-type condition using ANOVA multiple comparison analysis with Dunnett’s correction. Each dot in a given condition represents an independent experiment. Treatment with valinomycin was used in the absence of serum as the latter is expected to interfere with the drug (Rimmele and Chatton, 2014). As shown in Figure 3—figure supplement 5A, removing serum from the culture medium sensitized cells to TAT-RasGAP317-326 and consequently, the CPP concentration had to be adapted accordingly (Figure 3—figure supplement 5B). Serum withdrawal does not affect the Vm (Figure 3—figure supplement 5C). (C) Quantitation of cytosolic CPP signal (top) and the number of endocytic vesicles per cell (bottom) in wild-type HeLa cells (n = 158 cells) incubated for 1 hr with 10 μM FITC-CPP in control, depolarizing (2 μg/ml gramicidin), or hyperpolarizing (10 μM valinomycin) conditions in the absence of serum based on confocal microscopy images (Figure 3—figure supplement 2D). Comparison between different conditions to non-treated control was done using ANOVA test with Dunnett’s correction for multiple comparison. The number of endocytic vesicles per cell was quantitated based on confocal images. Statistical comparison was done using t-tests. Quantitation of vesicles was not performed in hyperpolarizing conditions due to masking from strong cytosolic signal. (D) Modulation of the Vm membrane potential by varying extracellular potassium concentrations. Assessment of membrane potential changes in Raji cells incubated in RPMI medium containing the indicated concentrations of potassium chloride (isotonicity was maintained by adapting the sodium chloride concentrations; see Materials and methods). Membrane potential was measured with DiBac4(3). The results correspond to the median of six independent experiments. (E) Internalization of various CPPs in the presence of different concentrations of potassium chloride in the media. Data for a given experiment are linked with thin blue lines.
Figure 3—figure supplement 1

Importance of the Vm for TAT-RasGAP317-326 direct translocation.
(A) Membrane potential measurement validation. Membrane potential of wild-type and KCNQ5 knock-out (KO) Raji cells was measured using DiBac4(3), a fluorescent membrane potential sensor, or by performing perforated patch electrophysiology recordings. Each dot in the figures reporting DiBac4(3) measurements corresponds to the median of 10,000 cells recording. For perforated patch, each dot in the figures corresponds to the membrane potential of one cell. (B) Representative confocal images of wild-type HeLa cells incubated with 80 μM FITC-TAT-RasGAP317-326 for 1 hr in the presence (depolarized) or in the absence (not treated) of 2 μg/ml gramicidin. Scale bar: 10 μm. (C) Effect of ectopic expression of the CRISPR/Cas9-identified potassium channels in wild-type cells and the corresponding KOs (right of the gray zone) on the cell membrane potential and FITC-TAT-RasGAP317-326 internalization in the absence of serum. Cells were incubated with TAT-RasGAP317-326 for 1 hr. Membrane potential was measured using DiBac4(3) by flow cytometry. Peptide internalization was measured by flow cytometry in the presence of 0.2% trypan blue. The p-values correspond to the assessment of the significance of the differences with the control wild-type condition using ANOVA multiple comparison analysis with Dunnett’s correction. (D) Representative confocal images of primary rat cortical neurons (left) and wild-type HeLa cells (right) incubated for 1 hr at 37°C with FITC-TAT-RasGAP317-326 in the absence of serum. To highlight the differential capacity of these cells to take up the CPP in cytosol, a low concentration of TAT-RasGAP317-326 (2 μM) was used here. At higher concentrations, this CPP readily enters HeLa cells (see panel B). Post-incubation cells were washed and imaged with a confocal microscope using the same laser settings for both cell types. Nuclei of HeLa cells were labeled with Hoechst (blue staining). Scale bar: 20 μm.
Figure 3—figure supplement 2
Importance of the Vm for the direct translocation of several cationic cell-penetrating peptides (CPPs).
(A) Sequences of the indicated CPPs and their net charge. Positively charged amino acids (arginine and lysine) are color-coded. (B) Confocal microscopy quantitation of HeLa cells displaying the indicated types of CPP internalization at various concentrations after 30 min of incubation. The results correspond to the average of three independent experiments. We did not observe cells with only cytosolic fluorescence (i.e. without fluorescent endosomes). (C) Confocal microscopy quantitation of HeLa cells displaying the indicated types of CPP internalization. The CPPs (40 μM) were continuously present in the media during the course of the experiment. The results correspond to the average of three independent experiments. (D) Left: Representative confocal images of wild-type HeLa cells incubated with 10 μM of the indicated CPP in the absence of serum in physiological, depolarized (2 μg/ml gramicidin) or hyperpolarized (10 μM valinomycin) conditions. Right: Quantitation of the cell percentage with the indicated FITC-CPP cytosolic signal intensity in depolarized, non-treated, and hyperpolarized conditions. Refer to Figure 3C for the corresponding quantitation of cytosolic fluorescence intensity and number of CPP-positive endocytic vesicles per cell. Scale bar: 10 μm.
Figure 3—figure supplement 3

Effect of Vm modulation on TAT-RasGAP317-326 translocation in primary neuronal cells.
Assessment of membrane potential (top) and FITC-TAT-RasGAP317-326 (2 μM) cytosolic uptake after 1 hr (bottom) in control, depolarized, and hyperpolarized primary rat cortical neurons. Depolarization was induced by 30 min pre-incubation with 5 mM tetraethylammonium (TEA), a potassium channel blocker and hyperpolarization was induced by 30 min pre-incubation with 10 μM valinomycin. The membrane potential modulators were present throughout the experiment. Membrane potential measurements were performed with DiBac(4)3 (see Materials and methods section). The results correspond to the median of at least three independent experiments based on confocal images (n = 111 cells).
Figure 3—figure supplement 4

Cell-penetrating peptide (CPP) binding to cells is not affected by depolarization.
Assessment of FITC-CPP binding to cellular membranes of wild-type Raji cells in normal or depolarized conditions after 60 s of incubation (top), as well as associated peptide internalization after 1 hr of treatment (bottom). Cells were pre-incubated for 30 min in the presence of RPMI containing 5.2 or 91.9 mM potassium chloride and then treated with 40 μM of the indicated CPPs. The results correspond to at least six independent experiments. Comparison between non-treated or depolarized conditions was done using two-tailed paired t-test.
Figure 3—figure supplement 5
Effect of serum on the sensitivity to TAT-RasGAP317-326 and cell-penetrating peptide (CPP) internalization.
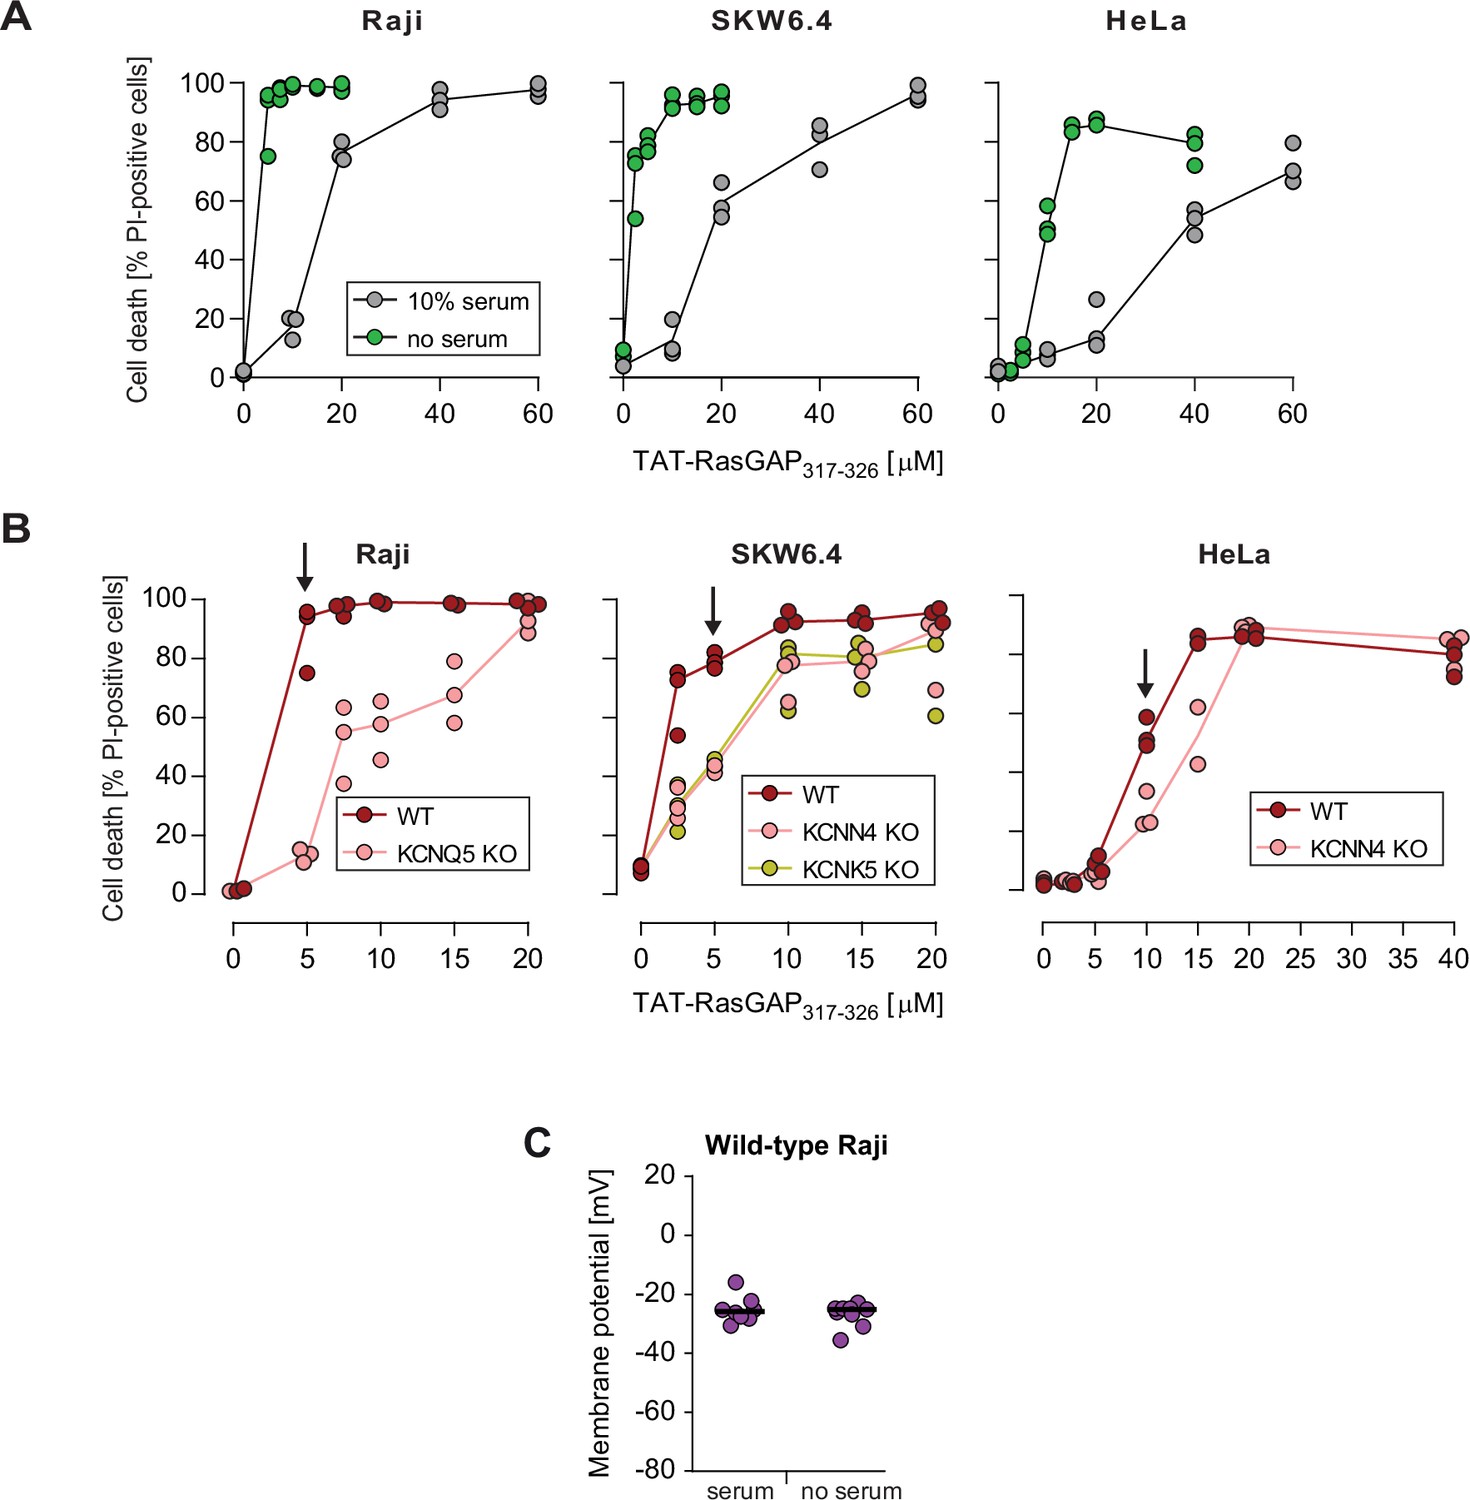
(A) Quantitation of TAT-RasGAP317-326-induced death in Raji, SKW6.4, and HeLa cells in the presence or in the absence of serum. The results correspond to the median of three independent experiments. This panel shows that serum removal sensitizes cells to TAT-RasGAP317-326. This is in line with previous observations that cationic CPPs interact with proteins present in serum (Kosuge et al., 2008; Ziegler et al., 2005), which results in lower CPP availability in the media. (B) Quantitation of wild-type (WT) and knock-out (KO) cell death after incubation for 16 hr (Raji and SKW6.4) or 24 hr (HeLa) in serum-free RPMI media in the presence of increasing concentrations of TAT-RasGAP317-326. Arrows indicate the chosen peptide concentrations for experiments performed in the absence of serum. The results correspond to the median of three independent experiments. Cytosolic internalization results were very similar between the experiments performed in the presence or in the absence of serum, once the CPP concentrations were adjusted (Figure 3C and Figure 3—figure supplement 2E). (C) Membrane potential measurement in wild-type Raji cells performed in the presence or in the absence of 10% serum. Membrane potential was assessed using DiBac4(3).
Figure 4 with 1 supplement
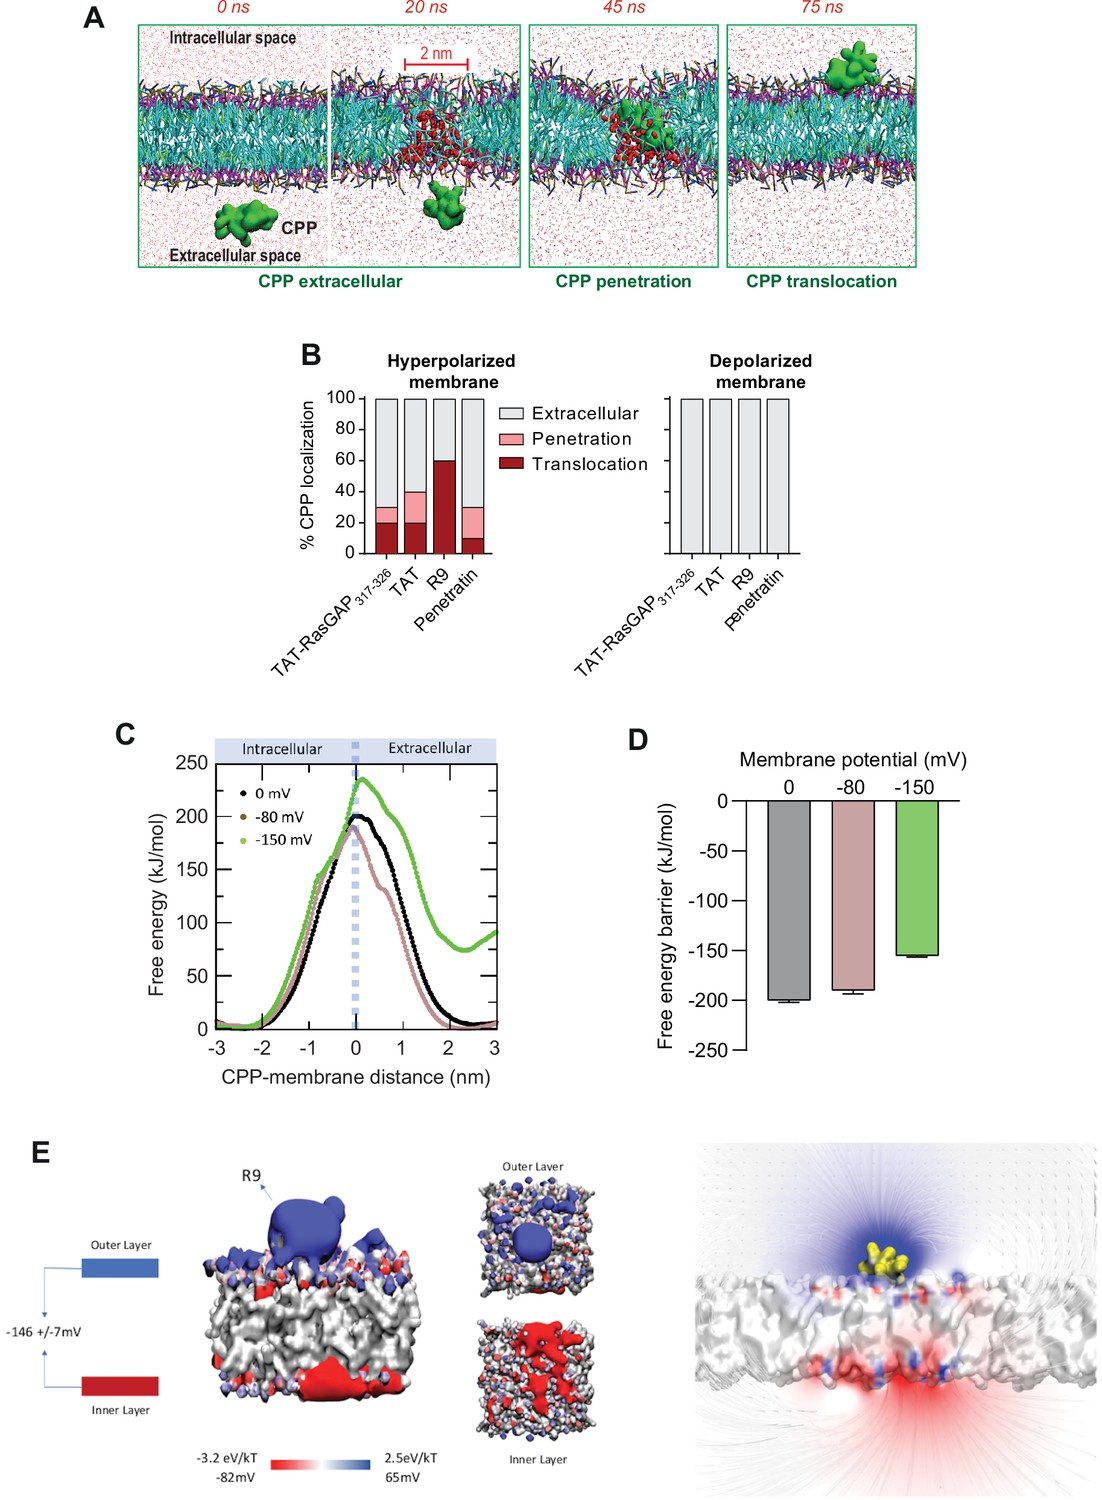
Hyperpolarization favors the formation of ~2-nm-wide water pores used by cell-penetrating peptides (CPPs) to translocate into cells.
(A) Visualization of in silico modeled, time-dependent, TAT-RasGAP317-326 penetration and subsequent translocation across cellular membrane through a water pore. Water molecules within membranes are depicted by red spheres (and by red dots outside the membrane). (B) Quantitation of CPP localization in hyperpolarized or depolarized conditions based on coarse-grained molecular dynamics simulations. Membrane hyperpolarization was achieved through a net charge difference of 30 positive ions between intracellular and extracellular space in a double-bilayer system (D’Astolfo et al., 2015, Kang et al., 1998; Kauffman et al., 2018; Kelkar and Chattopadhyay, 2007; Khalil et al., 2018) obtaining a transmembrane potential of –2.2 V. Such low membrane potential was required to visualize translocation within the time frame of the simulations (100 ns). (C) Free energy landscape of R9 translocation reported as a function of CPP-membrane distance. The metadynamics simulations were performed at transmembrane potential values of 0, –80, and –150 mV (black, brown, and green curves). (D) Free energy barrier for CPP translocation at different transmembrane potential values. (E) Electrostatic potential map of a molecular system containing one R9 peptide in contact with the cell membrane, without any applied external electrostatic field.
Figure 4—figure supplement 1
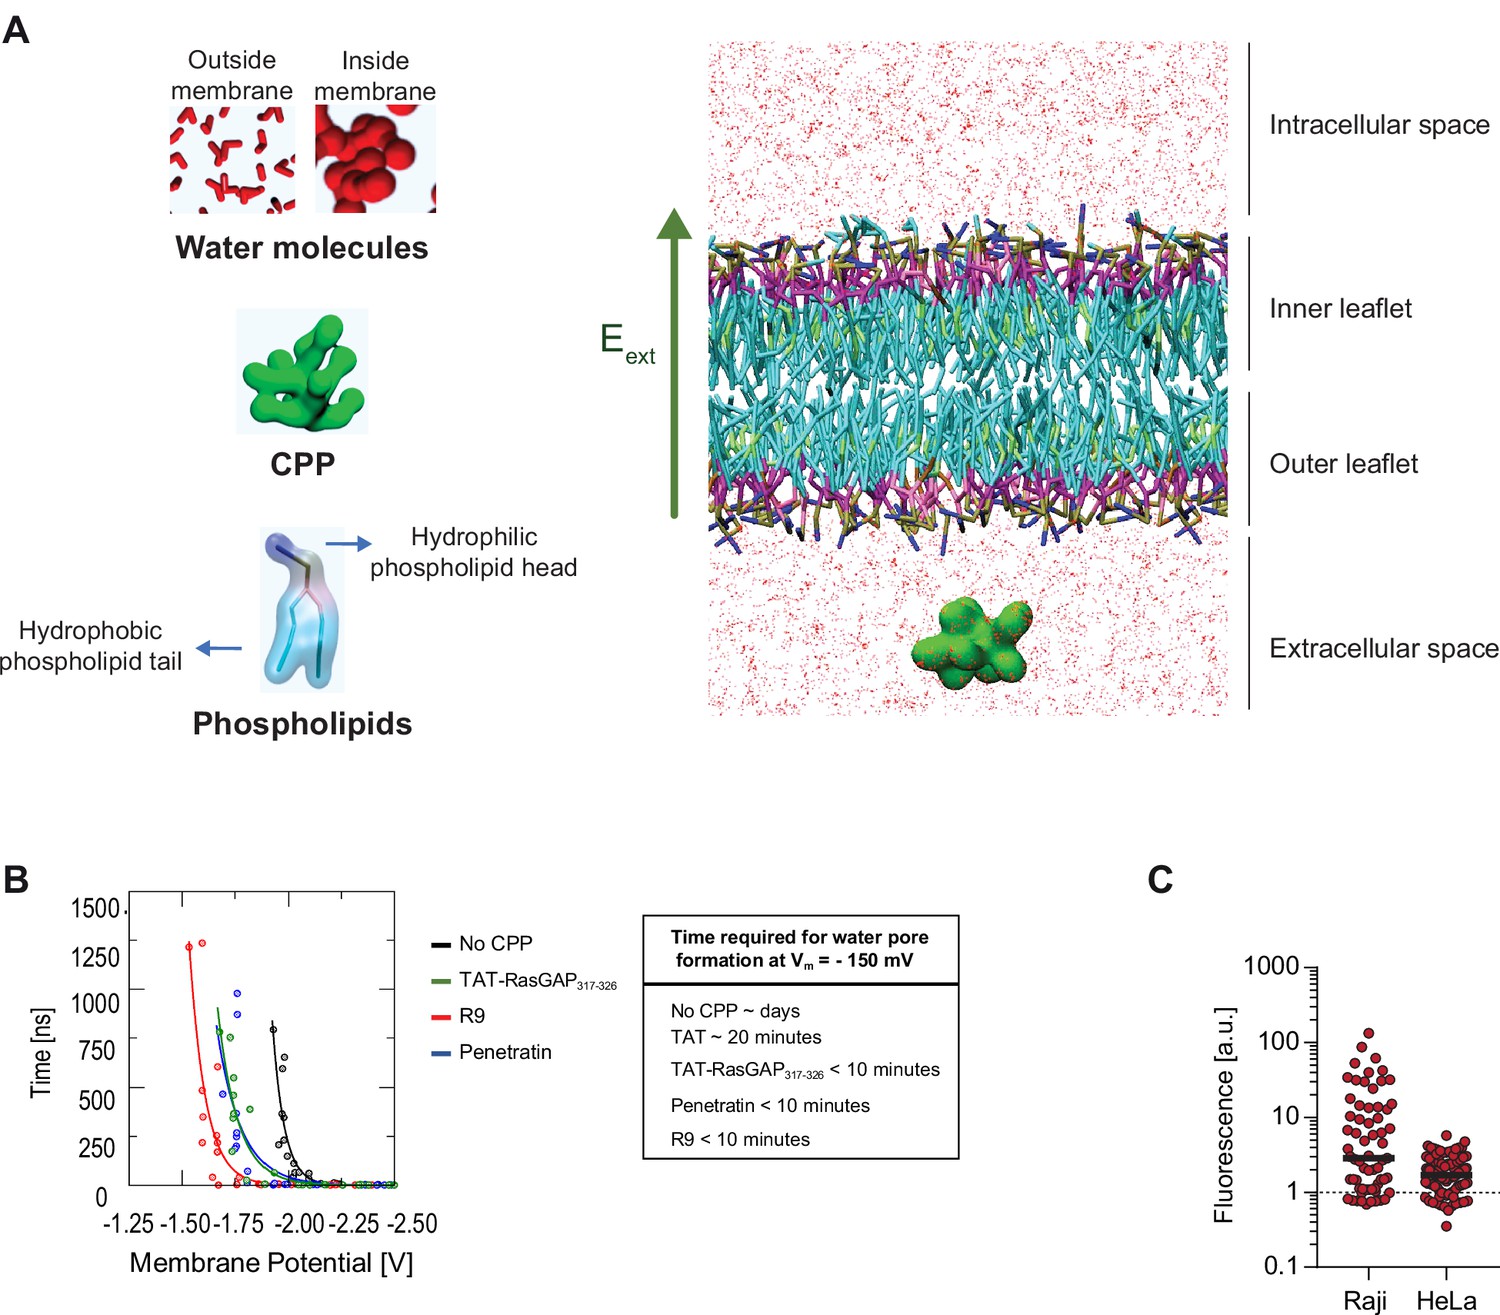
In silico modeling of cell-penetrating peptide (CPP) direct translocation.
(A) Schematic depiction of the molecular system used to estimate water pore formation kinetics. The static electric field (Eext) has been highlighted with a green arrow. Water molecules are shown as red structures (small when outside membranes and large when found within membranes). (B) Assessment of the time necessary for water pore formation in the presence or in the absence of the indicated CPPs at 37°C based on in silico pore formation kinetics experiments. To estimate the time needed for CPPs to translocate through membranes at –150 mV, we established the relationship (see fitting function below) between the time of CPP translocation and the Vm in the volt range used during the simulation runs and extrapolated from this relationship the time needed for CPP translocation at a Vm of –150 mV. Even though this extrapolation is likely to lack accuracy because of the well-known limitation of the MARTINI force field in describing the absolute kinetics of the molecular events, the values obtained are consistent with the kinetics of CPP direct translocation observed in living cells (Figures 1B and 2C and Figure 3—figure supplement 2C). Fitting function: t=A0*e(A1*V), where t is the simulation time of water pore formation, V is the transmembrane potential, A0 and A1 the fitting coefficients. The Pearson correlation coefficients of the fitting curves are RR9 = 0.85, RPenetratin = 0.95, RTATRasGAP = 0.91, and RNoCPP = 0.87. (C) Cells can concentrate CPPs in their cytosol. Wild-type Raji and HeLa cells were incubated with 40 μM FITC-TAT-RasGAP317-326 for 1 hr at 37°C in RPMI, 10% fetal bovine serum (FBS). Images were acquired with a confocal microscope. TAT-RasGAP317-326 fluorescence quantitation was performed using ImageJ using region of interest within the cytosol of cells that had acquired the peptide through direct translocation. The dotted line represents the fluorescence in the cell culture media (i.e. outside of the cells).
Figure 5 with 2 supplements
Estimation of the size of the pore used by cell-penetrating peptides (CPPs) to enter cells.
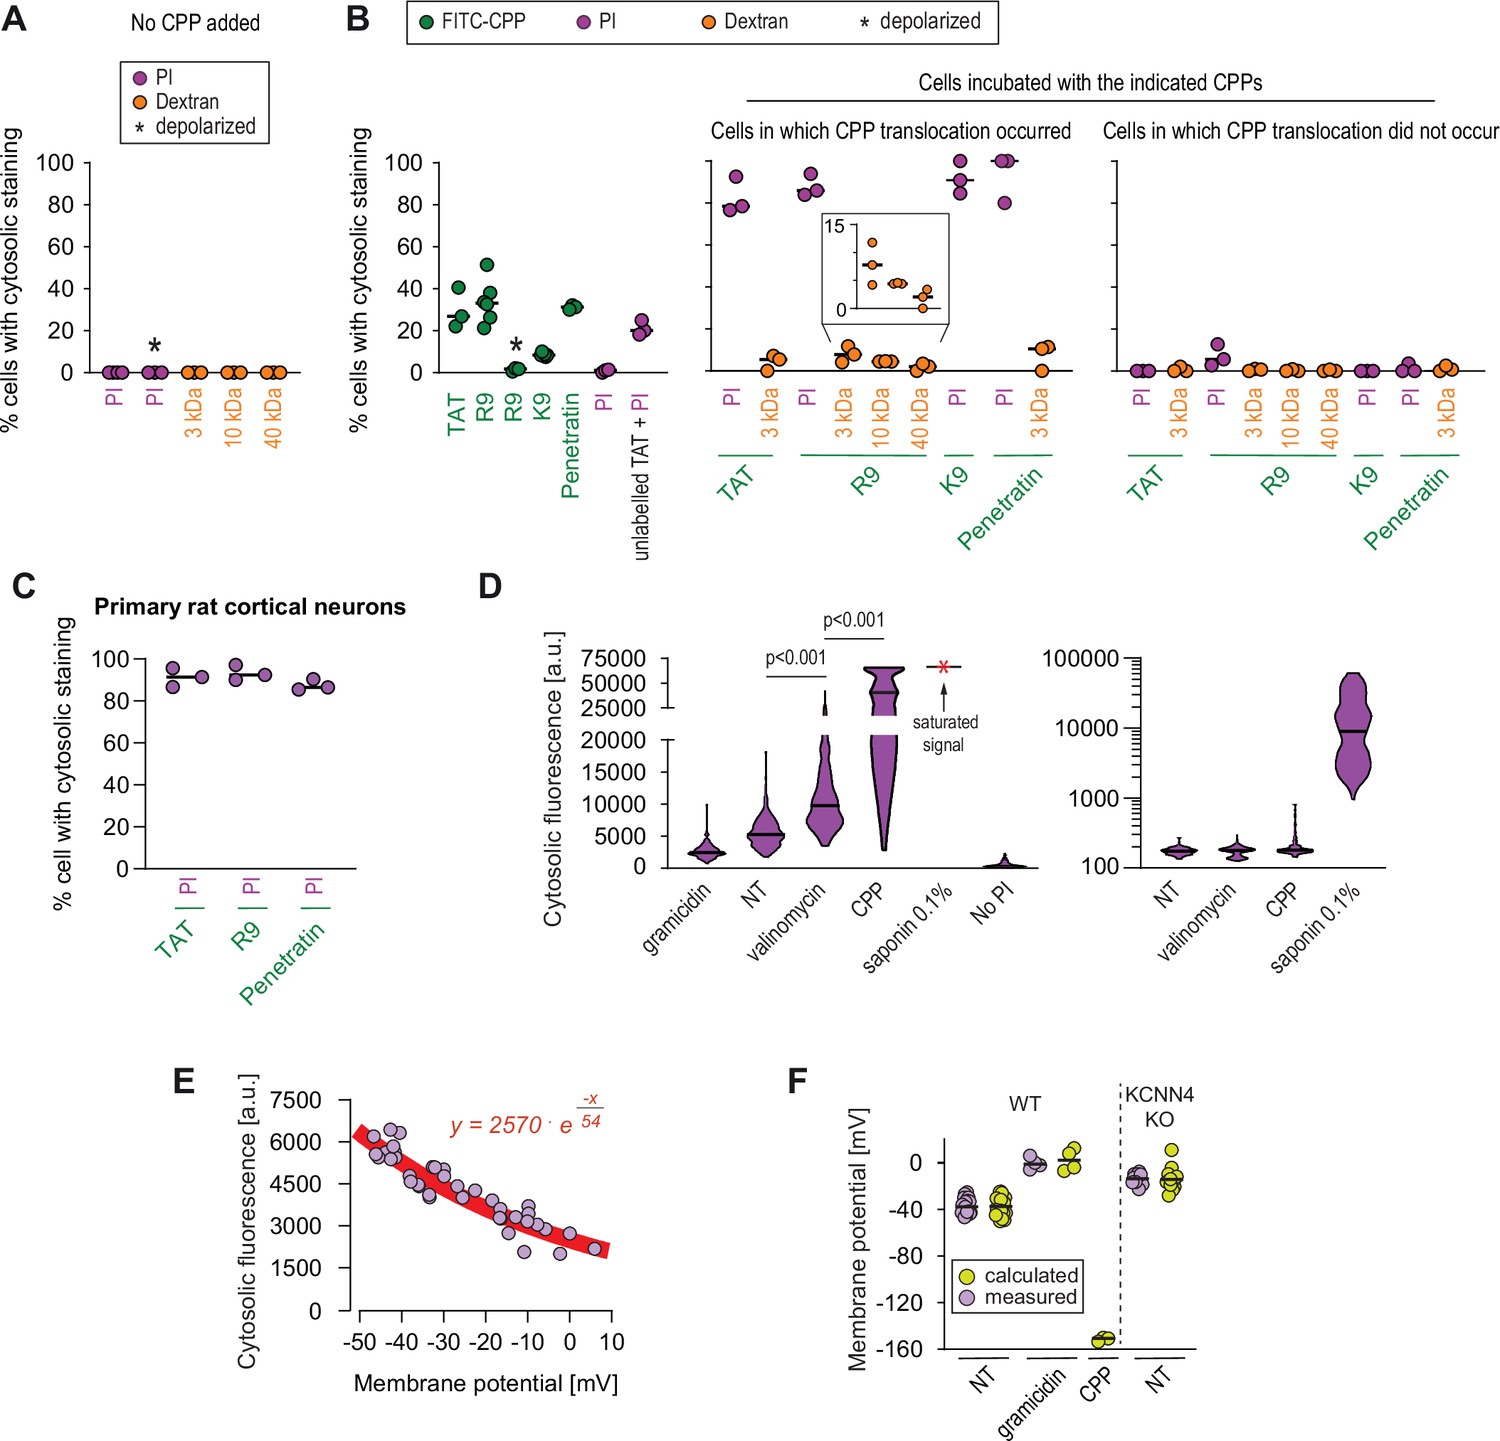
(A–B) Quantitation of the percentage of cells with cytosolic staining after the indicated treatment. The indicated compounds (32 μg/ml propidium iodide [PI], 200 μg/ml dextran, 40 μM CPP) were incubated for 30 min with HeLa cells. Depolarization, indicated by an asterisk, was induced with 2 μg/ml gramicidin. The percentage of cells displaying cytosolic internalization of the indicated molecules was then determined on confocal images (n = 207 cells; see the Materials and methods and Figure 5—figure supplement 1C). Inset corresponds to an enlargement of the percentage of cells positive for dextran in the presence of R9. The results correspond to at least three independent experiments. CPPs such as R9 do not bind to PI (Figure 5—figure supplement 2A) and thus PI entry and accumulation within cells was not the result of CPP carry over. (C) Quantitation of the percentage of primary rat cortical neurons with cytosolic staining following incubation for 30 min with the indicated CPPs (2 μM) and PI (32 μg/ml). The percentage of cells displaying cytosolic internalization of the indicated molecules was then determined on confocal images (n = 153 cells), as in panel B. (D) Left graph: quantitation of PI cytosolic internalization in wild-type HeLa cells after 30 min of incubation in normal, depolarizing (2 μg/ml gramicidin) or hyperpolarizing (10 μM valinomycin) conditions in the presence or in the absence of 40 μM FITC-R9. Right graph: as in left graph, but using lower laser power to avoid saturation of the signal obtained in saponin-permeabilized cells. Cytosolic internalization was quantitated from confocal images using ImageJ (n = 319 cells; see Materials and methods). The p-values correspond to the assessment of the significance of the differences with the non- treated (NT) control condition using ANOVA multiple comparison analysis with Dunnett’s correction. The results correspond to three independent experiments. PI staining is commonly used to assess cell membrane integrity, frequently associated with cell death (see for example Figure 2B, lower graphs). This dye poorly fluoresces in solution (Figure 5—figure supplement 2B). However, the PI cytosolic intensity values in dead permeabilized cells are several orders of magnitude higher than those recorded after cell hyperpolarization (compare the left and right graphs in the present panel). (E) Relation between cytosolic PI intensity and membrane potential measured with the DiBac4(3) sensor in HeLa cells. Each dot represents an independent experiment. (F) The fitted curve from panel E was used to calculate membrane potential values based on cytosolic PI intensities in HeLa cells and its corresponding KCNN4 knock-out (KO). These values are those labelled "calculated" in the graph. Those labelled "measured" correspond to the membrane potentials determined via DiBac4(3) uptake. Each dot in a given condition represents an independent experiment.
Figure 5—figure supplement 1
Evidence for low molecular weight pore formation in living cells during cell-penetrating peptide (CPP) direct translocation.
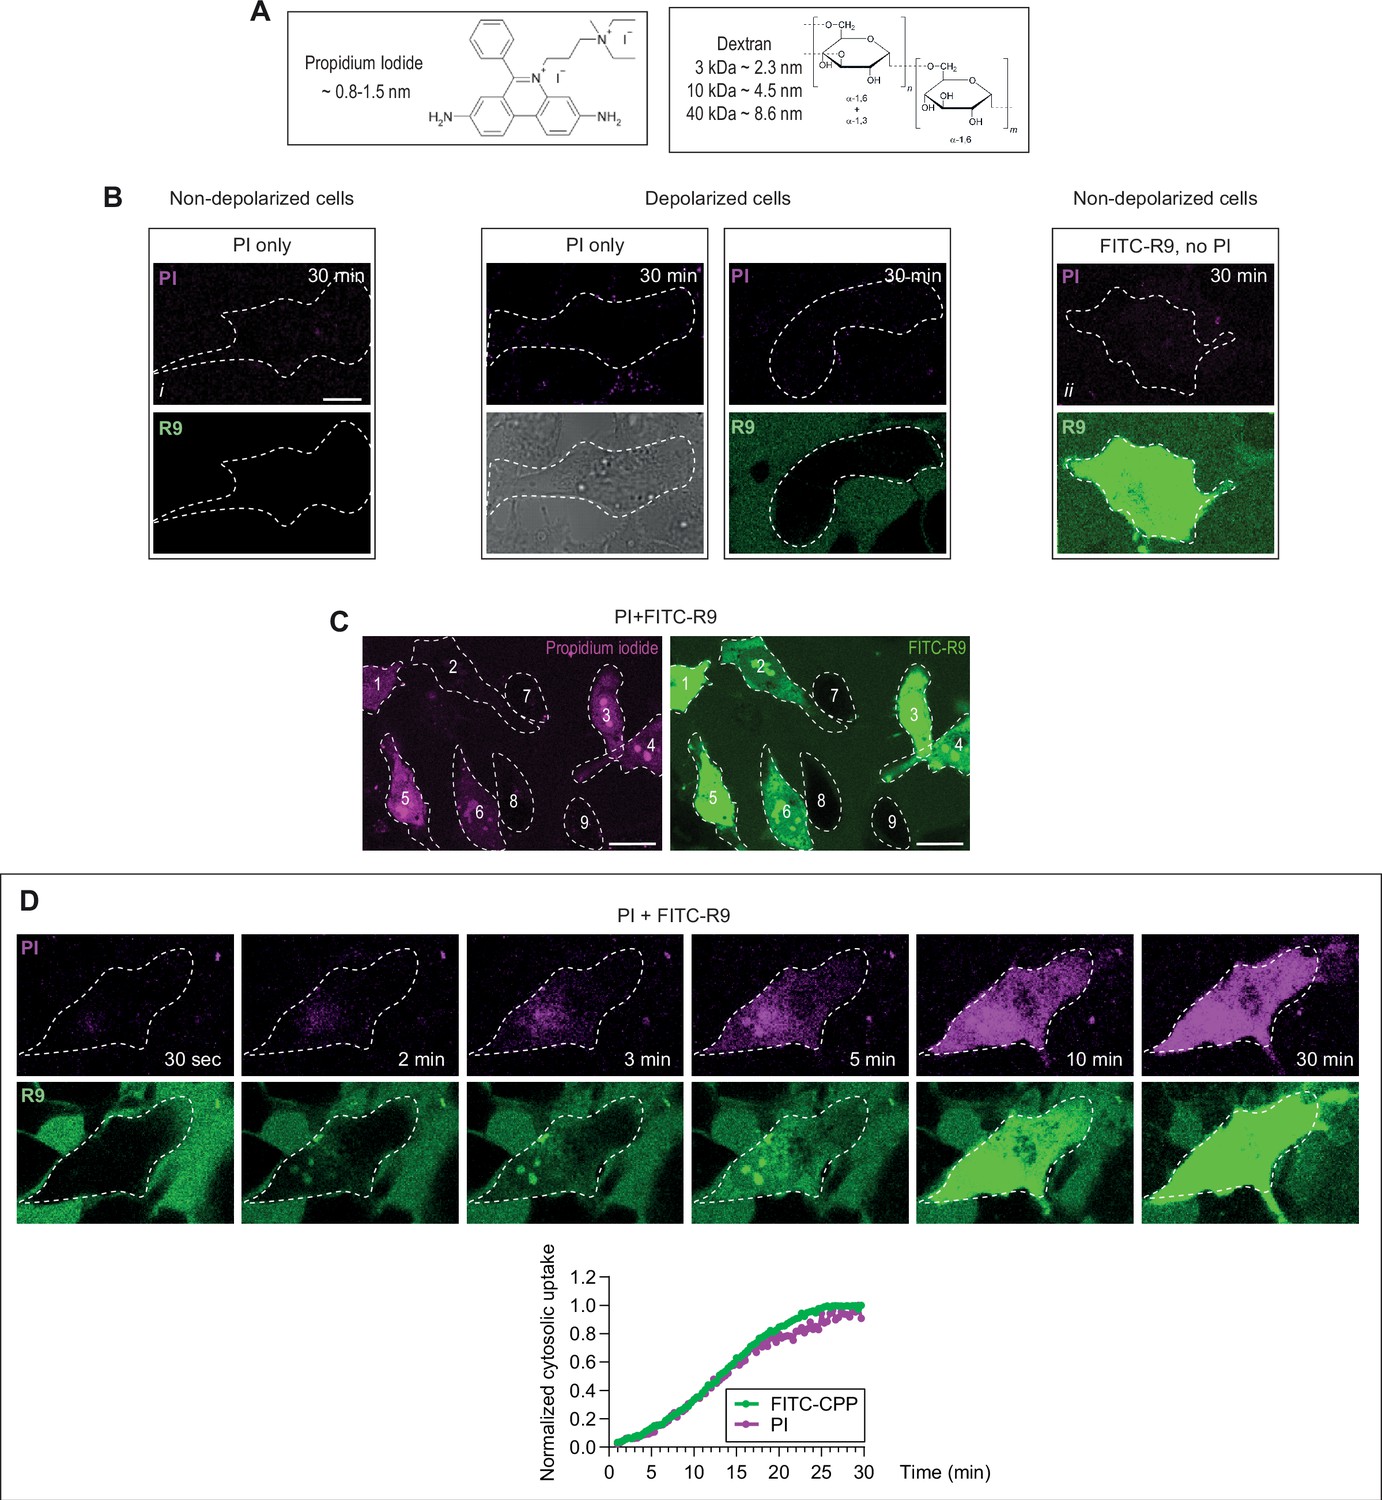
(A) Structure and dimensions of the molecules used to probe the size of the pore used by CPPs to enter cells. Dextran molecules are fluorescently labeled with Texas Red or TMR. (B–D) HeLa cells were incubated with 32 μg/ml propidium iodide (PI) with or without 40 μM FITC-R9, or left untreated for 30 min at 37°C in RPMI, 10% fetal bovine serum (FBS). Depolarization was induced with 2 μg/ml gramicidin. Images were obtained by confocal microscopy. As shown in Figure 5—figure supplement 2B, the fluorescence produced by 32 μg/ml of PI in solution (i.e. without cells) is under our threshold of detection. The observed fluorescence dots and signal in cells incubated with this PI concentration correspond therefore to cell autofluorescence and not PI fluorescence (compare images i and ii in panel B). Hence, when PI fluorescence is detected in cells (see the examples in panel C or D), the corresponding PI concentration is higher than 32 μg/ml (Figure 5—figure supplement 2B). In other words, cellular PI fluorescence is detected because cells are able to concentrate this cationic dye in their cytosol, as they are able to do with cationic CPPs (Figure 4—figure supplement 1C). (B) PI does neither enter live cells by itself (left images), nor does it enter depolarized cells, whether CPPs (here R9) are present or not (middle images). The fluorescent signal from FITC-labeled CPPs is not detected in the channel used to record PI fluorescence. In other words, the signal recorded as PI does not come from FITC fluorescence leaking into the PI channel (right images). (C) Criteria used for the visual scoring performed in Figure 5 in HeLa cells. The percentage of cells positive for PI and cells that have acquired FITC-R9 through direct translocation were assessed based on the following criteria. Cells 1, 3–6 are considered as positive for PI (left) and cells 1–6 are counted as those where direct translocation has occurred (right). The rest of the cells were considered as negative. Scale bar: 20 μm. (D) Kinetics of FITC-CPP and PI uptake. Images were acquired over time with a confocal microscope and cytosolic fluorescence was quantitated using ImageJ similarly to what is shown in Figure 1—figure supplement 2D.
Figure 5—figure supplement 2
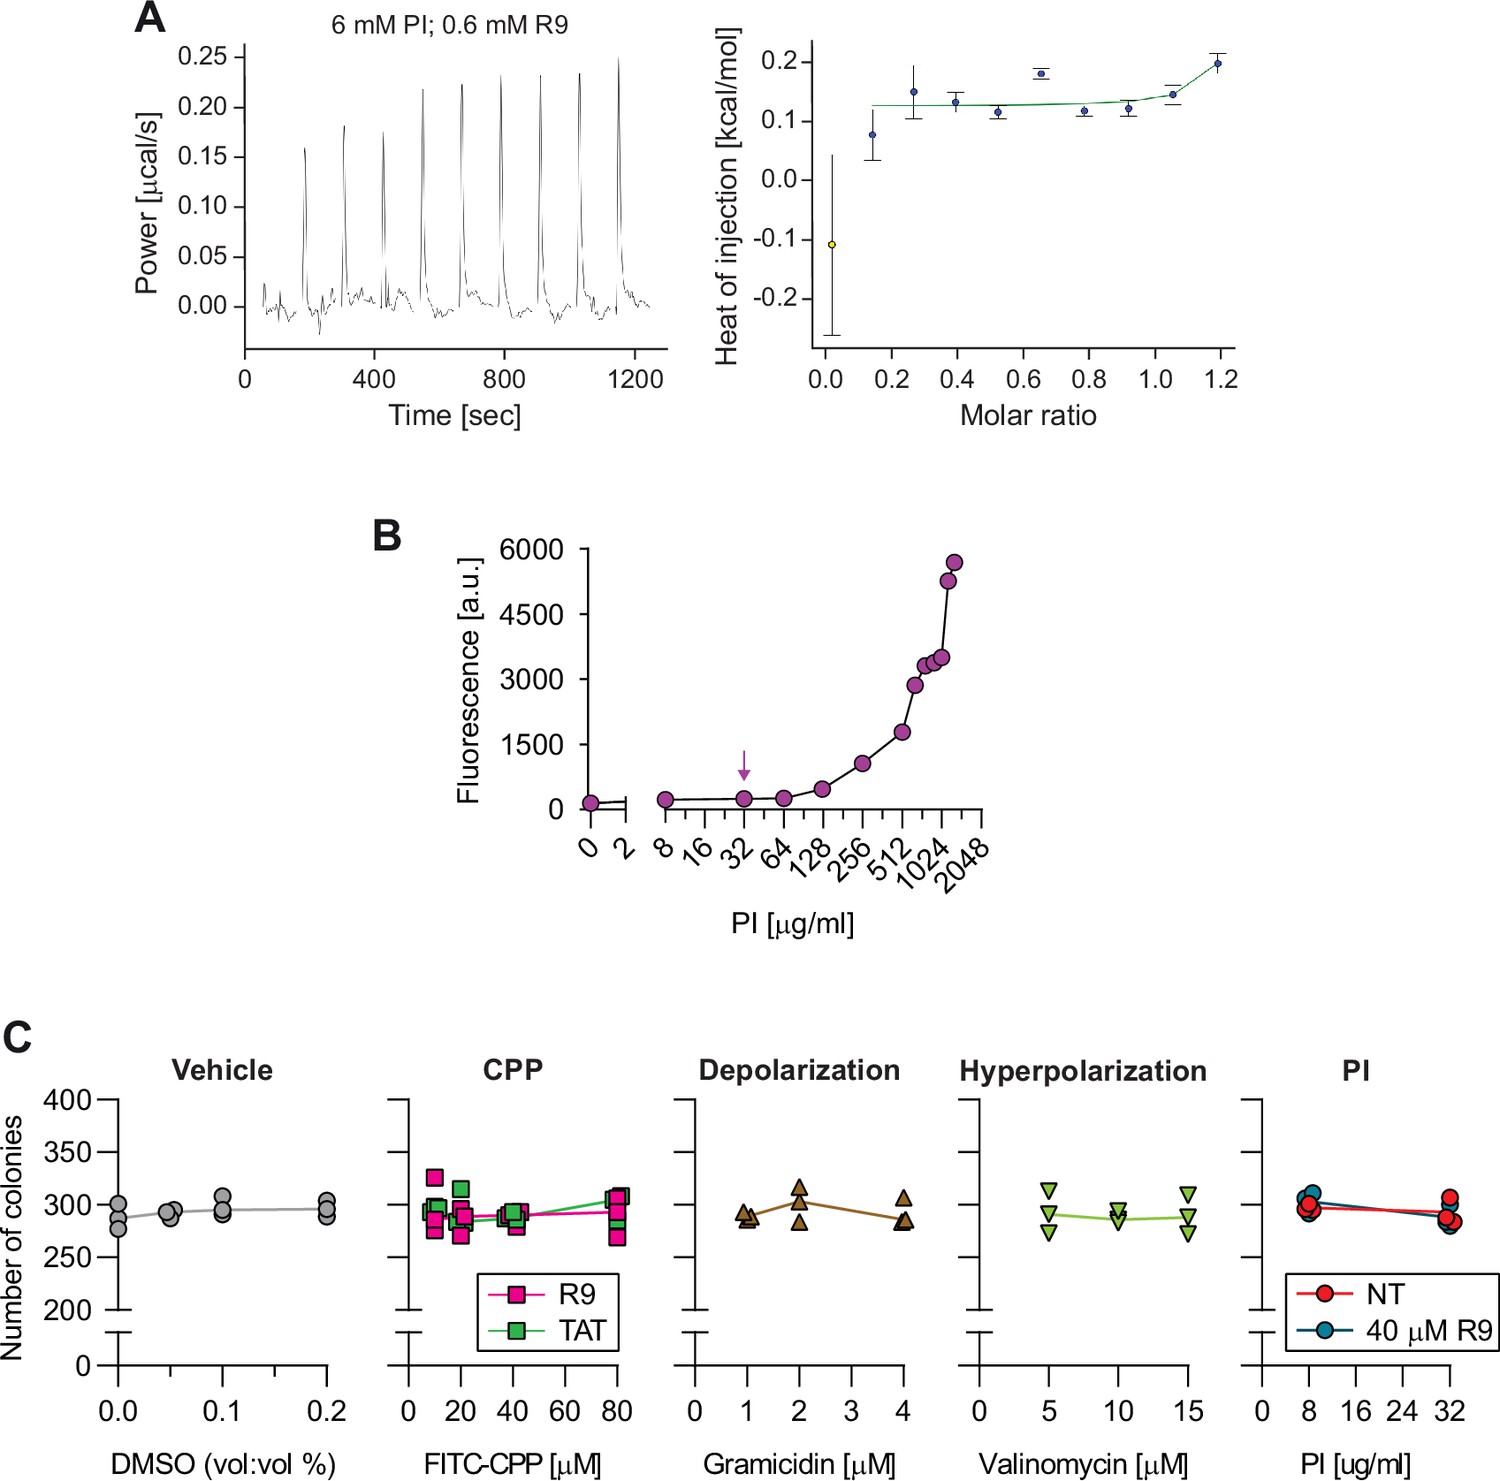
Control experiments pertinent to the use of propidium iodide (PI).
(A) PI does not interact with R9. The potential binding between PI (6 mM) and R9 (0.6 mM) at 37°C was assessed by isothermal titration calorimetry. Representative power and heat of injection are shown. This experiment was repeated three times with similar results. (B) PI fluorescence detection in media in the absence of cells. Wells containing the indicated PI concentrations in RPMI were illuminated using the same settings as in Figure 5B and C, left panel. Fluorescence intensity within the full field of the acquired images was quantitated using ImageJ. The arrow indicates the PI concentration used for water pore-related experiments (32 μg/ml). (C) Assessment of colony formation potential after transient cell-penetrating peptide (CPP) and membrane potential treatments. DMSO was used as a vehicle for gramicidin and valinomycin. HeLa cells were incubated for 1 hr with the indicated treatment, washed, and plated on 10 cm dishes. Number of colonies were counted after 14 days in culture after Giemsa staining. These data indicate that cell viability is not affected by transient treatment with the indicated CPPs, Vm modulating agents, and PI. The results obtained in cells incubated with CPPs further show that water pore formation does not compromise cell survival.
Figure 6 with 1 supplement
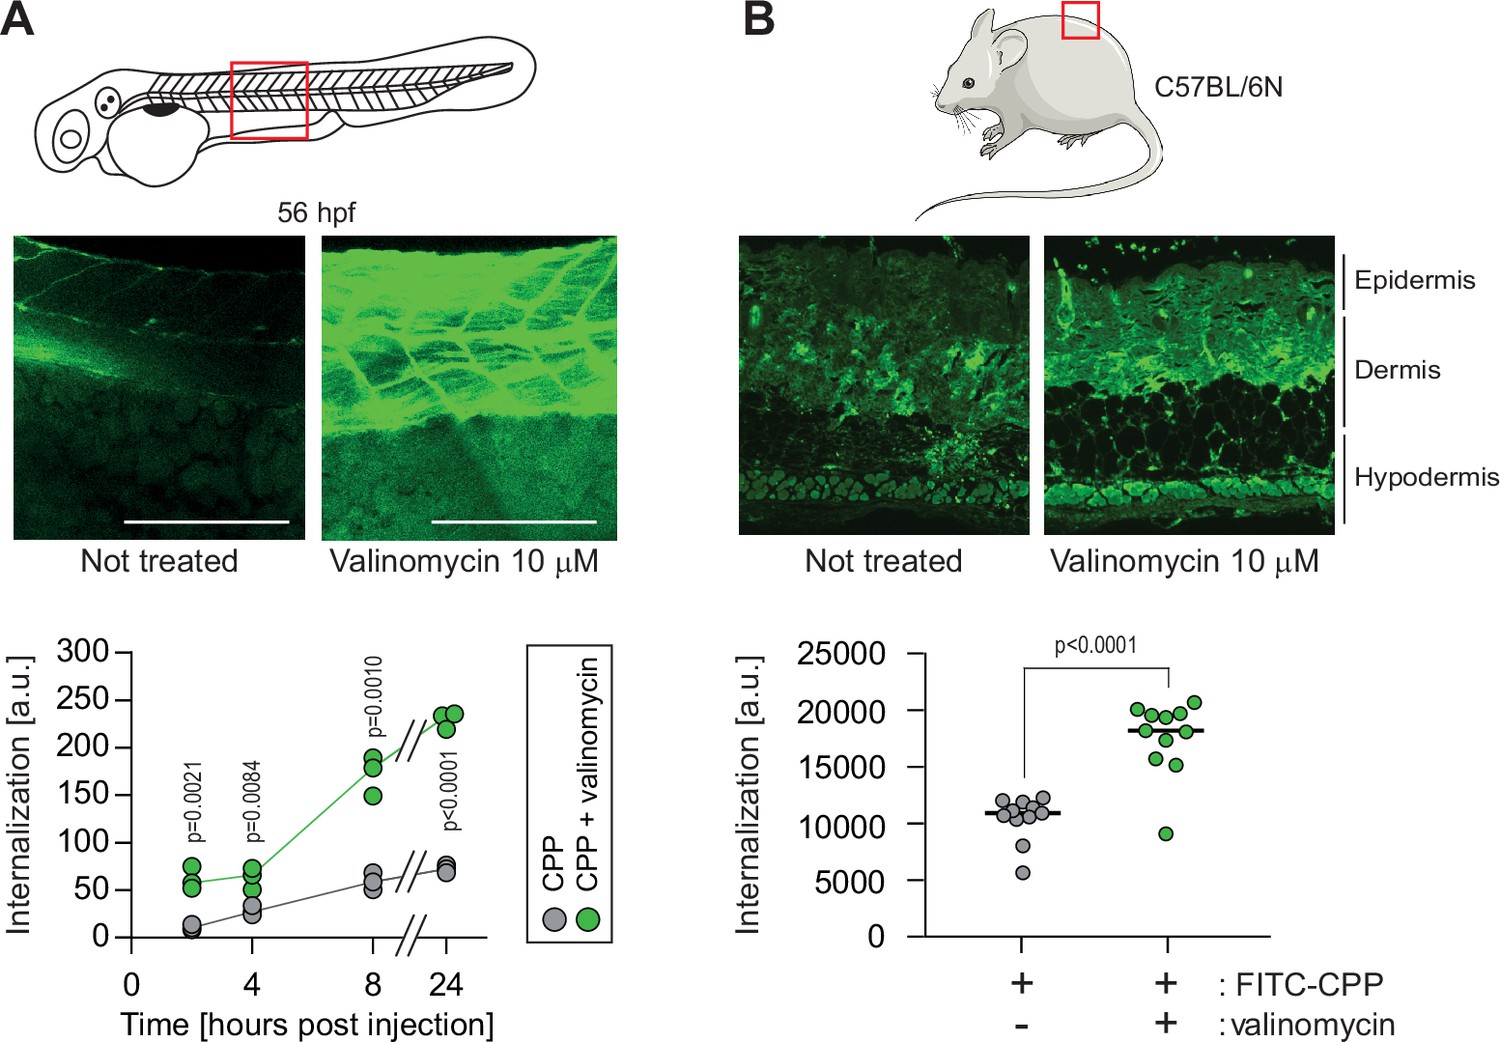
Hyperpolarization improves cell-penetrating peptide (CPP) internalization in vivo.
(A) CPP internalization in zebrafish embryos in normal and hyperpolarized conditions. Forty-eight-hour post fertilization, zebrafish embryos were injected with 3.12 μM FITC-TAT-RasGAP317-326(W317A) with or without 10 μM valinomycin. Scale bar: 200 μm. The results correspond to three independent experiments. (B) CPP internalization in C57BL/6 N mice in normal and hyperpolarized conditions. Mice were injected with 5 μM FITC-TAT-RasGAP317-326(W317A) with or without 10 μM valinomycin (n = 11 injections per condition). In both panels, the p-values associated with the comparisons of the ‘CPP’ and ‘CPP + valinomycin’ conditions were calculated using two-tailed paired t-tests.
Figure 6—figure supplement 1
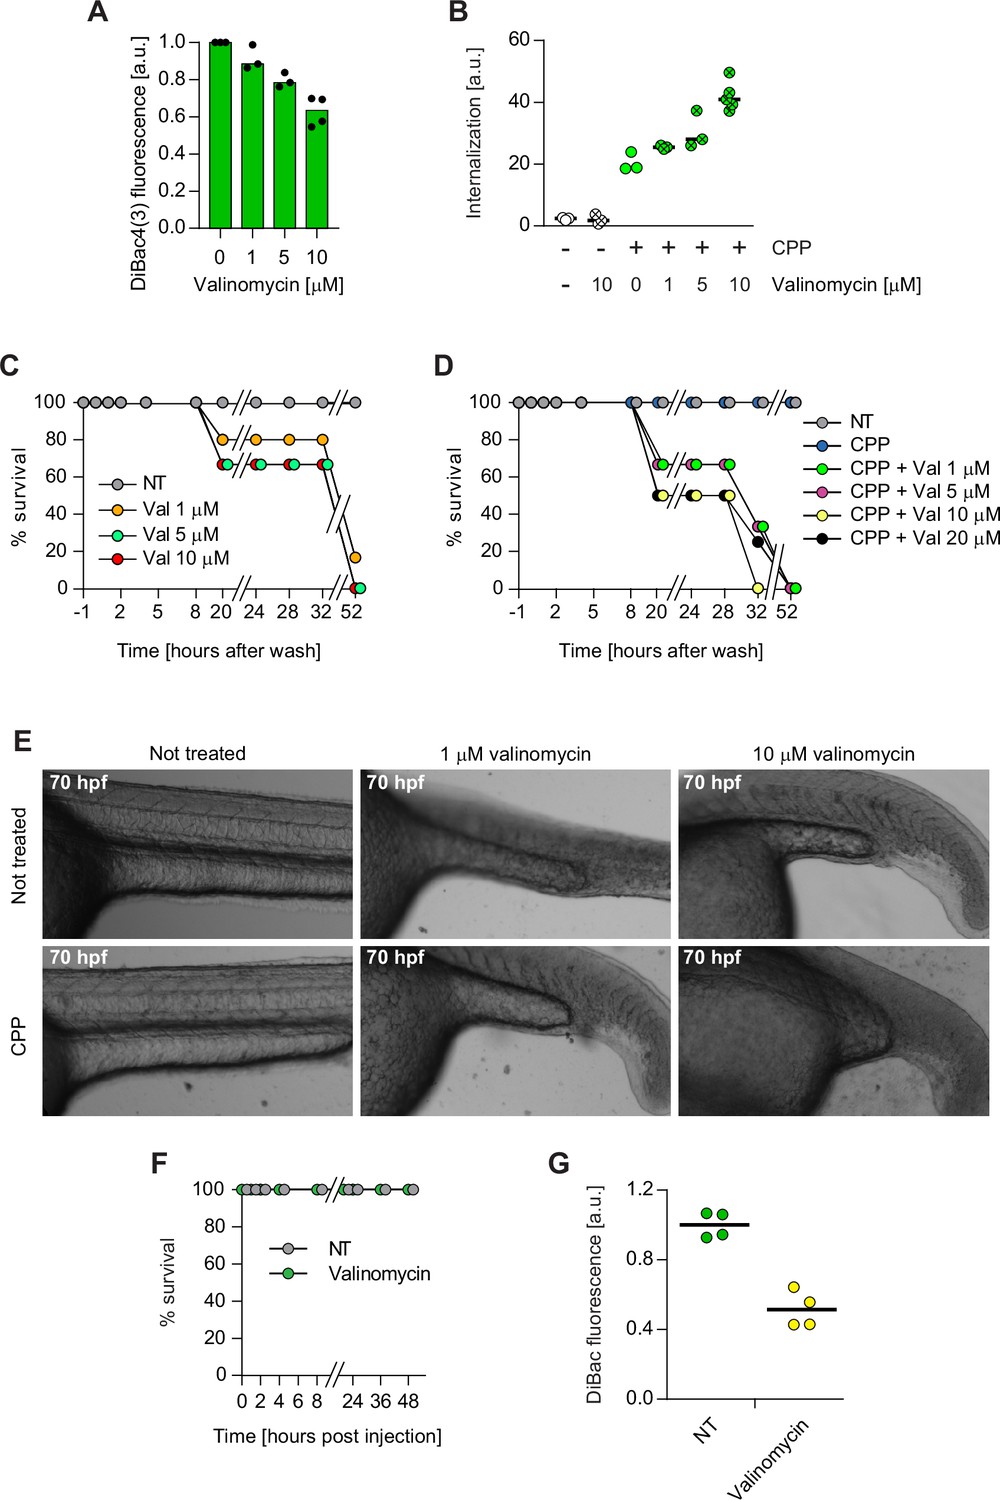
Zebrafish and mouse membrane potential modulation.
(A) Eighteen hours post fertilization zebrafish embryos were incubated for 40 min with the indicated concentrations of valinomycin and 950 nM DiBac4(3). DiBac4(3) fluorescence was then recorded and normalized to the non-treated control. The decrease in DiBac4(3) fluorescence indicates membrane hyperpolarization. Membrane potential values could not be calculated, as a standard curve would have to be performed in zebrafish. DiBac4(3) internalization was assessed from confocal images of the fish tail region. (B) Eighteen hours post fertilization, zebrafish embryos were incubated with or without 3.12 μM TAT-RasGAP317-326 (W317A), a mutant version that is not toxic to cells, in the presence of the indicated concentrations of valinomycin. Peptide internalization was assessed from confocal images of the fish tail region. (C–D) Eighteen hours post fertilization, zebrafish embryos were incubated 1 hr with the indicated concentrations of valinomycin, in the absence (panel C) or in the presence (panel D) of 3.12 μM TAT-RasGAP317-326 (W317A), then washed, and incubated in Egg water. The viability of each fish was assessed over 52 hr at the indicated time points. (E) Representative images of zebrafish treated as described in panels C and D, washed, and further incubated in Egg water. Images were taken with a CYTATION3 apparatus at a 4× magnification at 70 hr post fertilization (hpf). (F) Survival of 48 hr post fertilization zebrafish embryos following intramuscular injection of 3.12 μM TAT-RasGAP317-326 (W317A) peptide in the presence or in the absence of 10 μM valinomycin. Survival was visually assessed under a binocular microscope by taking into consideration the embryo transparency (as dead embryos appear opaque), development characteristics, and motility. (G) Mice were intradermally injected with DiBac4(3) in the presence or in the absence of 10 μM valinomycin. DiBac4(3) fluorescence was then recorded and normalized to the mean of non-treated (NT) control. DiBac4(3) fluorescence was assessed as in panel A.
Figure 7
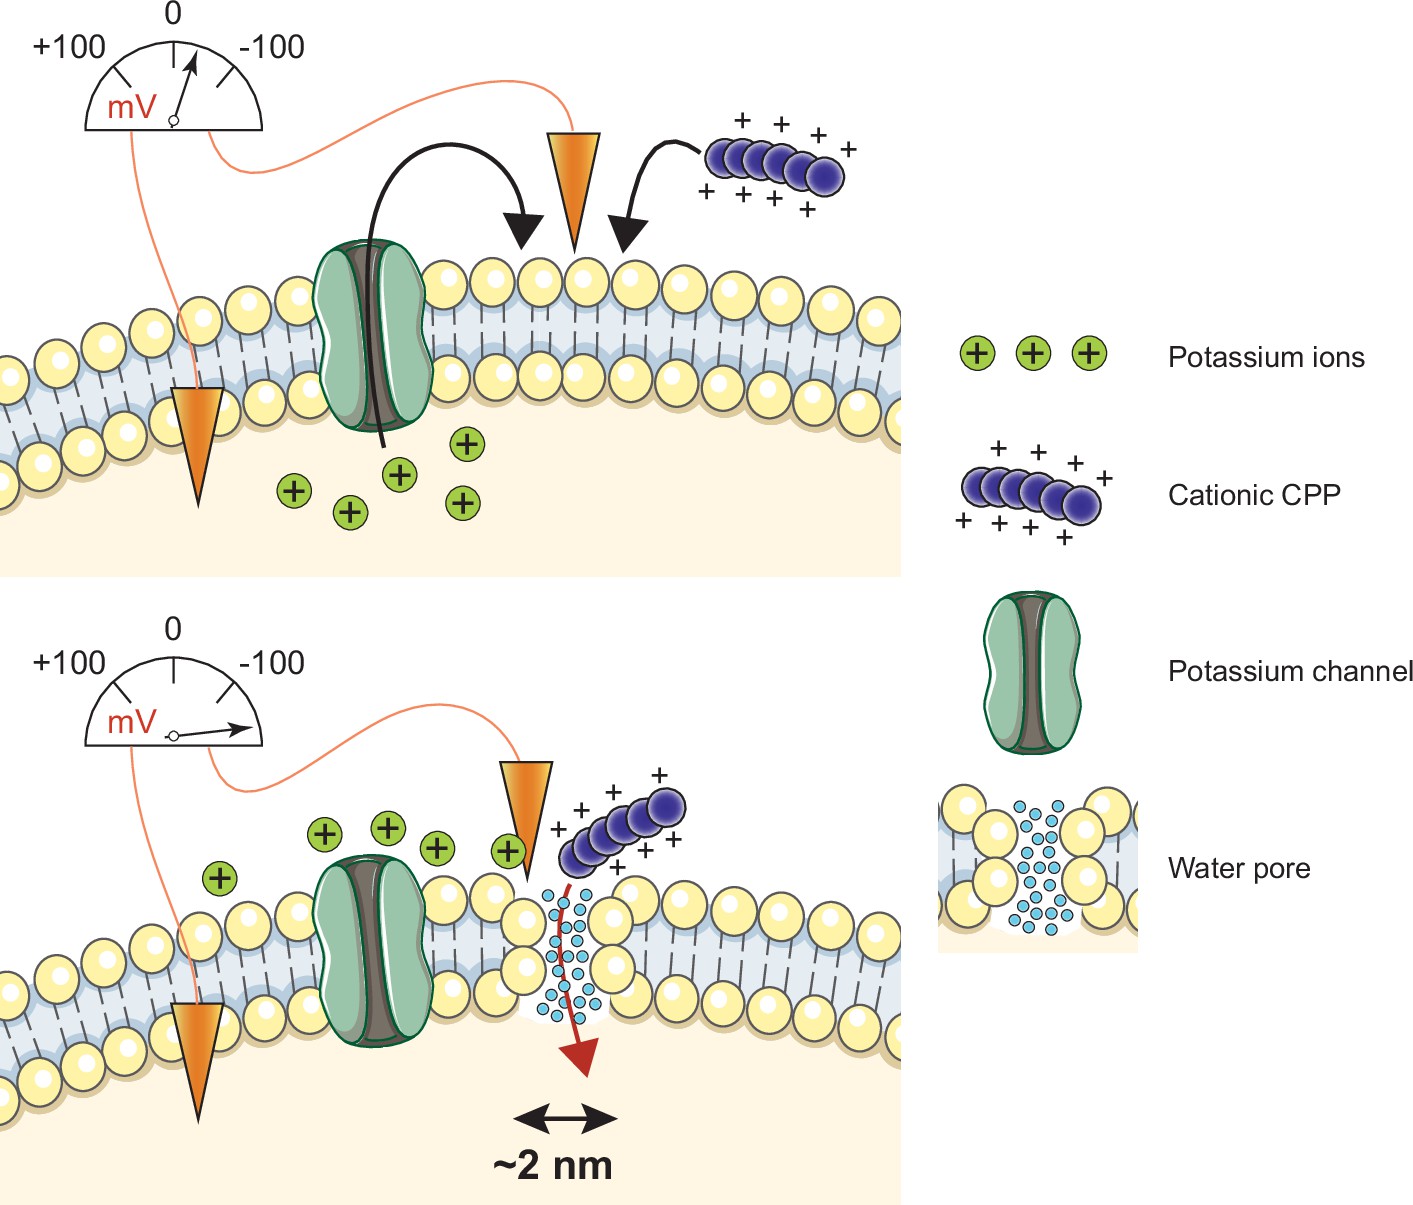
Model of cell-penetrating peptide (CPP) direct translocation through water pores.
Cationic CPP translocation across cellular membranes is favored by the opening of potassium channels or by hyperpolarizing drugs, such as valinomycin. This sets a sufficiently low membrane potential permissive for CPP direct translocation. When cationic CPPs bind to these already polarized membranes, they induce megapolarization (i.e. a membrane potential estimated to be –150 mV or lower). This leads to the formation of water pores that are then used by CPPs to enter cells.
Author response image 1
Videos
Video 1
TAT-RasGAP317-326 internalization in Raji cells over a 16-hr period.
Representative confocal time-lapse recording of wild-type Raji cells incubated with 5 μM TAT-RasGAP317-326 for 16 hr in RPMI in the absence of serum. For the first 30 min of the recording, images were taken every 30 s, then until the end of the recording, images were taken every 5 min. Peptide was present in the media throughout the recording. Yellow and pink arrows indicate cells taking up the peptide by direct translocation and by endocytosis, respectively. Cyan arrows point toward labeled endosomes and green asterisks to dead cells. Scale bar: 20 μm. Time is displayed in hours:minutes.
Video 2
Early peptide entry in wild-type Raji cells.
Time-lapse recording of Raji cells incubated with 40 μM TAT-RasGAP317-326 for 30 min in RPMI, 10% fetal bovine serum (FBS). Peptide was present in the media throughout the recording and images were taken for 30 min at 10 s intervals. Scale bar: 10 μm. Time is displayed in minutes:seconds.
Video 3
Early peptide entry in wild-type HeLa cells.
Time-lapse recording of HeLa cells incubated with 80 μM FITC-TAT-RasGAP317-326 in RPMI, 10% fetal bovine serum (FBS). Yellow and pink arrows indicate cells experiencing direct translocation and endocytosis, respectively. Images were taken for 30 min at 10 s intervals. Scale bar: 20 μm. Time is displayed in minutes:seconds.
Video 4
Distinction between endosomal escape and direct translocation.
Wild-type HeLa cells were pre-incubated with 80 μM FITC-TAT-RasGAP317-326 for 30 min in RPMI, 10% fetal bovine serum (FBS) and then imaged every 5 min for 4 hr at 37°C, 5% CO2. Video on the left was recorded in the continuous presence of the peptide. Video on the right was recorded after the peptide was washed out three times with RPMI, 10% FBS. Scale bar: 10 μm. Time is displayed in hours:minutes.
Video 5
In silico visualization of water pore formation in the presence of the indicated cell-penetrating peptides (CPPs) across a polarized membrane bilayer.
This video shows the translocation of the indicated CPPs across a plasma membrane in the presence of a membrane potential of –2.2 V. This simulation was performed by molecular dynamics MARTINI coarse-grained approach using an asymmetric multi-component bilayer in the presence of ion imbalance to polarize the membrane.
Video 6
In silico visualization of water pore formation in the presence of the indicated cell-penetrating peptides (CPPs) across a non-polarized membrane bilayer.
This video shows the lack of translocation of the indicated CPPs across a plasma membrane in the absence of a membrane potential (0 V). This simulation was performed by molecular dynamics MARTINI coarse-grained approach using an asymmetric multi-component bilayer in the absence of ion imbalance.
Tables
Key resources table
| Reagent type (species) or resource | Designation | Source or reference | Identifiers | Additional information |
|---|---|---|---|---|
| Antibody | Anti-V5(rabbit polyclonal) | Bethyl | Cat#A190-A120 | WB (1:1000) |
| Antibody | Anti-FLAG(Mouse monoclonal) | Sigma-Aldrich | Cat#F1804 | WB (1:1000) |
| Antibody | Anti-Actin(Rabbit monoclonal) | Cell Signaling | Cat#4970 | WB (1:1000) |
| Antibody | Anti-α-Tubulin(Rat monoclonal) | Santa Cruz | Cat#sc-51715 | WB (1:1000) |
| Chemical compound, drug | Puromycin | Thermo Fisher | Cat#A11138-002 | 10 μg/ml |
| Chemical compound, drug | Blasticidin | Applichem | Cat#A3784 | 10 μg/ml |
| Chemical compound, drug | XE-991 | Alomone Labs | Cat#X-100 | 10 μg/ml |
| Chemical compound, drug | TRAM-34 | Alomone Labs | Cat#T-105 | 10 μg/ml |
| Chemical compound, drug | Hoechst 3342 | Thermo Fisher | Cat#H21492 | 10 μg/ml |
| Chemical compound, drug | Trypan Blue 0.4% | Life Technologies | Cat#1520061 | |
| Chemical compound, drug | AlexaFluor488-Transferrin | Thermo Fisher | Cat#13342 | 20 μg/ml |
| Chemical compound, drug | TexasRed-Dextran 3000 | Thermo Fisher | Cat#D3329 | 200 μg/ml |
| Chemical compound, drug | TMR-Dextran 10000 | Thermo Fisher | Cat#D1816 | 200 μg/ml |
| Chemical compound, drug | TexasRed-Dextran 40000 | Thermo Fisher | Cat#D1829 | 200 μg/ml |
| Chemical compound, drug | Valinomycin | Sigma-Aldrich | Cat#V0627 | 10 μM |
| Chemical compound, drug | Gamicidin | Sigma-Aldrich | Cat#G5002 | 2 μg/ml |
| Chemical compound, drug | Tetraethylammonium | Sigma-Aldrich | Cat#T2265 | 5 mM |
| Chemical compound, drug | Propidium Iodide | Sigma-Aldrich | Cat#81845 | 32 μg/ml PI |
| Chemical compound, drug | DiBac4(3) | Thermo Fisher | Cat#B438 | |
| Chemical compound, drug | Saponin | Sigma-Aldrich | Cat#4706 | 0.1% |
| Chemical compound, drug | Restriction enzyme: BamHI | New England Biolabs | Cat#R313614 | |
| Chemical compound, drug | Restriction enzyme: XmaI | New England Biolabs | Cat#0180S | |
| Chemical compound, drug | Restriction enzyme: XhoI | New England Biolabs | Cat#R0146L | |
| Chemical compound, drug | Restriction enzyme: HindIII | Promega | Cat#R6041 | |
| Peptide, recombinant protein | TAT-RasGAP317-326 | Biochemistry Department, University of Lausanne | N/A | |
| Peptide, recombinant protein | TAT-RasGAP317-326 | SBS Genetech | N/A | |
| Peptide, recombinant protein | TAT-RasGAP317-326 | Creative Peptides | N/A | |
| Peptide, recombinant protein | FITC-TAT-RasGAP317-326 | Biochemistry Department, University of Lausanne | N/A | |
| Peptide, recombinant protein | FITC-TAT-RasGAP317-326 | Creative Peptides | N/A | |
| Peptide, recombinant protein | FITC-TAT-RasGAP317-326 | SBS Genetech | N/A | |
| Peptide, recombinant protein | TMR-TAT-RasGAP317-326 | Creative Peptides | N/A | |
| Peptide, recombinant protein | FITC-TAT-RasGAP317-326(W317A) | Creative Peptides | N/A | |
| Peptide, recombinant protein | FITC-TAT | SBS Genetech | N/A | |
| Peptide, recombinant protein | TAT | SBS Genetech | N/A | |
| Peptide, recombinant protein | FITC-R9 | Biochemistry Department, University of Lausanne | N/A | |
| Peptide, recombinant protein | FITC-Penetratin | Biochemistry Department, University of Lausanne | N/A | |
| Peptide, recombinant protein | FITC-MAP | Biochemistry Department, University of Lausanne | N/A | |
| Peptide, recombinant protein | FITC-Transportan | Biochemistry Department, University of Lausanne | N/A | |
| Peptide, recombinant protein | FITC-D-JNKI1 | SBS Genetech | N/A | |
| Peptide, recombinant protein | FITC-K9 | SBS Genetech | N/A | |
| Commercial assay or kit | TA cloning | Thermo Fisher | Cat#K202020 | |
| Commercial assay or kit | QuikChange II XL Site-Directed Mutagenesis Kit | Aligent | Cat#200522 | |
| Commercial assay or kit | Dual-Luciferase Reporter Assay | Promega | Cat#E1910 | |
| Cell line (Homo sapiens) | Raji | Laboratory of Aimable Nahimana | CCL-86 (ATCC) | |
| Cell line (Homo sapiens) | SKW6.4 | Laboratory of Pascal Schneider | TIB-215 (ATCC) | |
| Cell line (Homo sapiens) | HeLa | ATCC | CCL-2 | |
| Strain, strain background (Mus musculus) | C57BL/6NCrl | Charles River Laboratories | C57BL/6NCrl | |
| Strain, strain background (Sprague-Dawley rat) | Sprague-Dawley | Janvier Laboratories | Sprague-Dawley | |
| Experimental Models (Danio rerio) | AB line | European Zebrafish Resource Center | Cat#1175 | |
| Sequence-based reagent | Primer: PCR amplification of FLAG-hKCNQ5 from pShuttlw-FLAG-hKCNQ5(G278S)-IRES-hrGFP2 Forward: | This paper | PCR primers | CATCGGGATCCGCTATACCGGCCACCATGGATTACAAGGA |
| Sequence-based reagent | Primer: PCR amplification of FLAG-hKCNQ5 from pShuttlw-FLAG-hKCNQ5(G278S)-IRES-hrGFP2 Reverse: | This paper | PCR primers | CATCGCCCGGGGCTATACCGTACCGTCGACTGCAGAATTC |
| Sequence-based reagent | Primer: introducing silent mutations in FLAG-hKCNQ5(G278S)-IRES-Neo Forward: | This paper | PCR primers | AAA TAA GAA CCA AAA ATC CTA TGT ACC ATG CCG TTA TCA GCT CCT TGC TGT GAG CAT AAA CCA CTG AAC CCA G |
| Sequence-based reagent | Primer: introducing silent mutations in FLAG-hKCNQ5(G278S)-IRES-Neo Reverse: | This paper | PCR primers | CTG GGT TCA GTG GTT TAT GCT CAC AGC AAG GAG CTG ATA ACG GCA TGG TAC ATA GGA TTT TTG GTT CTT ATT T |
| Sequence-based reagent | Primer: reverting G278S mutation in FLAG-hKCNQ5(SM, G278S)-IRES-Neo Forward: | This paper | PCR primers | TTT TGT CTC CAT AGC CAA TAG TTG TCA ATG TAA TTG TGC CCC |
| Sequence-based reagent | Primer: reverting G278S mutation in FLAG-hKCNQ5(SM, G278S)-IRES-Neo Reverse: | This paper | PCR primers | GGG GCA CAA TTA CAT TGA CAA CTA TTG GCT ATG GAG ACA AAA |
| Sequence-based reagent | sgRNA targeting KCNQ5, KCNN4 and KCNK5, see Supplementary file 5 | This paper | PCR primers | |
| Sequence-based reagent | Primer: first PCR to amplify the lentiCRISPR sgRNA region Forward: | Shalem et al., 2014 | PCR primers | AATGGACTATCATATGCTTACCGTAACTTGAAAGTATTTCG |
| Sequence-based reagent | Primer: first PCR to amplify the lentiCRISPR sgRNA region Reverse: | Shalem et al., 2014 | PCR primers | CTTTAGTTTGTATGTCTGTTGCTATTATGTCTACTATTCTTTCC |
| Sequence-based reagent | Primers used during the second PCR to attach Illumina adaptors with barcodes, see Supplementary file 4 | Shalem et al., 2014 | PCR primers | |
| Recombinant DNA reagent | Plasmid:hKCNN4-V5.lti | DNASU | HsCD00441560 | |
| Recombinant DNA reagent | Plasmid: hKCNK5-FLAG.dn3 | GenScript | OHu13506 | |
| Recombinant DNA reagent | Plasmid: Myc-mKCNJ2-T2A-IRES-tdTomato.lti | Xue et al., 2014 | Addgene Plasmid #60598 | |
| Recombinant DNA reagent | Plasmid: LeGo-iT2 | Weber et al., 2008 | Addgene Plasmid #27343 | |
| Recombinant DNA reagent | Plasmid: pMD2.G | Didier Trono Laboratory | Addgene Plasmid #12259 | |
| Recombinant DNA reagent | Plasmid: psPAX2 | Didier Trono Laboratory | Addgene Plasmid #12260 | |
| Recombinant DNA reagent | Plasmid: FLAG-hKCNQ5(G278S)-IHRES-NeoR | This paper | ||
| Recombinant DNA reagent | Plasmid: pShuttle-FLAG-hKCNQ5(G278S)-IRES-hrGFP2 | Kenneth L Byron Laboratory | N/A | |
| Recombinant DNA reagent | Plasmid: TRIP-PGK-IRES-Neo | Didier Trono Laboratory | N/A | |
| Recombinant DNA reagent | Plasmid: FLAG-hKCNQ5(SM,G278S)-IRES-Neo | This paper | ||
| Recombinant DNA reagent | Plasmid: FLAG-hKCNQ5(SM)-IRES-Neo | This paper | ||
| Recombinant DNA reagent | Plasmid:pLUC705 | Bin Yang Laboratory | N/A | |
| Recombinant DNA reagent | Plasmid: LeGo-iG2 | Weber et al., 2008 | Addgene Plasmid #27341 | |
| Recombinant DNA reagent | Plasmid: pLUC705.LeGo-iG2 | This paper | ||
| Recombinant DNA reagent | Plasmid: pTAT-Cre | Wadia et al., 2004 | Addgene Plasmid #35619 | |
| Recombinant DNA reagent | Plasmid: Cre-reporter.lti | D’Astolfo et al., 2015 | Addgene Plasmid #62732 | |
| Recombinant DNA reagent | Plasmid: GeCKO v2 library | Shalem et al., 2014 | Addgene Plasmid #1000000049 | |
| Software, algorithm | ImageJ | Schneider et al., 2012 | https://imagej.nih.gov/ij/ | |
| Software, algorithm | Zeiss Zen Lite 2.3 | Carl Zeiss Microscopy GmbH | https://www.zeiss.fr/microscopie/produits/microscope-software/zen-lite.html | |
| Software, algorithm | MultiClamp 2.2.0 | Axon MultiClamp (Molecular Devices) | http://mdc.custhelp.com/app/answers/detail/a_id/18877/~/axon%E2%84%A2-multiclamp%E2%84%A2-commander-software-download-page | |
| Software, algorithm | Clampfit 10.7.0 | Axon pCLAMP (Molecular Devices) | http://mdc.custhelp.com/app/answers/detail/a_id/18779/~/axon%E2%84%A2pclamp%E2%84%A2-10-electrophysiology-data-acquisition-%26-analysis-software-download | |
| Software, algorithm | Kaluza 1.3 | Beckman Coulter | https://www.beckman.ch/flow-cytometry/software/kaluza | |
| Software, algorithm | Gen5.2.5 | BioTek Instruments | https://www.biotek.com/products/software-robotics-software/gen5-microplate-reader-and-imager-software/ | |
| Software, algorithm | GloMax | Promega | https://ch.promega.com/resources/software-firmware/detection-instruments-software/promega-branded-instruments/glomax-96-microplate-luminometer/ | |
| Software, algorithm | GraphPad Prism8 | GraphPad | https://www.graphpad.com/scientific-software/prism/ | |
| Software, algorithm | MicroCal ITC200 | Malvern Panalytical | N/A | |
| Software, algorithm | Clone Manager9 | Sci-Ed Software | https://www.scied.com/dl_cm10.htm | |
| Software, algorithm | Li-Cor Odyssey | LI-COR Biosciences | N/A | |
| Software, algorithm | GROMACS 2018.3 | http://www.gromacs.org/Downloads | N/A | |
| Software, algorithm | VISUAL MOLECULAR DYNAMICS (VMD) | https://www.ks.uiuc.edu/Development/Download/download.cgi?PackageName=VMD | N/A | |
| Software, algorithm | XMGRACE 5.1 | http://plasma-gate.weizmann.ac.il/Grace/ | N/A | |
| Software, algorithm | PEP-FOLD SERVER | http://mobyle.rpbs.univ-paris-diderot.fr/cgi-bin/portal.py#forms::PEP-FOLD | N/A | |
| Other | RPMI-like media without KCl and NaCl | Biowest | N/A |
Additional files
-
Supplementary file 1
Components of the culture medium lacking potassium chloride and sodium chloride.
This table lists the components found in the Biowest RPMI-like media that lacks potassium chloride and sodium chloride.
- https://cdn.elifesciences.org/articles/69832/elife-69832-supp1-v2.docx
-
Supplementary file 2
Membrane lipid composition considered in the present study.
This table lists the proportions of various lipids found in the inner and outer layers of the plasma membrane that we have used for our simulations.
- https://cdn.elifesciences.org/articles/69832/elife-69832-supp2-v2.docx
-
Supplementary file 3
Nascent water pore free energy estimations in various studies.
This table reports the free energy that needs to be overcome for the formation of water pores that was calculated in the indicated studies.
- https://cdn.elifesciences.org/articles/69832/elife-69832-supp3-v2.docx
-
Supplementary file 4
Primer sequences used in the second PCR performed to bar code the single guide RNAs (sgRNAs) of the selected populations.
The green nucleotides correspond to the bar codes. The red nucleotides are added to increase library complexity to prevent signal saturation when the sequencing is performed. The blue sequences are complementary to the extremities of the first PCR fragments.
- https://cdn.elifesciences.org/articles/69832/elife-69832-supp4-v2.docx
-
Supplementary file 5
Single guide RNAs (sgRNAs) used to disrupt the indicated genes.
This table provides the sequences of the sgRNAs used to target the first exon of the indicated genes.
- https://cdn.elifesciences.org/articles/69832/elife-69832-supp5-v2.docx
-
Supplementary file 6
Forward and reverse primers used in the TA cloning procedure.
- https://cdn.elifesciences.org/articles/69832/elife-69832-supp6-v2.docx
-
Transparent reporting form
- https://cdn.elifesciences.org/articles/69832/elife-69832-transrepform1-v2.docx
Download links
A two-part list of links to download the article, or parts of the article, in various formats.
Downloads (link to download the article as PDF)
Open citations (links to open the citations from this article in various online reference manager services)
Cite this article (links to download the citations from this article in formats compatible with various reference manager tools)
Genetic, cellular, and structural characterization of the membrane potential-dependent cell-penetrating peptide translocation pore
eLife 10:e69832.
https://doi.org/10.7554/eLife.69832


