Dysfunctions of the paraventricular hypothalamic nucleus induce hypersomnia in mice
- Department of Pharmacology, School of Basic Medical Sciences; State Key Laboratory of Medical Neurobiology and MOE Frontiers Center for Brain Science, Institutes of Brain Science, Fudan University, China
- Department of Neurology, The First Hospital of Jilin University, China
Figures
Figure 1 with 1 supplement
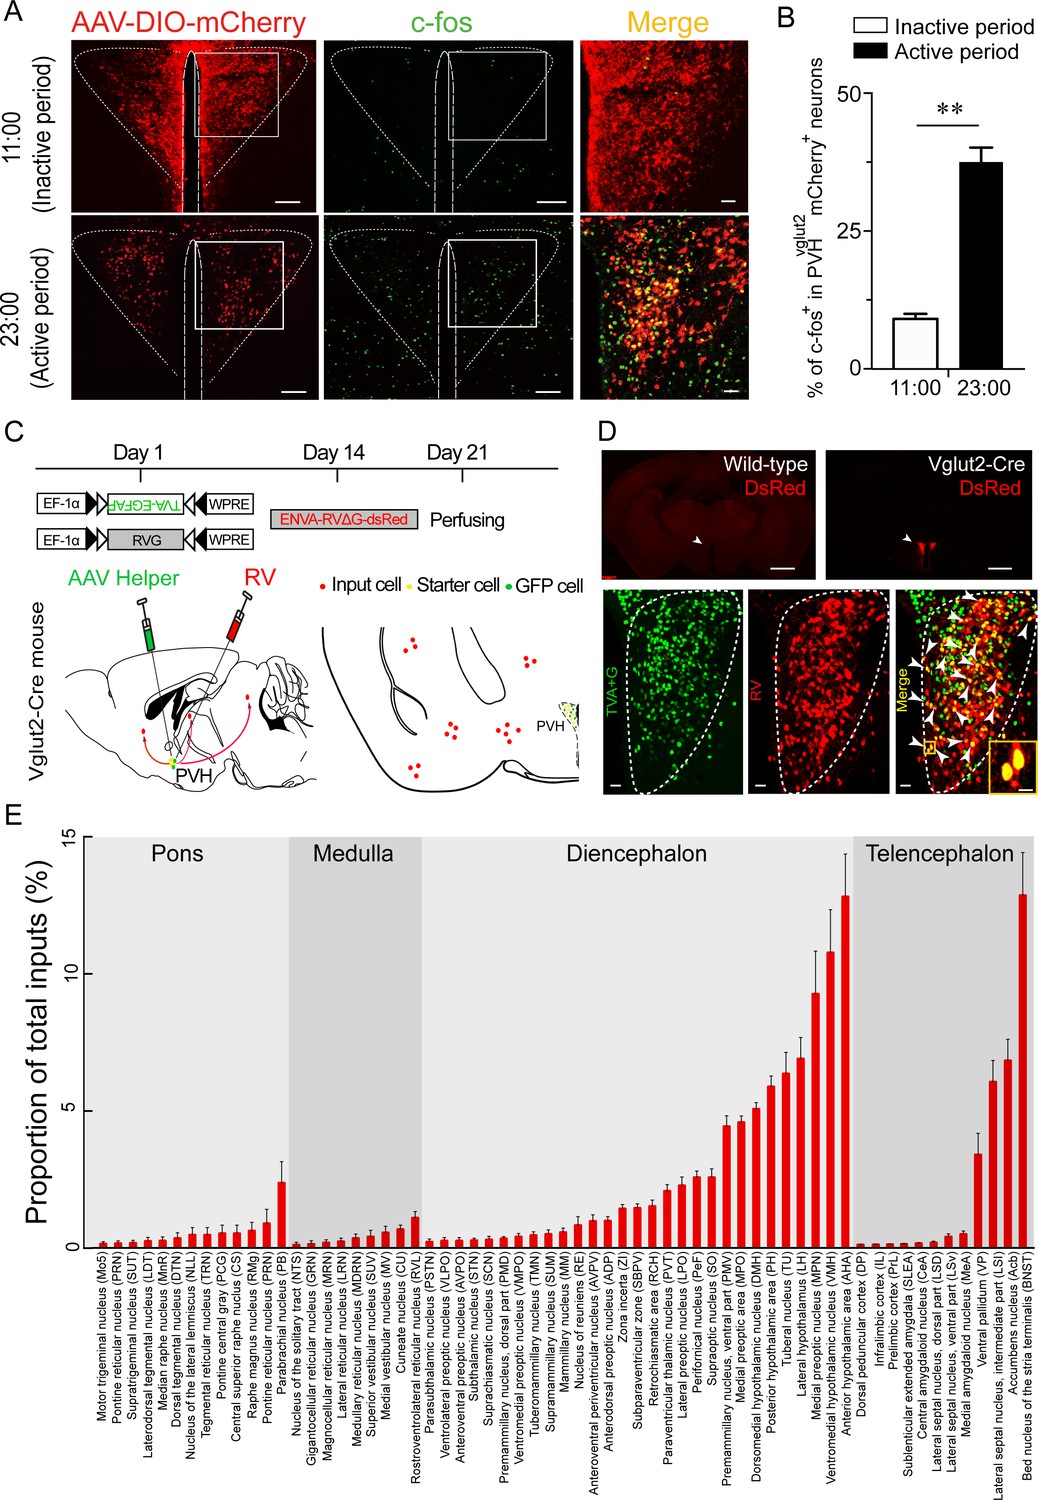
C-fos expression during the inactive period versus during the active period and RV retrograde tracing in PVHvglut2 neurons.
(A) Representative images showing co-expression of mCherry in the PVHvglut2 neurons (red) with c-fos immunostaining (green). The merged image is shown in the right panel (yellow). Scale bars: 200 μm. (B) The percentage of c-fos+ neurons in PVHvglut2 mCherry+ neurons during the inactive period (11:00) versus during the active period (23:00) (n = 5, unpaired t test). Data represented as mean ± SEM (**p < 0.01). (C) Experimental procedure of RV retrograde tracing in PVHvglut2 neurons. Top: experimental timeline for injecting Cre-dependent helper viruses into the PVH of vglut2Cre mice. Bottom left: a schematic of unilateral microinjection into the PVH in vglut2Cre mice; Bottom right: a schematic drawing showing a brain section of the anatomical site and viral infection in the PVH. (D) Top: typical fluorescence images showing RV only labelled in vglut2Cre mice (top left) rather than in wild-type mice (top right). Scale bar: 500 μm. White arrows indicate the PVH area. Bottom: Fluorescence images showing that the starter cells (yellow) labeled by both helper viruses (green) and RV (red) were restrictedly infected in the unilateral PVH in a vglut2Cre mouse. Scale bar: 50 μm. Highly magnified PVH areas with boxes were enlarged and merged in the right panel. Scale bars: 20 μm. (E) Percentage of whole-brain, monosynaptic inputs to PVHvglut2 neurons. Red columns with different length represent the proportion (or intensity) of inputs. Data represented as mean ± SEM (n = 4 mice).
-
Figure 1—source data 1
C-fos expression and RV retrograde tracing of PVHvglut2 neurons.
- https://cdn.elifesciences.org/articles/69909/elife-69909-fig1-data1-v2.xlsx
Figure 1—figure supplement 1
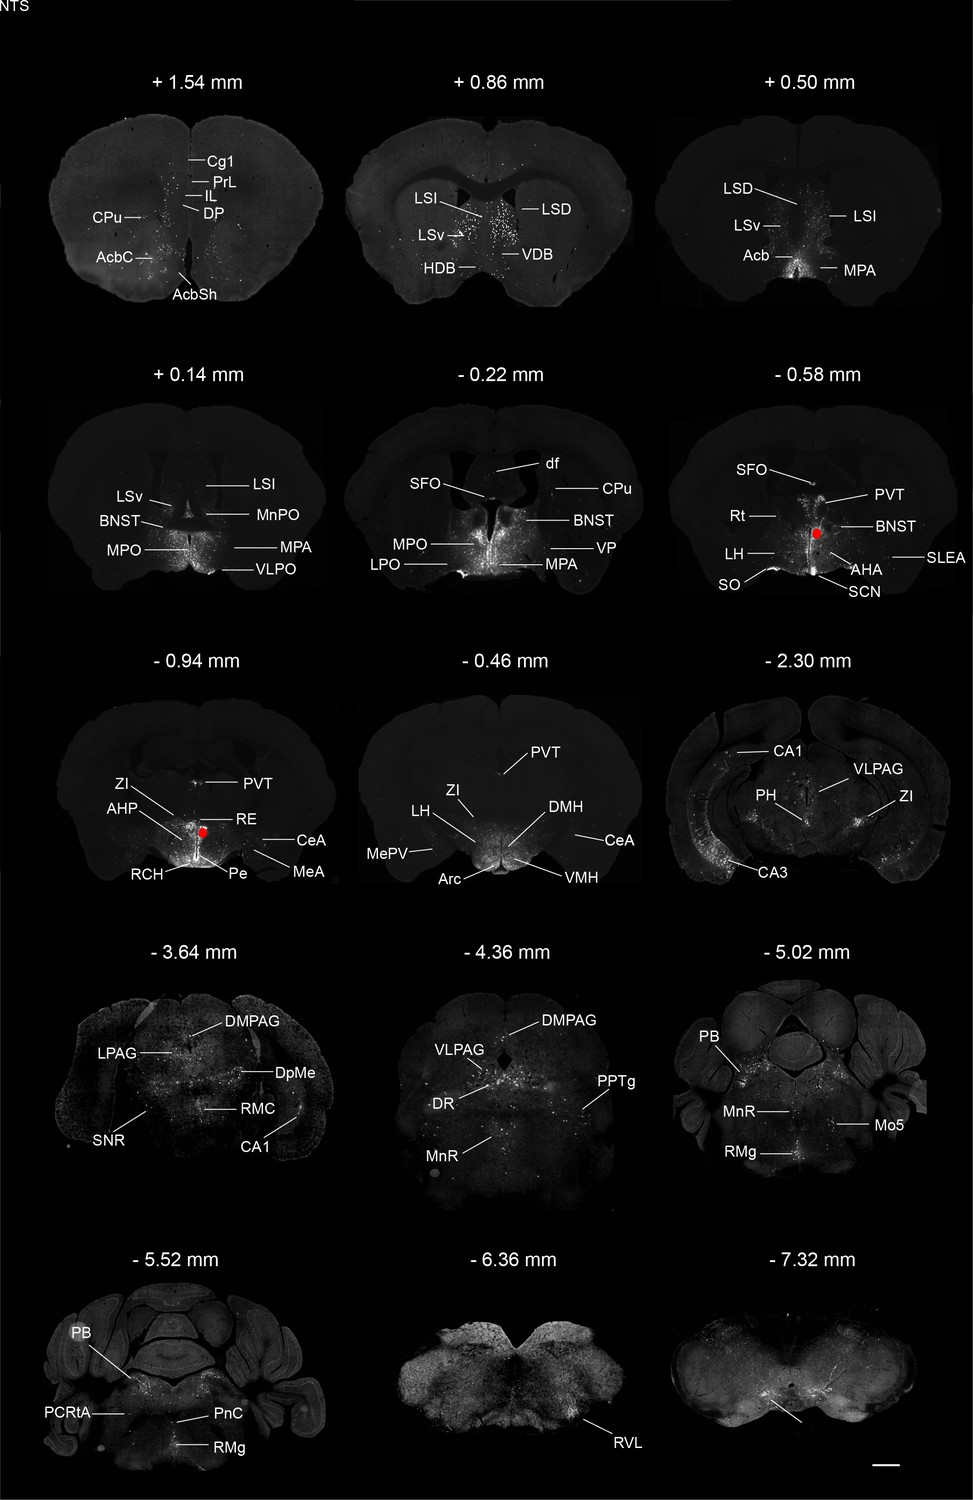
Monosynaptic inputs to PVHvglut2 neurons.
Typical brain sections showing the source of monosynaptic afferents to PVHvglut2 neurons. The RV infection sites were marked by red rounds. Abbreviations of the brain regions used are as follows: Cg1, cingulate Cg1, cortex, area 1; PrL, prelimbic cortex; IL, infralimbic cortex; DP, dorsal peduncular cortex; CPu, caudate putamen; AcbC, accumbens nucleus, core; Acbsh, accumbens nucleus, shell; LSI, lateral septal nucleus, intermediate part; LSv, lateral septal nucleus, ventral part; LSD, lateral septal nucleus, dorsal part; VDB, nucleus of the vertical limb of the diagonal band; HDB, nucleus of the horizontal limb of the diagonal band; Acb, accumbens nucleus; MPA, medial preoptic area; MPO, medial preoptic nucleus; MnPO, median preoptic nucleus; BNST, bed nucleus of the stria terminalis; VLPO, ventrolateral preoptic nucleus; SFO, subfornical organ; LPO, lateral preoptic area; df, dorsal fornix; VP, ventral pallidum; PVT, paraventricular thalamic nucleus; Rt, reticular thalamic nucleus; LH, lateral hypothalamus; AHA, anterior hypothalamic area, anterior part; SO, supraoptic nucleus; SCN, suprachiasmatic nucleus; SLEA, sublenticular extended amygdala; ZI, zona incerta; RCH, retrochiasmatic area; RE, reuniens thalamic nucleus; Pe, periventricular hypothalamic nucleus; CeA, central amygdaloid nucleus; MeA, medial amygdaloid nucleus; AHP, anterior hypothalamic area, posterior part; MePV, medial amygdaloid nucleus, posteroventral part; DMH, dorsomedial hypothalamic nucleus, VMH, ventromedial hypothalamic nucleus; CA1, field CA1 of hippocampus; CA3, field CA3 of hippocampus; PH, posterior hypothalamic area; VLPAG, ventrolateral periaqueductal gray; LPAG, lateral periaqueductal gray; DMPAG, dorsomedial periaqueductal gray; DpMe, deep mesencephalic nucleus; RMC, red nucleus, magnocellular part; SNR, substantia nigra, reticular part; DR, dorsal raphe nucleus; PPTg, pedunculopontine tegmental nucleus; MnR, median raphe nucleus; PB, parabrachial nucleus; Mo5, motor trigeminal nucleus; RMg, raphe magnus nucleus; PCRtA, parvicellular reticular nucleus, alpha part; PnC, pontine reticular nucleus, caudal part; RVL, rostroventrolateral reticular nucleus; NTS, nucleus of the solitary tract. Scale bar: 500 μm.
Figure 2
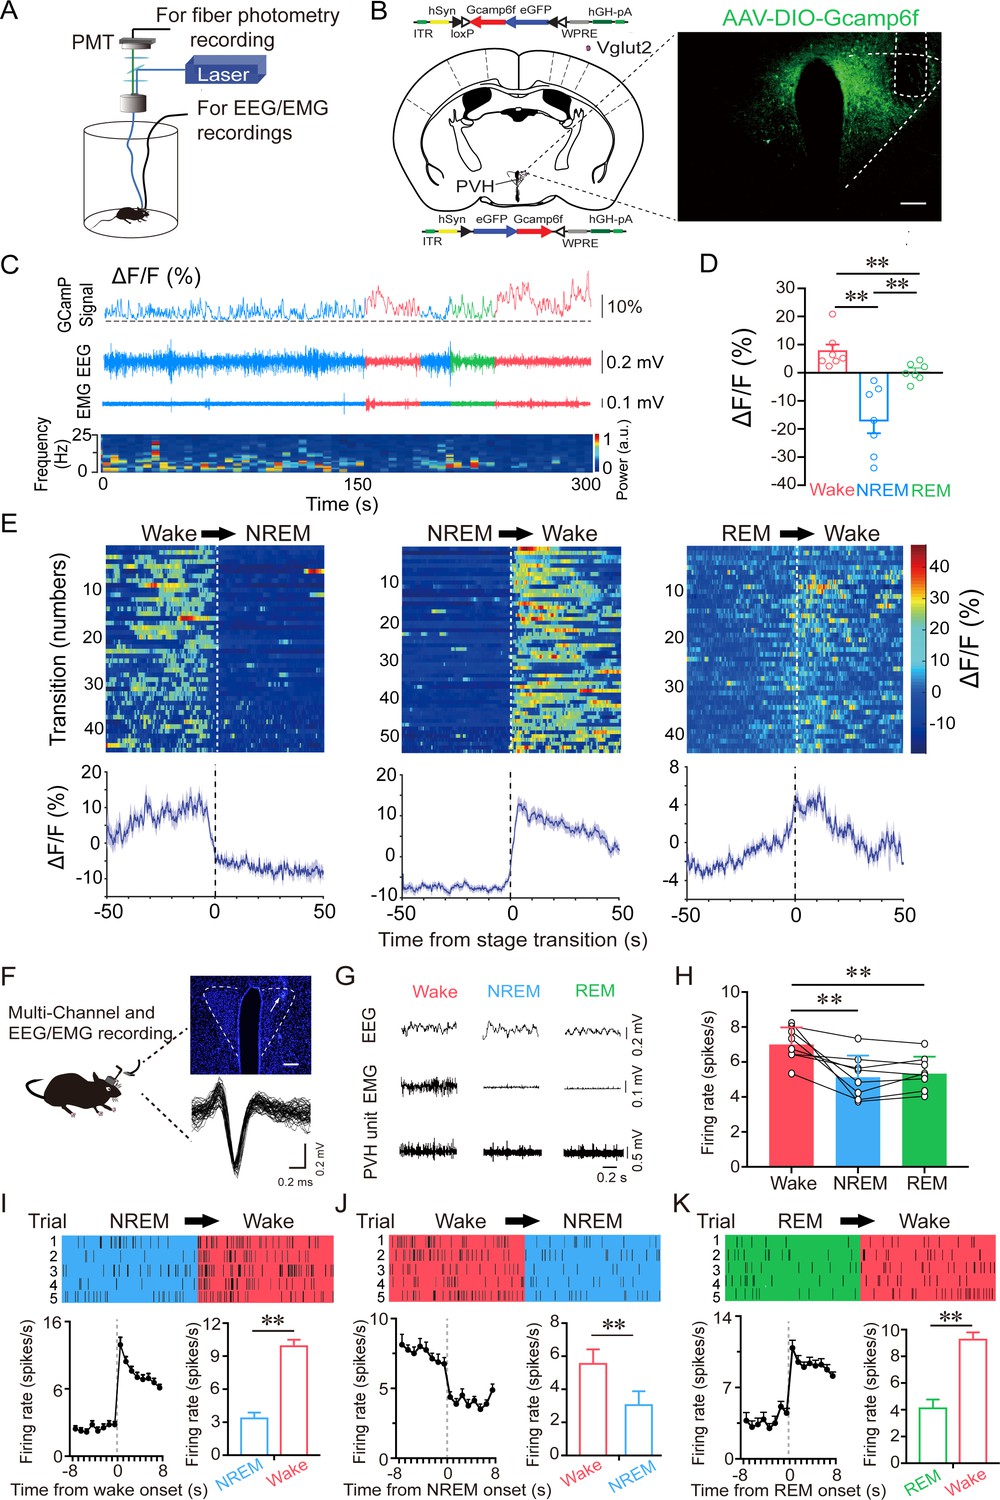
PVHvglut2 neurons are preferentially active during wakefulness.
(A) Schematic of the fiber photometry setup and in vivo recording configuration (DM dichroic mirror, PMT photomultiplier tube). (B) Unilateral viral targeting of AAV-EF1α-DIO-GCaMP6f into the PVH, in which the tip of the fiber optic is above the PVH. Scale bar: 200 μm. (C) Representative fluorescent traces, relative EEG power, and EEG/EMG traces across spontaneous sleep–wake states. ΔF/F represents the change in fluorescence from the median of the entire time series. (D) Fluorescence (mean ± SEM) during wakefulness, NREM sleep, and REM sleep from three mice; the fluorescent signal was the highest during wakefulness, intermediate during REM, and the lowest during NREM sleep (7 sessions from 3 mice, one-way ANOVA followed by Tukey’s post-hoc tests; F6,12 = 2.94, p< 0.001; p [wake vs NREM] < 0.001, p [wake vs REM] < 0.001, p [NREM vs REM] = 0.013). (E) Fluorescent signals aligned to sleep–wake transitions. Upper panel: Individual transitions with color-coded fluorescent intensities (NREM to wake, n = 54; wake to NREM, n = 45; REM to wake, n = 44). Lower panel: Mean (blue trace)± SEM (gray shading) showing the average calcium transients from all the transitions. (F) Schematic configuration of in vivo multichannel electrophysiological recordings. Upper panel: A brain slice from a mouse with electrodes implanted in the PVH. White arrow indicates the electrode track. Scale bar: 200 μm. Lower panel: Waveforms from a recorded PVH neuron. (G) EEG/EMG and PVH multi-unit recording traces during wakefulness, NREM sleep, and REM sleep. (H) Average firing rates of PVH neurons during each state (n = 8 cells from 3 mice, one-way repeated-measures ANOVA followed by LSD post hoc tests; F2,14 = 12.51, p [NREM vs wake] < 0.001, p [wake vs NREM] < 0.01, p [NREM vs REM] = 0.613). (I–K) Firing rates of PVH neurons during state transitions: NREM to wake (I), wake to NREM (J), and REM to wake transitions (K). Top: Example rastergrams of a PVH neuron during five trials of different state transitions. Bottom left: Average firing rate during the state-transition period. Bottom right: Average firing rate during 8 s before and after state transitions (p [NREM to wake] < 0.01, p [wake to NREM] < 0.01, p [REM to wake] < 0.01, paired t test). Data represented as mean ± SEM ( **p < 0.01).
-
Figure 2—source data 1
In vivo fiber photometry and multichannel electrophysiological recordings of PVHvglut2 neurons.
- https://cdn.elifesciences.org/articles/69909/elife-69909-fig2-data1-v2.xlsx
Figure 3 with 2 supplements
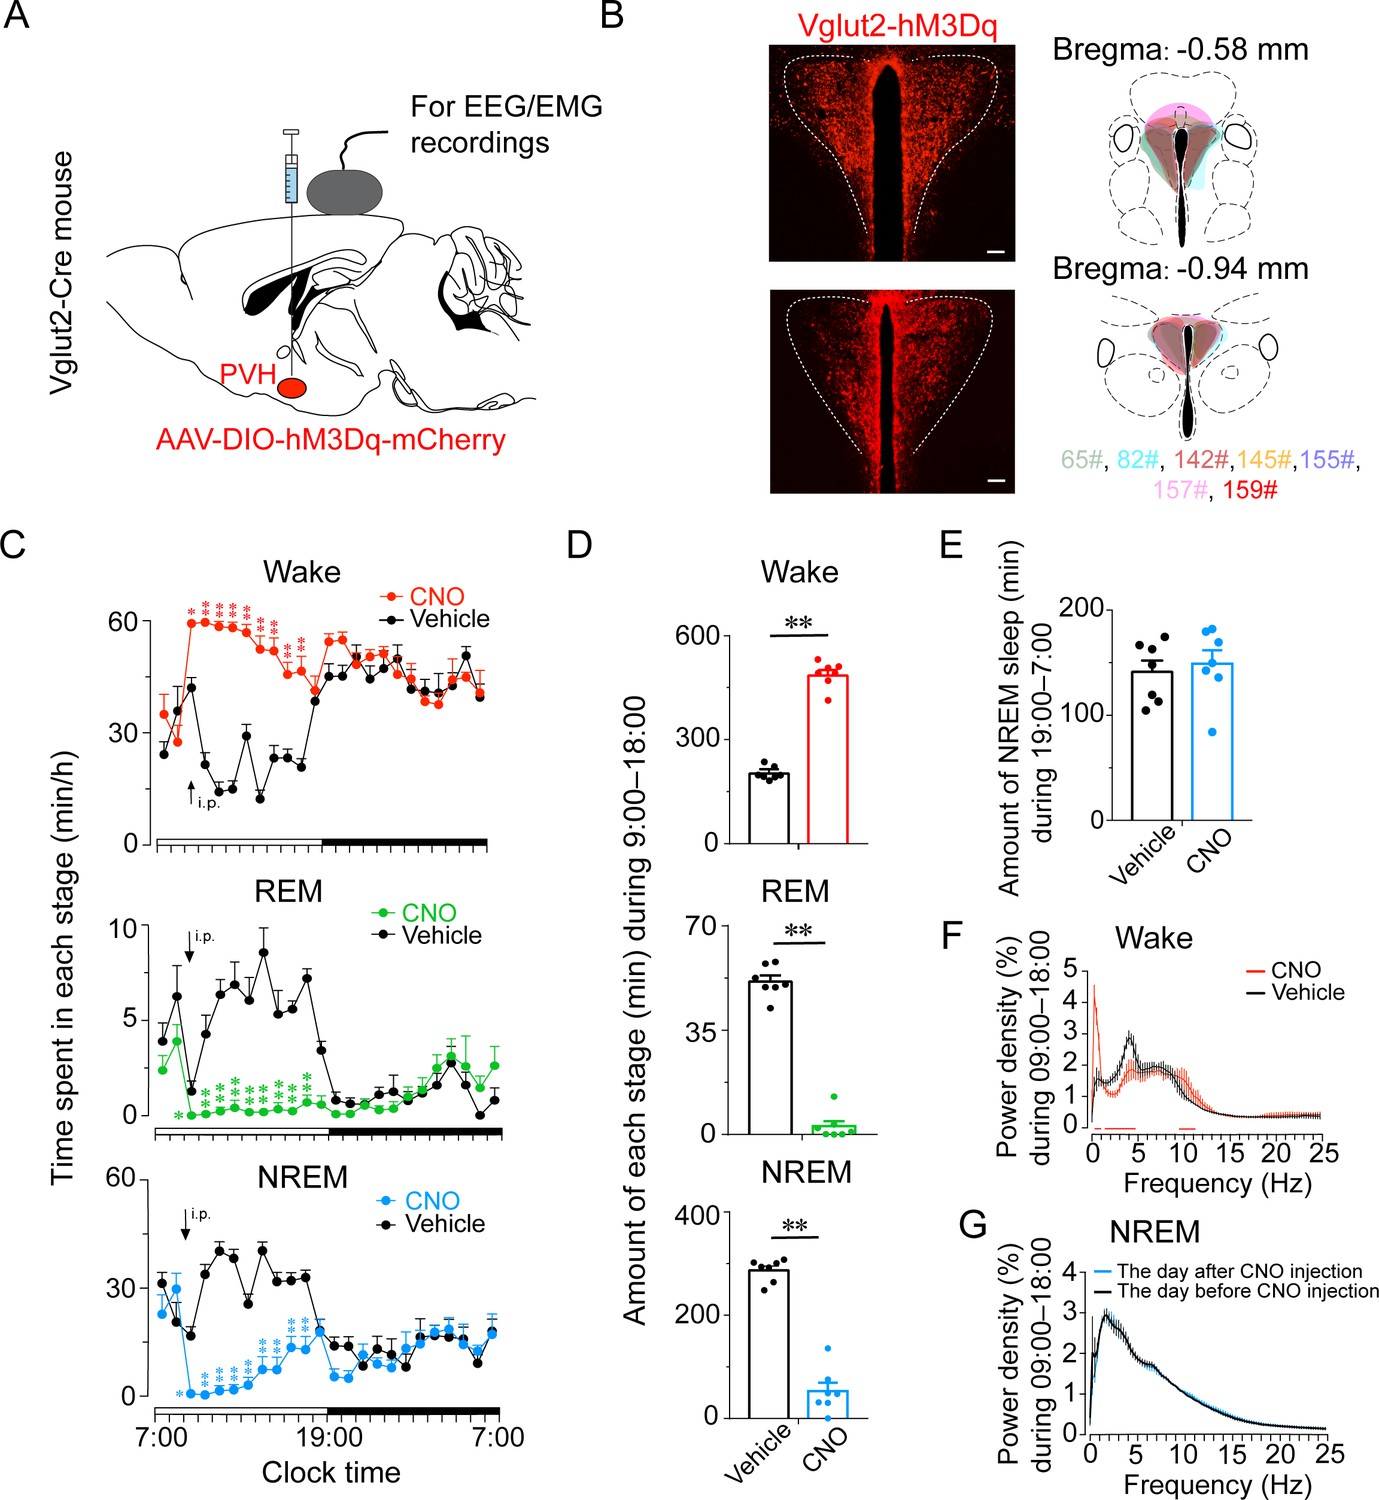
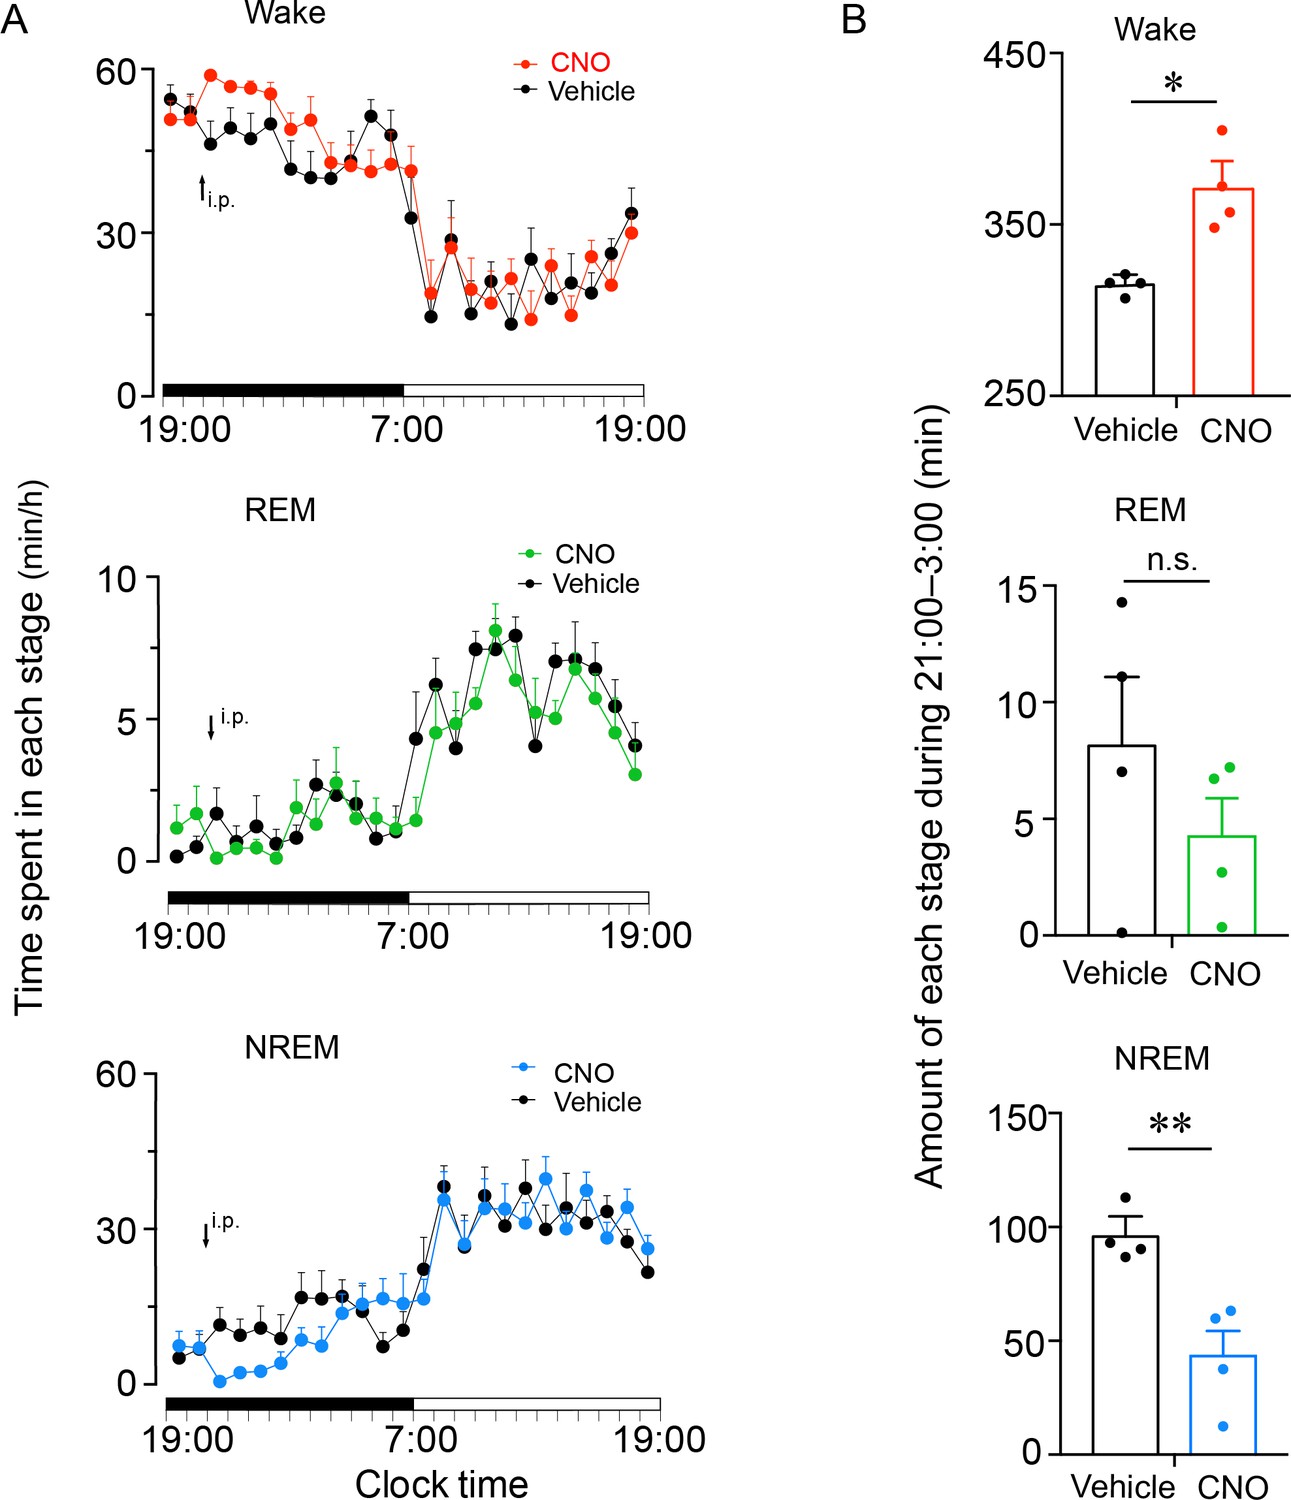
Chemogenetic activation of PVHvglut2 increases wakefulness.
(A, B) Expression of the AAV injection site in the PVH of vglut2Cre mice. Drawings of overlay mCherry expressing sites in the PVH of vglut2Cre mice (n = 7, indicated with different colors). (C) Time-course changes in wakefulness, NREM sleep, and REM sleep after administration of vehicle or CNO in mice expressing hM3Dq in PVHvglut2 neurons (n = 7, repeated-measures ANOVA; F1,12 = 87.09 [wake], 63.61 [NREM], 612.30 [REM]; p < 0.001 [wake], p < 0.001 [NREM], p < 0.001 [REM]). (D) Total time spent in each stage after vehicle or CNO injection into vglut2Cre mice (n = 7, paired t test; p < 0.001 [wake], p < 0.001 [NREM], p < 0.001 [REM]). (E) Total time spent in NREM sleep during the dark period after vehicle or CNO injection (n = 7, p > 0.05, paired t test). (F) EEG power density of wakefulness during 9 hr after vehicle or CNO injection (n = 5; p < 0.05, paired t test). (G) EEG power density of NREM sleep during the day (7:00–18:00) before/after the day of CNO injection (n = 5, p > 0.05, paired t test). Data represented as mean ± SEM (*p < 0.05, **p < 0.01, n.s. means no significant difference).
-
Figure 3—source data 1
Time spent in each stage of PVHvglut2-M3 mice after administration of CNO or saline during the light phase.
- https://cdn.elifesciences.org/articles/69909/elife-69909-fig3-data1-v2.xlsx
-
Figure 3—source data 2
Time spent in each stage of PVHvglut2 mice after administration of CNO or saline during the dark phase.
- https://cdn.elifesciences.org/articles/69909/elife-69909-fig3-data2-v2.xlsx
-
Figure 3—source data 3
Heart rate, temperature, serum CRH and CORT levels of PVHvglut2-M3 mice.
- https://cdn.elifesciences.org/articles/69909/elife-69909-fig3-data3-v2.xlsx
Figure 3—figure supplement 1
Chemogenetic activation of PVHvglut2 neurons during the dark phase increases wakefulness.
(A) Time course of wakefulness, NREM sleep, and REM sleep following injection of vehicle or CNO during the dark phase in mice expressing hM3Dq receptor in PVHvglut2 neurons (n = 4). Statistical significance was determined using repeated-measures ANOVA. p > 0.05. (B) Total time spent in each stage for 6 hr after vehicle or CNO injection (n = 4). Statistical significance was determined using a paired t test. Data represented as the mean ± SEM (*p < 0.05, **p < 0.01). n.s. denotes not significant.
Figure 3—figure supplement 2
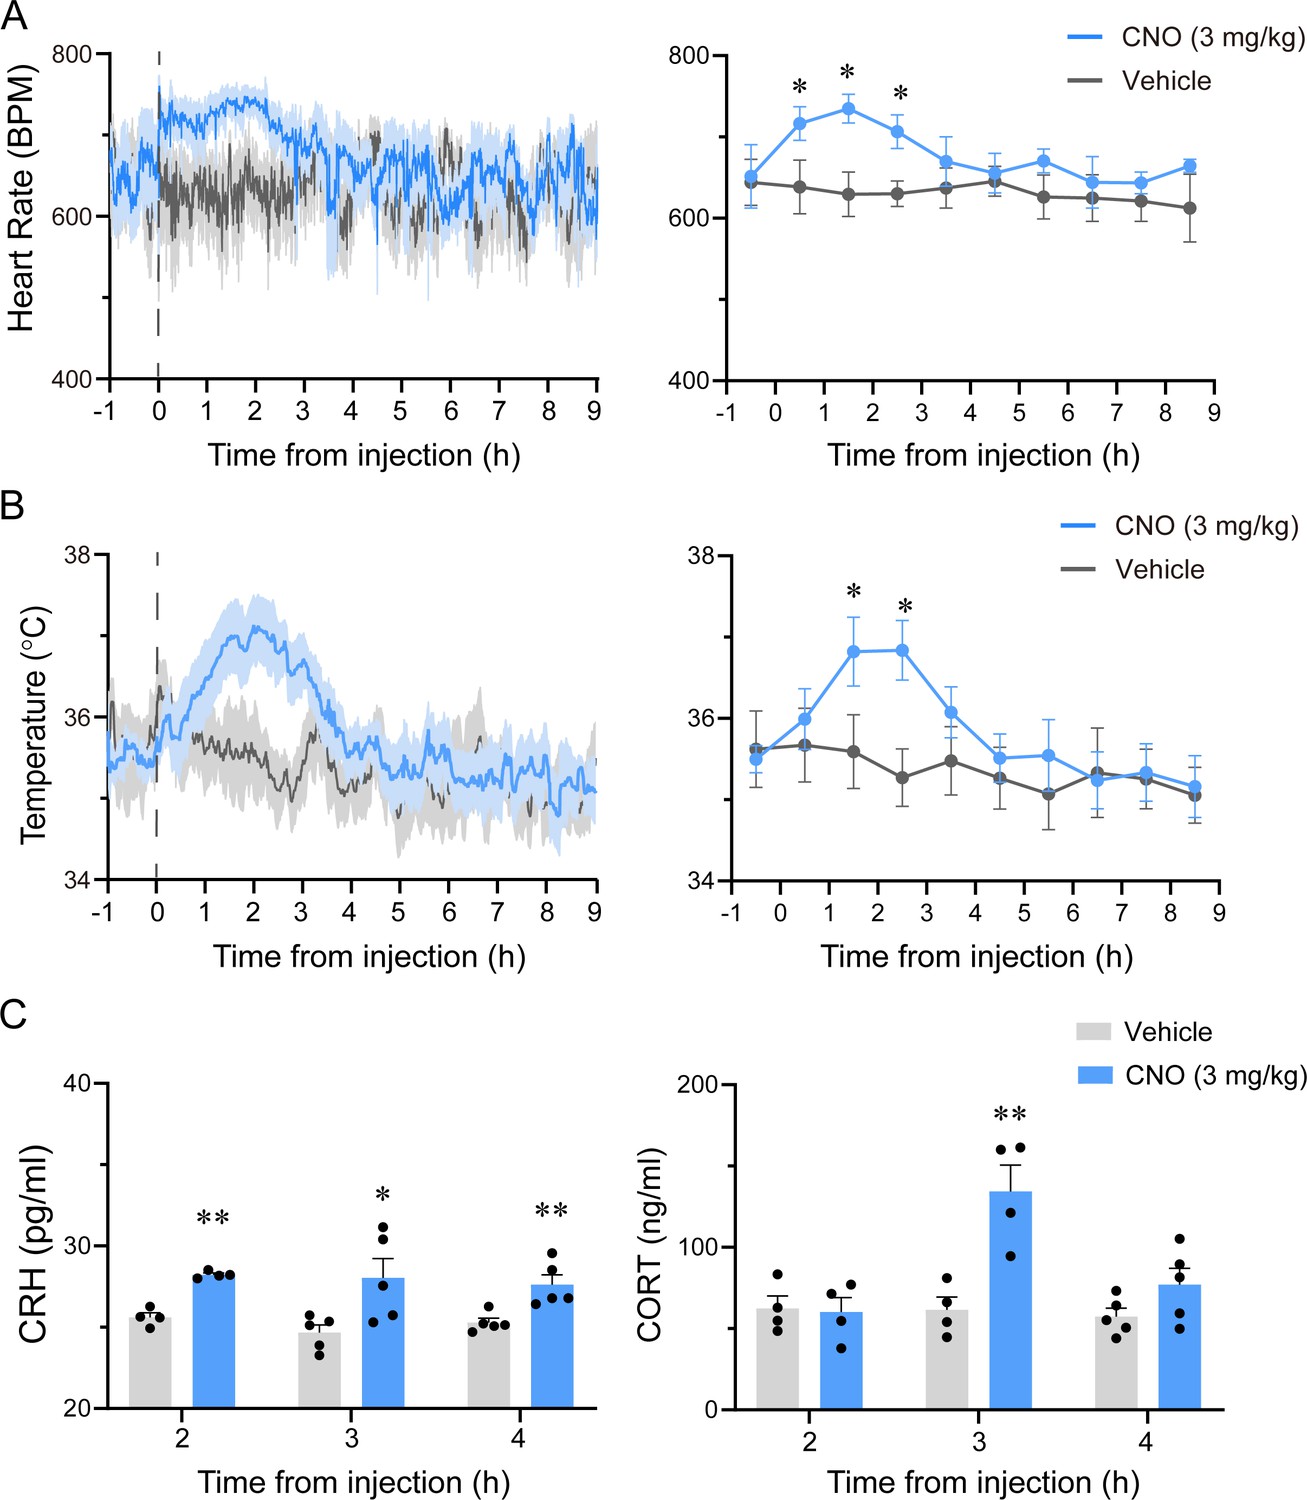
Autonomic and endocrine changes after chemogenetic activation of PVHvglut2 neurons.
(A, B) Simultaneous monitoring of heart rate (A) and temperature (B) with implantable telemetry after administration of vehicle or CNO in freely moving mice. Left panel: Mean ± SEM of heart rate and body temperature sampling every 20 s. Right panel: Hourly mean ± SEM of heart rate and body temperature (n = 5, repeated-measures ANOVA; F1,8 = 4.52 [heart rate], 16.36 [temperature]). (C) Serum CRH (left) and CORT (right) levels following vehicle or CNO administration. Statistical comparisons were conducted using two-way ANOVA followed by post hoc Tukey tests. Data represented as mean ± SEM (n = 4–5), *p < 0.05, **p < 0.01. n.s. denotes no significant difference between two groups.
Figure 4
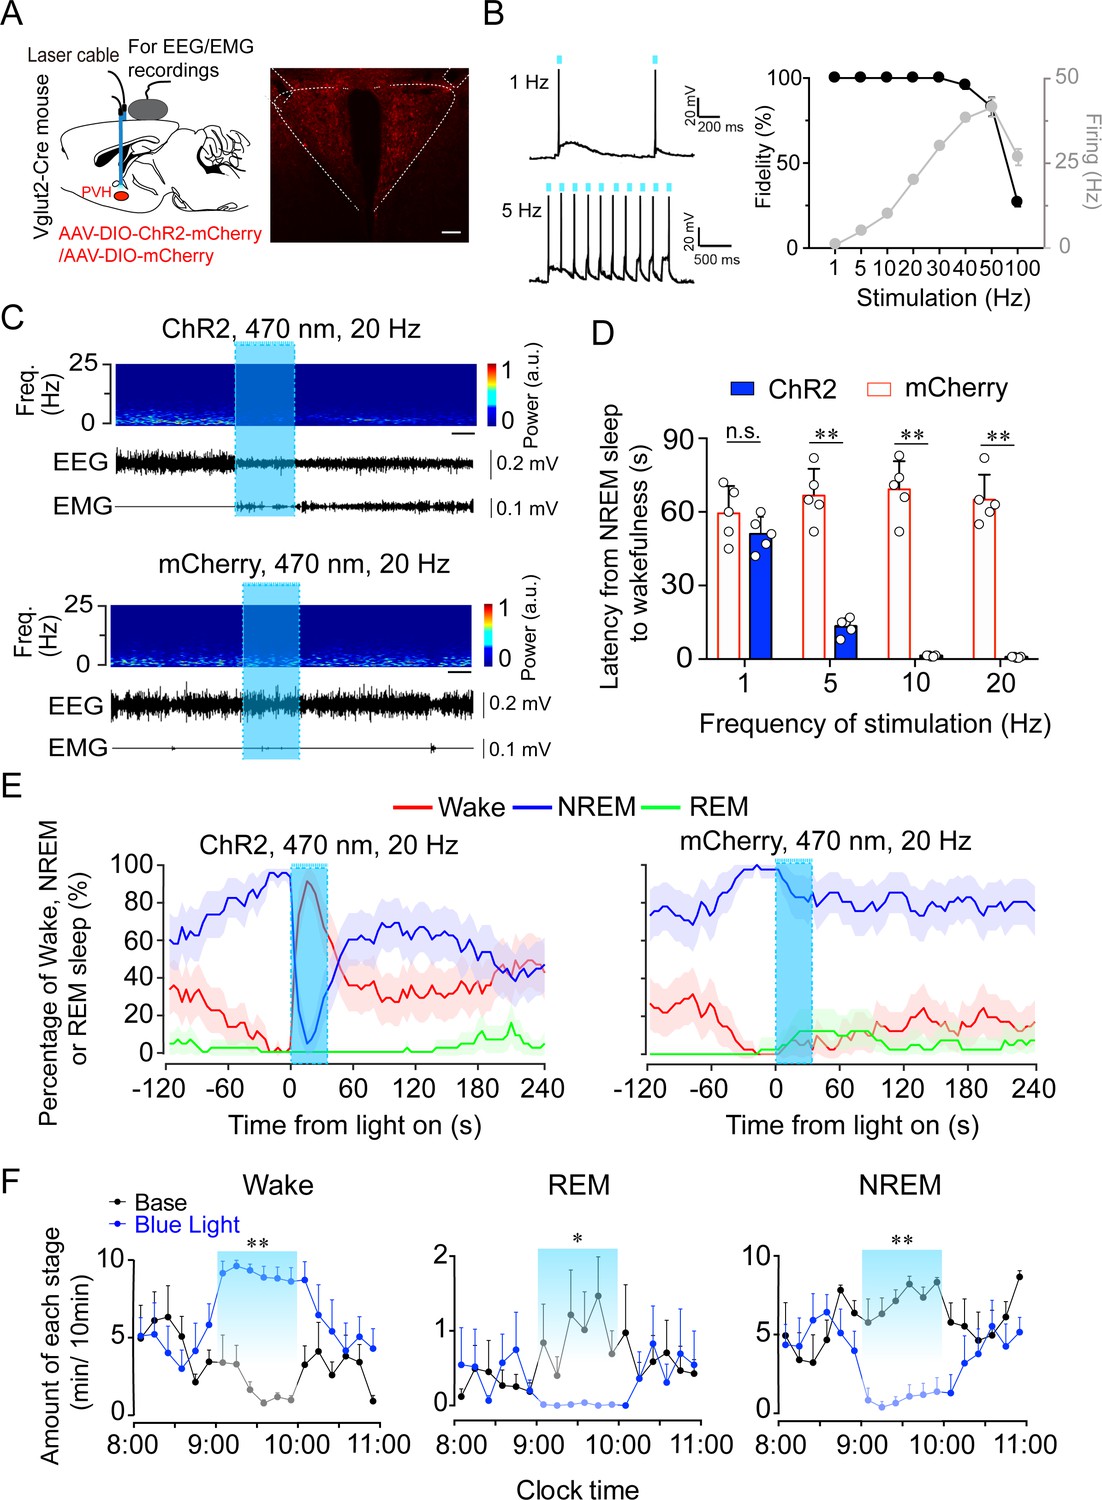
Optogenetic activation of PVHvglut2 neurons induces a rapid transition from NREM sleep to wakefulness.
(A) Left: Schematic of optogenetic manipulation of PVHvglut2 neurons and EEG/EMG recordings. Right: ChR2-mCherry expression and location of optical fiber in the PVH. Scale bar: 200 μm. (B) Example traces (left) and fidelity of action potential firing (right) of ChR2-expressing PVH neurons evoked by 473 nm light stimulation with different frequencies. (C) Representative EEG/EMG traces, and heatmap of EEG power spectra showing that acute photostimulation (20 Hz/10 ms) applied during NREM sleep induced a transition to wakefulness in a ChR2-mCherry mouse. Scale bar: 10 s. (D) Latencies of transitions from NREM sleep to wakefulness after photostimulation at different frequencies (n = 5, unpaired t test; 1 Hz, t8 = 1.4, p = 0.19; 5 Hz, t8 = 10.29, p < 0.01; 10 Hz, t8 = 13.3, p < 0.01; 20 Hz, t8 = 14.04, p < 0.01). (E) Sleep stage after blue-light stimulation in a PVH-vglut2-ChR2 mouse or PVH-vglut2-mCherry mouse. Percentages of NREM, REM, and wakefulness during short-stimulation experiments. (F) Time course during semi-chronic optogenetic experiments (20 Hz/10 ms, 25 s on /35 s off). The blue column indicates the photostimulation period of the stimulation group (n = 5, repeated-measures ANOVA; F1,8 = 59.37 (wake), 18.20 (REM), 103.30 (NREM); p < 0.001 [wake], p = 0.003 [REM], p < 0.001 [NREM]). Data represented as the mean ± SEM (*p < 0.05, **p < 0.01).
-
Figure 4—source data 1
Latencies of transitions and time course in semi-chronic optogenetic experiments of PVHvglut2-ChR2 mice.
- https://cdn.elifesciences.org/articles/69909/elife-69909-fig4-data1-v2.xlsx
Figure 5 with 2 supplements
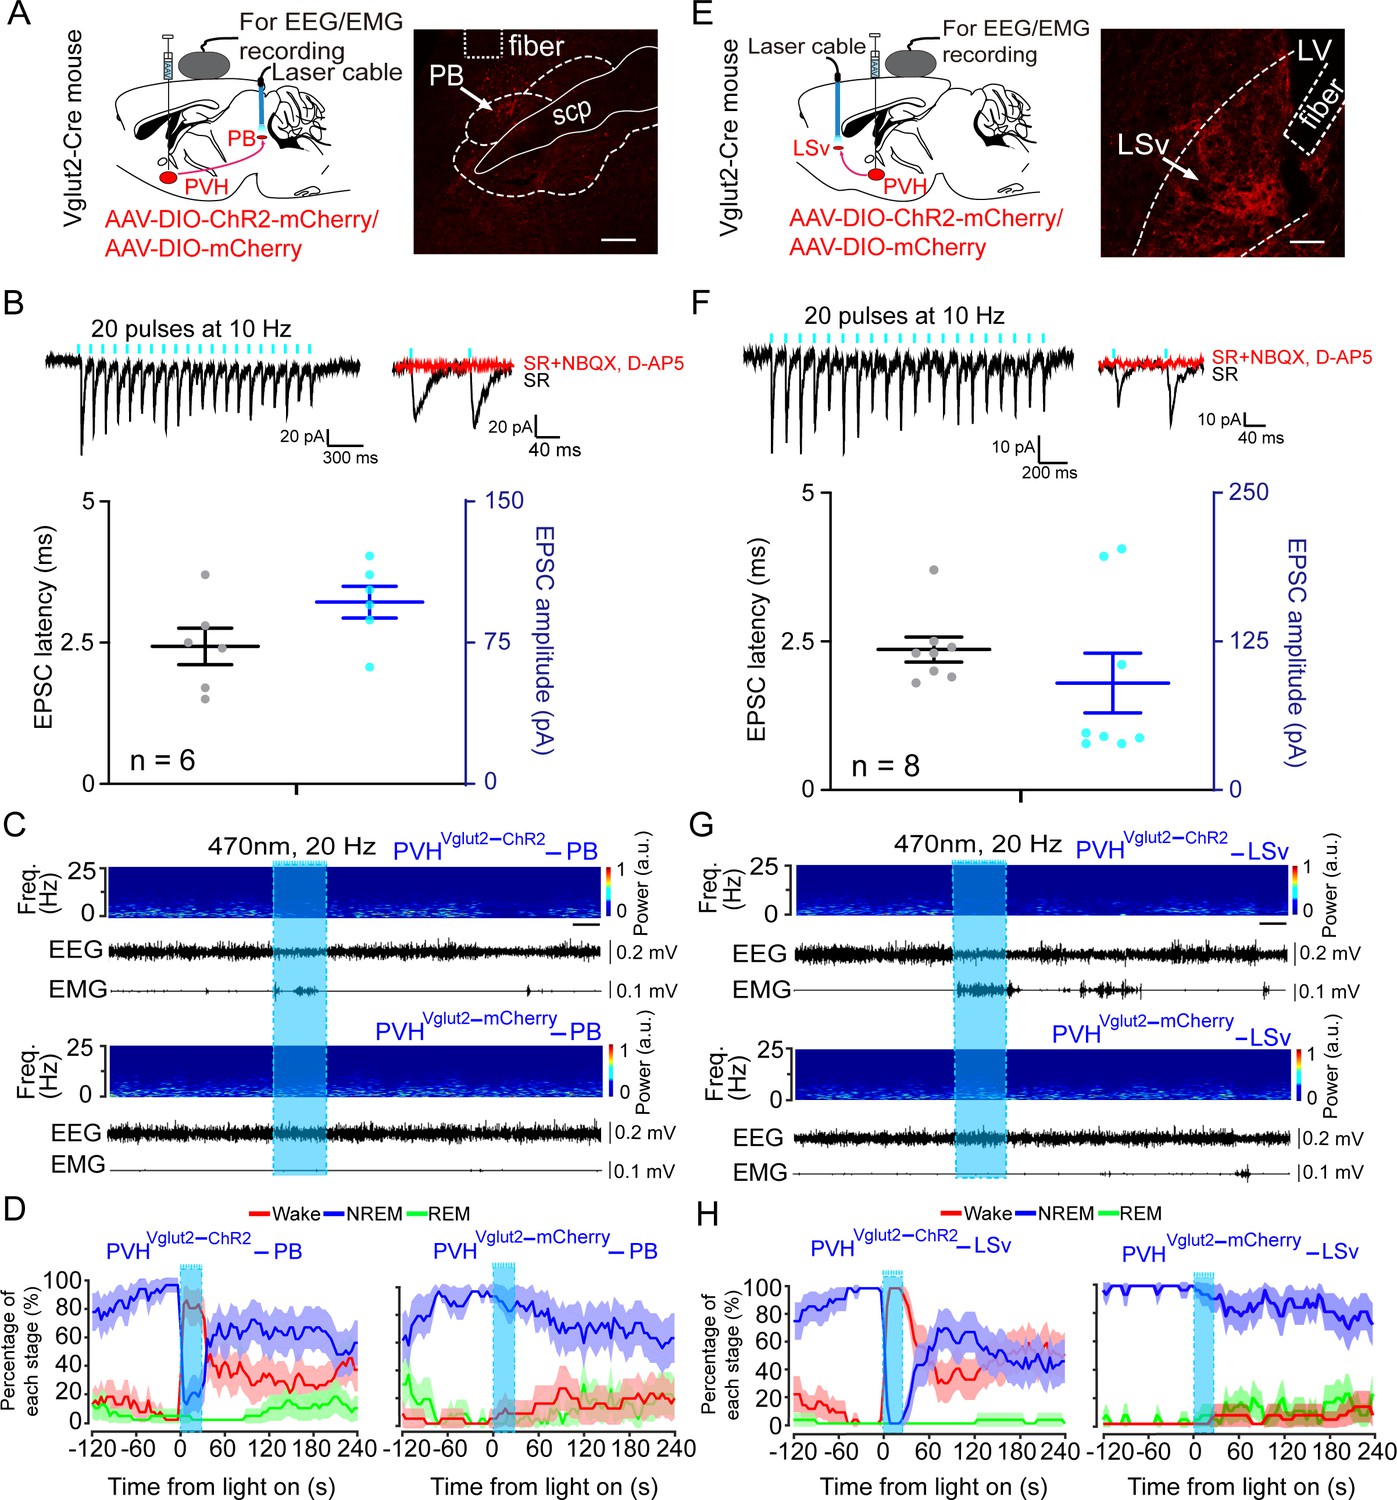
PVHvglut2 neurons control arousal through PB and LSv pathways.
(A, E) Left: Schematic diagram showing the location of the optic fiber in the PB and LSv, and EEG/EMG recordings of a vglut2Cre mouse bilaterally injected with AAV-ChR2-mCherry or AAV-mCherry in the PVH. Right: Brain section stained against mCherry to confirm that ChR2 protein expressed in the PVH. Superior cerebellar peduncle, scp. Scale bar: 200 μm. (B, F) Upper-left panel: Photostimulation-evoked EPSCs in PB neurons (B) and LSv neurons (F). Upper-right panel: Photostimulation-evoked EPSCs were completely blocked in the presence of NBQX (20 μM) and D-AP5 (25 μM). Lower panel: Latency (left axis) and amplitude (right axis) of light-evoked EPSCs in PB neurons (B) and LSv neurons (F). (C, G) Representative EEG/EMG traces, and a heatmap of EEG power spectra showing that acute photostimulation (20 Hz/10 ms) of PVH-PB (C) and PVH-LSv (G) pathways during NREM sleep induced a transition to wakefulness in a ChR2-mCherry mouse. Scale bar: 10 s. (D, H) Sleep stages after blue-light stimulation of PVH-PB (D) and PVH-LSv (H) pathways in ChR2-mCherry mice or mCherry control mice.
-
Figure 5—source data 1
Statistical analysis of whole-brain outputs from PVHvglut2 neurons.
- https://cdn.elifesciences.org/articles/69909/elife-69909-fig5-data1-v2.docx
-
Figure 5—source data 2
In vitro photostimulation-evoked EPSCs in PB and LSv neurons.
- https://cdn.elifesciences.org/articles/69909/elife-69909-fig5-data2-v2.xlsx
Figure 5—figure supplement 1
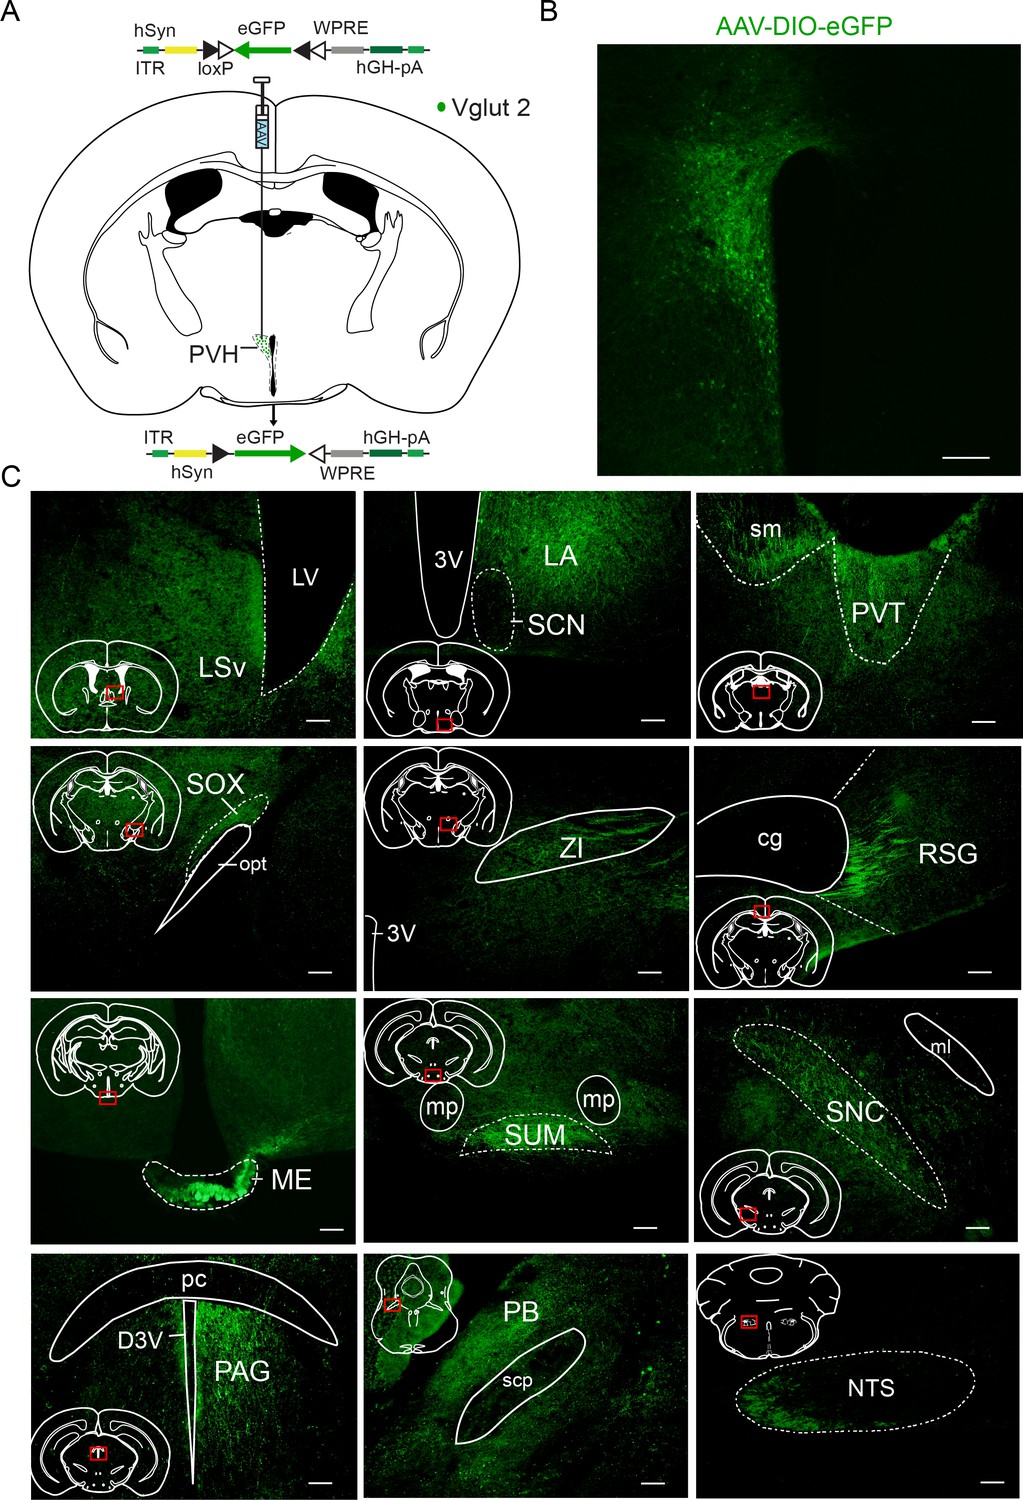
Representative regions with axonal projection from PVHvglut2 neurons.
(A) Schematic of the viral vectors and injection site for AAV-hSyn-DIO-eGFP in vglut2Cre mice. (B) Fluorescence images showing the AAV infection area in the PVH of a vglut2Cre mouse. Scale bars: 200 μm. (C) Supramammillary nucleus, SUM; mammillary peduncle, mp; compact parts of substantial nigra, SNC; medial lemniscus, ml; parabrachial nucleus, PB; zone incerta, ZI; nucleus of the solitary tract, NTS. Supraoptic decussation, SOX; optic tract, opt; paraventricular thalamic nucleus, PVT; stria medullaris of the thalamus, sm; median eminence, ME; periaqueductal gray, PAG; posterior commissure, pc; ventral lateral septal nucleus, LSv; retrosplenial granular cortex, RSG; cingulum, cg; suprachiasmatic nucleus, SCN; lateral anterior hypothalamic nucleus, LA. Scale bars: 50 μm.
Figure 5—figure supplement 2
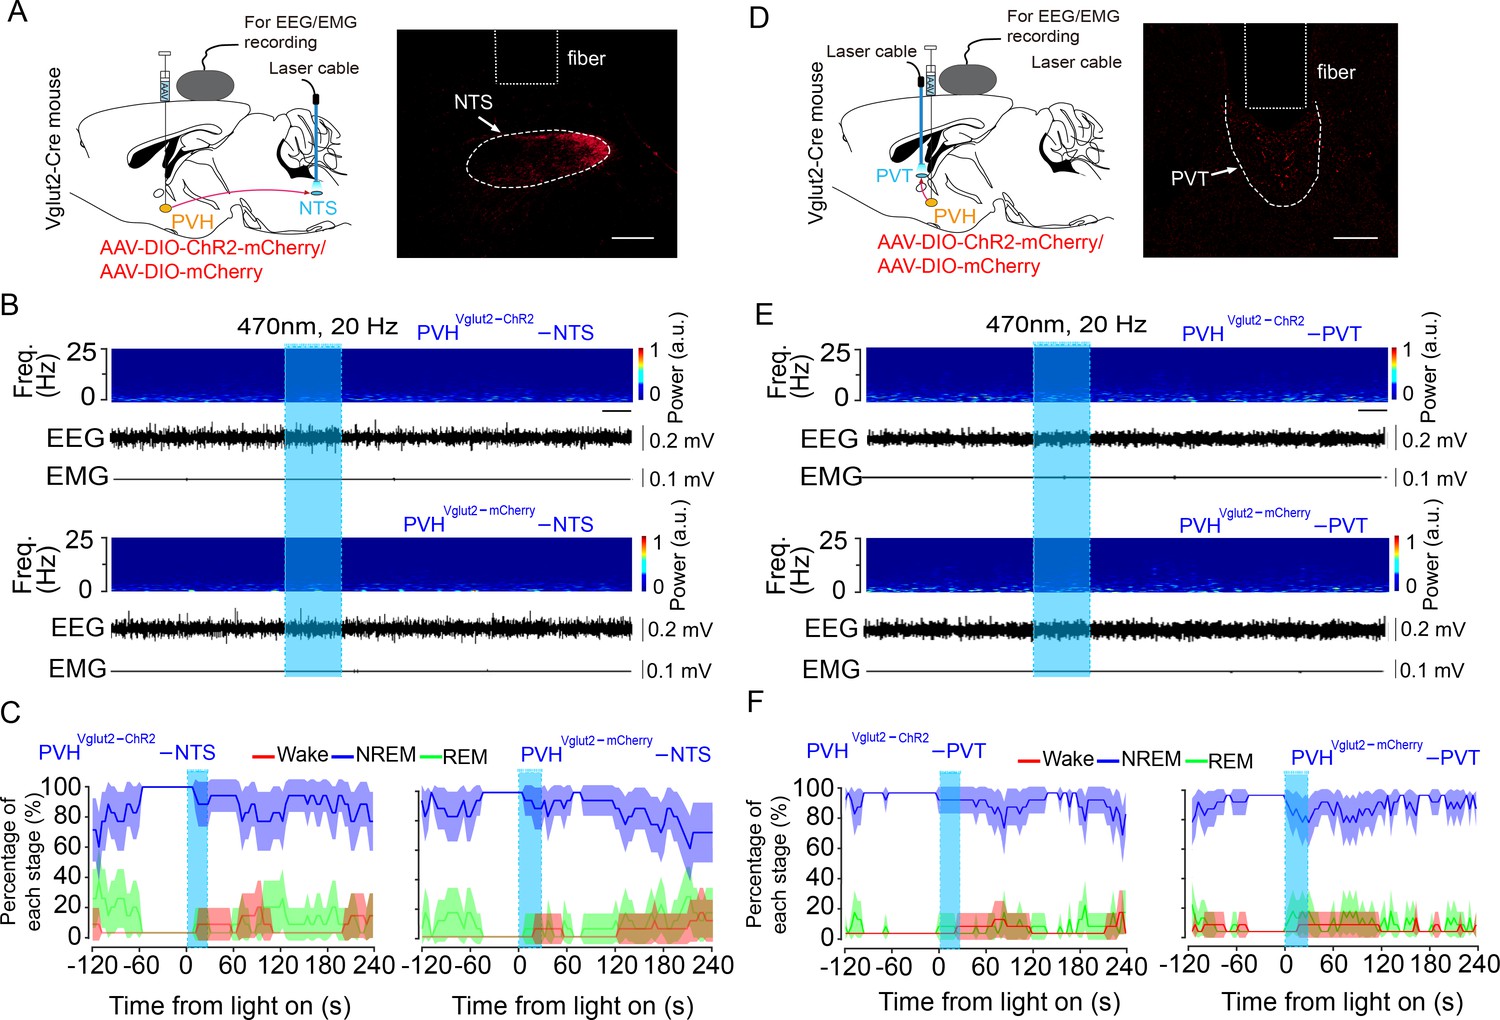
Optogenetic activation of PVHvglut2→NTS or PVHvglut2→PVT pathway has no effect on sleep–wake states.
(A, D) Left: Schematic diagram showing the location of the optic fiber in the NTS or PVT and EEG/EMG recordings of a vglut2Cre mouse injected with AAV-DIO-ChR2-mCherry or AAV-DIO-mCherry in the PVH. Right: The brain section was stained against mCherry to confirm that ChR2 protein was expressed in the PVH. Scale bar: 200 μm. (B, E) Representative EEG/EMG traces and a heatmap of EEG power spectra showing that acute photostimulation (20 Hz/10 ms) applied during NREM sleep did not change the sleep–wake state in a ChR2-mCherry mouse. Scale bar: 10 s. (C, F) Sleep stages after blue-light stimulation in ChR2-mCherry mice or mCherry control mice.
Figure 6
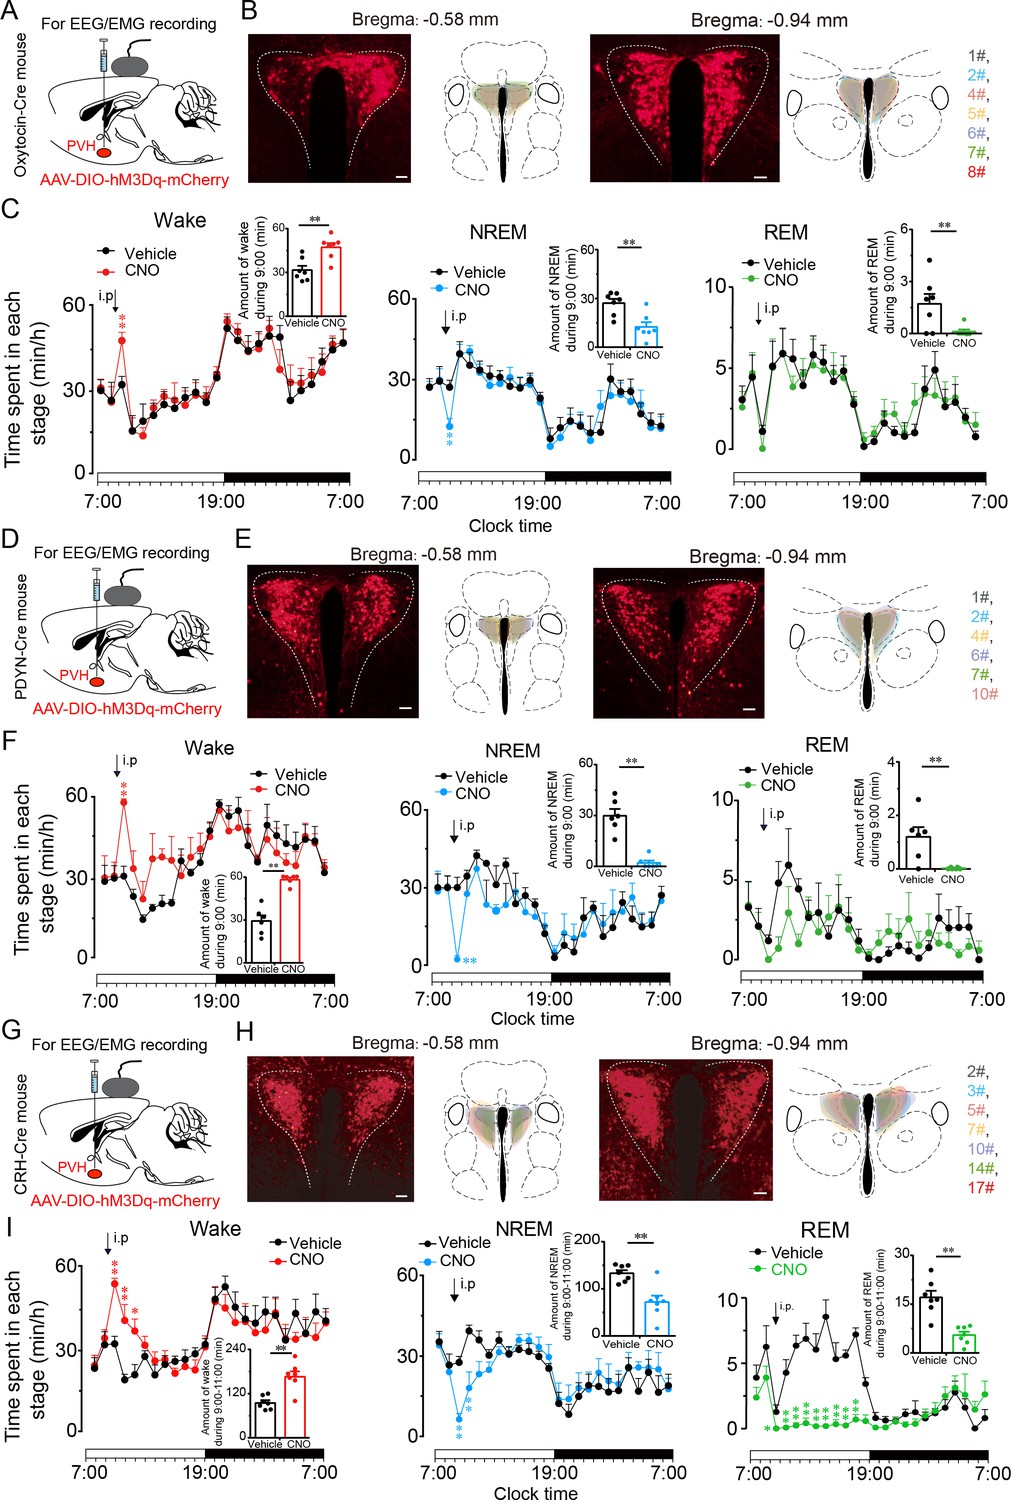
PVHvglut2 neurons exert wakefulness via PVHOT, PVHPDYN and PVHCRH neurons.
(A, D, G) Schematic drawings of the chemogenetic experiment in OTCre mice, PDYNCre mice and CRHCre mice. (B, E, H) Location of hM3Dq expression in PVHOT, PVHPDYN, and PVHCRH neurons. Right panel: Drawings of mCherry expressing sites in the PVH. Scale bars: 200 μm. (C, F, I) Time-course changes in wakefulness, NREM sleep, and REM sleep after administration of vehicle or CNO in mice expressing hM3Dq in PVHOT (C, n = 7, repeated-measures ANOVA; F1, 12 = 0.41 [wake], 0.74 [NREM], 0.02 [REM]; p < 0.05 [wake], p < 0.05 [NREM], p < 0.05 [REM]), PVHPDYN neurons (F, n = 6, repeated-measures ANOVA; F1, 10 = 0.28 [wake], 0.38 [NREM], 0.02 [REM]; p < 0.05 [wake], p < 0.05 [NREM], p < 0.05 [REM]), and PVHCRH neurons (I, n = 7, repeated-measures ANOVA; F1, 12 = 0.06 [wake], 0.01 [NREM], 0.83 [REM]; p < 0.05 [wake], p < 0.05 [NREM], p < 0.05 [REM]). Inset: Total time spent in each stage after vehicle or CNO injection into mice expressing hM3Dq in PVHOT neurons (C, n = 7, paired t test; p = 0.10 [wake], 0.10 [NREM], 0.39 [REM]), PVHPDYN neurons (F, n = 6, paired t test, p < 0.01 [wake], p < 0.01 [NREM], p < 0.01 [REM]), and PVHCRH neurons (I), n = 7, paired t test; p = 0.003 (wake), p = 0.002 (NREM), p = 0.1 (REM). Data represented as the mean ± SEM (**p < 0.01).
-
Figure 6—source data 1
Time spent in each stage of PVHOT-M3 mice, PVHPDYN-M3 mice, and PVHCRH-M3 mice after administration of CNO or saline.
- https://cdn.elifesciences.org/articles/69909/elife-69909-fig6-data1-v2.xlsx
Figure 7
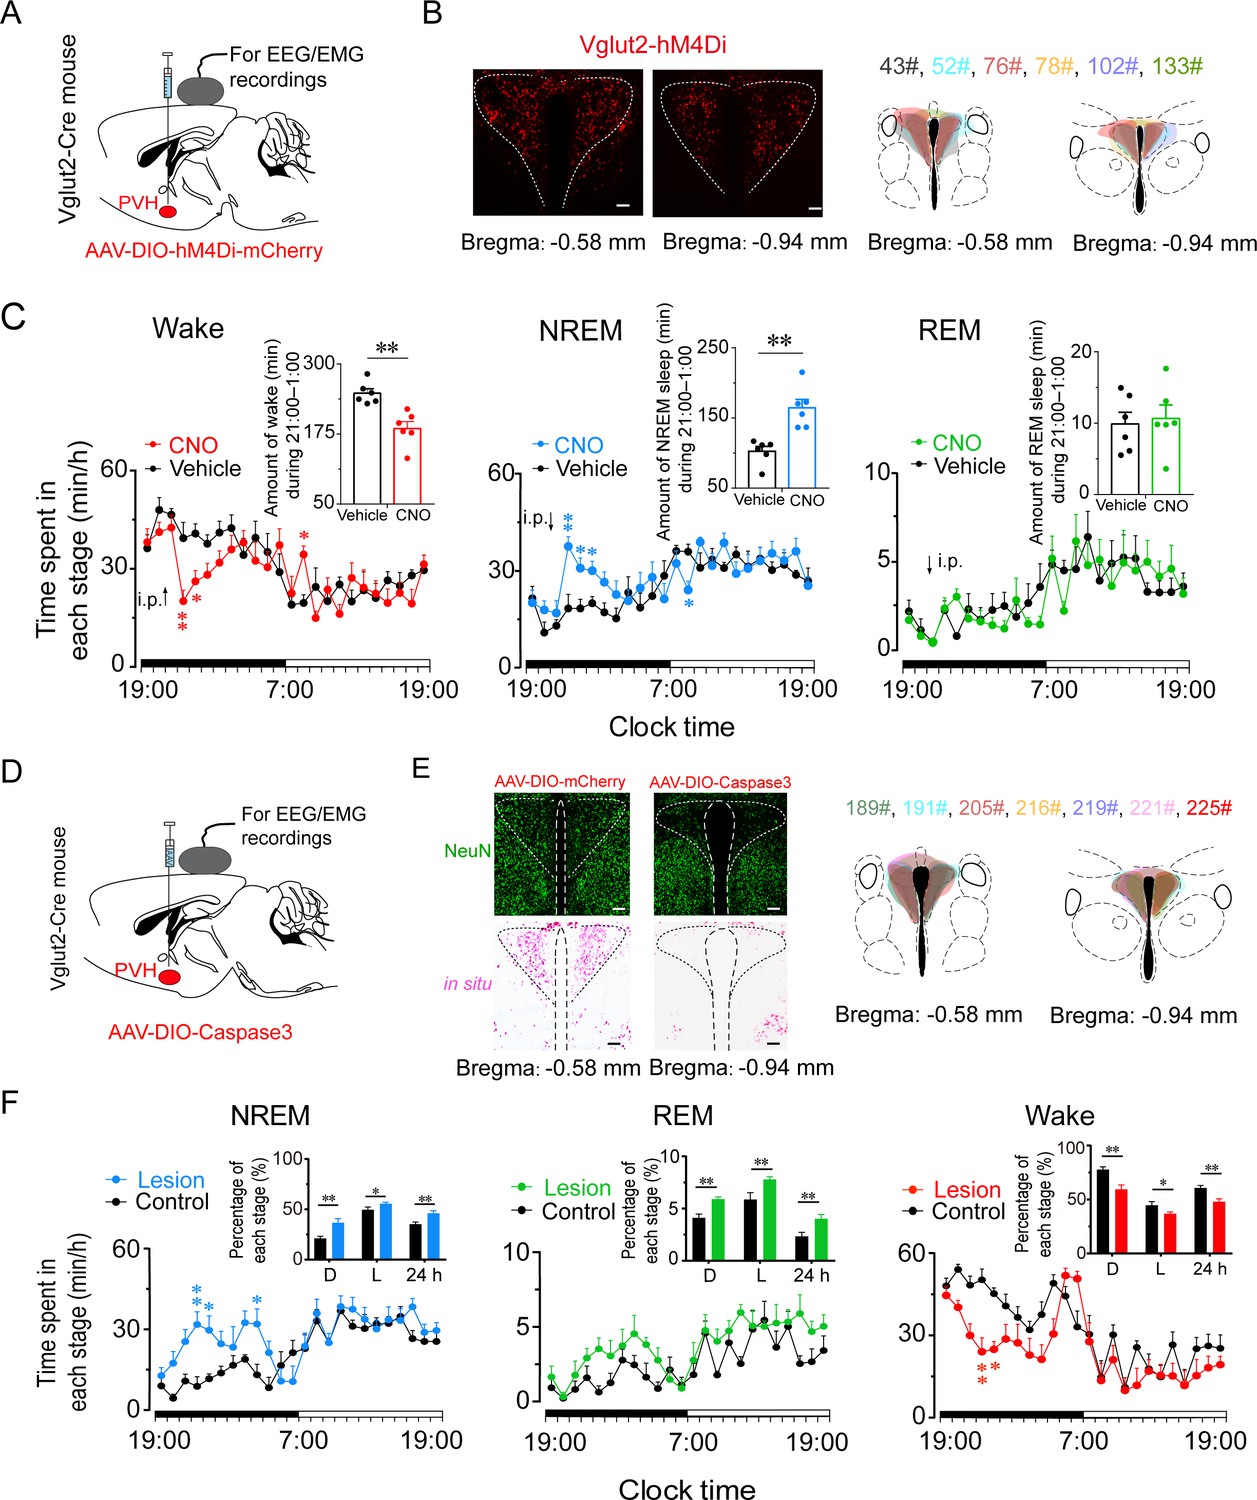
Inhibition or ablation of PVHvglut2 neurons induces hypersomnia-like behaviors.
(A) Expression of AAV injection site in the PVH of vglut2Cre mice. (B) Left panel: Location of hM4Di expression in the PVHvglut2 neurons. Right panel: Drawings of overlay mCherry expressing sites in the PVH of vglut2Cre mice (n = 6, indicated with different colors). Scale bars: 200 μm. (C) Time-course changes in NREM sleep, wakefulness, and REM sleep after administration of vehicle or CNO in mice expressing hM4Di in PVHvglut2 neurons (n = 6, repeated-measures ANOVA; F1,10 = 21.95 [wake], 7.68 [NREM], 29.23 [REM]). Inset: Total time spent in each stage after vehicle or CNO injection (n = 6, paired t test). (D) Expression of an AAV injection site in the PVH of vglut2Cre mice. (E) Left panel: Image showing NeuN (neuron-specific nuclear protein) staining (top) and vglut2 in situ hybridization (bottom) from a control mouse (left) and a mouse with a PVH lesion (right), Scale bars: 200 μm. Right panel: Drawings of superimposed ablation areas in the PVH of vglut2Cre mice (n = 7, indicated with different colors). (F) Time spent in each stage across the 24 hr sleep–wake cycle. L, light phase; D, dark phase. Control group, n = 6; lesion group, n = 7, repeated-measures ANOVA; F1,10 = 2.88 (wake), 2.90 (NREM), 0.06 (REM); Inside panel: Percentages in different sleep–wake stages across the 24 hr sleep–wake cycle (unpaired t test; NREM, dark phase, t11=3.27, p < 0.01; light phase, t11 = 2.32, p = 0.04; 24 h, t11 = 3.27, p < 0.01; REM, dark phase, t11 = 2.94, p = 0.01; light phase, t11=2.88, p = 0.05; 24 hr, t11 = 4.36, p < 0.01; wake, dark phase, t11 = 3.61, p < 0.01; light phase, t11=2.24, p = 0.05; 24 hr, t11=3.56, p < 0.01). Data represented as mean ± SEM (*p < 0.05, **p < 0.01).
-
Figure 7—source data 1
Time spent in each stage of PVHvglut2-m4 mice after administration of CNO or saline and time spent in each stage of PVH vglut2-Caspase3 mice.
- https://cdn.elifesciences.org/articles/69909/elife-69909-fig7-data1-v2.xlsx
Additional files
Download links
A two-part list of links to download the article, or parts of the article, in various formats.
Downloads (link to download the article as PDF)
Open citations (links to open the citations from this article in various online reference manager services)
Cite this article (links to download the citations from this article in formats compatible with various reference manager tools)
Dysfunctions of the paraventricular hypothalamic nucleus induce hypersomnia in mice
eLife 10:e69909.
https://doi.org/10.7554/eLife.69909


