A LAMP sequencing approach for high-throughput co-detection of SARS-CoV-2 and influenza virus in human saliva
- Graduate Group in Biochemistry and Biophysics, University of Pennsylvania Perelman School of Medicine, United States
- Epigenetics Institute, University of Pennsylvania Perelman School of Medicine, United States
- Department of Cell and Developmental Biology, University of Pennsylvania Perelman School of Medicine, United States
- Department of Medicine, University of Pennsylvania Perelman School of Medicine, United States
- Department of Microbiology, University of Pennsylvania Perelman School of Medicine, United States
- Department of Emergency Medicine and Penn Acute Research Collaboration, University of Pennsylvania Perelman School of Medicine, United States
- University of Pennsylvania School of Nursing, United States
- Next-Generation Sequencing Core, Department of Genetics, University of Pennsylvania Perelman School of Medicine, United States
Figures
Figure 1 with 1 supplement
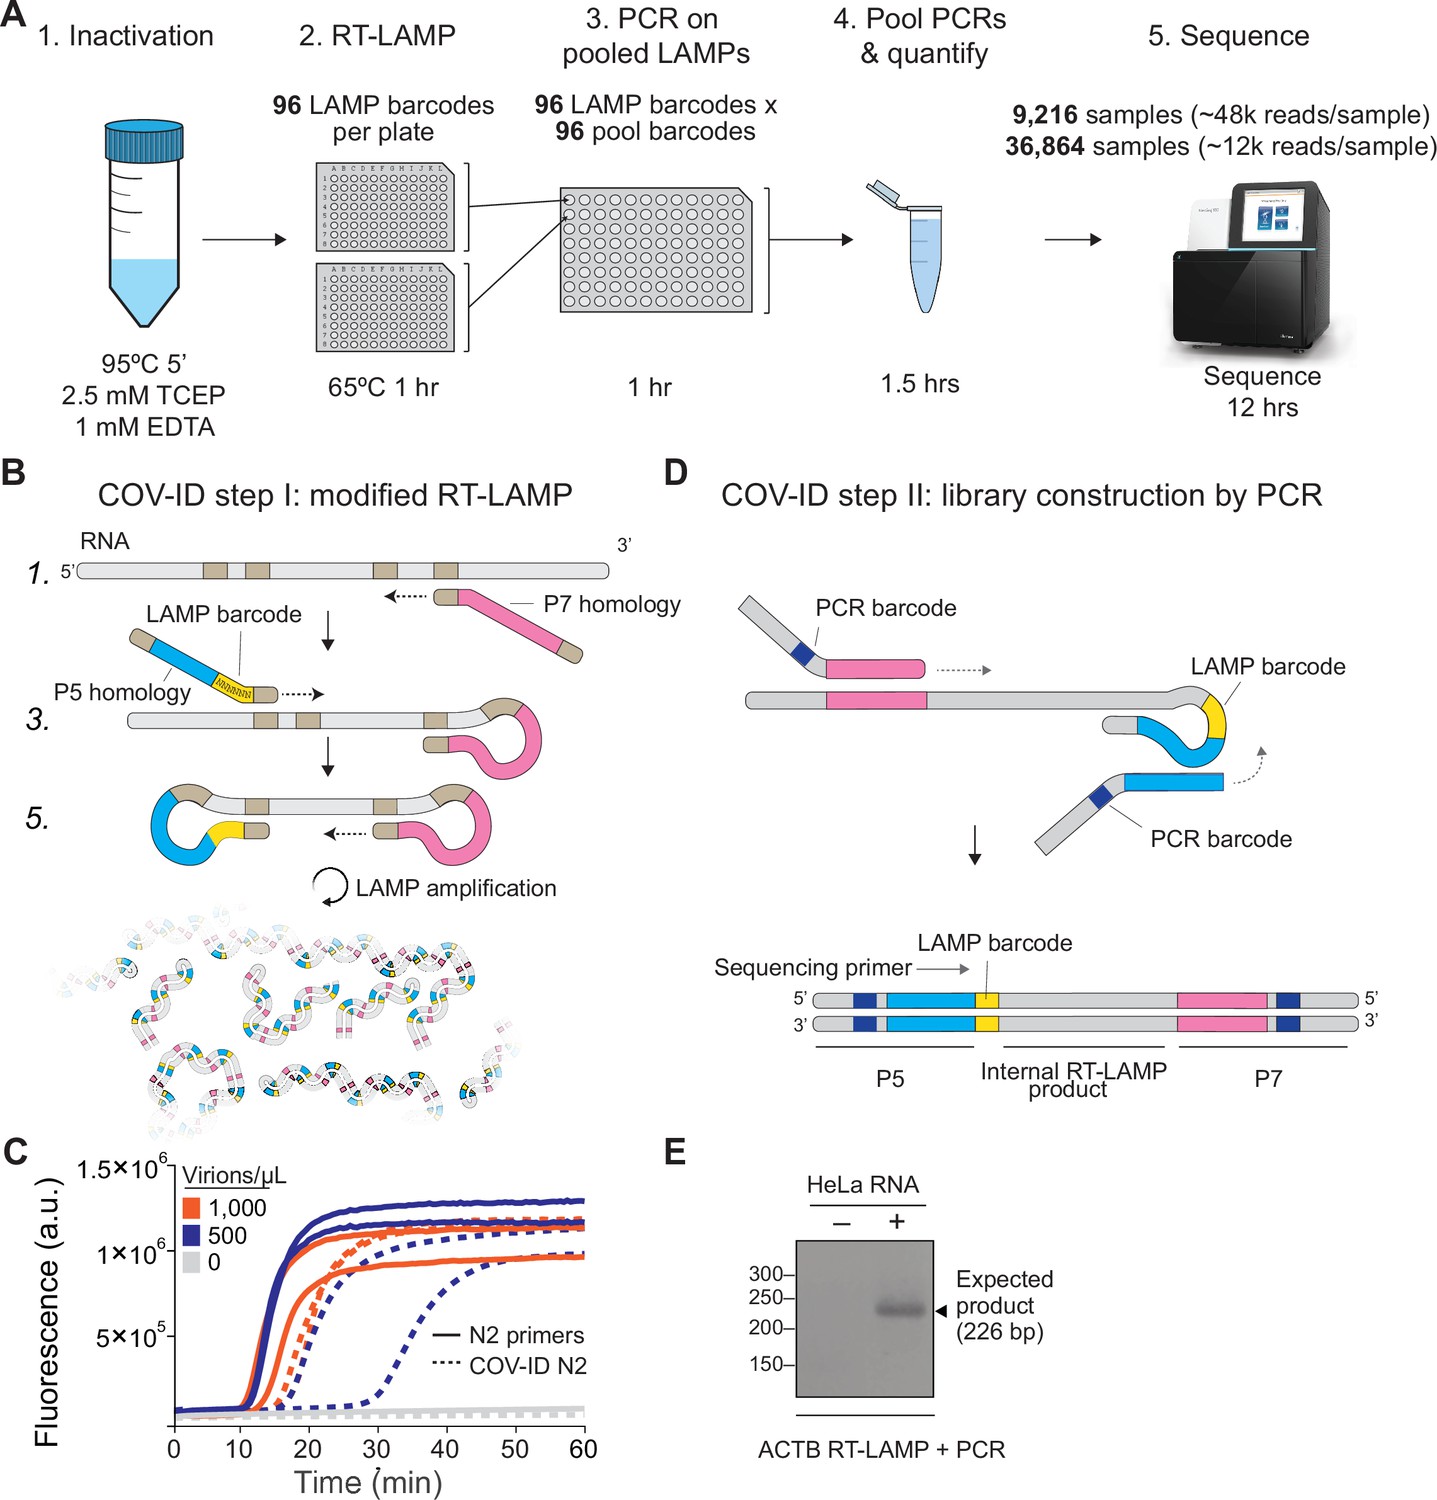
Barcoding and PCR amplification of reverse transcription loop-mediated isothermal amplification (RT-LAMP) products.
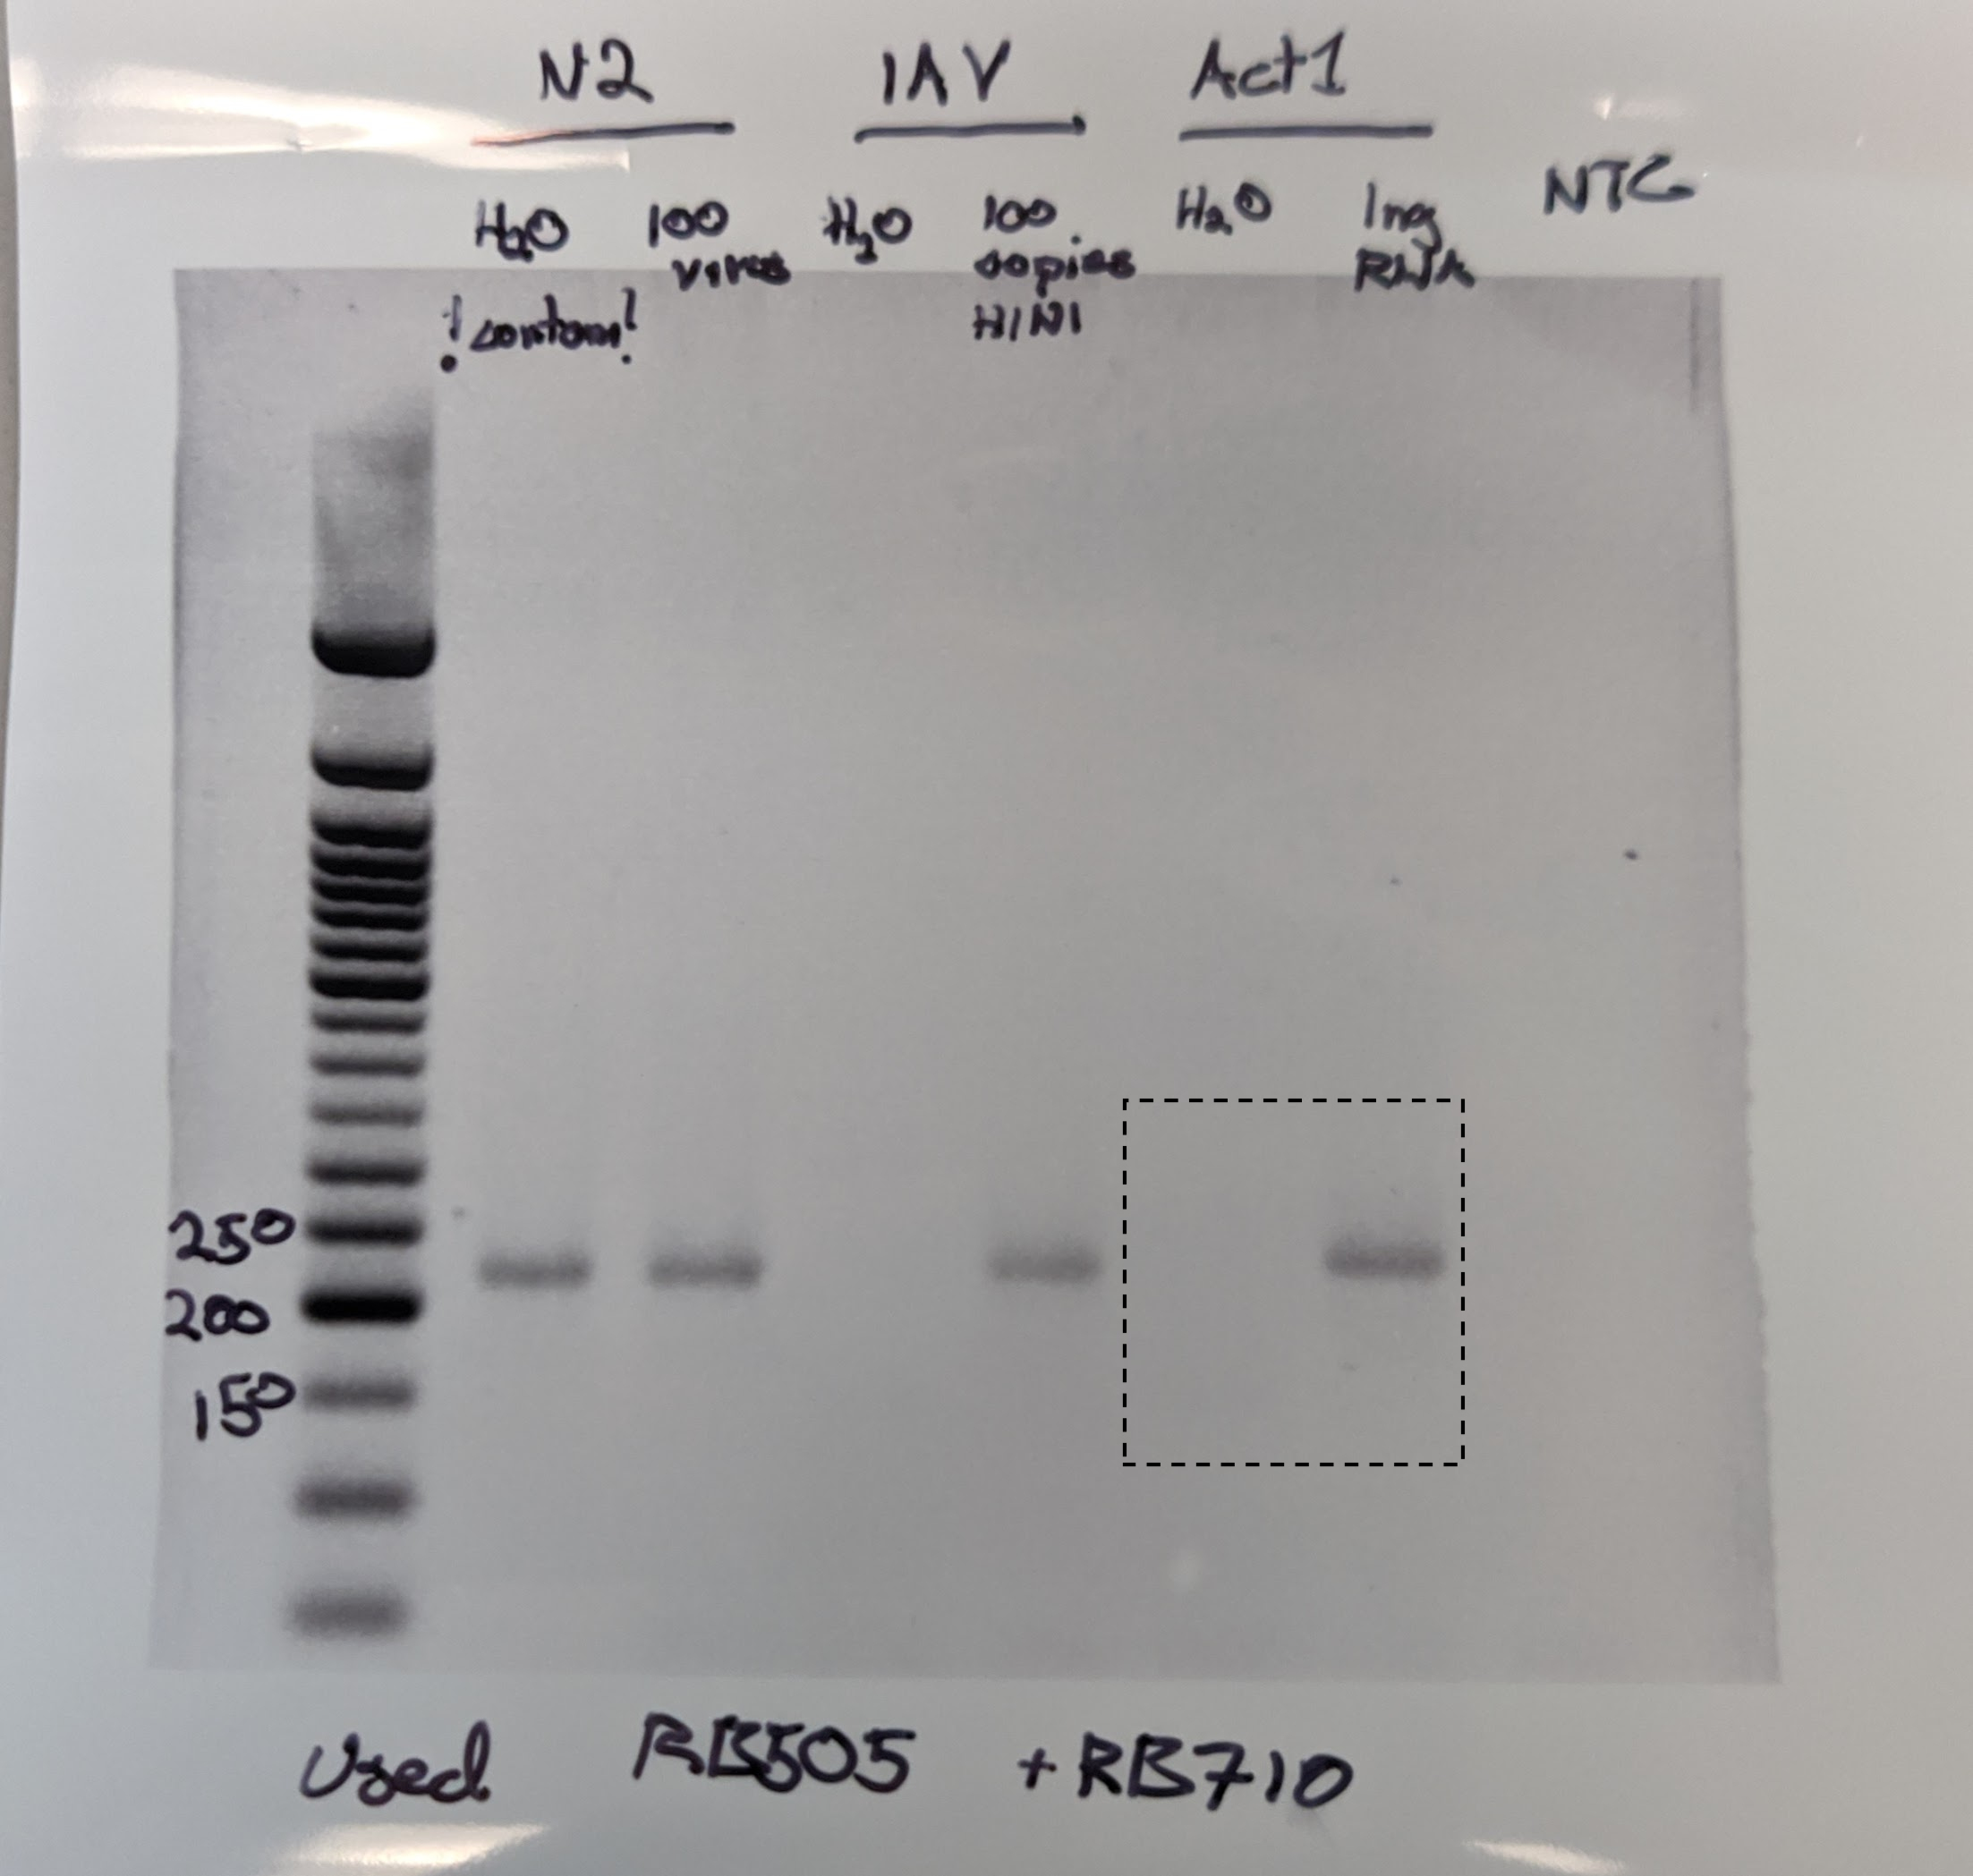
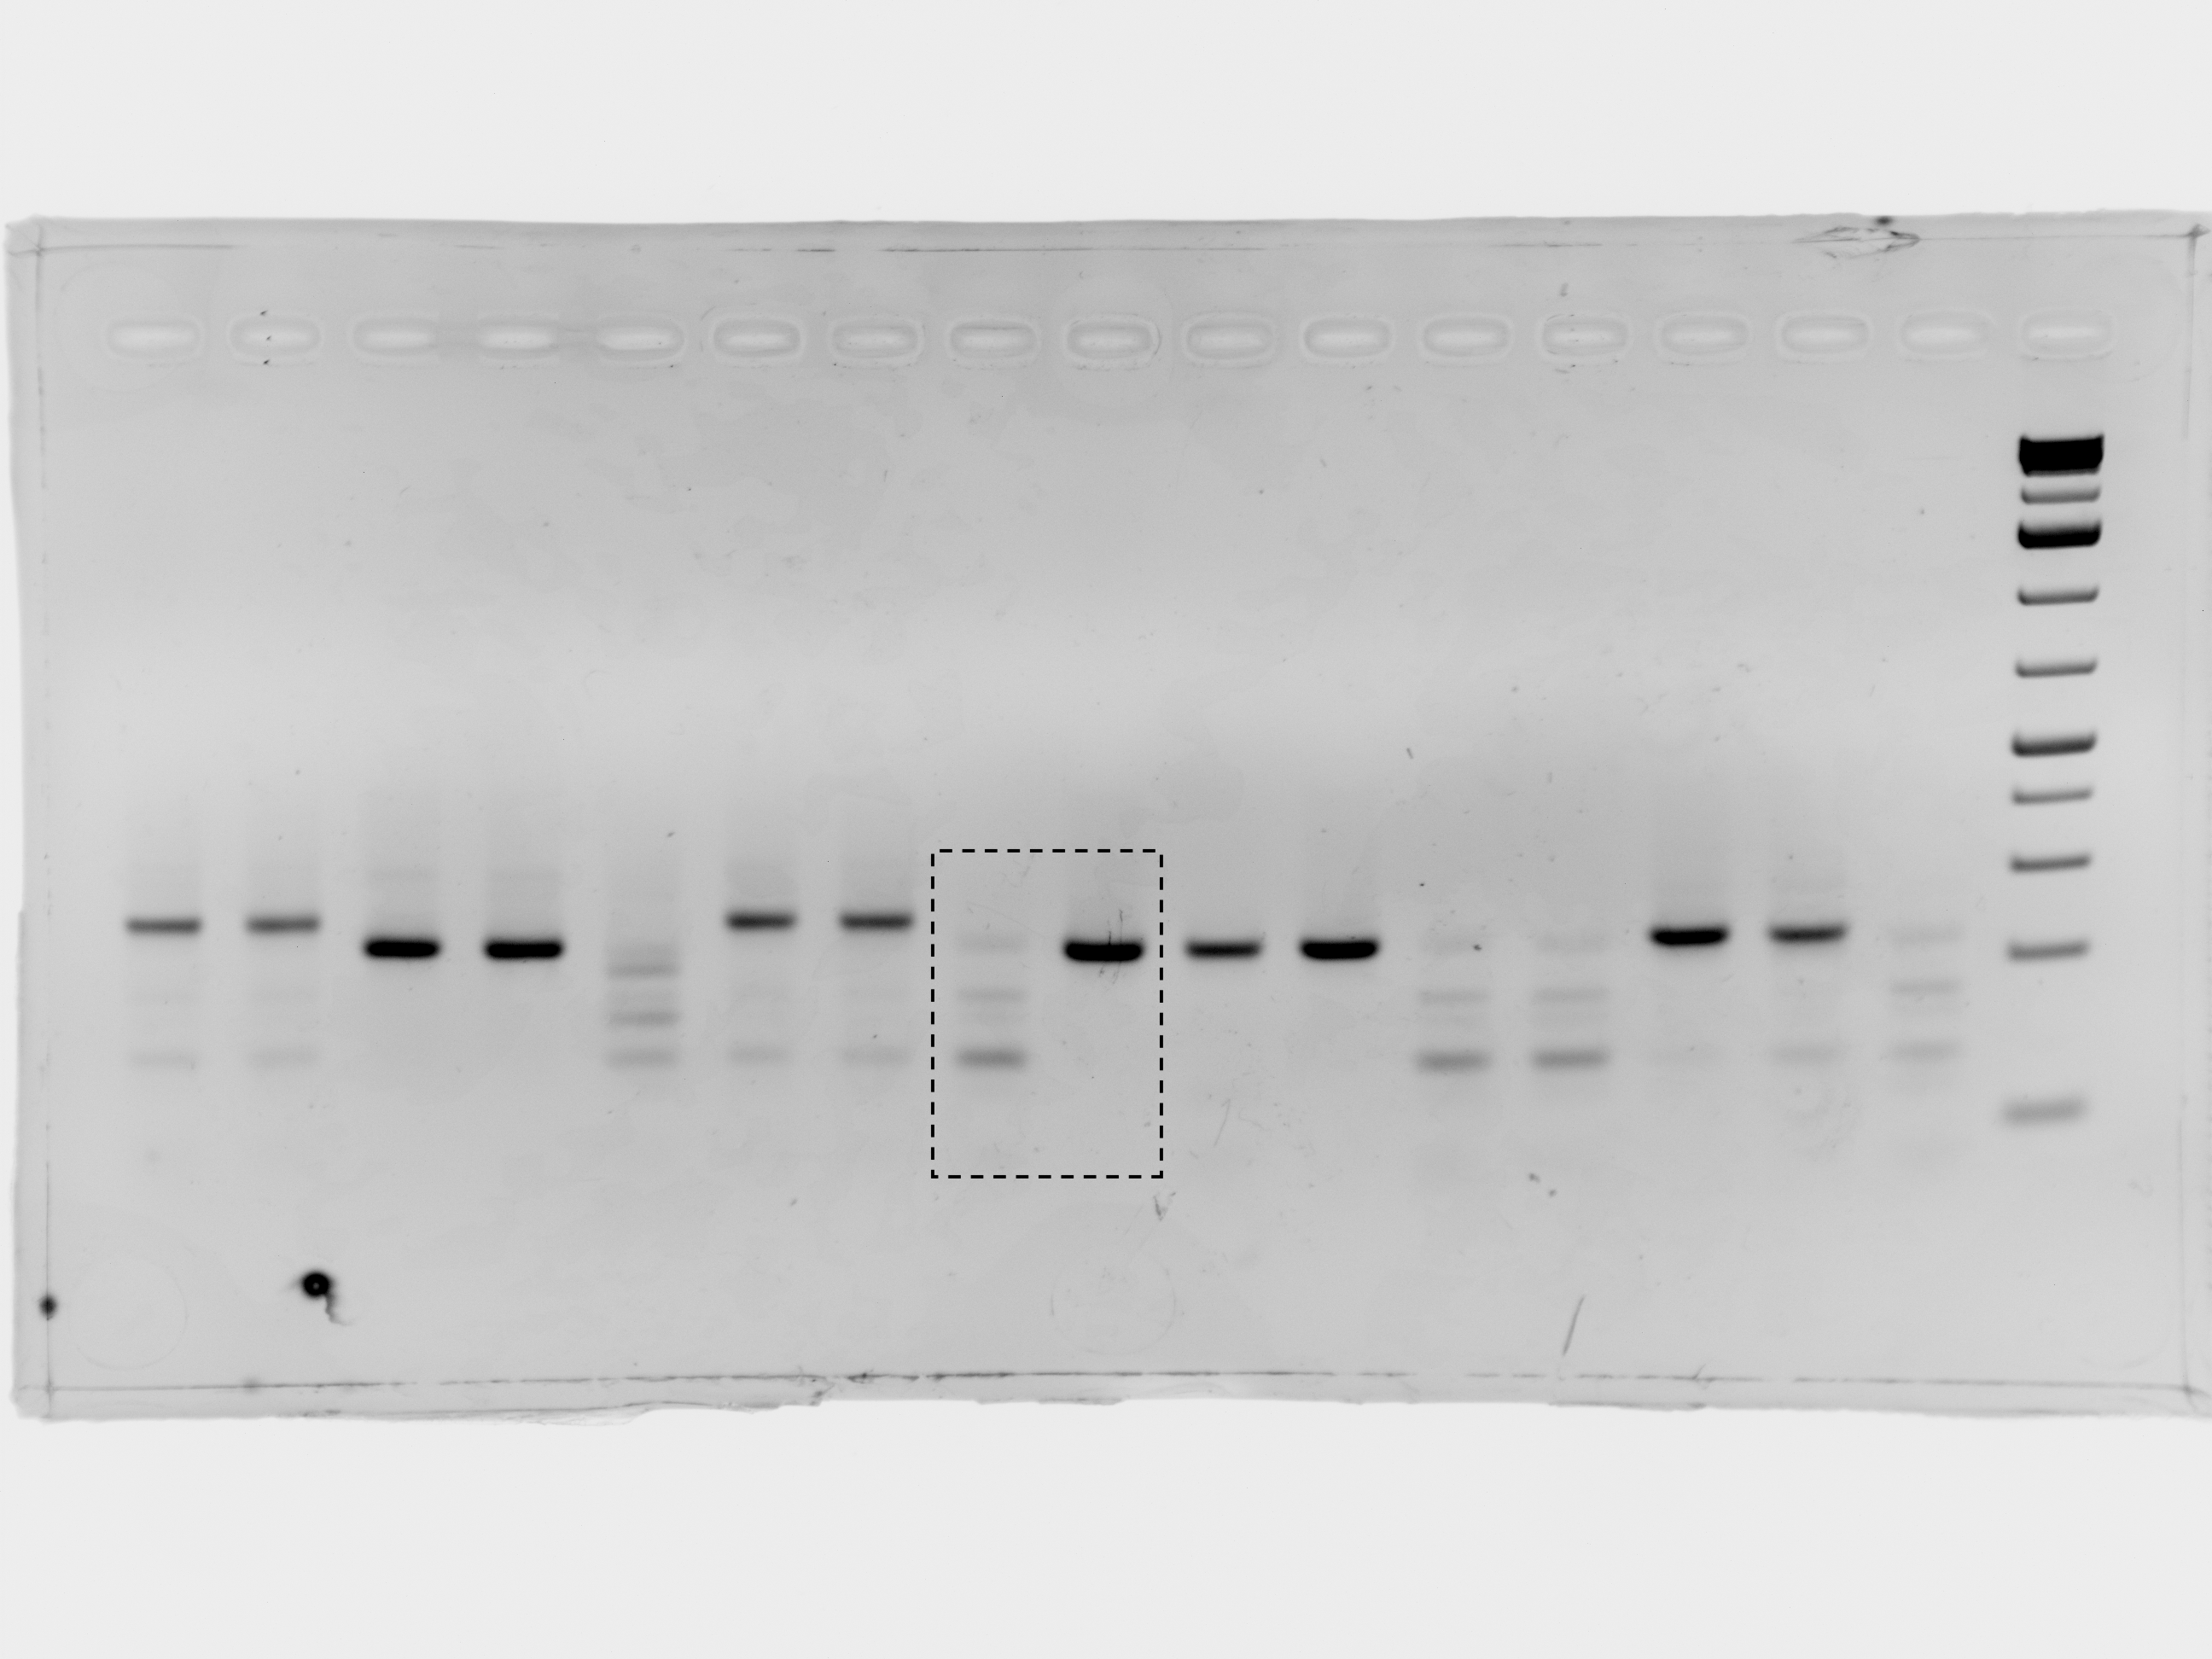
(A) Overview of COV-ID. Saliva is collected and inactivated prior to RT-LAMP performed with up to 96 individual sample barcoded primers. LAMP reactions are pooled and further amplified via PCR to introduce Illumina adapter sequences and pool-level dual indexes. A single thermal cycler can amplify 96 or 384 such pools and the resulting ‘super-pool’ can be sequenced overnight to detect multiple amplicons from 9,216 or 36,864 individual patient samples (number of reads in parenthesis assume an output of ~450 M reads from a NextSeq 500). (B) Schematic of the RT-LAMP (step I) of COV-ID. Selected numbered intermediates of RT-LAMP reaction are shown to illustrate how the LAMP barcode, shown in yellow, and the P5 and P7 homology sequences (blue and pink, respectively) are introduced in the final LAMP product. Upon generating the dumbbell intermediate, the reaction proceeds through rapid primed and self-primed extensions to form a mixture of various DNA amplicons containing sequences for PCR amplification. A more detailed version of the LAMP phase of COV-ID, including specific sequences, is illustrated in Figure 1—figure supplement 1. (C) Conventional RT-LAMP primers (solid lines) or primers modified for COV-ID (dotted lines) were used for RT-LAMP of SARS-CoV-2 in saliva. The numbers of inactivated SARS-CoV-2 virions per µL is indicated in the color legend. Each line represents an independent biological replicate. Fluorescence is shown in arbitrary units. (D) Schematic of the PCR (step II) of COV-ID. Following RT-LAMP, up to 96 reactions are pooled and purified and Illumina libraries are generated directly by PCR with dual-indexed P5 and P7 adapters in preparation for sequencing. (E) COV-ID primers targeting ACTB mRNA were used for RT-LAMP from HeLa total RNA. LAMP was diluted 1:100, amplified via PCR and resolved on 2% agarose gel.
-
Figure 1—source data 1
Uncropped blot for Figure 1E.
- https://cdn.elifesciences.org/articles/69949/elife-69949-fig1-data1-v1.png
Figure 1—figure supplement 1
Detailed COV-ID mechanism.
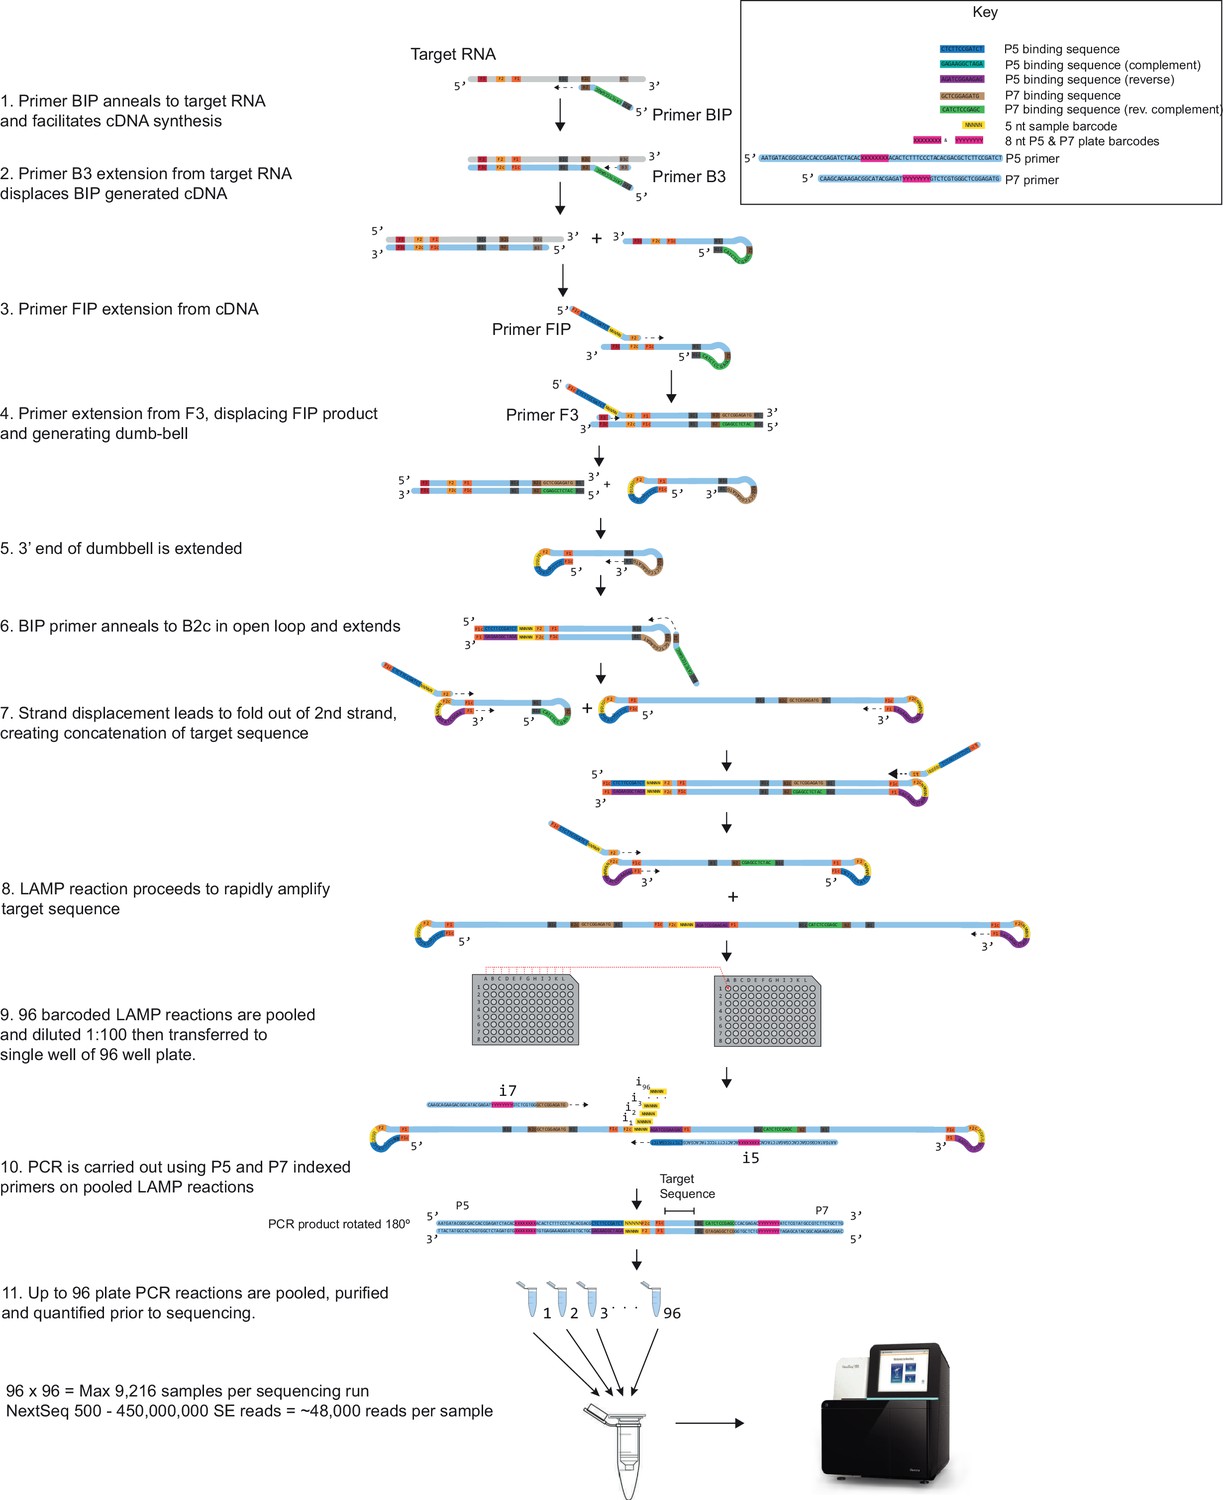
The steps of the COV-ID protocol are depicted, showing reverse transcription loop-mediated isothermal amplification (RT-LAMP) mechanism and the final barcoded amplicon that is sequenced. For clarity only, selected steps of RT-LAMP reaction are shown and loop primer intermediates are not depicted. For full LAMP mechanism see Nagamine et al., 2002.
Figure 2 with 3 supplements

Sequencing-based detection of SARS-CoV-2 in saliva samples.
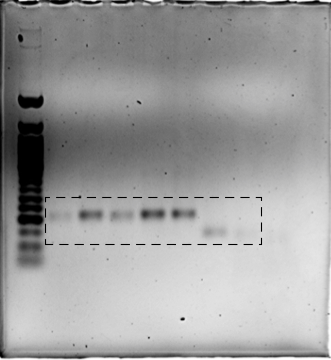
(A) Saliva preparation. Crude saliva was inactivated via TCEP/EDTA addition and 95 °C incubation prior to RT-LAMP. (B) RT-LAMP followed by COV-ID PCR performed directly on saliva. Saliva with and without addition of 1,000 copies of inactivated SARS-CoV-2 templates was inactivated as described in (A), then used as template. (C) Alignment of sequenced reads against SARS-CoV-2 genome from COV-ID of inactivated saliva spiked with or without 1,280 virions SARS-CoV-2 per µL. All SARS-CoV-2 reads align exclusively to expected region of the N gene. Open reading frames of viral genome are depicted via gray boxes below alignment. Inset: scale shows reads per 1,000. Height of peak is provided on the right. (D) Scatter plot for the ratio of SARS-CoV-2 / (STATH +1) reads obtained by COV-ID (y axis) versus the number of virions per µL spiked in human saliva (x axis). The threshold was set above the highest values scored in a negative control (dashed line). Each circle represents an independent biological replicate. (E) COV-ID performed on clinical saliva samples. The scatter plot shows the SARS-CoV-2 / (STATH +1) read ratio (y axis) versus the viral load in the sample estimated by a clinically approved, qPCR-based diagnostic test. The threshold was set based on the negative controls shown in (D). Each circle represents an independent biological replicate.
-
Figure 2—source data 1
Uncropped blot for Figure 2B.
- https://cdn.elifesciences.org/articles/69949/elife-69949-fig2-data1-v1.png
Figure 2—figure supplement 1
Optimization of COV-ID in human saliva.
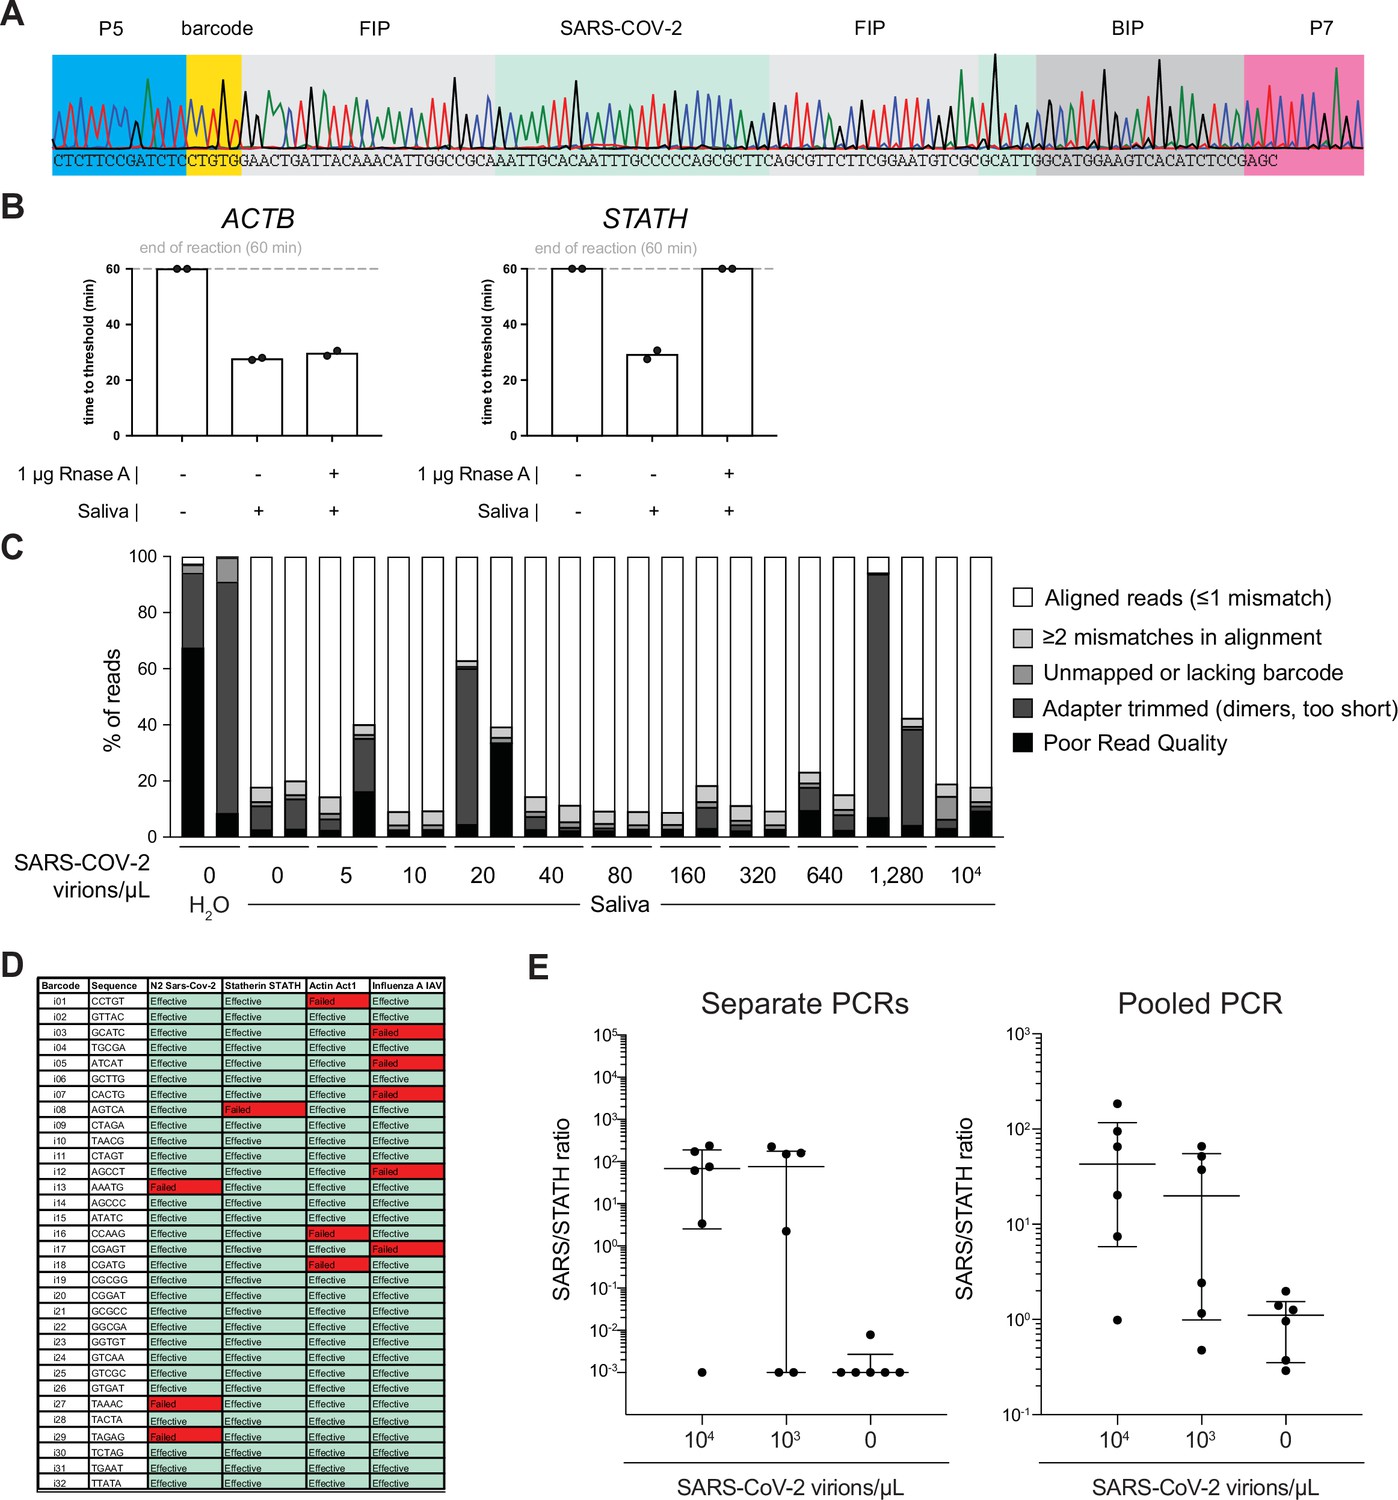
(A) Saliva COV-ID sequence validation. Single saliva COV-ID reaction using N2 primers was sequenced by the Sanger method. (B) Validation of control human amplicons for reverse transcription loop-mediated isothermal amplification (RT-LAMP) on saliva. RT-LAMP of TCEP/EDTAinactivated saliva was performed with conventional RT-LAMP primer sets for ACTB and STATH in the presence or absence of RNase A. Bars show the mean. Individual biological replicates are shown by circles. (C) Characterization of COV-ID sequencing libraries. Breakdown of reads for sequence data presented in Figure 2D. Samples without added template consist of predominantly adapter dimers. (D) Validation of COV-ID LAMP barcodes. 32 potential barcodes were tested for LAMP primer sets indicated, incompatible barcodes are marked in red. (E) Validation of pooled PCR. COV-ID was performed on saliva samples using unique LAMP barcodes. The RT-LAMP reactions were then amplified either by individual PCR or by first pooling and then performing a single PCR on the pool. Individual biological replicates are shown by circles. Lines indicate the median and interquartile range.
Figure 2—figure supplement 2
Reverse transcription loop-mediated isothermal amplification (RT-LAMP) on a SARS-CoV-2 synthetic calibration standard.
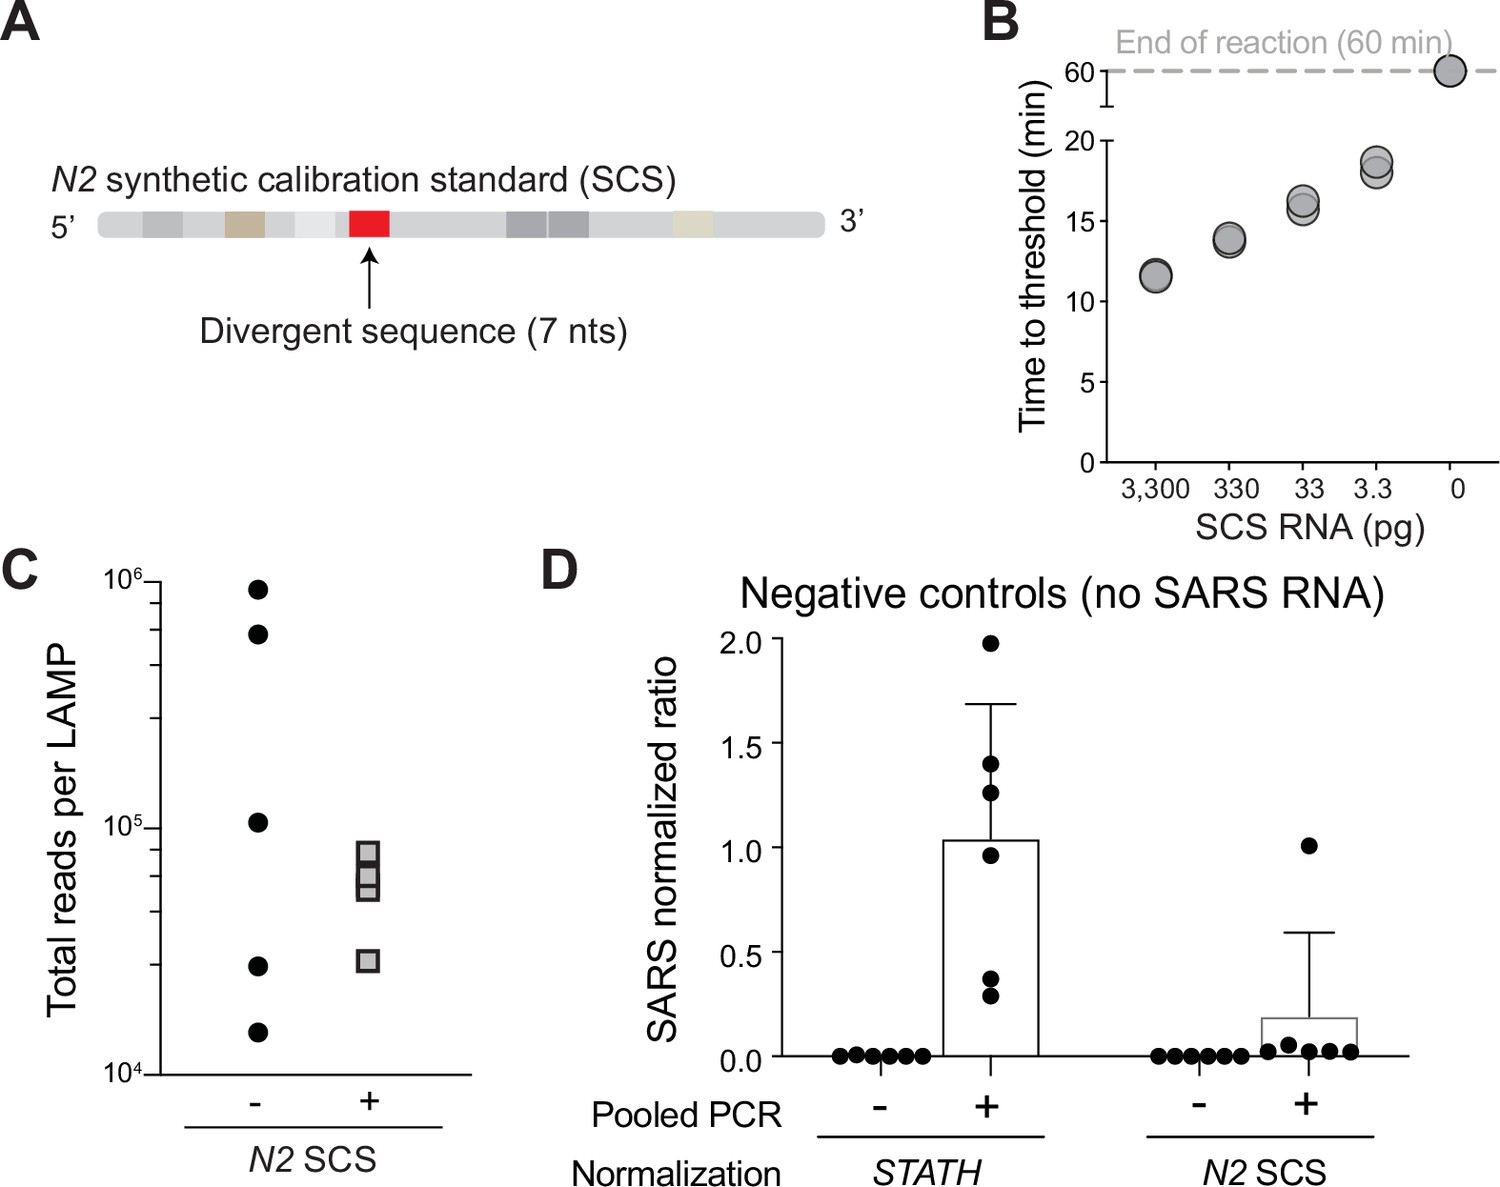
(A) A synthetic calibration standard for SARS-CoV-2 N2 RNA was synthesized including a 7 nt divergent sequence (in red), maintaining all other LAMP primer binding sites and identical GC content. (B) RT-LAMP using COV-ID N2 primers was carried out on indicated amounts of synthetic calibration standard (SCS) RNA, showing rapid amplification down to picogram quantities of added template. (C) Total number of reads per barcode in COV-ID pool obtained by including (+) or omitting (−) the N2 synthetic calibration standard. (D) Spurious COV-ID signal for the N2 amplicon in negative control samples after normalization either to the STATH control (in absence of the synthetic calibration standard) or to the SCS. Bars indicate the mean + standard deviation.
Figure 2—figure supplement 3
Clinical validation of COV-ID on RNA from nasopharyngeal (NP) swabs.
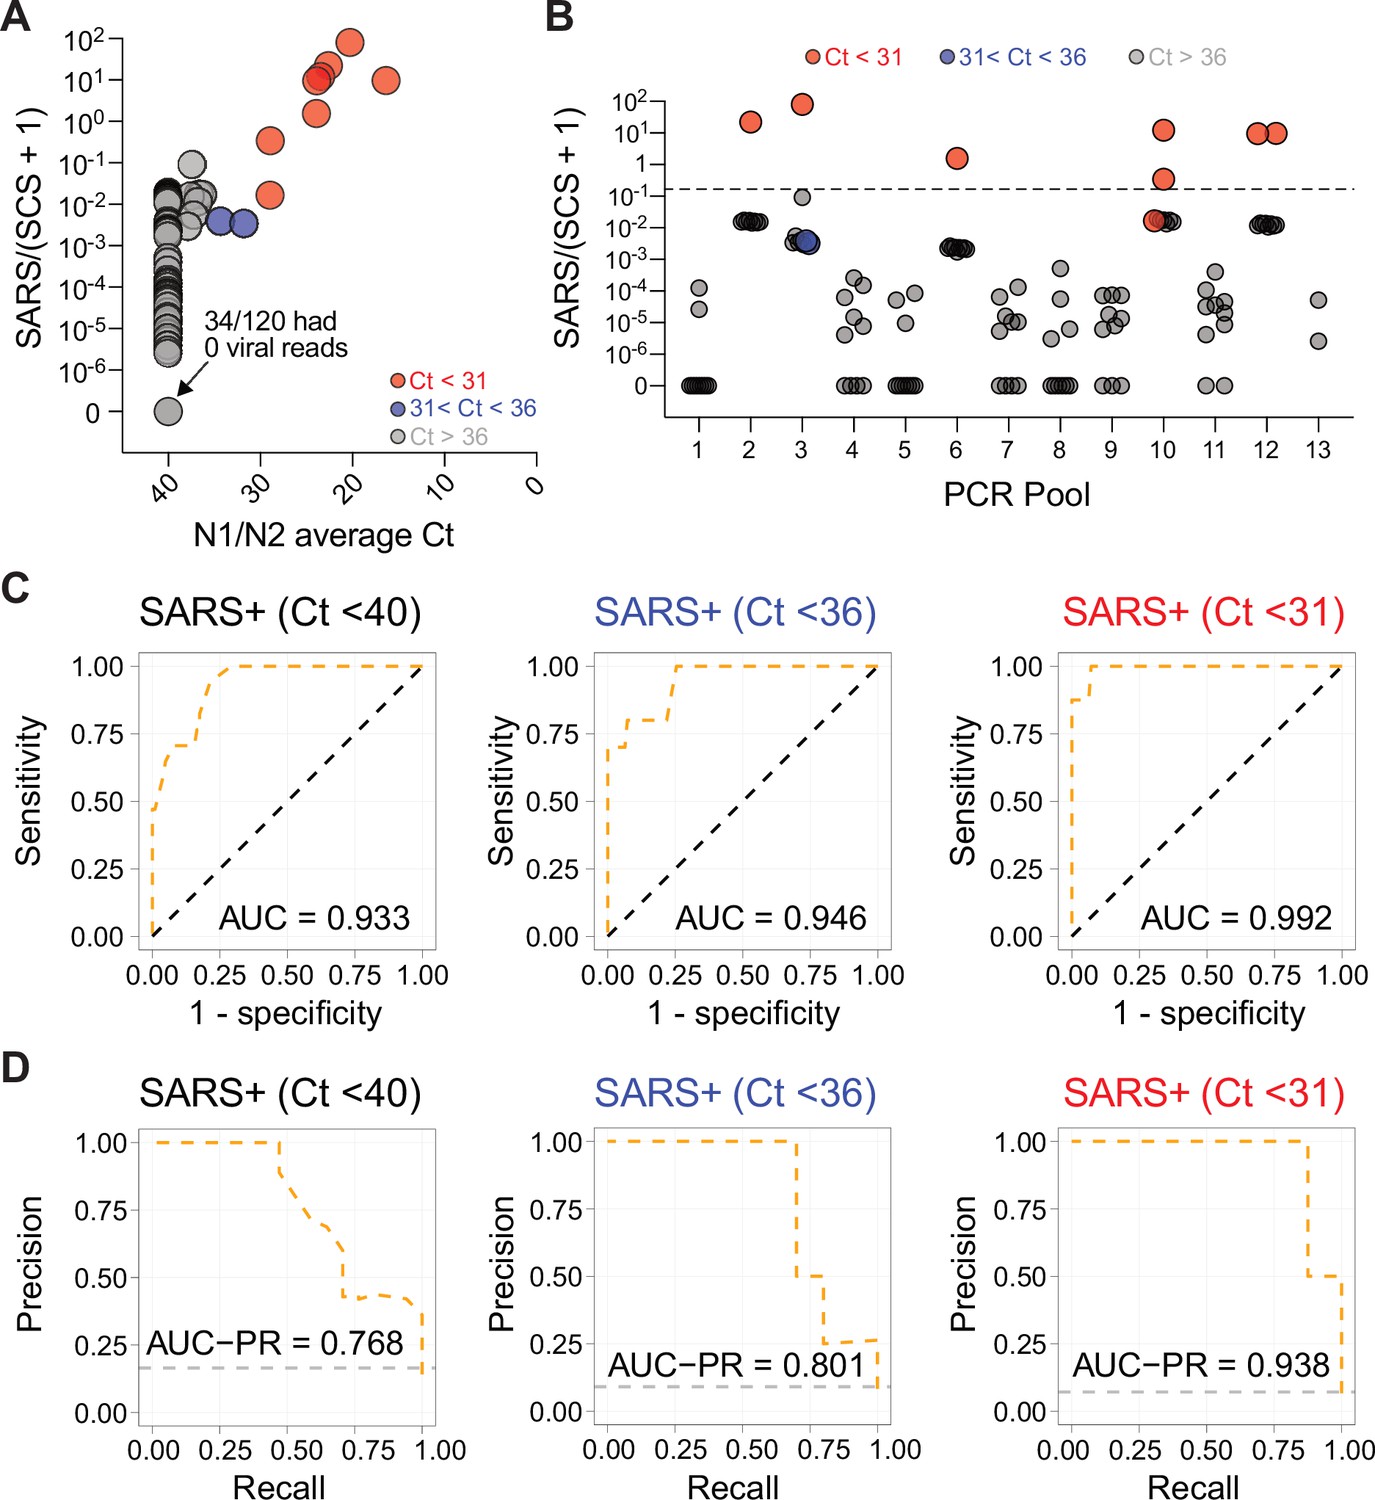
(A) COV-ID on RNA from 120 patient-derived NP swabs. COV-ID for SARS-CoV-2 and ACTB was performed using 10 unique LAMP barcodes. Pools of 10 reactions were PCR amplified and sequenced to a minimum depth of 1,000 reads. Scatterplot shows SARS/(SCS +1) ratio against mean N1/N2 Ct value from RT-qPCR assays. Red circles represent samples with Ct <31. Blue circles represent samples with Ct between 31 and 36. (B) SARS/(SCS +1) ratios for samples presented in (A) are shown grouped by their respective PCR pools. Circles are colored as in (A). The dashed line represents the threshold for samples scored as positive, corresponding to 10 times the highest signal observed in negative controls. (C) Receiver operator characteristic (ROC) plots for the results shown in (A). Sensitivity and specificity of COV-ID are shown by comparing diagnostic prediction of COV-ID against SARS-CoV-2 RT-qPCR. True positives were defined as those with average N1+/N2 qPCR Ct values less than either 40 (left panels), 36 (middle), or 31 (right). Diagonal black lines represent performance of a random classifier. (D) Precision-recall curves constructed with the same data and thresholds as in (C). Gray lines represent a baseline classifier where all tests return a positive result.
Figure 3
COV-ID multiplex detection of SARS-COV-2 and Influenza A.
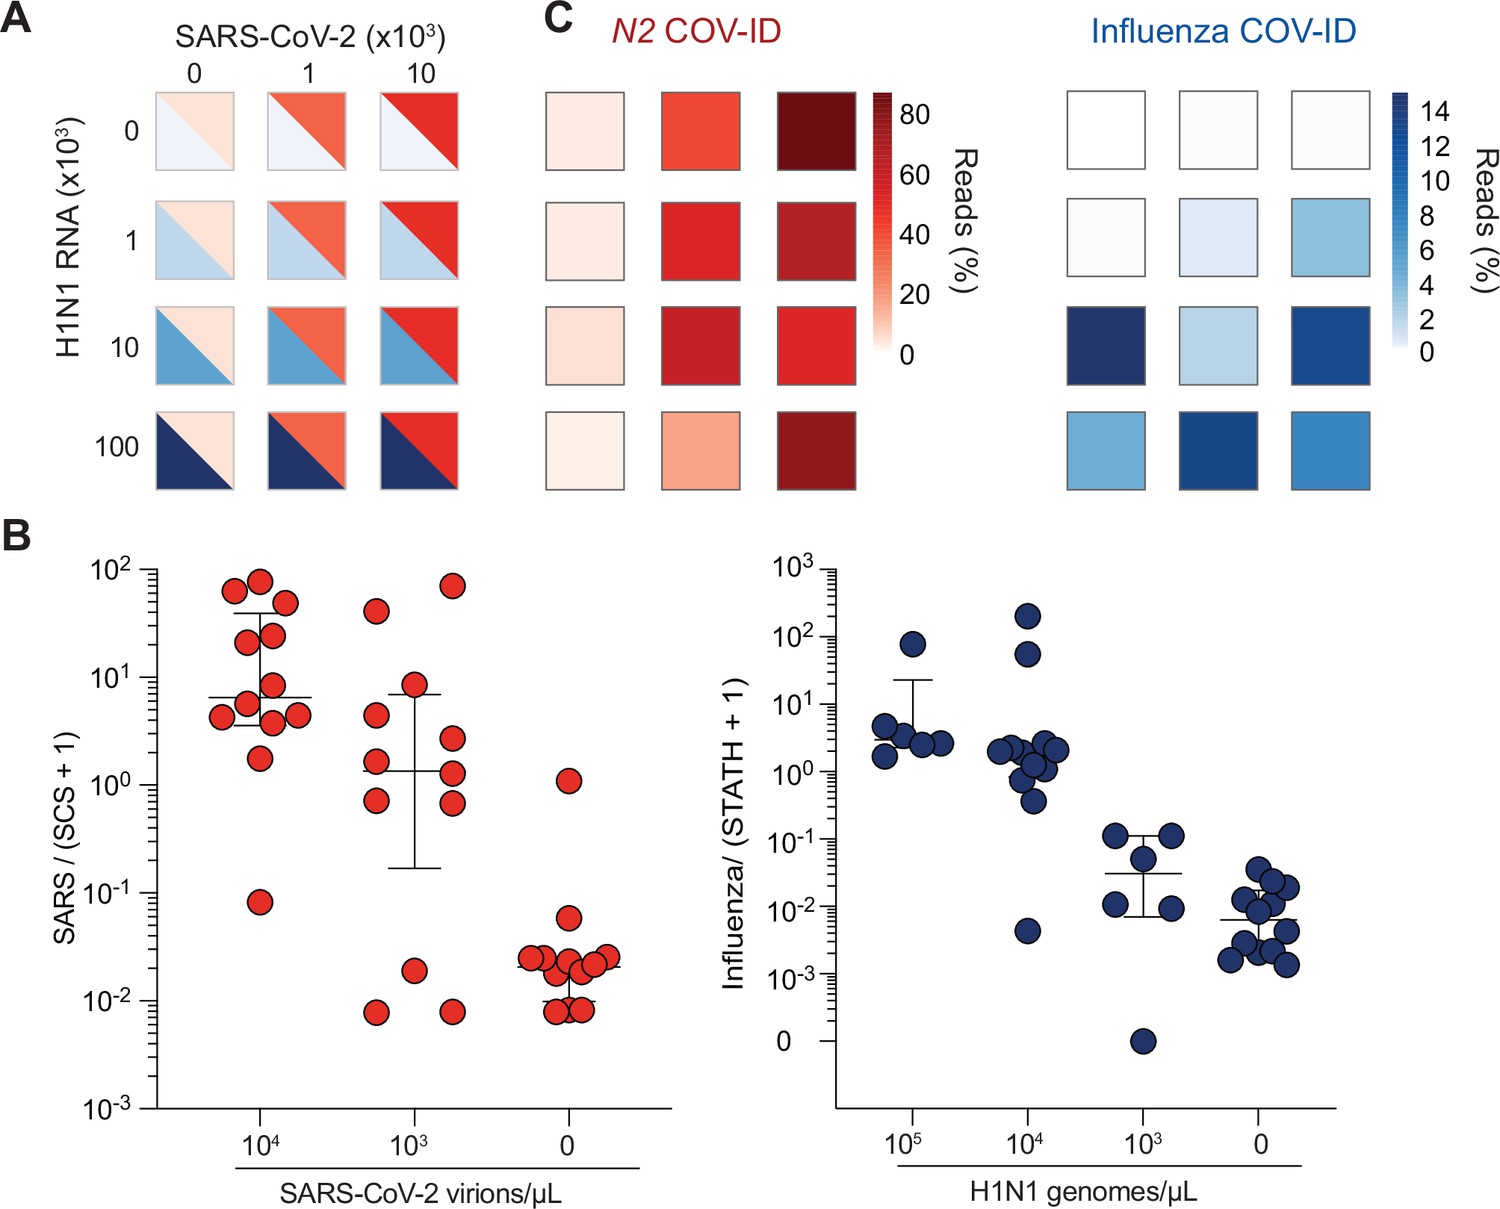
(A) TCEP/EDTA treated saliva was spiked with indicated amounts of BEI heat-inactivated SARS-CoV-2 or H1N1 influenza A RNA to the indicated concentration of virions/genomes per µL. One microliter of saliva was used for COV-ID reactions. (B) COV-ID was performed in two independent experiments on saliva samples from the matrix shown in (A) in the presence of 20 femtograms N2 synthetic calibration standard (SCS) using N2, influenza (MacKay et al., 2020) and STATH COV-ID primers. N2/(SCS +1) and influenza/(STATH +1) read ratios are displayed with bars showing median ± interquartile range. Circles represent individual biological replicates. Samples were considered positive for a given sequence if the associated read ratio was greater than 2x the maximum value in the control saliva samples. (C) Heatmaps of SARS-CoV-2 (left) or H1N1 (right) COV-ID signal in multiplex reaction. Individual data points are from (B). The heatmap color represents the mean of the percentage of viral reads in each sample.
Figure 4
COV-ID on saliva collected on paper.
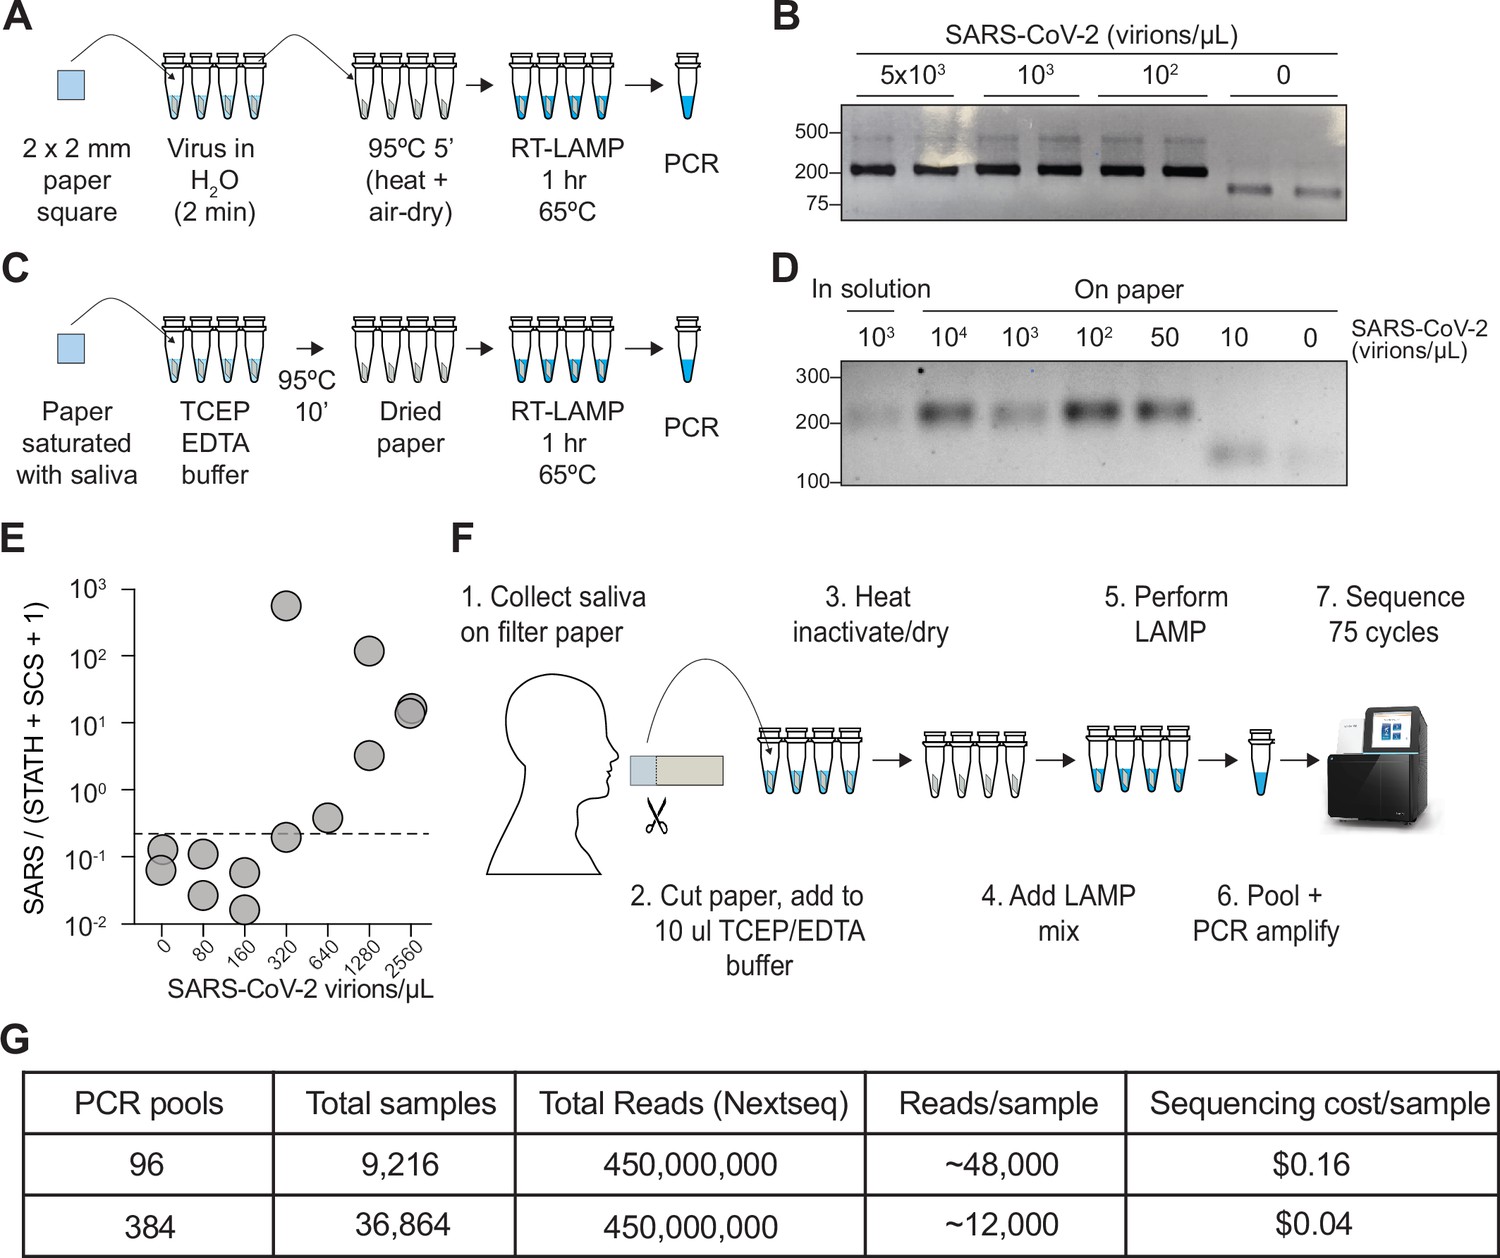
(A) Scheme for COV-ID on viral RNA absorbed on paper. (B) PCR reactions from paper samples immersed in water with indicated viral concentrations then amplified with N2 COV-ID primers. (C) Scheme for COV-ID on saliva spiked with viral and RNA and absorbed on paper. (D) Same as (B) but on saliva absorbed on paper. (E) SARS-CoV-2 virus was added to saliva and prepared as in (C).Reverse transcription loop-mediated isothermal amplification (RT-LAMP) and sequencing was carried out in presence of calibration standard RNA. Viral reads are presented as ratio against the sum of STATH and N2 synthetic calibration standard (SCS) reads. Positive threshold was set as 2x maximum value in negative saliva and indicated by dashed horizontal line. (F–G) Paper-based COV-ID workflow (F) and cost calculations (G). Saliva is collected orally on a precut strip of paper, from which a 2 mm square would be cut out and added to a reaction vessel containing TCEP/EDTA inactivation buffer and processed as shown in (C).
-
Figure 4—source data 1
Uncropped blot for Figure 4B.
- https://cdn.elifesciences.org/articles/69949/elife-69949-fig4-data1-v1.png
-
Figure 4—source data 2
Uncropped blot for Figure 4D.
- https://cdn.elifesciences.org/articles/69949/elife-69949-fig4-data2-v1.png
Additional files
-
Supplementary file 1
Oligonucleotide sequences and RT-LAMP indexes.
- https://cdn.elifesciences.org/articles/69949/elife-69949-supp1-v1.xlsx
-
Transparent reporting form
- https://cdn.elifesciences.org/articles/69949/elife-69949-transrepform1-v1.docx
-
Source code 1
Scripts and Bowtie indexes.
- https://cdn.elifesciences.org/articles/69949/elife-69949-code1-v1.zip
Download links
A two-part list of links to download the article, or parts of the article, in various formats.
Downloads (link to download the article as PDF)
Open citations (links to open the citations from this article in various online reference manager services)
Cite this article (links to download the citations from this article in formats compatible with various reference manager tools)
A LAMP sequencing approach for high-throughput co-detection of SARS-CoV-2 and influenza virus in human saliva
eLife 11:e69949.
https://doi.org/10.7554/eLife.69949


