Left hemisphere dominance for bilateral kinematic encoding in the human brain
- Department of Psychology, University of California, Berkeley, United States
- UC Berkeley – UCSF Graduate Program in Bioengineering, University of California, Berkeley, United States
- Department of Neurology, University of California at Irvine, United States
- Department of Neurological Surgery, University of California San Francisco, San Francisco, United States
- Department of Neurology and Neurosurgery, California Pacific Medical Center, United States
- Department of Electrical Engineering and Computer Sciences, University of California, Berkeley, United States
- Helen Wills Neuroscience Institute, University of California, Berkeley, United States
Figures
Figure 1 with 1 supplement
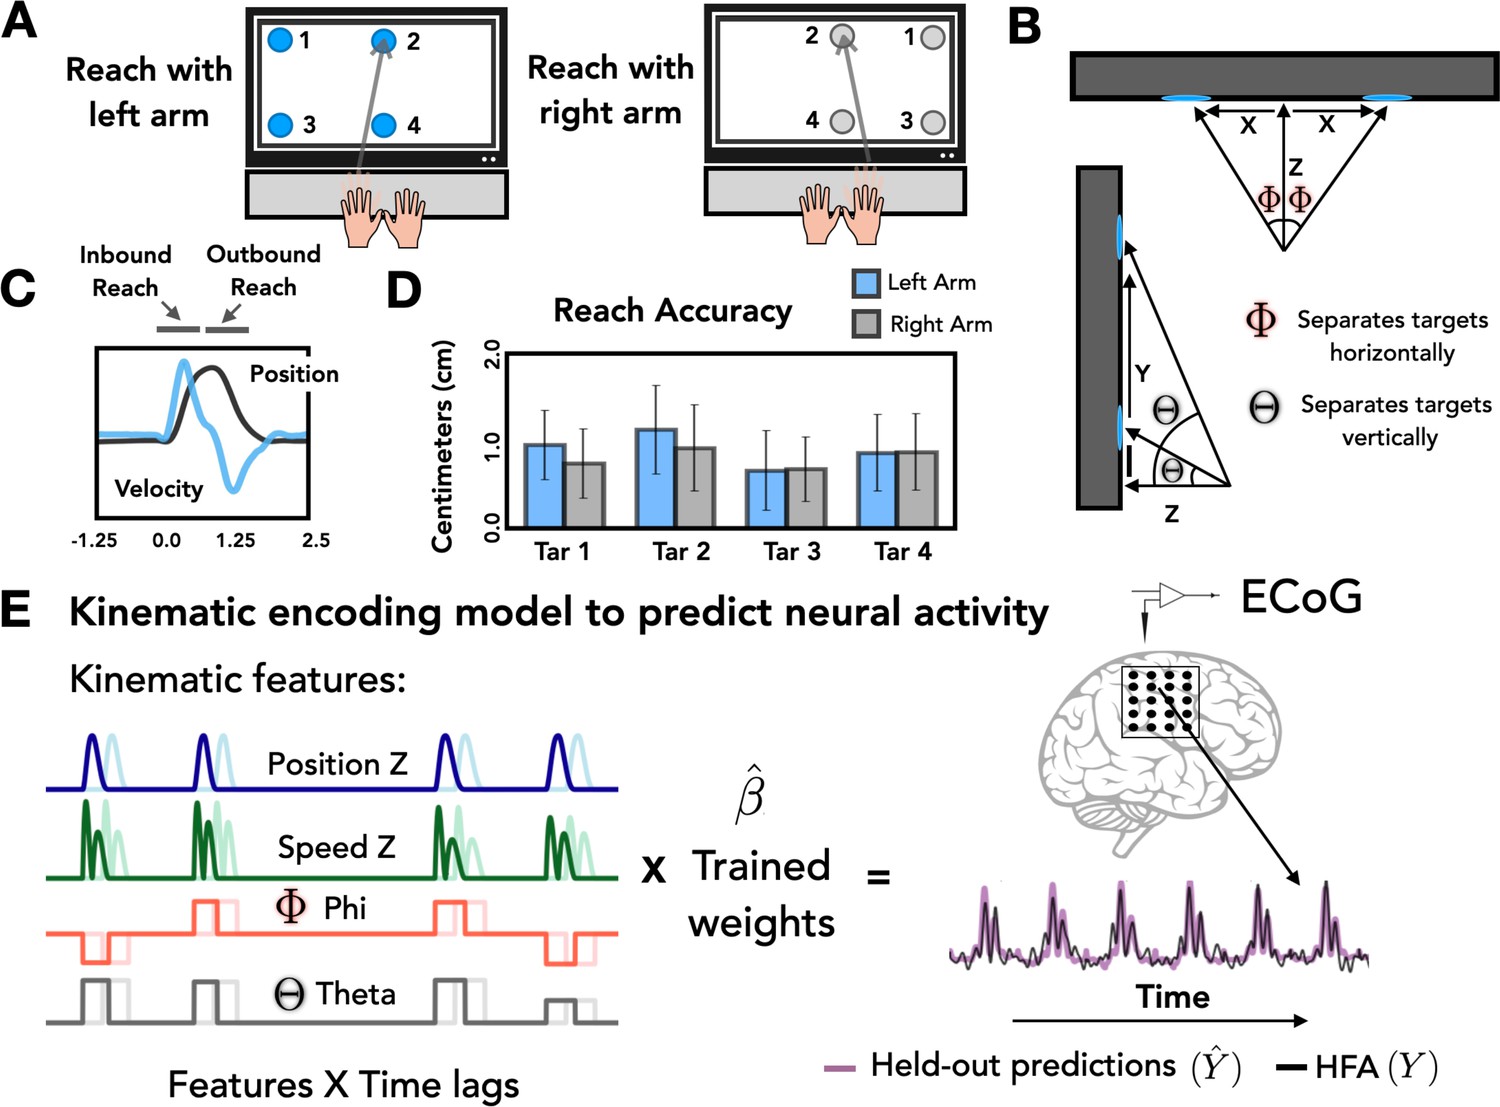
Task and model design.
(A) Task overview. Participants performed an instructed-delay reaching task, moving to targets that appeared on a touchscreen monitor with either the left or right arm. (B) Target positions. The position of each target with respect to the start position of the reaching arm can be defined on the basis of three Cartesian coordinates (X, Y, Z) and two spherical angles (theta and phi). (C) Representative kinematics. Average estimated position and velocity traces for a representative series of trials performed with the left arm. (D) Reach accuracy. Accuracy was quantified as the absolute distance from the center of each target (target diameter = 2.5 cm) to the touch location for all four targets with the left (blue) and right (gray) arm. (E) Kinematic encoding model. Time lagged estimated kinematic features were used to the predict high-frequency activity (HFA) for each electrode using ridge regression. Four kinematic features were included in the model: Position in the Z dimension, speed in the Z dimension, and the two spherical angles phi and theta. Kinematic features were trained on a subset of the HFA data and predictions of HFA were evaluated on held-out test sets.
Figure 1—figure supplement 1
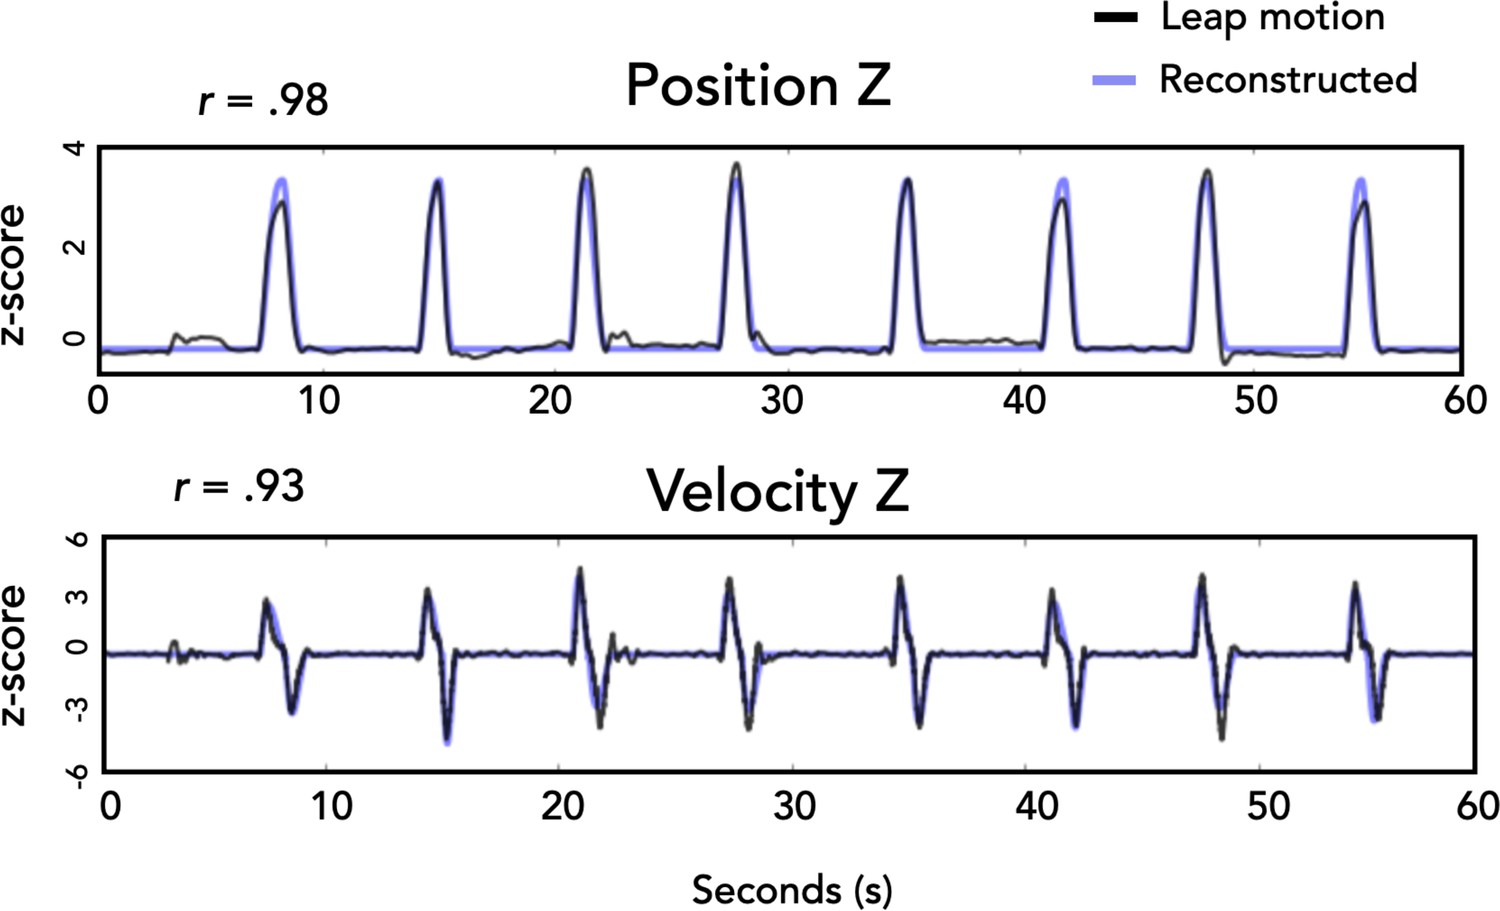
Actual vs. estimated kinematics.
Sample of position and velocity traces along the Z dimension for one participant. Kinematics from the leap motion controller are plotted in black and the estimated kinematics calculated from task parameters are in blue.
Figure 2 with 3 supplements
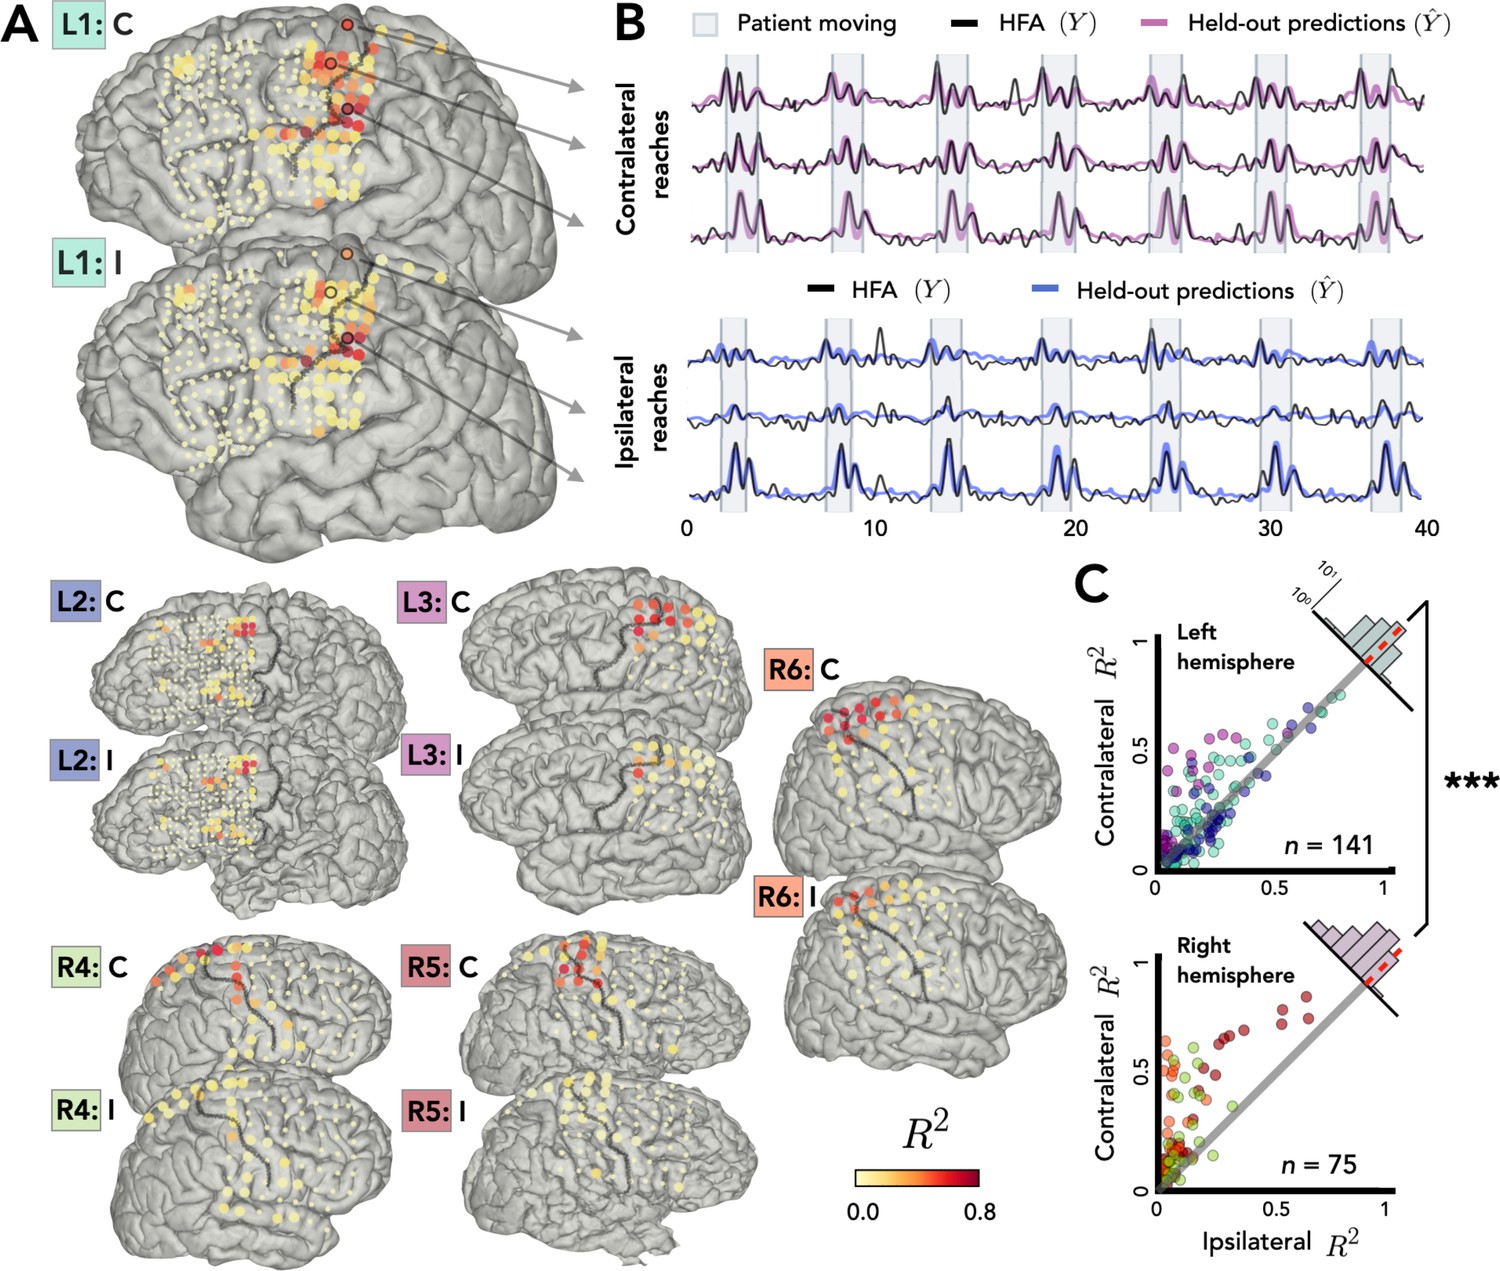
Stronger bilateral encoding in left hemisphere.
Held-out prediction performance (R2) was computed for each electrode during contralateral reaches (C) and ipsilateral reaches (I). R2 was calculated as the squared linear correlation between the actual high-frequency activity (HFA) and the predictions based on the model. (A) Prediction performance maps for individual patients. Performance of each electrode, shown at the idiosyncratic electrode location for each participant (location based on clinical criteria). Electrodes that did not account for at least 0.05% of the variance (R2 < 0.05) in either the contralateral or ipsilateral condition are shown as smaller dots. (B) Model predictions. Representative time series of the actual HFA and model-based predictions for three electrodes during contralateral and ipsilateral reaches. (C) Summary across patients. Scatter plot displaying R2 values separately for patients with electrodes in either the left (upper) or right (lower) hemisphere. Individual patients can be identified in the scatterplot by the color surrounding the patient label (e.g., L1) in A. R2 for contralateral predictions are plotted against R2 for ipsilateral predictions. Electrodes close to the unity line encode both arms equally whereas electrodes off the unity line indicate stronger encoding of one arm. Points above the unity line indicate stronger encoding of the contralateral arm. These differences are summarized in the frequency histograms in the upper right of each panel. The histogram shows less of a shift in the left hemisphere, a signature consistent with stronger bilateral encoding. ***p < 0.001, permutation test.
Figure 2—figure supplement 1
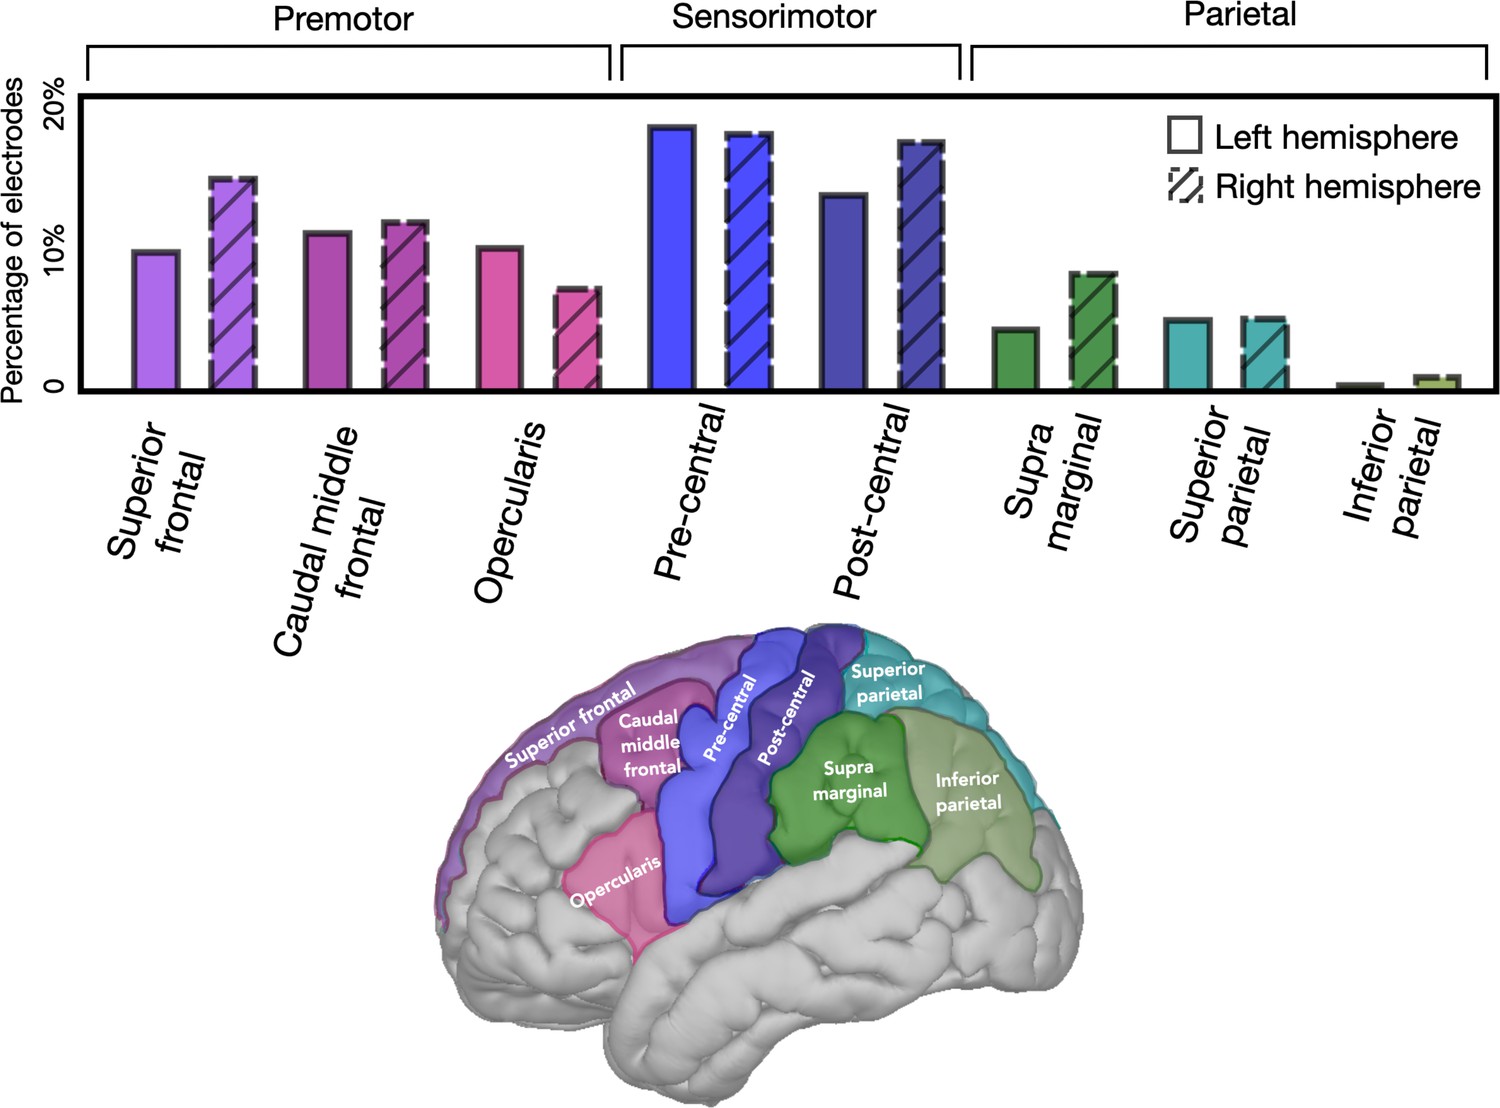
Similar distribution in left and right hemispheres of electrodes in premotor, sensorimotor, and parietal regions.
Each electrode was categorized based on a cortical parcellation provided by the Desikan–Killiany atlas. When pooled across the three left hemisphere and three right hemisphere patients, the proportion of electrodes in the highlighted regions was similar. 70% of all electrodes were assigned to one of these regions.
Figure 2—figure supplement 2
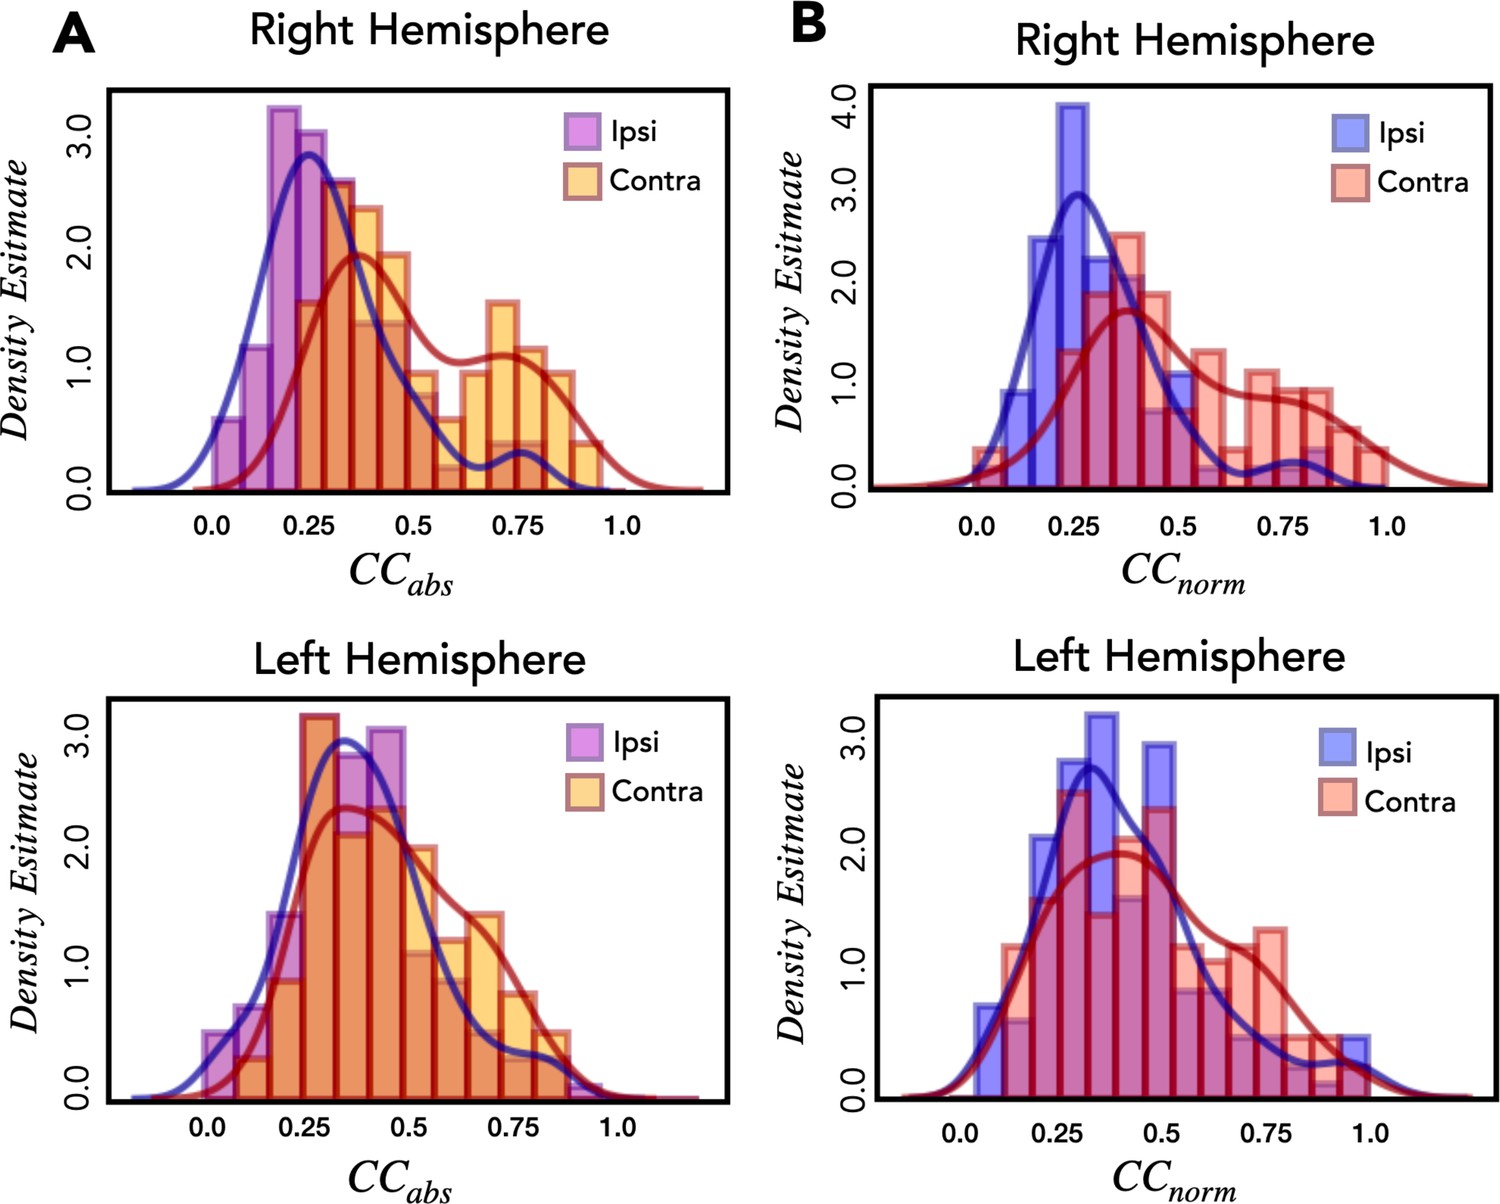
Assessing explainable variance in the encoding model.
(A) The distribution of electrodes using Pearson’s correlation coefficient (CCabs). Histograms of the average held-out correlation for predictive electrodes during ipsilateral and contralateral reaches for the right hemisphere (top) and left hemisphere (bottom). (B) The distribution of all electrodes using the correlation coefficient normalized by signal power (CCnorm). Same as A except the x-values now indicate CCnorm values, a measure designed to account for response variability (see Methods). The two metrics provide similar density estimates, suggesting that the number of observations and signal power in our experimental data is sufficient to capture the majority of explainable variance.
Figure 2—figure supplement 3
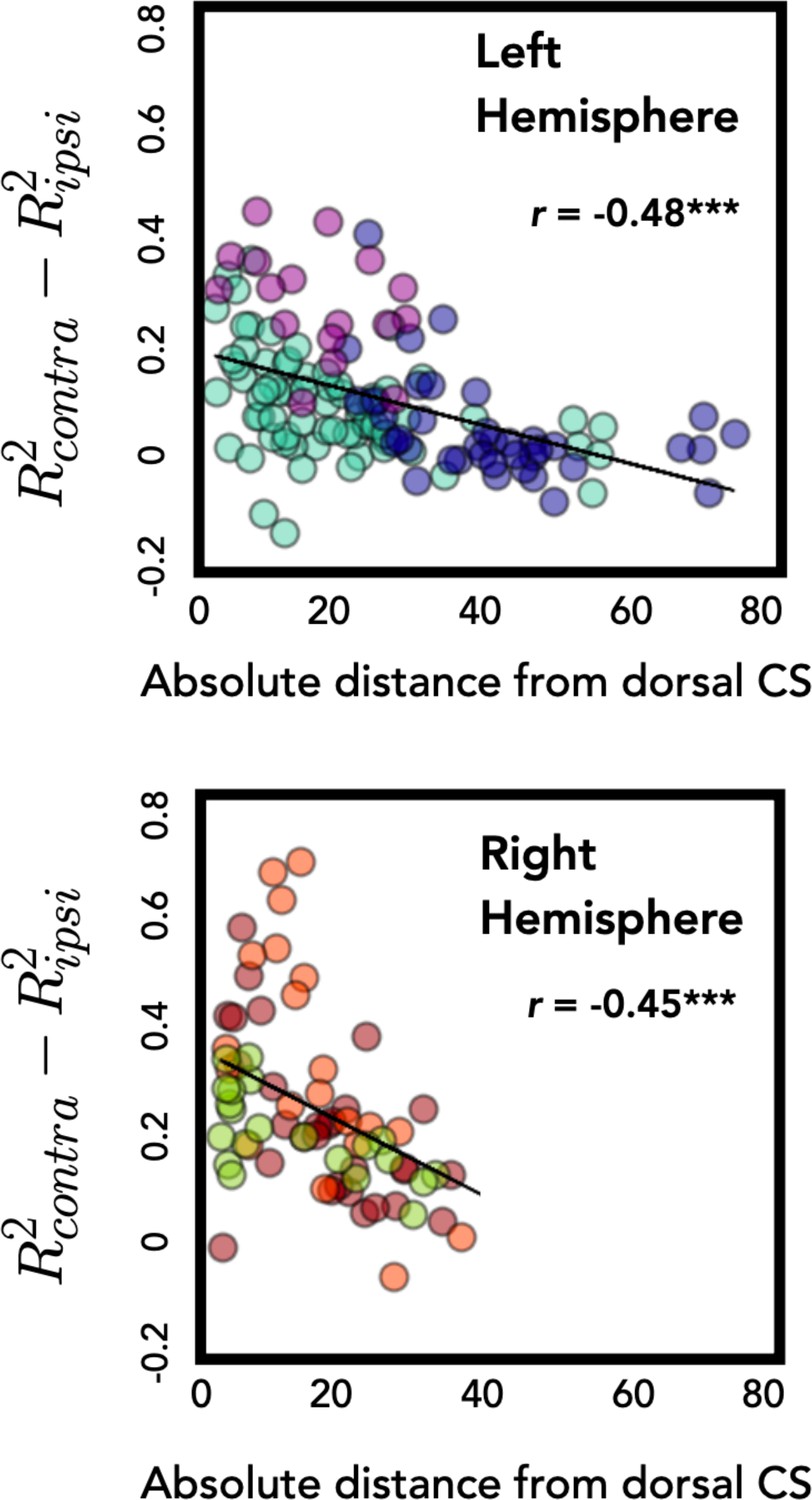
Distance from central sulcus negatively correlates with bilateral encoding.
Degree of unimanual encoding, calculated as difference in R2 for contralateral and ipsilateral movements, is plotted as a function of absolute distance from the dorsal aspect of the central sulcus. Electrodes further from the central sulcus had stronger encoding of the ipsilateral arm for both the left and right hemispheres. ***p < 0.001.
Figure 3
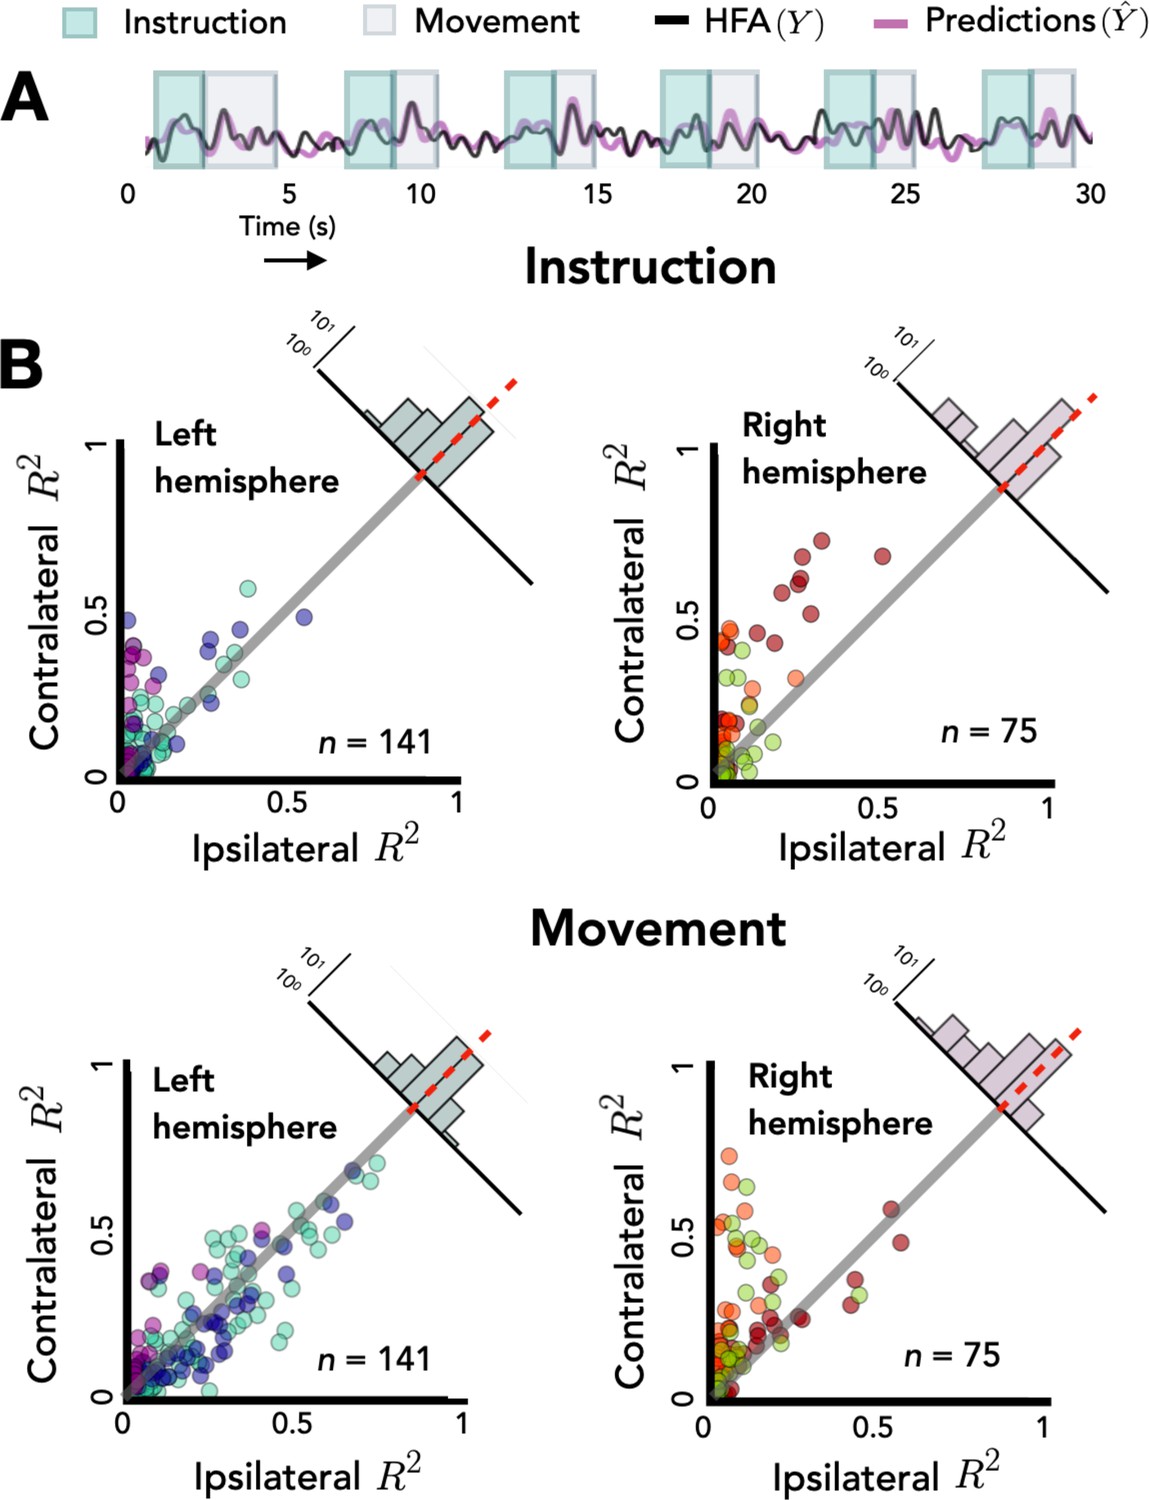
Opposing encoding patterns for left and right hemispheres across task phase.
For all predictive electrodes the time series was segmented into instruction and movement epochs. R2 was then calculated separately for each epoch. (A) Example model predictions. Time series of a representative electrode with boxes surrounding the instruction (teal) and movement epochs (gray). (B) Prediction performance during movement and instruction. Comparison of R2 values for contralateral and ipsilateral predictions during the instruction epoch (top) and the movement epoch (bottom) for patients with electrodes in the left hemisphere (left) or right hemisphere (right). Bilateral encoding was stronger in the left hemisphere, an effect that was especially pronounced during the movement phase.
Figure 4
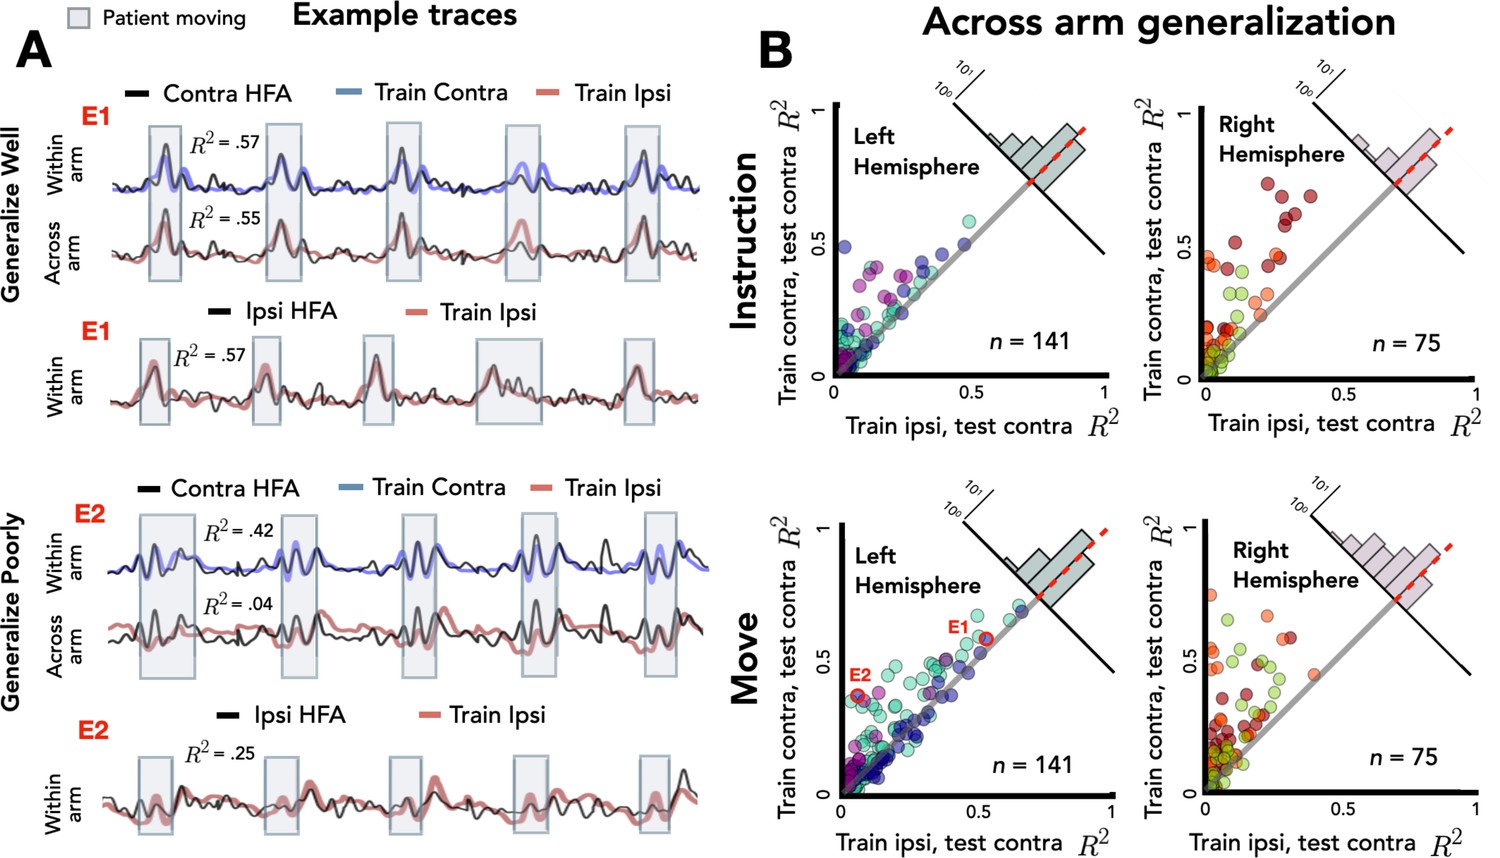
Stronger across-arm generalization in the left hemisphere.
Across-arm predictions were created by training the model on ipsilateral reaches and using the trained weights to predict high-frequency activity (HFA) during contralateral reaches. (Within-arm predictions generated the same as in Figures 2 and 3.) Electrodes close to the unity line have overlapping neural representations across the two arms whereas electrodes off the unity line indicate that the two arms are being encoding differentially. (A) Model predictions. Predicted and actual HFA for two electrodes selected from the distribution of left hemisphere electrodes during movement, one that generalizes well across arms (E1) and one that fails to generalize (E2). Bottom row shows within-arm performance for ipsilateral trials, demonstrating that the failure to generalize across arms does not necessarily indicate poor ipsilateral performance. (B) Across-arm generalization across patients. R2 for within-arm predictions plotted against R2 for across-arm predictions, with the analysis performed separately for the instruction and movement phases. Left hemisphere electrodes showed better generalization than right hemisphere electrodes, an effect that was magnified in the movement phase.
Figure 5 with 1 supplement
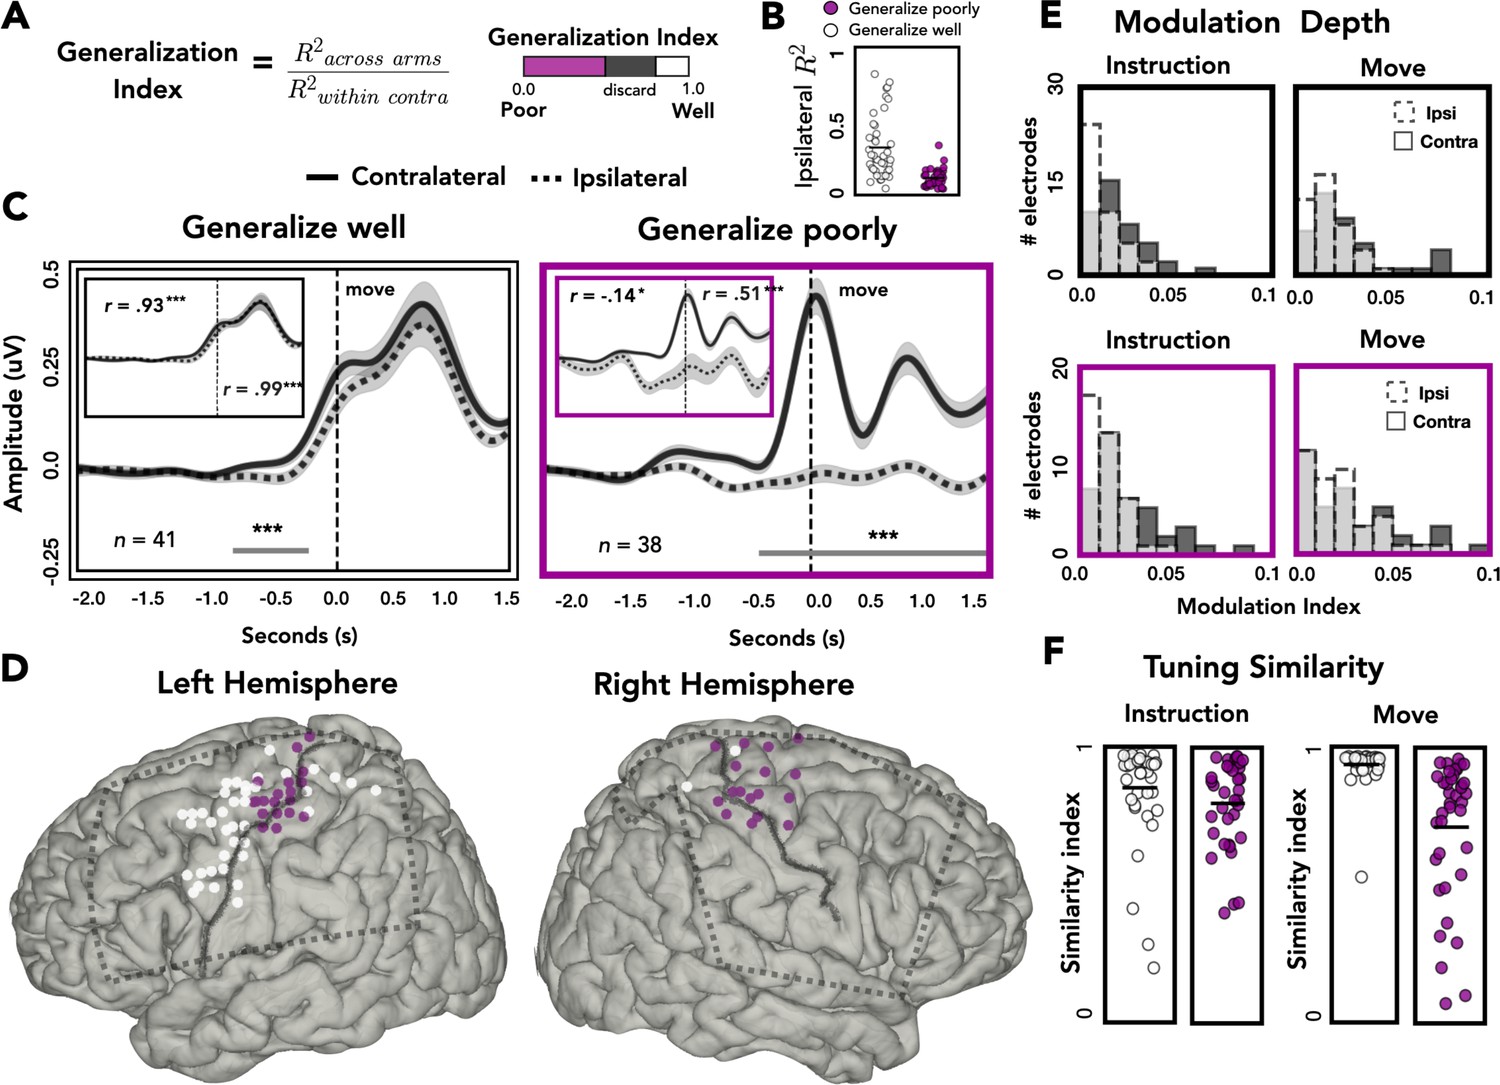
Spatial and temporal relationships of across-arm generalization.
(A) Generalization index. Electrodes were classified as showing good across-arm generalization (white, generalization index >0.80) or poor across-arm generalization (magenta; generalization index <0.50). (B) Ipsilateral encoding strength. Ipsilateral encoding strength for electrodes that generalize well and generalize poorly. (C) Amplitude differences across arms. Average contralateral (solid line) and ipsilateral (dashed line) high-frequency activity (HFA) for electrodes that generalize well across arms (left) or generalize poorly (right). Significant clusters are represented with a gray line. Inset: same data but standardized to highlight shape of the time series independent of absolute amplitude. (D) Spatial distribution of across-arm generalization. Electrodes that generalize well across arms (white) were primarily located in dorsal and ventral premotor regions of the left hemisphere. Electrodes that generalize poorly (magenta) were clustered around the putative arm area of the central sulcus in both the left and right hemispheres. Dashed rectangles indicate extent of electrode coverage across the three patients for each hemisphere. (E) Modulation depth. Depth of tuning was calculated during instruction or movement with either the ipsilateral or contralateral hand. Greater modulation was found during contralateral reaches and during movement. (F) Tuning similarity. Across arms tuning similarity was calculated for electrodes that generalize well (white) or poorly (magenta). Electrodes that generalize well across arms had significantly more tuning similarity than electrodes that did not generalize. *p < 0.05, ***p < 0.001, cluster permutation test, Pearson’s correlation.
Figure 5—figure supplement 1
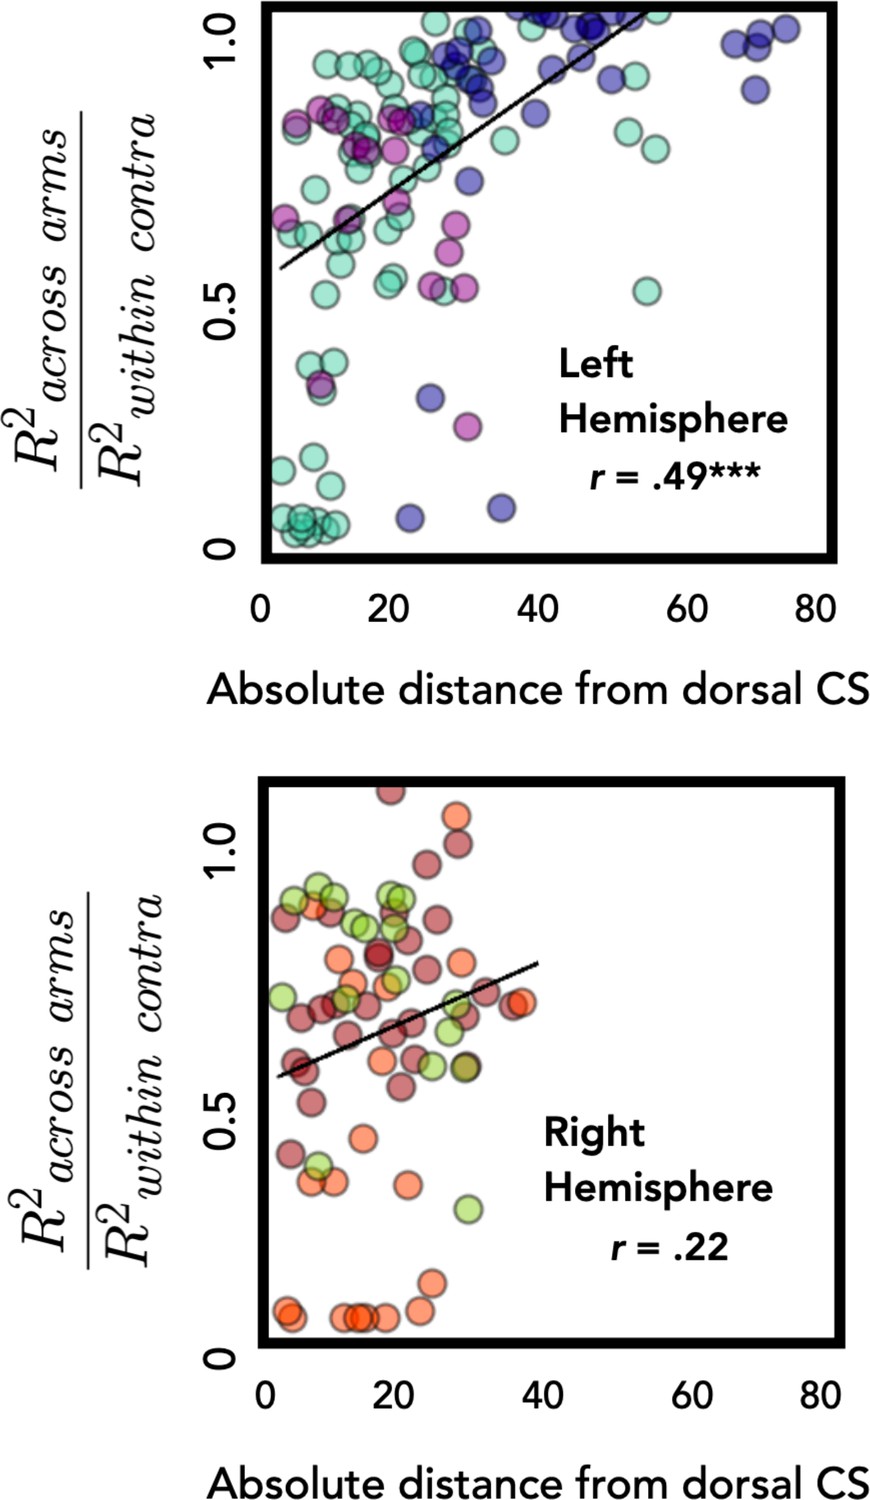
Distance from central sulcus positively correlates with degree of overlap between representations for the left and right movements.
Across-arm generalization was calculated as the ratio of across-arm performance divided by within-arm performance. Electrodes further from the dorsal aspect of the central sulcus had better across-arm generalization in the left hemisphere. This relationship was not significant in the right hemisphere. ***p < 0.001.
Figure 6
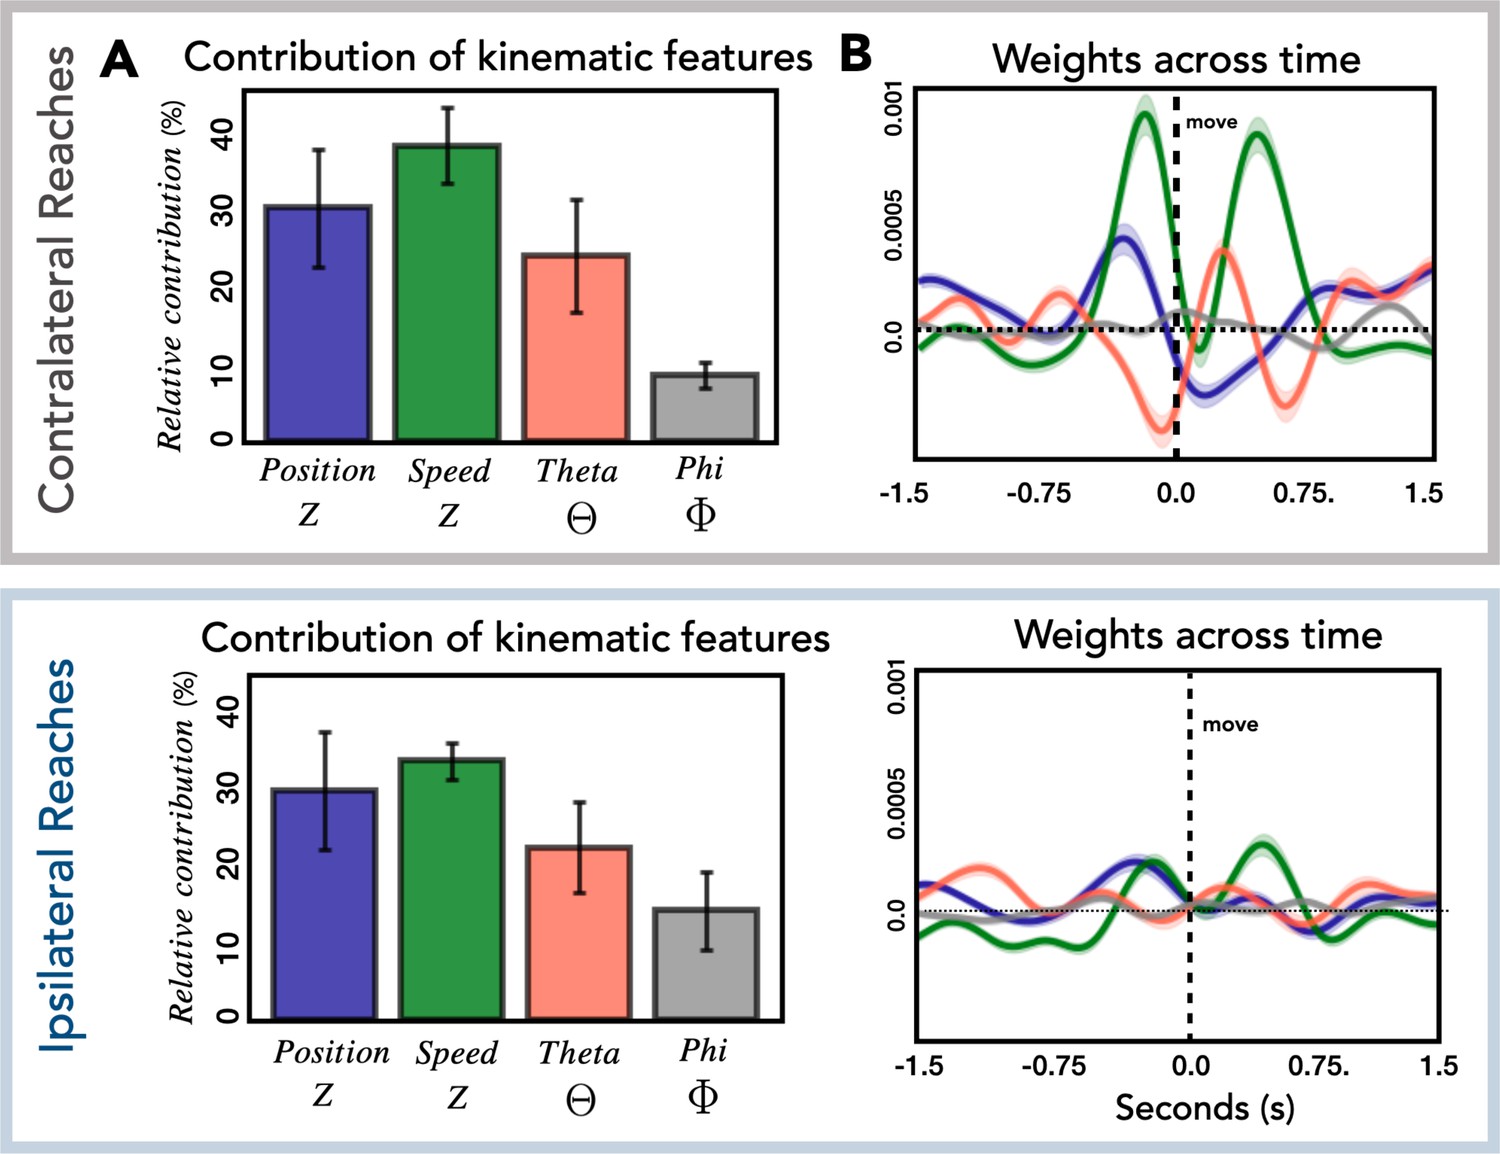
Relationship of kinematic features to high-frequency activity (HFA).
(A) Relative contribution of kinematic features to the encoding model. Average contribution of the four kinematic features for contralateral (top) and ipsilateral (bottom) reaches. Error bars represent the standard deviation across patients. (B) Temporal pattern of weights across time. Average weights for all predictive electrodes are plotted for each kinematic feature for contralateral (top) and ipsilateral (bottom) reaches. Error bars represent the standard error across electrodes.
Figure 7
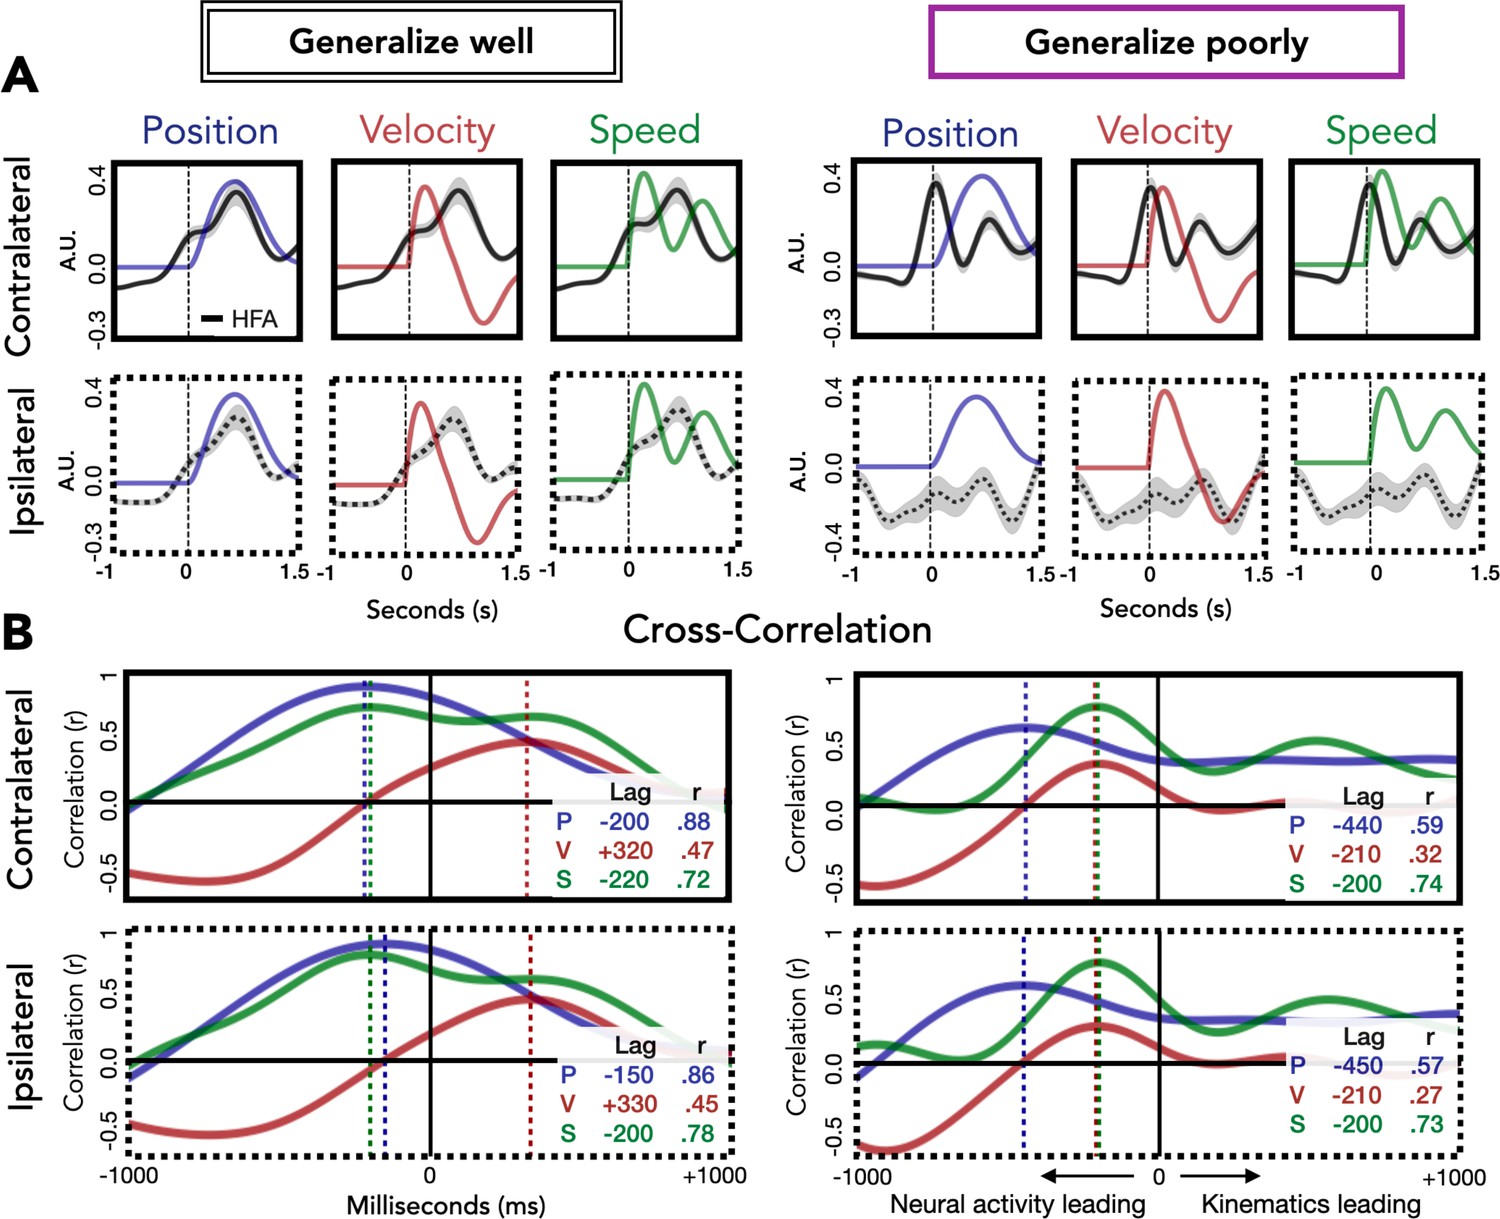
Relationship of kinematic features to high-frequency activity (HFA) for electrodes that generalize well or poorly.
(A) HFA overlaid with kinematics. Each plot shows average HFA activity along with average values for position, velocity, or speed, time-locked to movement onset. (B) Cross-correlation between HFA and kinematic features. The cross-correlation between each kinematic feature and the HFA is plotted for electrodes that generalize well or poorly. For each plot, the lag (in ms) yielding the highest correlation between HFA and kinematics is represented by a dashed line with the lag time and correlation coefficient displayed in the inset at the bottom right of each plot.
Tables
Table 1
Summary of performance measures for each participant.
Reaction times (RT) are averages over left and right arm reaches since RT differences were negligible for the two arms.
| Patient ID | Age | Handedness | RT | Outbound reach | Inbound reach | Total trials |
|---|---|---|---|---|---|---|
| L1 | 36 | Right | 392 (102) | 703 (118) | 907 (287) | 152 |
| L2 | 26 | Right | 1574 (871) | 598 (173) | 1003 (406) | 146 |
| L3 | 55 | Ambidextrous | 771 (345) | 946 (183) | 1429 (252) | 148 |
| R1 | 26 | Right | 518 (194) | 940 (211) | 1027 (345) | 132 |
| R2 | 32 | Right | 335 (55) | 602 (94) | 590 (120) | 145 |
| R3 | 34 | Right | 534 (157) | 721 (145) | 1017 (318) | 145 |
Additional files
Download links
A two-part list of links to download the article, or parts of the article, in various formats.
Downloads (link to download the article as PDF)
Open citations (links to open the citations from this article in various online reference manager services)
Cite this article (links to download the citations from this article in formats compatible with various reference manager tools)
Left hemisphere dominance for bilateral kinematic encoding in the human brain
eLife 11:e69977.
https://doi.org/10.7554/eLife.69977


