Receptor repertoires of murine follicular T helper cells reveal a high clonal overlap in separate lymph nodes in autoimmunity
- Institute for Anatomy, University of Lübeck, Germany
- Lübeck Institute of Experimental Dermatology, University of Lübeck, Germany
- Laboratoire Adhésion et Inflammation, Inserm U1067 CNRS, Aix-Marseille Université, France
- Centre d'Immunologie de Marseille Luminy (CIML), INSERM U1104, Aix-Marseille Université UM2, France
- Department of Dermatology, University of Pennsylvania, United States
- Department of Dermatology, University of Lübeck, Germany
Figures
Figure 1 with 1 supplement
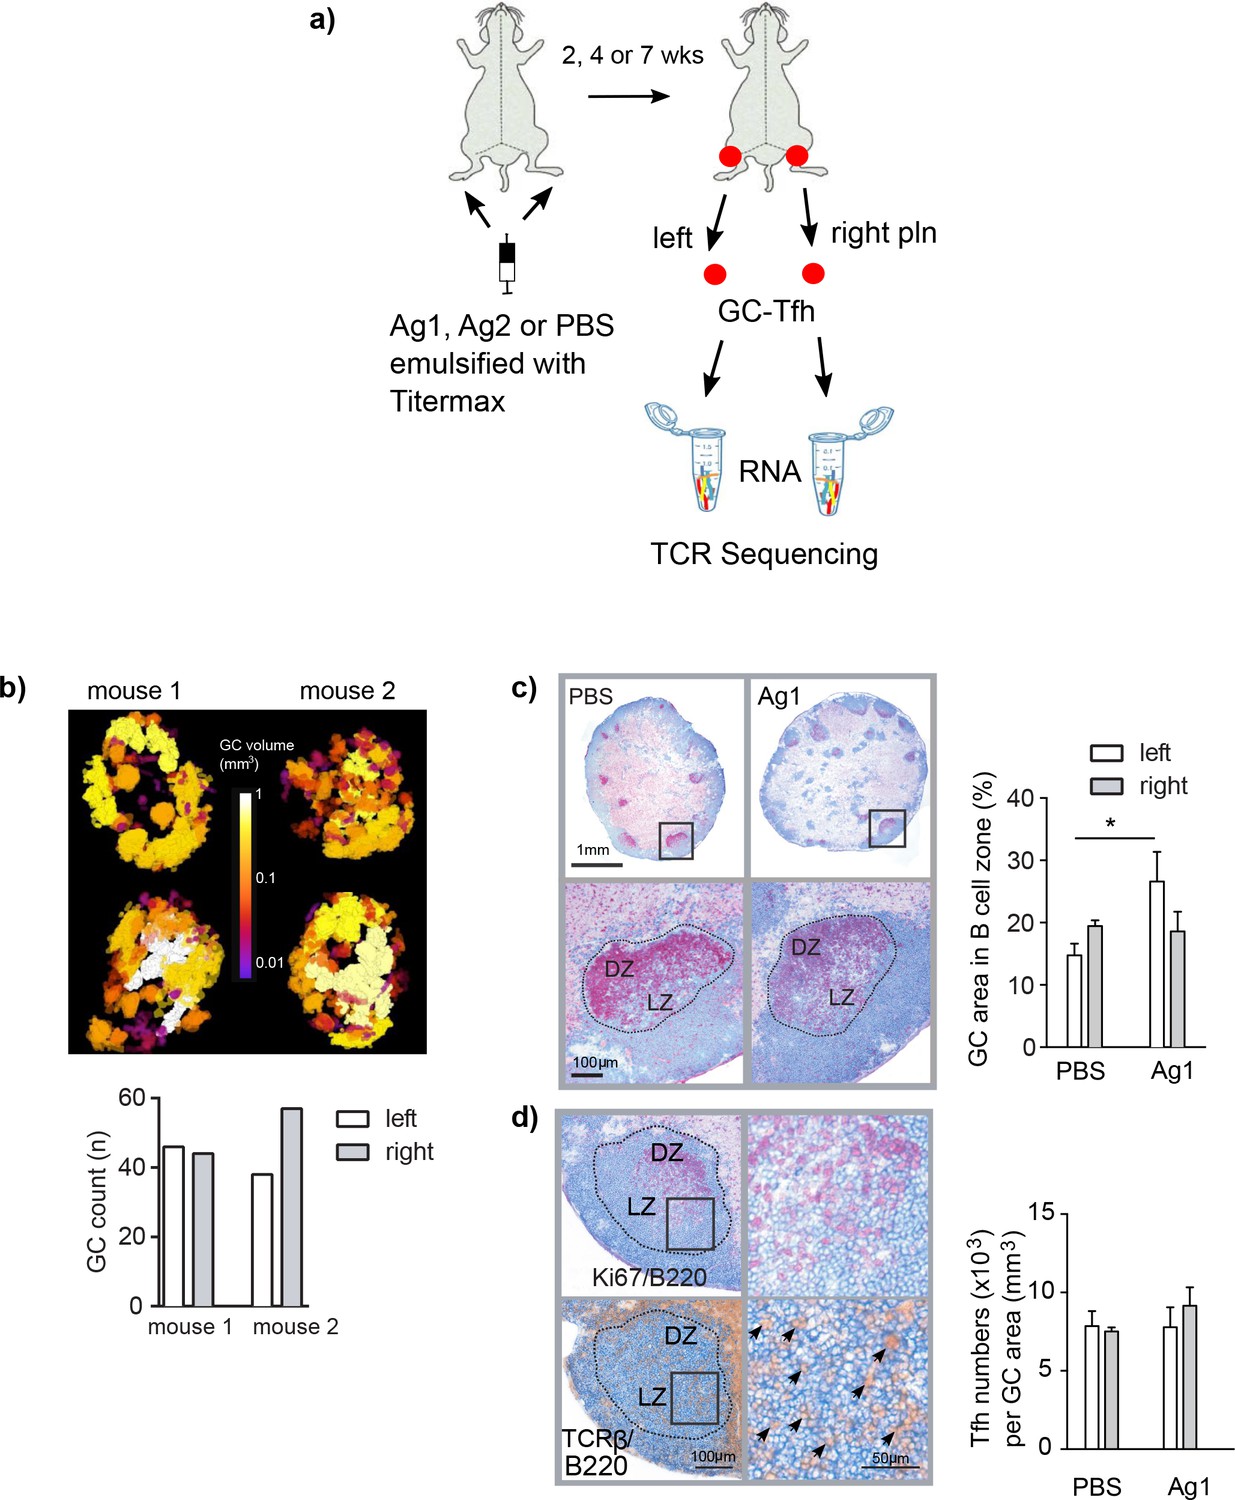
Induction of germinal centers (GCs) in left and right popliteal lymph nodes (pln) after immunization with Ag1.
(a) Experimental setup is shown. Ag1 or Ag2 or phosphate-buffered saline (PBS) emulsified in the adjuvant TM were injected s.c. into both footpads. Both draining pln were isolated 2, 4, or 7 weeks post injection, GCs were laser-captured, RNA was isolated, and TCRβ sequences were separately identified. (b) Serial cryosections of left and right pln were prepared and GCs were stained immunohistochemically with antibodies specific for B cells (B220, blue), proliferating cells (Ki67, red), and T cells (TCRβ, brown). The slides were scanned, and pln were displayed as 3D image (top panel, Videos 1–4, GC volumes are shown in the middle). GC volumes of all GCs were calculated and enumerated (bottom panel). (c) Left and right pln were stained immunohistochemically with antibodies specific for B cells (B220, blue) and proliferating cells (Ki67, red, top panel). Dotted lines display the laser-captured GC areas. Magnification shows an area within the GC with the light (LZ) and the dark zones (DZ) (bottom panel). The area of the complete B cell zone and the area of all GCs per cryosection were measured. The GC area was calculated as percentage of the B cell zone area (right). Data are presented as mean ± SD (*p<0.05; n = 3, two pln each, Kruskal–Wallis test). (d) Sequential sections were prepared and stained either for B cells (B220, blue) and proliferating cells (Ki67, red) to identify LZ and DZ or for B cells (B220, blue) and T cells (TCRβ, brown) for detection of Tfh (left panel). Magnification shows an area within the GC (right panel). Arrows indicate individual Tfh. Tfh residing within GCs were counted in left and right pln (right). Data are presented as mean ± SD (no significant differences were found; n = 3, two pln each, Kruskal–Wallis test).
Figure 1—figure supplement 1
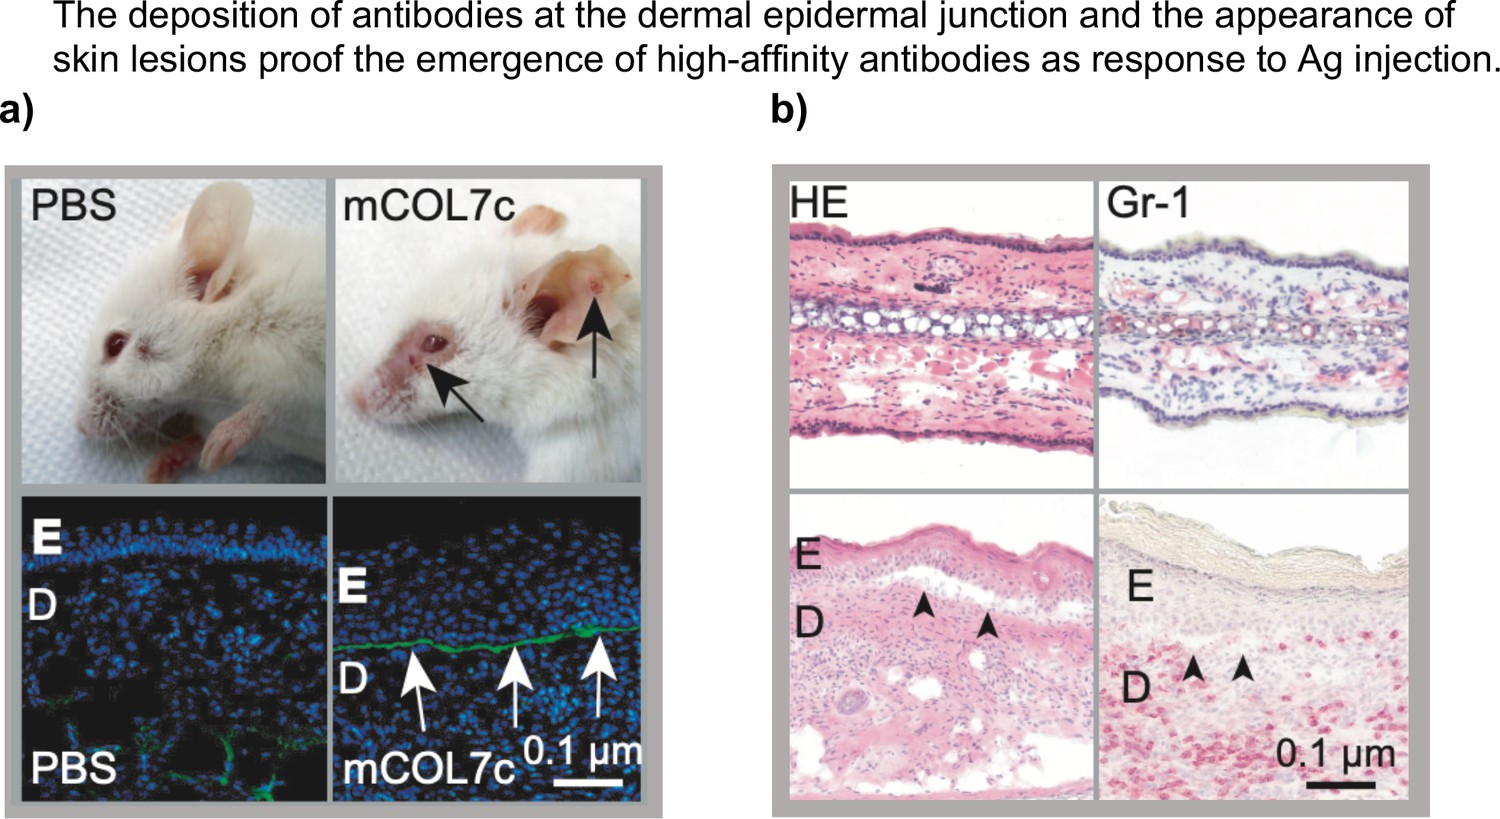
mCOL7c immunization induces autoantibodies, which bind at the dermal epidermal junction and induces skin lesions.
Ag1/TM or PBS/TM was injected into both footpads of SJLH2s mice. (a) Formation of skin lesions (EBA wounds) and IgG deposition at the dermal-epidermal-junction (DEJ) was assessed 4 weeks post injection. (b) Immunohistochemical staining via H&E and for the cell-specific marker Gr-1 demonstrate an inflammatory infiltrate of GR1+ myeloid cells. Arrows indicate the EBA-specific detachment of the epidermis and dermis (E = epidermis, D = dermis) (Niebuhr et al., 2020). PBS: phosphate-buffered saline.
Figure 2 with 2 supplements
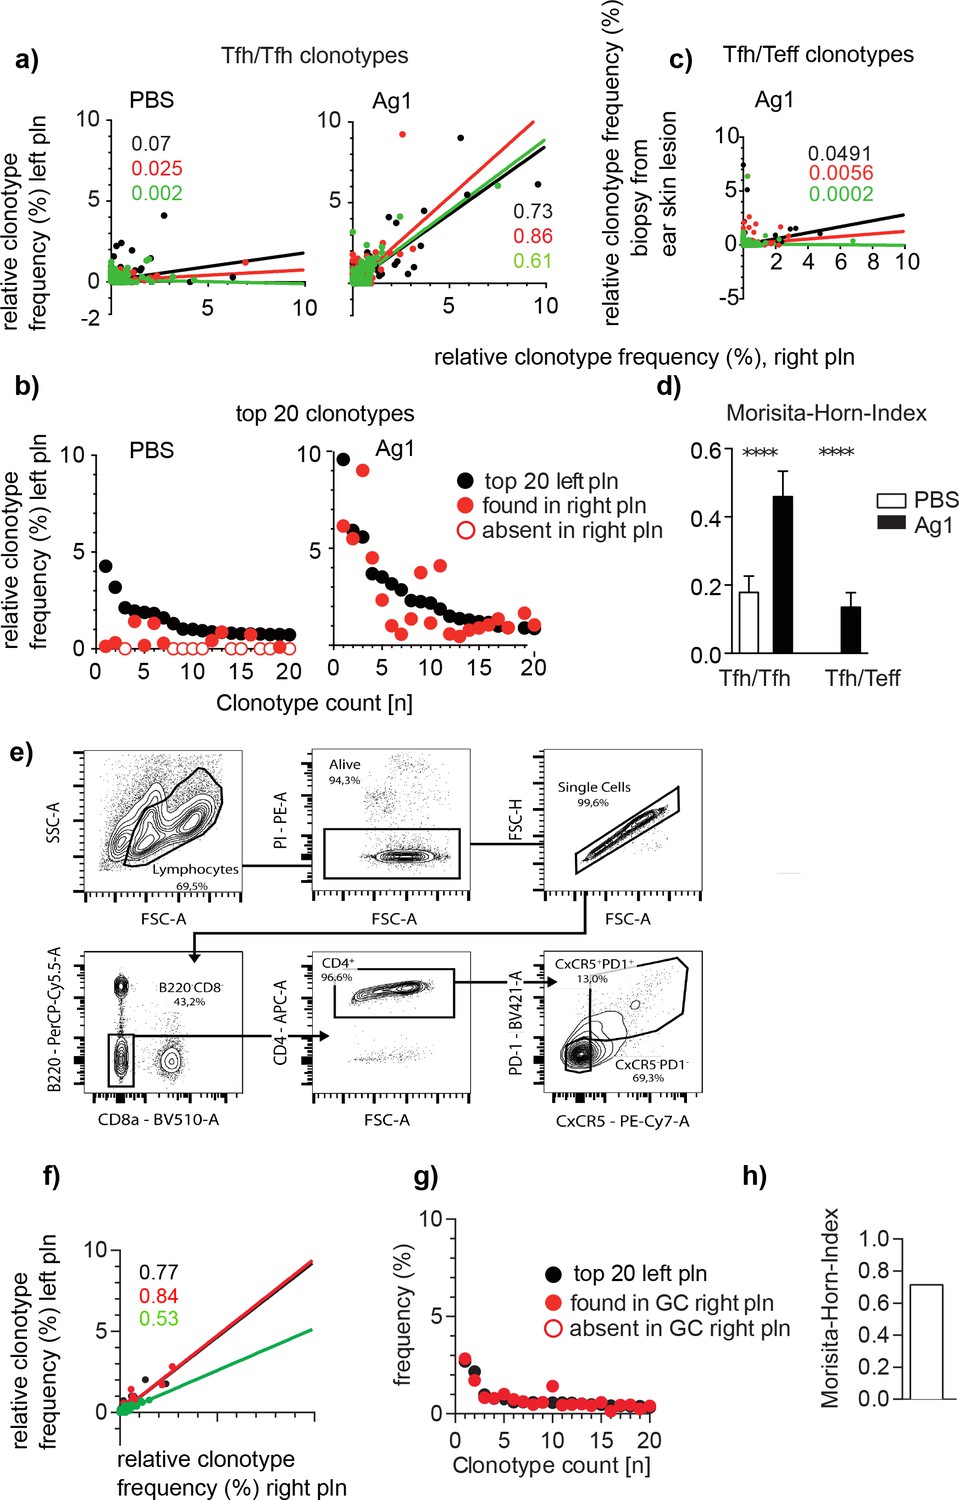
Identical Tfh clonotypes accumulate within germinal centers (GCs) of both popliteal lymph nodes (pln) at the time point of skin lesion onset.
Ag1 or phosphate-buffered saline (PBS) were injected s.c. into both footpads. GCs from left and right pln were isolated and GC-Tfh clonotypes were analyzed 4 weeks post injection. (a) The frequency of overlapping GC-Tfh clonotypes of the left (y-axis) and right pln (x-axis) is shown as dot plots. Each dot represents one GC-Tfh clonotype. Linear regression lines ranging from 0 to 10 and r (Qi, 2016) values are depicted for each mouse (n = 3, mouse 1: black; mouse 2: red; mouse 3: green). (b) The 20 most frequent GC-Tfh clonotypes present in the left pln (black dots) are compared to their presence in the right pln (red dots). One representative comparison out of three is shown. (c) The frequency of ear skin-derived TCRβ clonotypes (Teff, y-axis) shared with the GC-Tfh clonotypes of one pln (x-axis) is shown as dot plots. Each dot represents one clonotype. Linear regression lines ranging from 0 to 10 and r (Qi, 2016) values are depicted for each mouse (n = 3, mouse 1: black; mouse 2: red; mouse 3: green). (d) Data of GC-Tfh clonotypes shared between left and right pln are shown as Morisita–Horn index (MHI; right) and compared to the MHI of similar TCRβ clonotypes between pln and ear skin (mean ± SD; ***p<0.001, Mann–Whitney U-test, n = 3, two pln each). (e) Gating strategy for CD4/PD1/CXCR5 for sorting of Tfh from left and right pln .(f–h) as described in (a, b, d).
Figure 2—figure supplement 1
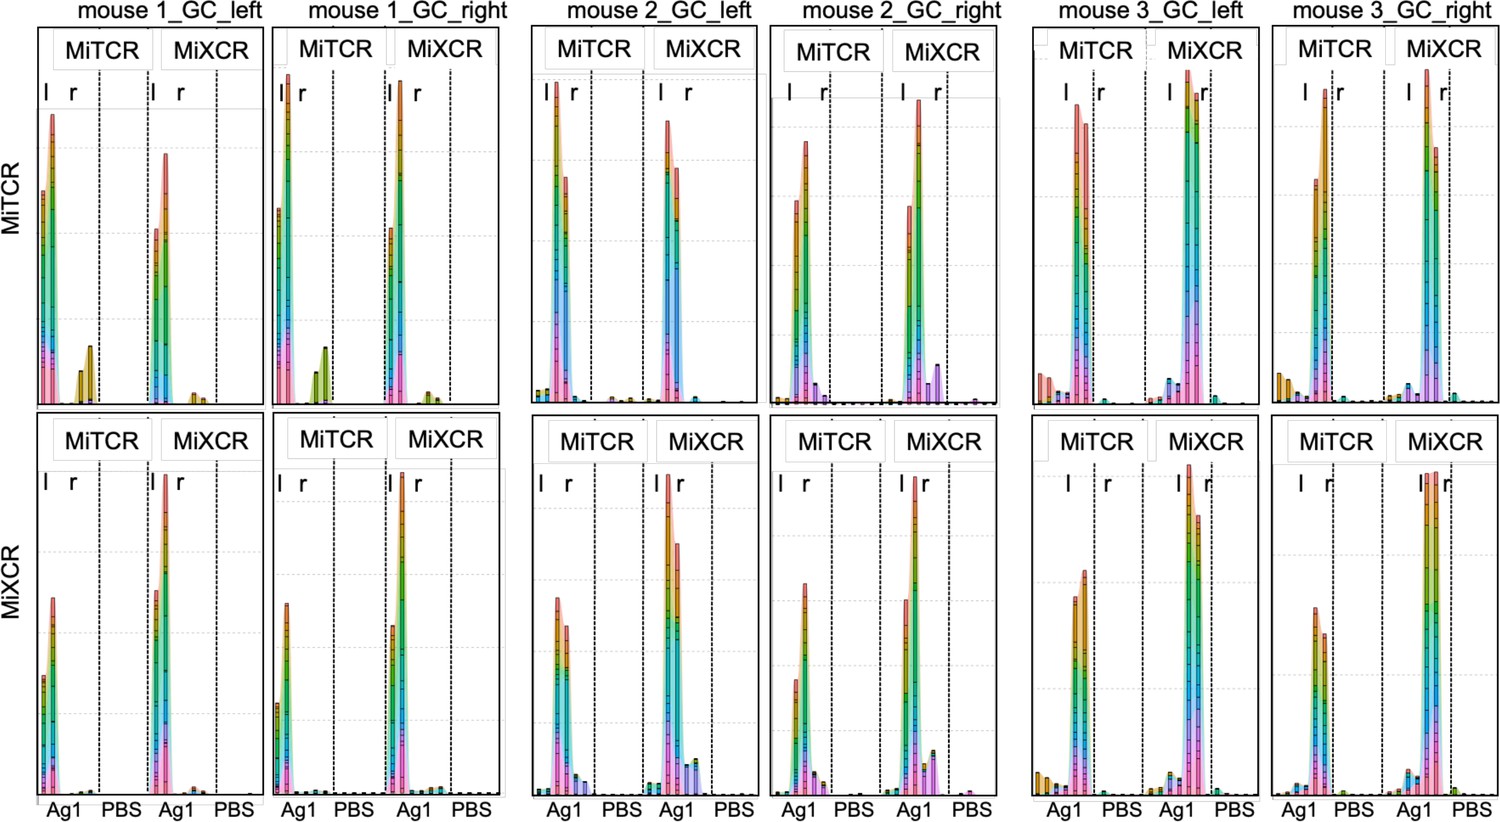
Comparison of MiTCR and MiXCR analysis tools reveals a similar distribution of dominant Tfh clonotypes.
To exclude unwanted errors by a potential overestimation of T cell receptor (TCR) repertoire diversities after MiTCR analysis, raw data were reanalyzed using the MiXCR software tool (Bolotin et al., 2013; Bolotin et al., 2015). TCRβ clonotypes obtained from raw data of germinal centers (GCs) of both popliteal lymph nodes (pln) 4 weeks after injection of Ag1 or phosphate-buffered saline (PBS) were annotated either by MiTCR (upper panel) or MiXCR (lower panel). The clonotype tracking tool from the R package tool Immunarch was used to compare 20 most dominant Tfh clonotypes of one pln across all samples. In each panel, the 20 most abundant Tfh clonotypes of one pln, either left (l) or right (r), were compared to the contralateral pln of the same mouse and to the left or right pln of all other mice of the Ag1 or PBS groups after analysis by MiTCR or by MiXCR and vice versa. The distinct clonotypes are displayed in different colors. The highly identical pattern demonstrates that the high overlap of dominant Tfh clonotypes in the contralateral pln of the same mouse is found in both MiTCR or MiXCR analyzed samples.
Figure 2—figure supplement 2
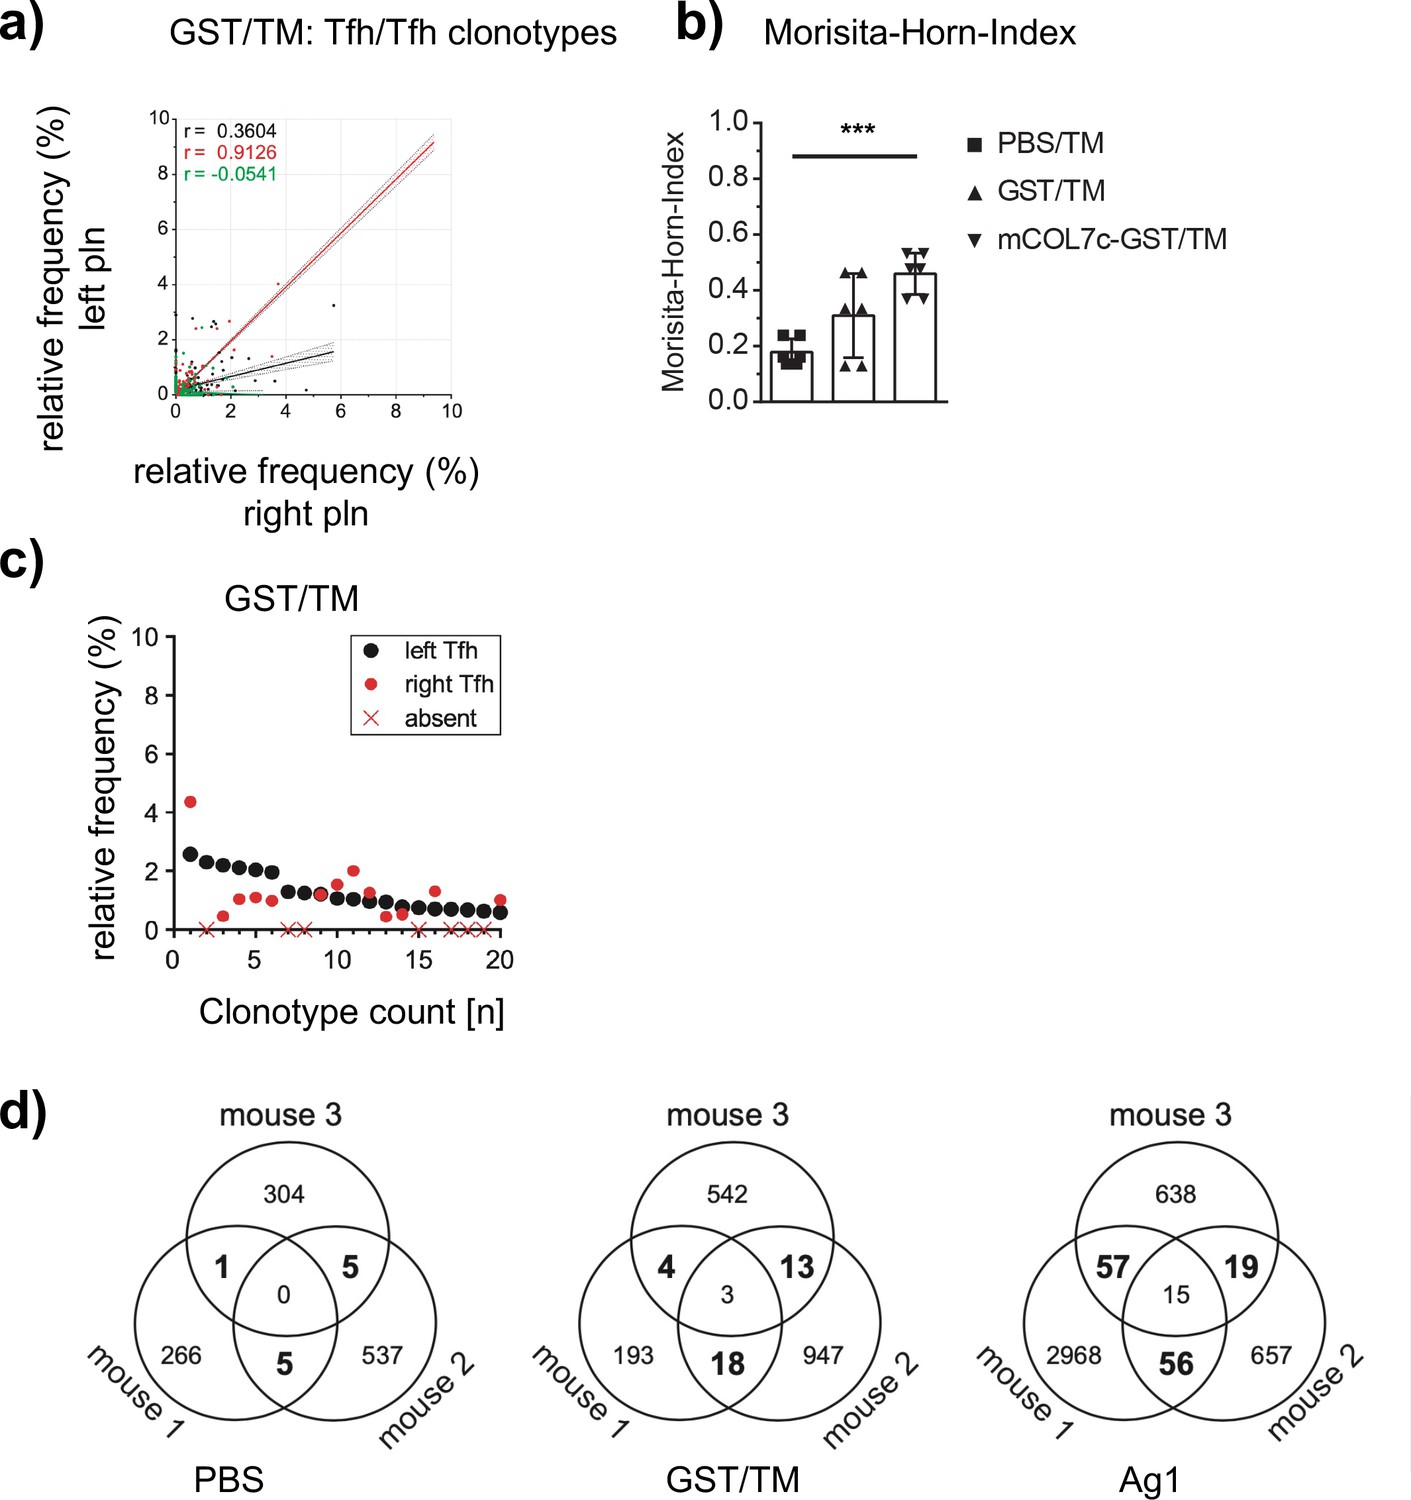
Assessment of Tfh clonotypes within left and right popliteal lymph nodes (pln) after injection of glutathione-s-transferase (GST).
GST emulsified in TM was injected s.c. into both footpads of SJLH2s mice. Germinal centers (GCs) from left and right pln were isolated and GC-Tfh clonotypes were analyzed 4 weeks post injection. (a) The frequency of overlapping GC-Tfh clonotypes of the left (y-axis) and right pln (x-axis) is shown as dot plots. Each dot represents one GC-Tfh clonotype. Linear regression lines ranging from 0 to 10 and r (Qi, 2016) values are depicted for each mouse (n = 3, mouse 1: black; mouse 2: red; mouse 3: green). (b) The Morisita–Horn index (MHI) of the GST group is compared to the Ag1 and PBS groups (mean ± SD; ***p<0.001, Mann–Whitney U-test, n = 3, two pln each). (c) The 20 most frequent GC-Tfh clonotypes present in the left pln (black dots) are compared to their presence in the right pln (red dots). One representative comparison out of three is shown. (d) Venn diagrams show the number of overlapping Tfh clonotypes between the three mice of one group (exemplary of an individual Tfh sample per mouse).
Figure 3 with 1 supplement
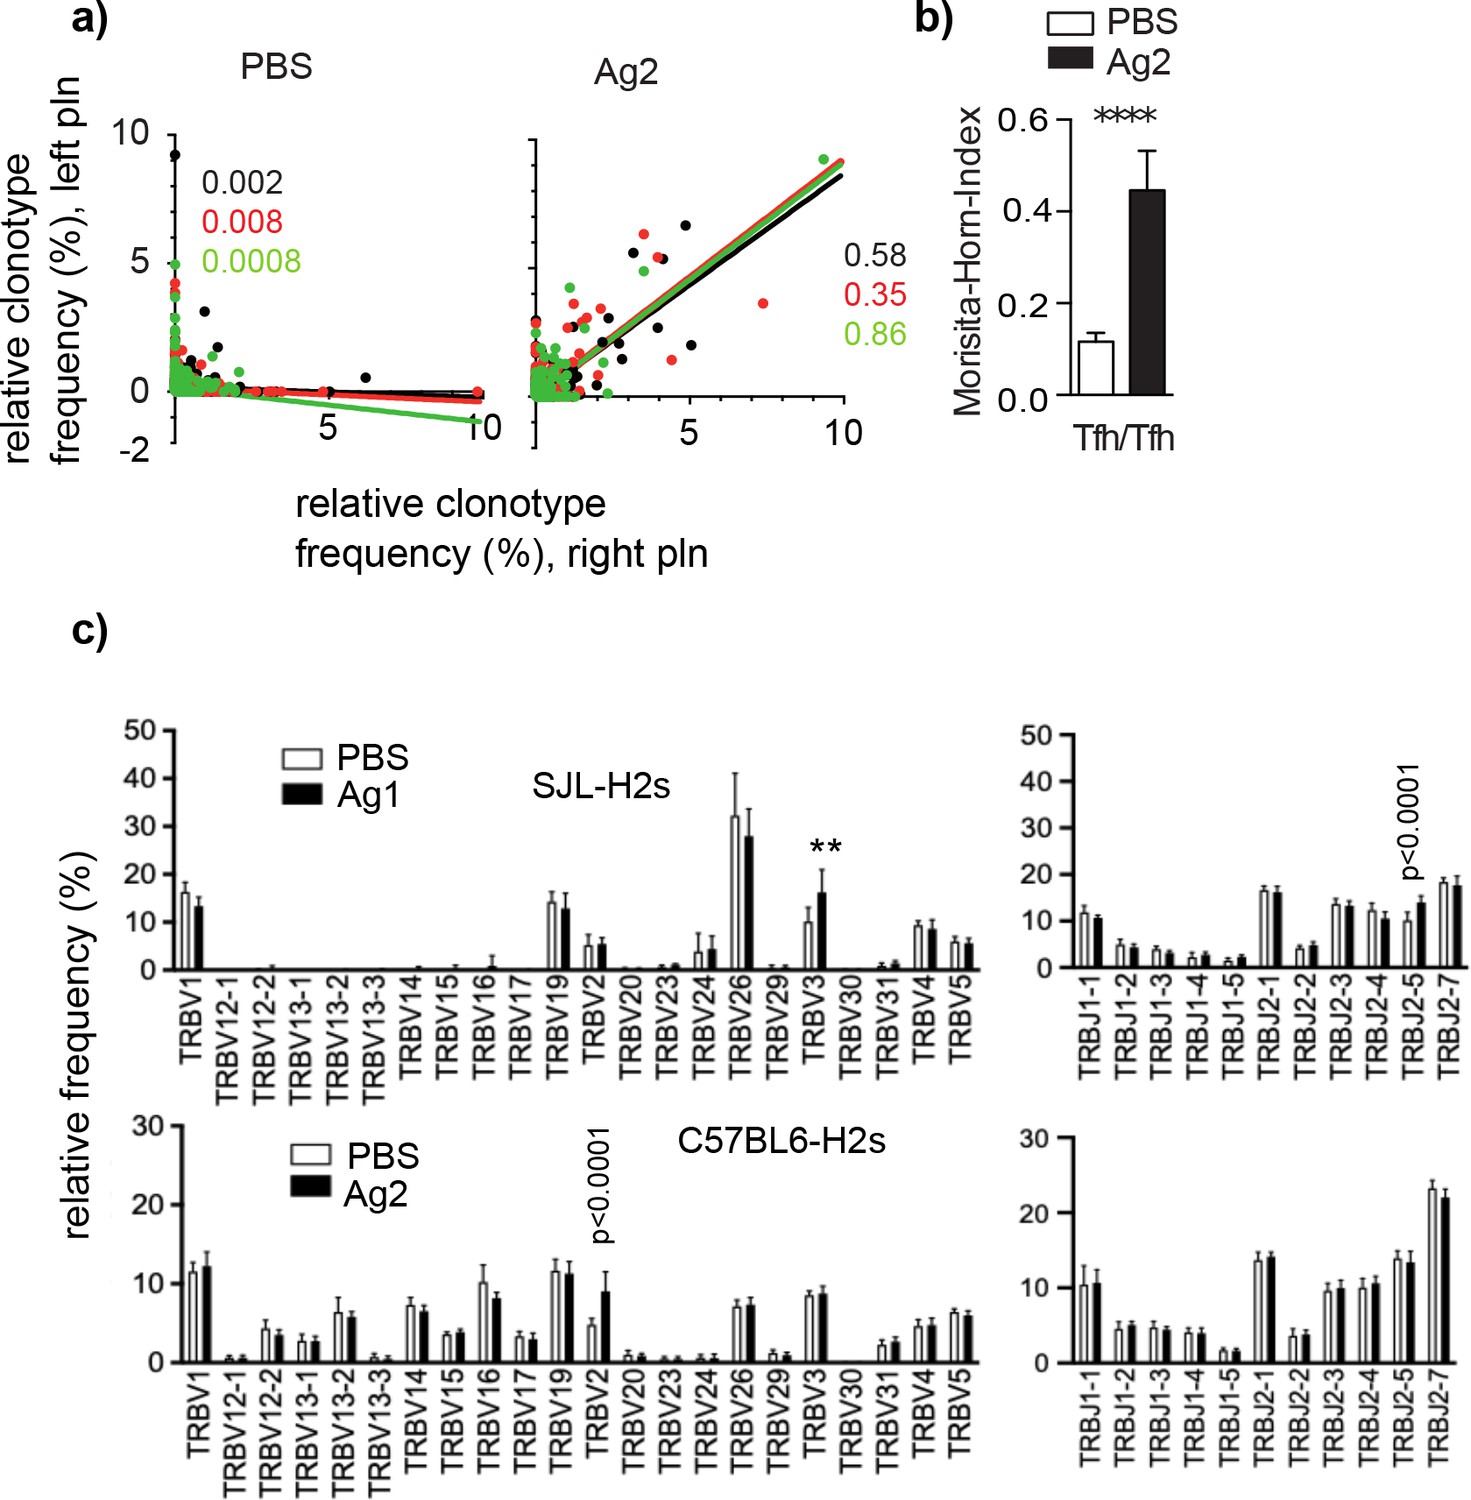
GC-Tfh expressing a particular TRBV or TRBJ segment accumulate in an Ag-specific manner.
Ag2 or phosphate-buffered saline (PBS) were injected into C57BL/6s mice. Germinal centers (GCs) from left and right popliteal lymph nodes (pln) were isolated and Tfh clonotypes were analyzed 4 weeks post injection. (a) The relative frequency of overlapping GC-Tfh clonotypes of the left (y-axis) and right pln (x-axis) is shown as dot plots. Each dot represents one GC-Tfh clonotype. Linear regression lines ranging from 0 to 10 and r2 values are depicted for each mouse (n = 3, mouse 1: black; mouse 2: red; mouse 3: green). (b) The similarity index (Morisita–Horn index [MHI]) reveals a high overlap in Ag2-exposed pln but not in the PBS group (mean ± SD; ***p<0.001, Mann–Whitney U-test, n = 3, two pln each). (c) Relative frequencies of TRBV (left) and TRBJ (right) expressed by GC-Tfh clonotypes were compared between the Ag and PBS groups after injection of Ag1 (upper panel) or Ag2 (lower panel). Mean ± SD; **p<0.01, p<0.0001, two-way ANOVA with Sidak's correction test, n = 3 (two pln each). Of note, the lack of TRBV segments is caused by deletions in the TCR gene of SJL mice (Behlke et al., 1986).
Figure 3—figure supplement 1
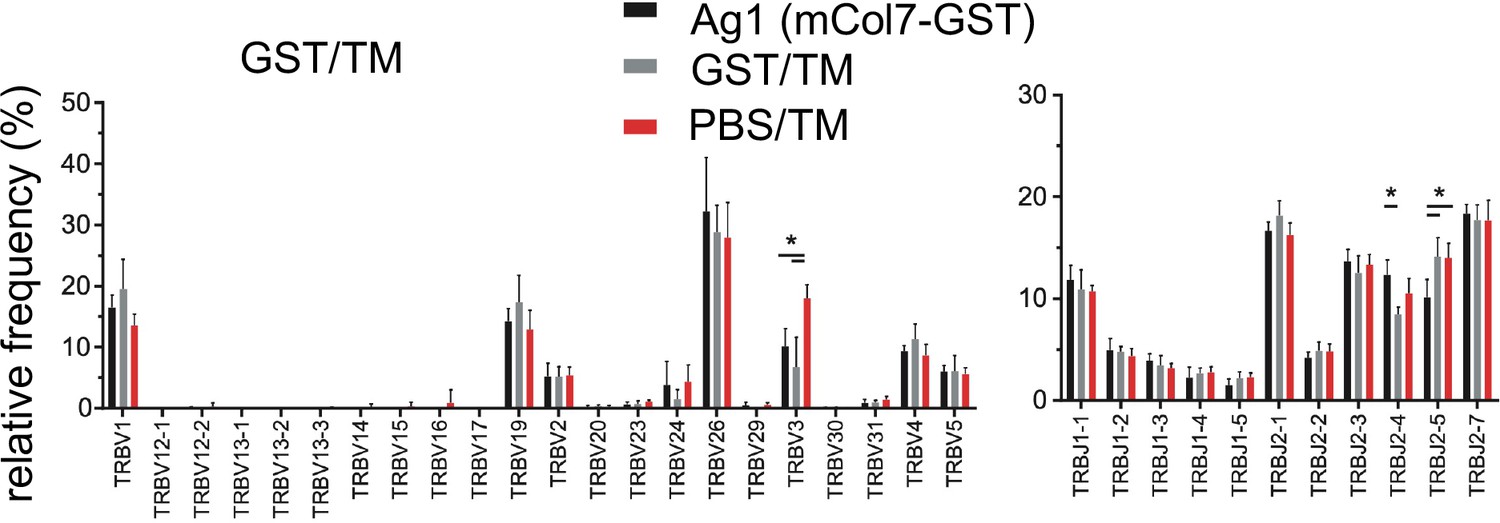
Assessment of TRBV frequencies of Tfh clonotypes within germinal centers (GCs) after injection of glutathione-s-transferase (GST).
GST emulsified in TM was injected s.c. into both footpads. GCs from left and right popliteal lymph nodes (pln) were isolated and GC-Tfh clonotypes were analyzed 4 weeks post injection. Relative frequencies of TRBV (left) and TRBJ (right) expressed by GC-Tfh clonotypes were compared between the Ag1, GST, and phosphate-buffered saline (PBS) groups. Data is expressed as means ± SD, n = 3, two pln each, *p<0.05, Kruskal–Wallis test with Dunnett’s post-hoc test.
Figure 4 with 1 supplement
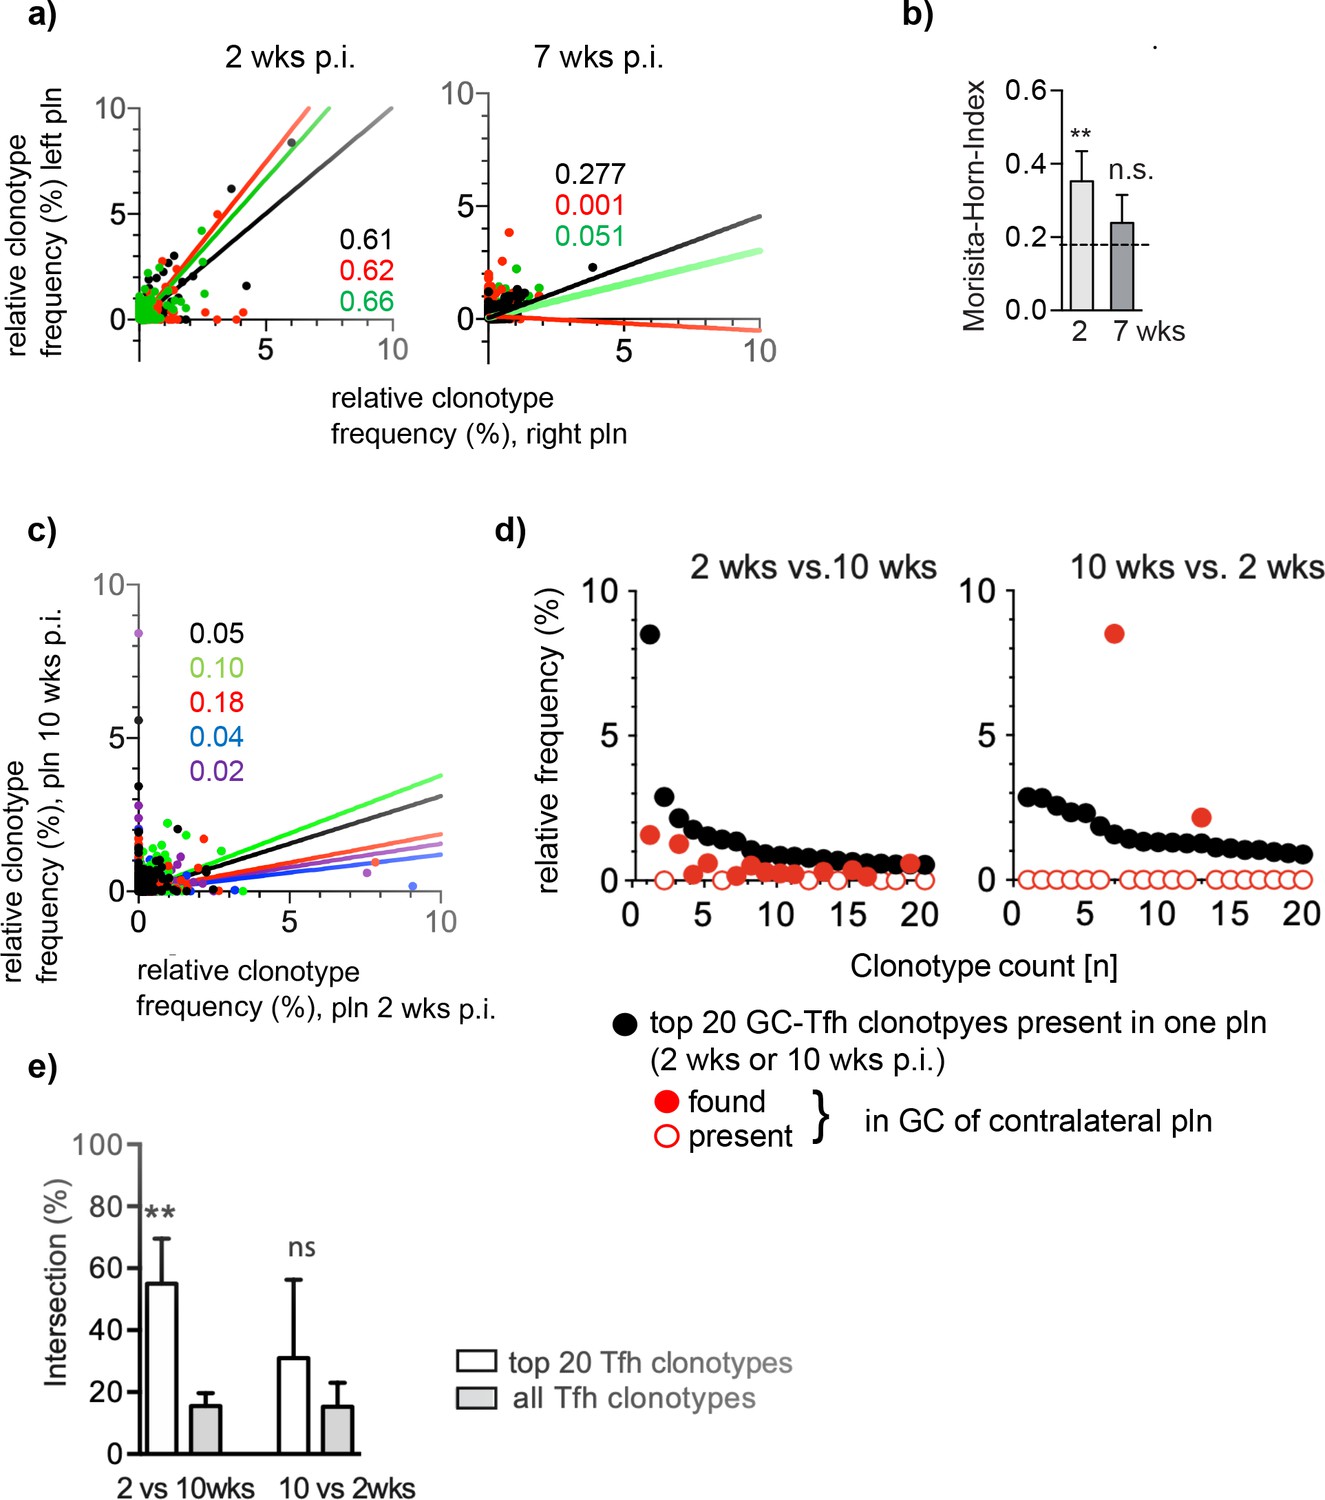
The overlap of the dominant Tfh clonotypes in left and right popliteal lymph nodes (pln) disappear over time.
Ag1 or phosphate-buffered saline (PBS) were injected s.c. into both footpads. Germinal centers (GCs) from left and right pln were isolated 2 weeks or 7 weeks post infection (p.i.) and GC-Tfh clonotypes were analyzed. (a) The frequency of Tfh clonotypes shared in GCs of the left (y-axis) and right pln (x-axis) at 2 weeks p.i. (left panel) or 7 weeks p.i. (right panel) is shown as dot plots. Each dot represents one GC-Tfh clonotype. Linear regression lines ranging from 0 to 10 and r2 values are depicted for each mouse (n = 3, mouse 1: black; mouse 2: red; mouse 3: green). (b) Data of GC-Tfh clonotypes shared between left and right pln are shown as Morisita–Horn index (MHI) (mean ± SD; **p<0.01, Mann–Whitney U-test, n = 3, two pln each). (c) The left pln (x-axis) was surgically removed 2 weeks p.i. and the right pln (y-axis) 10 weeks p.i. The frequency of GC-Tfh clonotypes present in GCs of contralateral pln is shown as dot plot diagram at distinct time points. Each dot represents one GC-Tfh clonotype. Linear regression lines ranging from 1 to 10 and r2 values are depicted for each mouse (n = 5, mouse 1: black; mouse 2: red; mouse 3: green; mouse 4: blue; mouse 5: purple). (d) The 20 most frequent GC-Tfh clonotypes present in the left 2 weeks pln (black dots) are compared to their presence in the right 10 weeks pln (red dots). One representative comparison out of five is shown. (e) The relative intersection of the data in (d) was calculated (mean ± SD; **p<0.01, Mann–Whitney U-test, n = 5, two pln each).
Figure 4—figure supplement 1
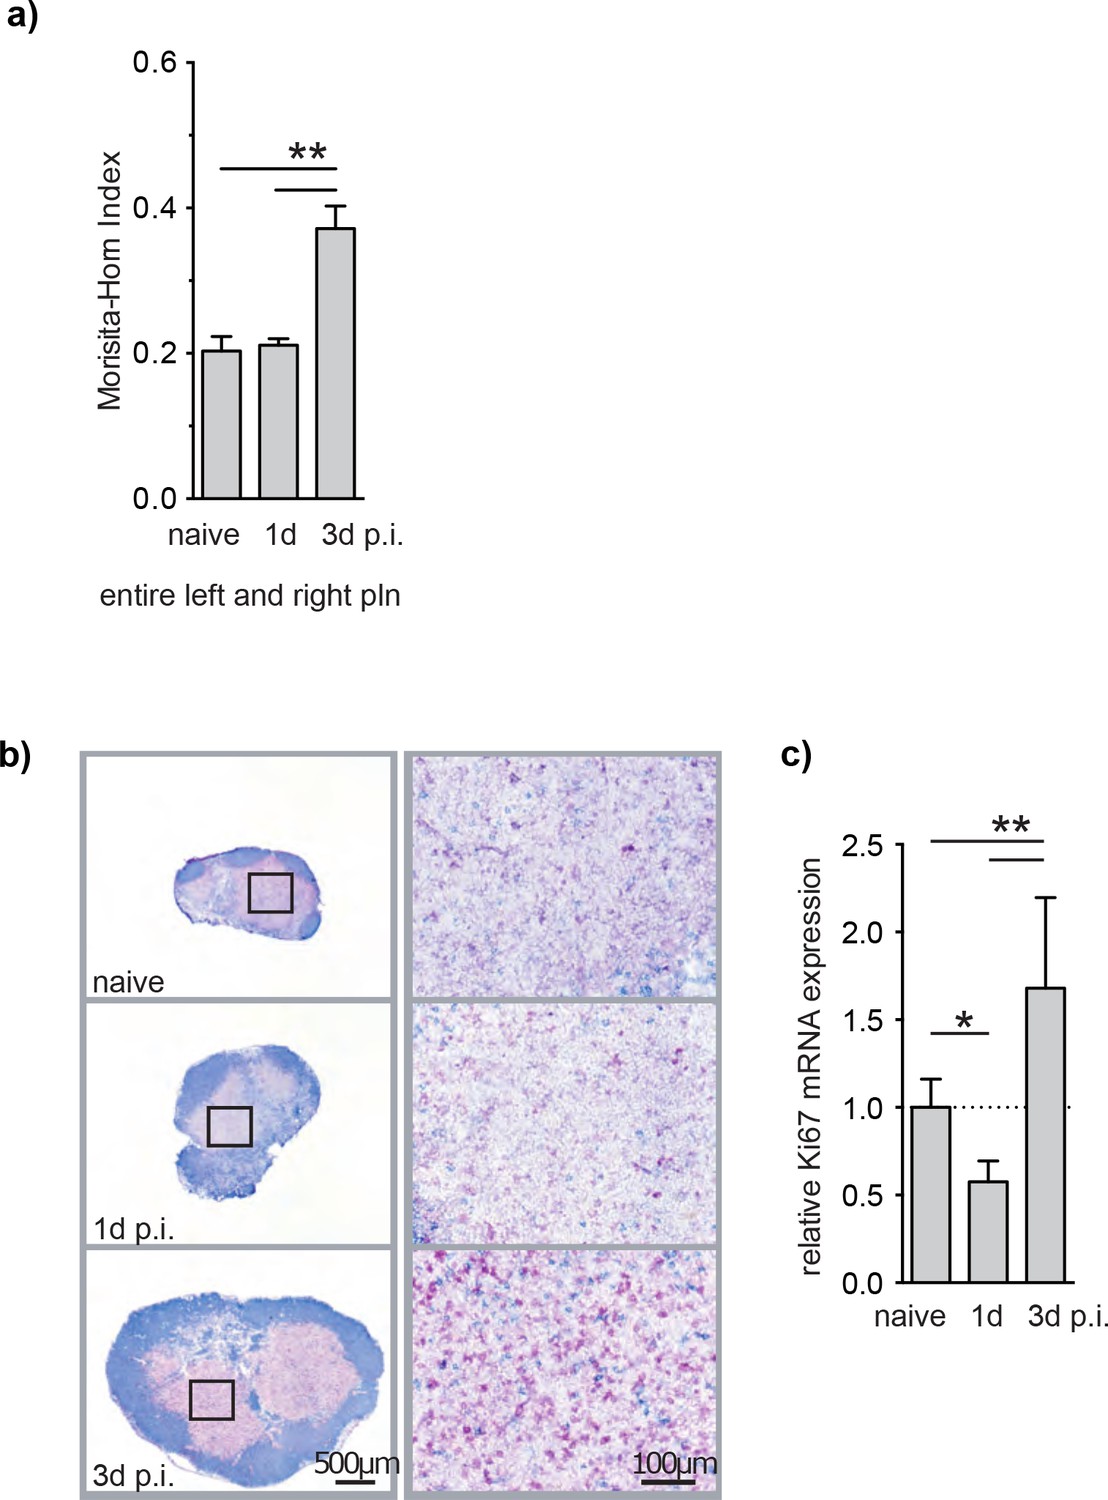
The synchronization of T cell clonotypes between contralateral lymph nodes begins 3 days after priming.
Ag1 were injected into both footpads. Left and right popliteal lymph nodes (pln) were removed at indicated time points. Serial cryosections of both pln were prepared for immunohistochemical staining, PCR analysis, or TCRβ sequencing. (a) TCRβ clonotypes of left and right pln were identified; please find reads, total, and unique clonotypes in Supplementary file 5. The quantity of shared TCRβ clonotypes between left and right pln is displayed as Morisita–Horn index (MHI) (mean ± SD, n = 3, two pln each *p<0.05, **p<0.01; Mann–Whitney U-test). (b) Immunohistochemical staining with antibodies specific for B cells (B220, blue) and proliferating cells (Ki-67, red) of pln from naive mice and 1 and 3 days after priming. (c) The expression of Ki-67 mRNA was analyzed by real-time RT-PCR. Data are normalized to housekeeping genes and displayed as x-fold increase compared to control lymph nodes from naive mice. Dotted lines mark mean expression level of the control (mean ± SD, n = 3, two pln each *p<0.05, **p<0.01; Mann–Whitney U-test).
Figure 5
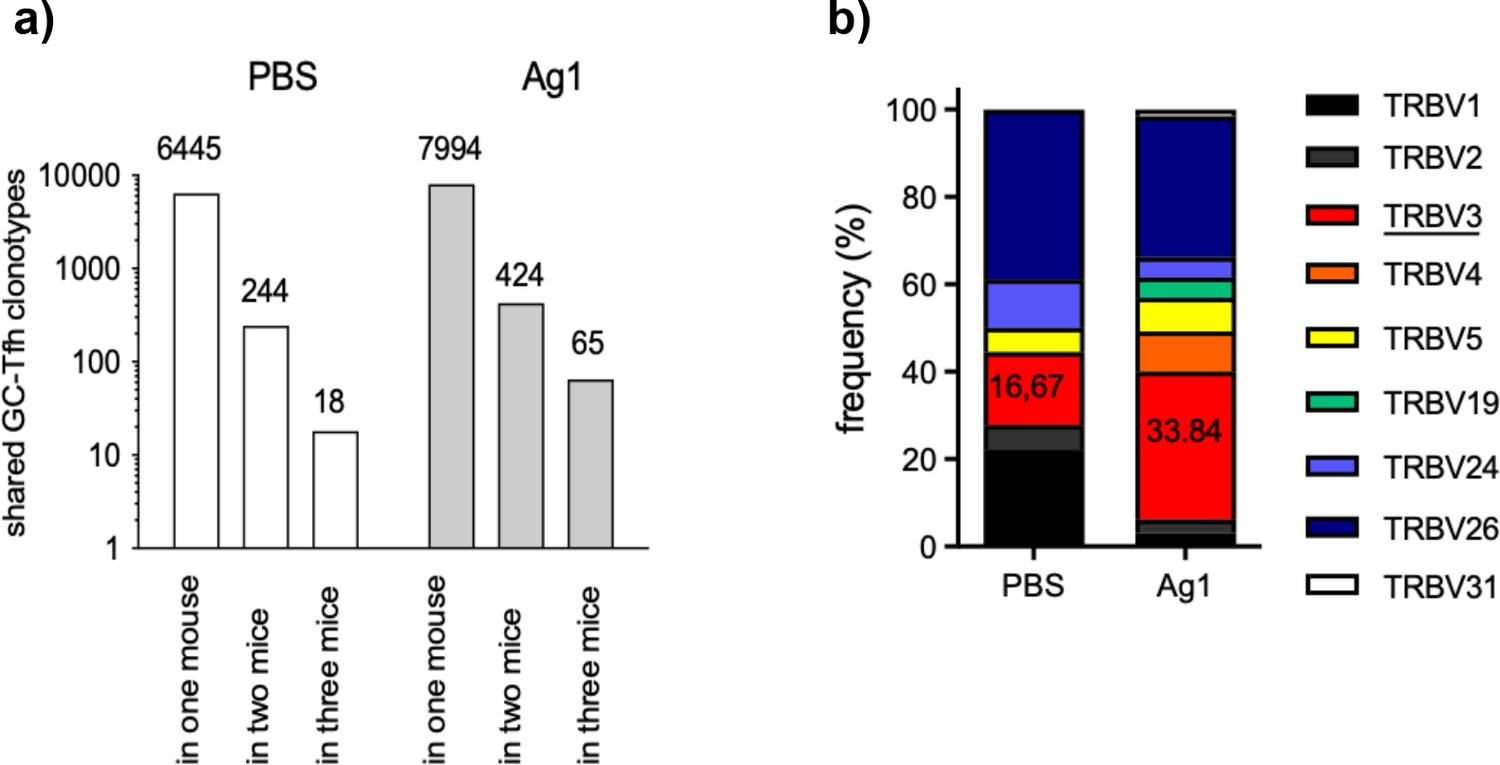
More GC-Tfh clonotypes are shared between the mice of the Ag group.
(a) The number of GC-Tfh clonotypes of the phosphate-buffered saline (PBS) group and Ag1-group that were found in one mouse, in two, or in all three mice at 4 weeks post injection as described (Madi et al., 2014). (b) The relative distribution of TRBV segments in all mice is shown. Especially, TRBV3 segment (red) predominates in shared Tfh clonotypes.
Figure 6

GC-Tfh clonotypes overlap in separate lymph nodes only after Ag exposure.
Simplified drawing summarizes the distribution of GC-Tfh clonotypes of the Ag group and PBS group over time. Clonotypes are displayed as circles. Circle colors indicate specificity and circle size its frequency. Ag is injected at high quantities into both footpads (bluish green pentagons, top left). The injection of adjuvant induces a local inflammation and the release of many endogenous epitopes at low quantities (diverse forms and colors, bottom left). Both groups receive adjuvant (red jagged circles). Identical high-expanded Ag-activated Tfh clonotypes emerge in germinal centers (GCs) of both draining popliteal lymph nodes (pln) after 2–4 weeks (big greenish circles, top middle). The high-expanded Tfh clonotypes get exchanged after 7–10 weeks. The initially high-activated Ag-specific Tfh clonotypes remain at low quantities (small greenish circles, top right). Adjuvant-only-exposed pln harbor distinct random Tfh clonotypes (diverse colors, bottom middle and bottom right).
Videos
Video 1
3D image of germinal centers (GCs) in the left popliteal lymph nodes (pln) of mouse 1.
Ag1/TM was injected into both footpads of SJLH2s mice. A complete collection of serial cryosections of the left pln (4 weeks post injection) was imaged by automatic scanning microscope and processed by For3D. GCs were segmented by filtering, thresholding, and soothing the stack of pln section images.
Video 2
3D image of germinal centers (GCs) in the right popliteal lymph nodes (pln) of mouse 1.
Ag1/TM was injected into both footpads of SJLH2s mice. A complete collection of serial cryosections of the right pln (4 weeks post injection) was imaged by automatic scanning microscope and processed by For3D. GCs were segmented by filtering, thresholding, and soothing the stack of pln section images.
Video 3
3D image of germinal centers (GCs) in the left popliteal lymph nodes (pln) of mouse 2.
Ag1/TM was injected into both footpads of SJLH2s mice. A complete collection of serial cryosections of the left pln (4 weeks post injection) was imaged by automatic scanning microscope and processed by For3D. GCs were segmented by filtering, thresholding, and soothing the stack of pln section images.
Video 4
3D image of germinal centers (GCs) in the right popliteal lymph nodes (pln) of mouse 2.
Ag1/TM was injected into both footpads of SJLH2s mice. A complete collection of serial cryosections of the right pln (4 weeks post injection) was imaged by automatic scanning microscope and processed by For3D. GCs were segmented by filtering, thresholding, and soothing the stack of pln section images.
Additional files
-
Supplementary file 1
Table displays volumes, T cell numbers, raw reads, and total and unique TCRβ sequences obtained from laser-captured germinal centers of popliteal lymph nodes (Ag1/SJLH2s).
- https://cdn.elifesciences.org/articles/70053/elife-70053-supp1-v1.docx
-
Supplementary file 2
Table displays skin lesion sizes, T cell numbers, raw reads, and total and unique TCRβ sequences (Ag1/SJLH2s).
- https://cdn.elifesciences.org/articles/70053/elife-70053-supp2-v1.docx
-
Supplementary file 3
Table displays T cell numbers, raw reads, and total and unique TCRβ sequences (Ag1/SJLH2s) from Tfh isolated by flow cytometry.
- https://cdn.elifesciences.org/articles/70053/elife-70053-supp3-v1.docx
-
Supplementary file 4
Table displays volumes, T cell numbers, raw reads, and total and unique TCRβ sequences from laser-captured germinal centers of popliteal lymph nodes (Ag2/C57BL6-H2s).
- https://cdn.elifesciences.org/articles/70053/elife-70053-supp4-v1.docx
-
Supplementary file 5
Table displays raw reads, and total and unique TCRβ sequences of entire popliteal lymph nodes (Ag1/SJLH2s).
- https://cdn.elifesciences.org/articles/70053/elife-70053-supp5-v1.docx
-
Supplementary file 6
Table displays volumes, T cell numbers, raw reads, and total and unique TCRβ sequences from laser-captured germinal centers of popliteal lymph nodes (GST/SJL-H2s).
- https://cdn.elifesciences.org/articles/70053/elife-70053-supp6-v1.docx
-
Supplementary file 7
Supplementary material and methods for Figure 1—figure supplement 1 and Figure 4—figure supplement 1.
- https://cdn.elifesciences.org/articles/70053/elife-70053-supp7-v1.docx
-
Transparent reporting form
- https://cdn.elifesciences.org/articles/70053/elife-70053-transrepform-v1.pdf.pdf
Download links
A two-part list of links to download the article, or parts of the article, in various formats.
Downloads (link to download the article as PDF)
Open citations (links to open the citations from this article in various online reference manager services)
Cite this article (links to download the citations from this article in formats compatible with various reference manager tools)
Receptor repertoires of murine follicular T helper cells reveal a high clonal overlap in separate lymph nodes in autoimmunity
eLife 10:e70053.
https://doi.org/10.7554/eLife.70053


