Tissue environment, not ontogeny, defines murine intestinal intraepithelial T lymphocytes
- Centre for Gene Regulation and Expression, University of Dundee, United Kingdom
- Division of Cell Signalling and Immunology, School of Life Sciences, University of Dundee, United Kingdom
- MRC Protein Phosphorylation and Ubiquitylation Unit, University of Dundee, United Kingdom
Figures
Figure 1 with 1 supplement
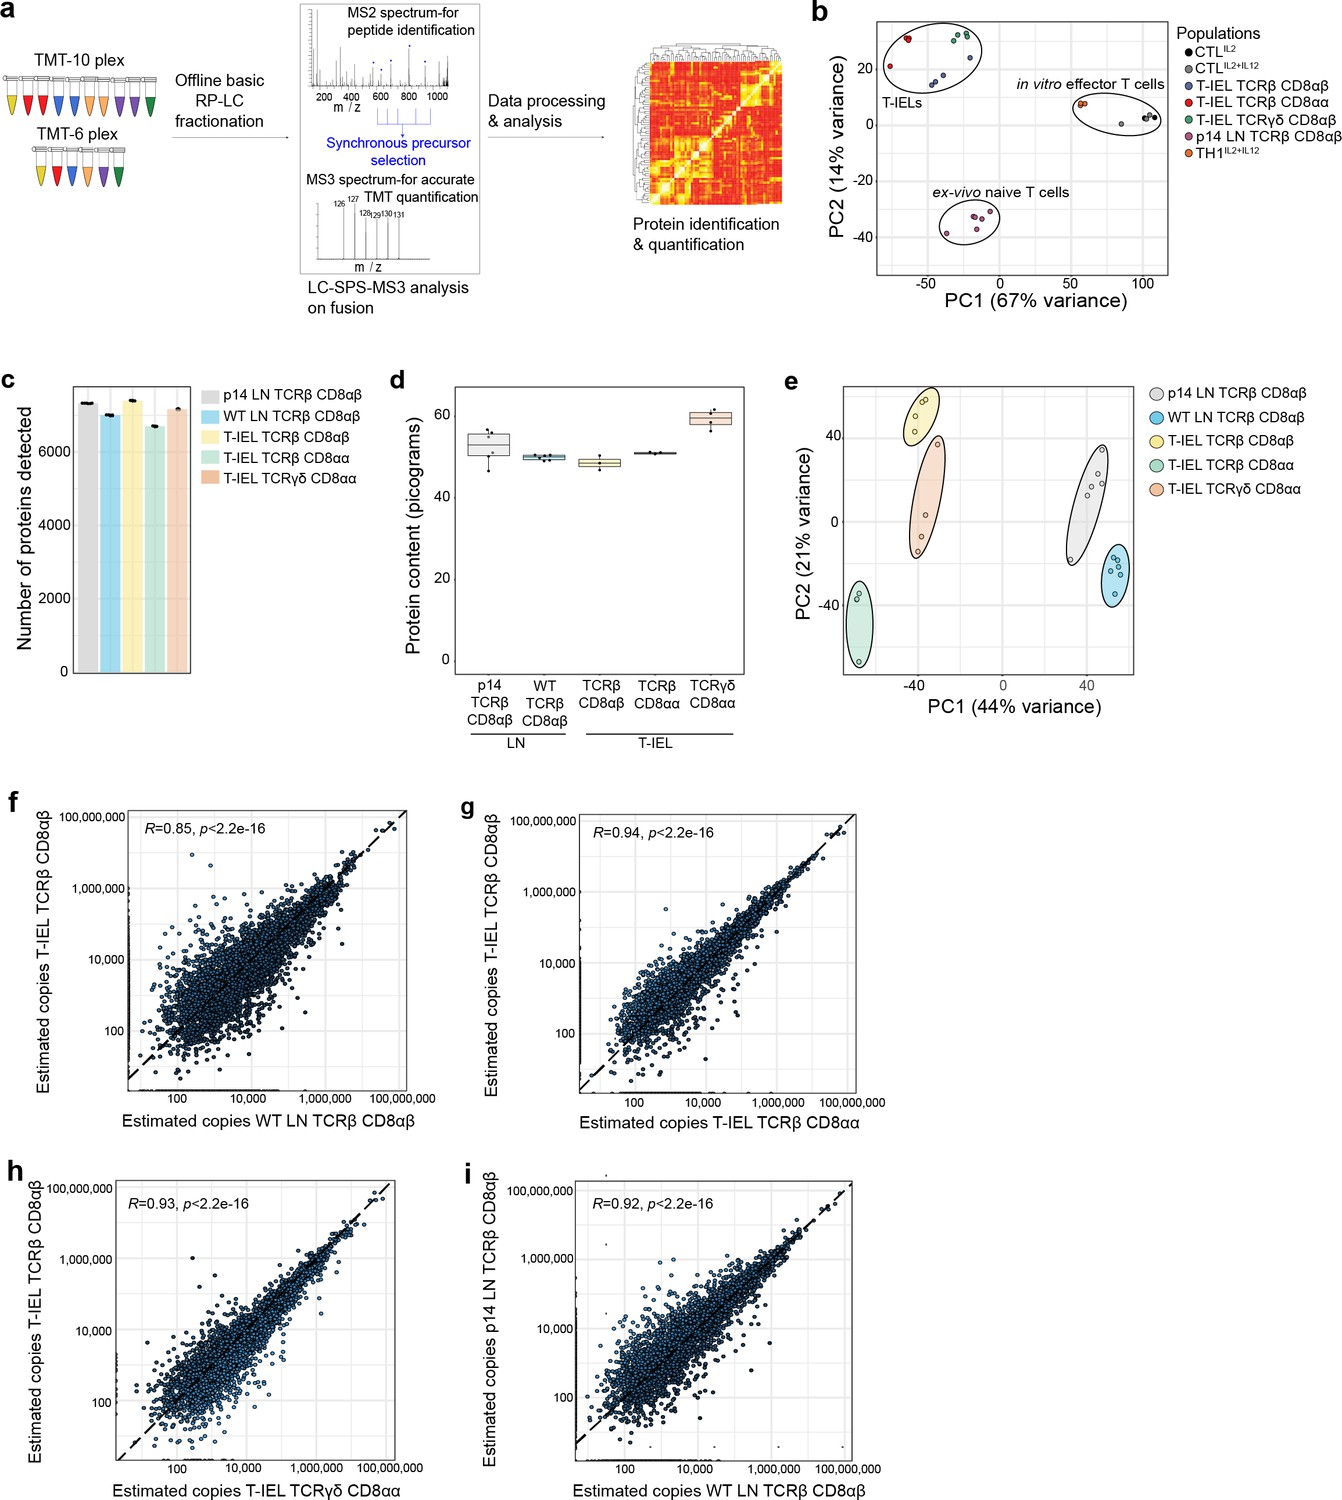
Quantitative proteomic analyses of induced and natural tissue-resident intestinal intraepithelial T lymphocytes (T-IEL) subsets.
(a) Schematic of the mass spectrometry (MS)-based proteomics workflow. The data were acquired at the MS3 level with synchronous precursor selection (see Materials and methods). (b) Principal component analysis comparing the tandem mass tags (TMT)-based estimated protein copy numbers of conventional naïve and effector T cells with T-IEL. CTL, cytotoxic T lymphocytes. (c) Bar plot showing the number of proteins identified across all replicates in the five populations used for this study. (d) Box plot showing the MS-based protein content estimation for all replicates used across the five populations. (e) Principal component analysis comparing the estimated protein copy numbers across conventional naïve lymph node (LN) T cells and T-IEL subsets. (f–i) Scatter plot comparing the estimated copy numbers for (f) TCRαβ CD8αβ T-IEL and wild-type (WT) LN TCRαβ CD8αβ T cells, (g) TCRαβ CD8αβ T-IEL and TCRαβ CD8αα T-IEL, (h) TCRαβ CD8αβ T-IEL and TCRγδ CD8αα T-IEL, (i) WT LN TCRαβ CD8αβ T cells and P14 LN TCRαβ CD8αβ T cells. Pearson correlation coefficient are included within all the scatter plots. The proteomics data displayed on the plots include CTL (n = 3 biological replicates), conventional naïve LN T cells (both WT and P14 n = 6 biological replicates), TCRαβ CD8αβ T-IEL and TCRαβ CD8αα T-IEL (n = 3 biological replicates) and TCRγδ CD8αα T-IEL (n = 4 biological replicates). For box plots, the bottom and top hinges represent the first and third quartiles. The top whisker extends from the hinge to the largest value no further than 1.5× IQR from the hinge; the bottom whisker extends from the hinge to the smallest value at most 1.5× IQR of the hinge. The bar plots show the mean. Total number of proteins identified and total protein content across all populations are available in Figure 1—source data 1.
-
Figure 1—source data 1
Total protein identifications and total protein content across all populations.
- https://cdn.elifesciences.org/articles/70055/elife-70055-fig1-data1-v4.xlsx
Figure 1—figure supplement 1

Gating strategy used to identify and isolate tissue-resident intestinal intraepithelial T lymphocytes (T-IEL) subsets using fluorescence activated cell sorting (FACS).
Lymphocytes were gated by size using forward scatter (FCS) and side scatter (SSC) and T-IEL subsets were separated based on the cell surface marker expression of T cell-associated receptors: TCRβ, TCRγδ, CD8α, CD8β, and CD4. The populations sorted were as follows: cells positive for TCRγδ and CD8αα (TCRγδ CD8αα T-IEL), and those that were both TCRβ+ and CD4- and either CD8αα (TCRβ CD8αα T-IEL) or CD8β (TCRβ CD8αβ T-IEL).
Figure 2
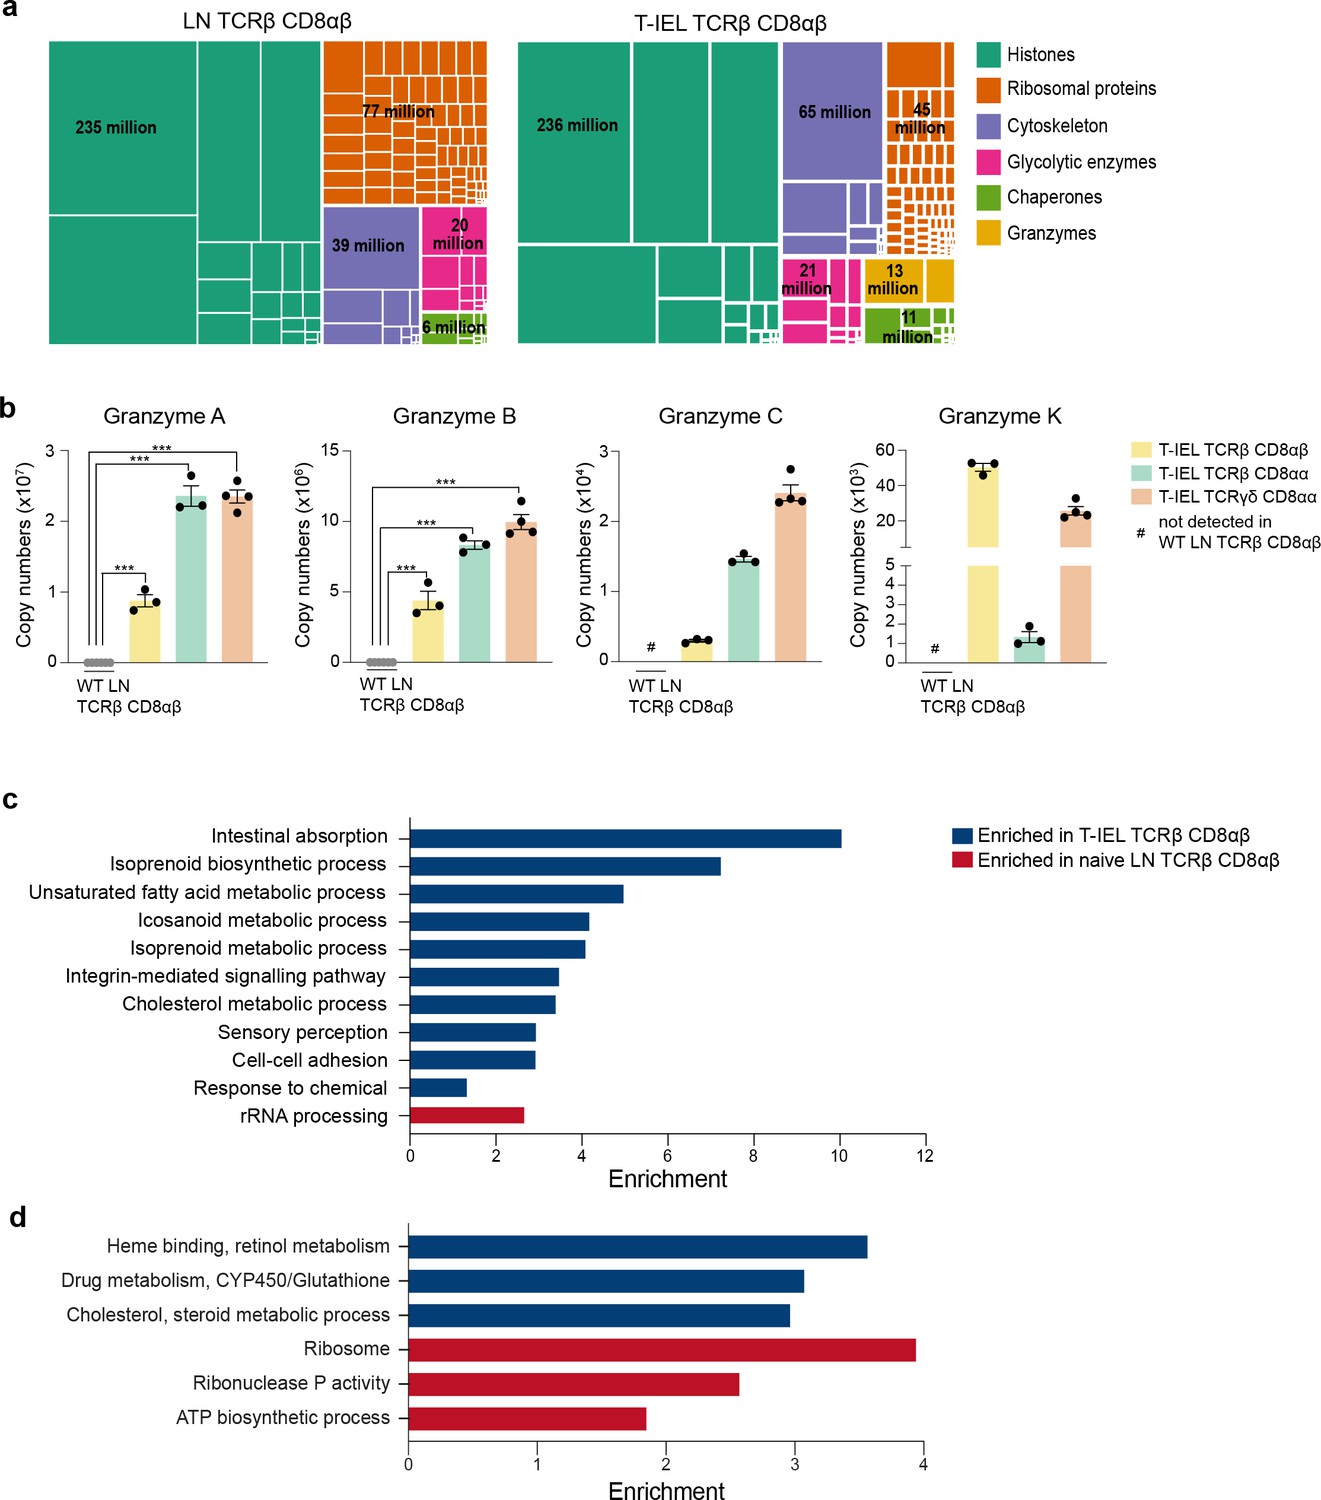
Gene ontology analyses of the induced tissue-resident intestinal intraepithelial T lymphocytes (T-IEL) proteome.
(a) Treemap showing the abundance of proteins classified into histones, ribosomal proteins, cytoskeletal proteins, glycolytic enzymes, chaperones and granzymes across wild-type (WT) lymph node (LN) TCRαβ CD8αβ T cells and TCRαβ CD8αβ T-IEL. Rectangle size is proportional to the median estimated copy numbers. Median copy numbers across all categories are available in Figure 2—source data 1. (b) Bar plots showing the estimated copy numbers for all granzymes across WT LN TCRαβ CD8αβ T cells (n = 6) and all T-IEL (n = 3 or 4). Symbols on the bars represent the biological replicates. The bars show the mean and SEM. The p-values have been calculated on R with LIMMA where ** = p < 0.001 and fold change greater than or equal to the median+1 standard deviation, *** = p < 0.0001 and fold change greater than or equal to the median±1.5 standard deviations. (c) Bar plot showing the results of the DAVID functional annotation clustering (false discovery rate [FDR] < 0.05; see Materials and methods for details) enrichment analysis for all proteins exclusive to or significantly increased in expression within TCRαβ CD8αβ T-IEL. (d) Bar plot showing the results of the PANTHER GO Biological process (FDR < 0.05; see Materials and methods for details) enrichment analysis for all proteins exclusive to or significantly increased in expression within TCRαβ CD8αβ T-IEL (blue) or within WT TCRαβ CD8αβ T cells (red).
-
Figure 2—source data 1
Median copy numbers for the global analysis.
- https://cdn.elifesciences.org/articles/70055/elife-70055-fig2-data1-v4.xlsx
Figure 3 with 1 supplement
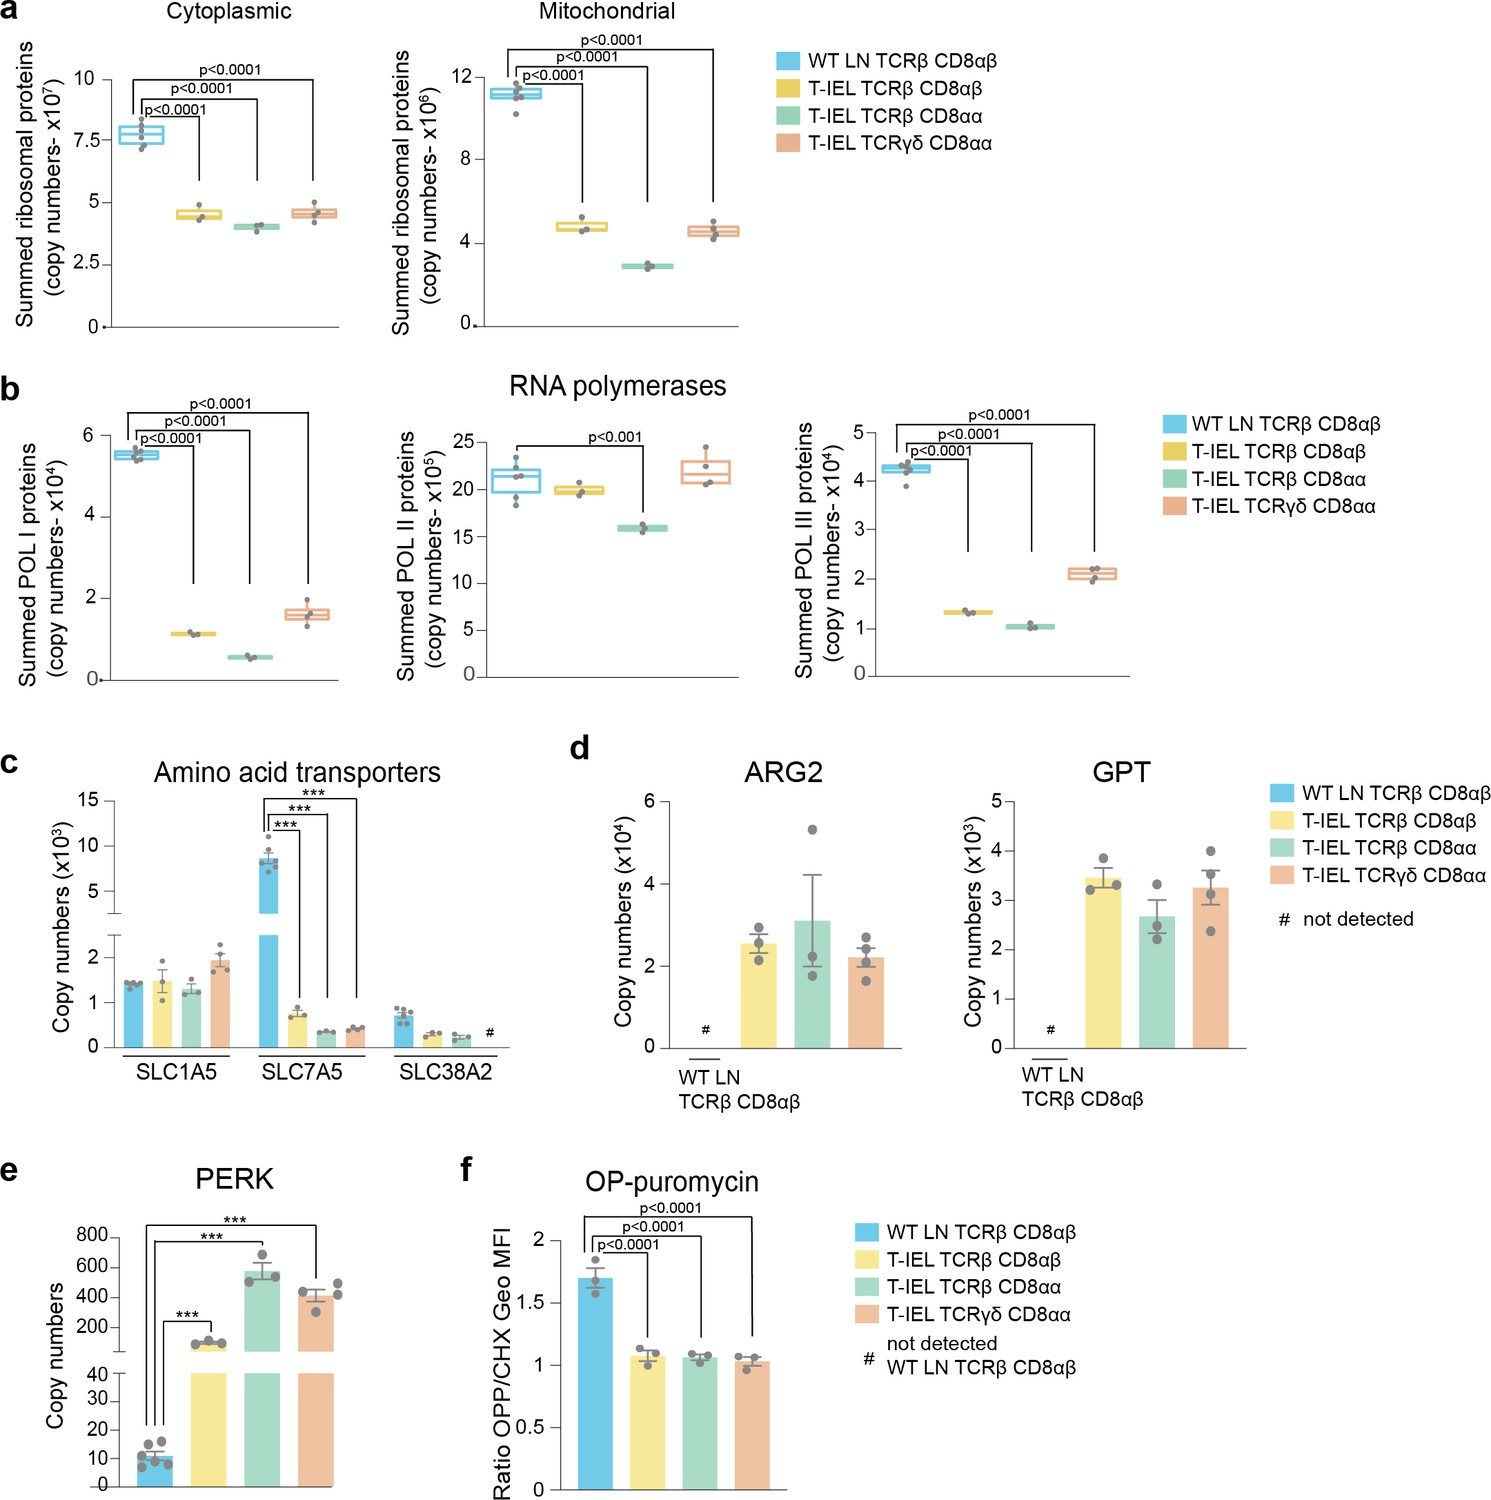
Downregulation of protein synthesis in tissue-resident intestinal intraepithelial T lymphocytes (T-IEL).
(a) Box plots showing the estimated total cytoplasmic (left) and mitochondrial (right) ribosomal protein copies for lymph node (LN) TCRβ CD8αβ T cells and all T-IEL subsets. The sums of all copy numbers are available in Figure 3—source data 1. (b) Box plots showing the estimated summed total protein copies for the protein subunits that are exclusive to RNA polymerases I, II, and III, respectively, for LN TCRβ CD8αβ T cells and all T-IEL subsets. The sum of all copy numbers are available in Figure 3—source data 1. (c) Bar plots showing the estimated protein copy numbers of the amino acid transporters, SLC7A5 and SLC38A2, for wild-type (WT) LN TCRβ CD8αβ and all three subsets of T-IEL. (d) Bar plots showing the estimated protein copy numbers of arginase-2 (ARG2; left) and alanine aminotransferase (glutamic-pyruvic transaminase [GPT]; right) for WT LN TCRβ CD8αβ and all three subsets of T-IEL. (e) Bar plots showing the estimated protein copy numbers of PKR-like endoplasmic reticulum kinase (PERK) for WT LN TCRβ CD8αβ and all three T-IEL subsets. (f) Bar plots showing the O-propargyl puromycin (OPP) incorporation (n = 3 biological replicates) in ex vivo WT LN TCRβ CD8αβ and T-IEL. As a negative control, OPP incorporation was inhibited by cycloheximide (CHX) pre-treatment. OPP incorporation was assessed by flow cytometry 15 min after administration. Bar graph represents the geometric MFI of the OPP-AlexaFluor 647 in each T cell subsets normalised to the geometric MFI of the CHX pre-treated T cells. The p-values were calculated using ordinary one-way ANOVA with Dunnett’s multiple comparisons. For all box plots, the bottom and top hinges represent the first and third quartiles. The top whisker extends from the hinge to the largest value no further than 1.5× IQR from the hinge; the bottom whisker extends from the hinge to the smallest value at most 1.5× IQR of the hinge. All bar plots show the mean and SEM. Symbols on the bars represent the biological replicates. The proteomics data displayed on the plots include WT TCRαβ CD8αβ T cells (n = 6 biological replicates), TCRαβ CD8αβ T-IEL and TCRαβ CD8αα T-IEL (n = 3 biological replicates), and TCRγδ CD8αα T-IEL (n = 4 biological replicates). The p-values for individual proteins (c,d,e) were calculated in R with LIMMA, where ** = p < 0.001 and fold change greater than or equal to the median+1 standard deviation, *** = p < 0.0001 and fold change greater than or equal to the median±1.5 standard deviations, and in (a,b) in R with Welch’s t-test.
-
Figure 3—source data 1
Sum of median copy numbers for the cytoplasmic and mitochondrial ribosomes.
- https://cdn.elifesciences.org/articles/70055/elife-70055-fig3-data1-v4.xlsx
Figure 3—figure supplement 1
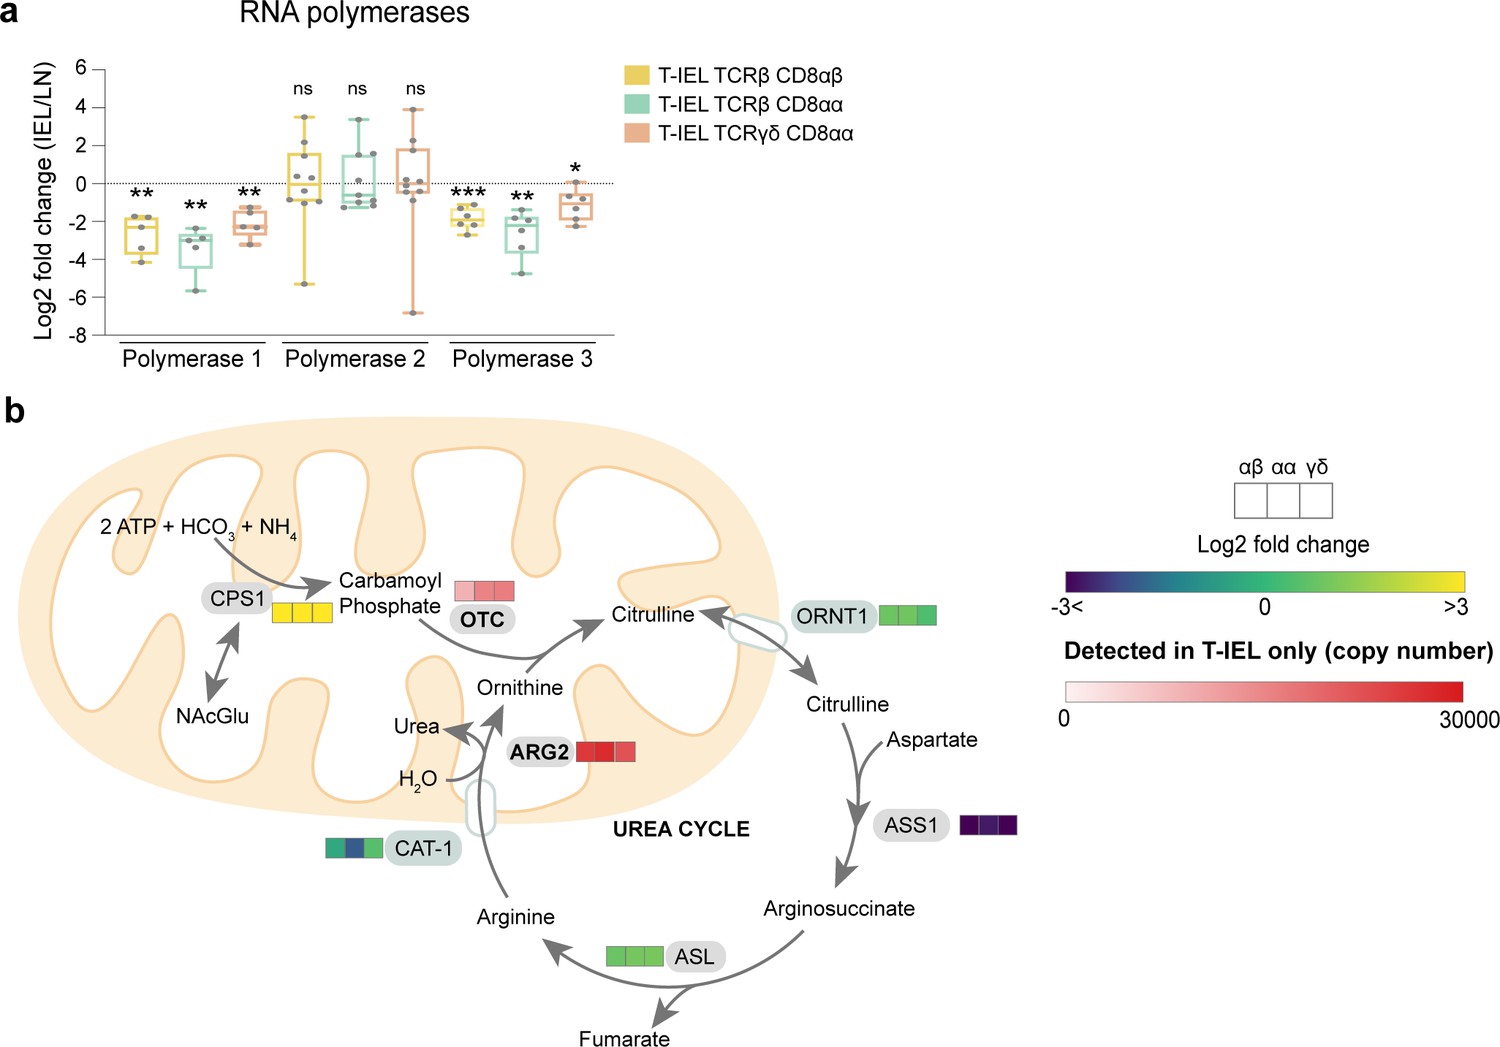
Selective regulation of RNA polymerases and the urea cycle in T-IEL.
(a) Box plots showing the median Log2 fold change ((tissue-resident intestinal intraepithelial T lymphocytes/lymph node [T-IEL/LN]) CD8 T cells) for RNA polymerase 1, 2, and 3 complexes. Each grey dot represents one of the polymerase subunits. The p-values were calculated using one-sample t-tests, where * = p < 0.05, ** = p < 0.01, *** = p < 0.001, ns = not significant. (b) Schematic representation of the urea cycle. Coloured heatmap squares represent protein expression Log2 fold change (T-IEL/LN CD8 T cells) in, from left to right, T-IEL TCRβ CD8αβ, T-IEL TCRβ CD8αα, and T-IEL TCRγδ CD8αα. Proteins expressed only by T-IEL are highlighted by red squares, representing estimated protein copy numbers (mean from at least three biological replicates). For protein names, see Supplementary file 4.
Figure 4
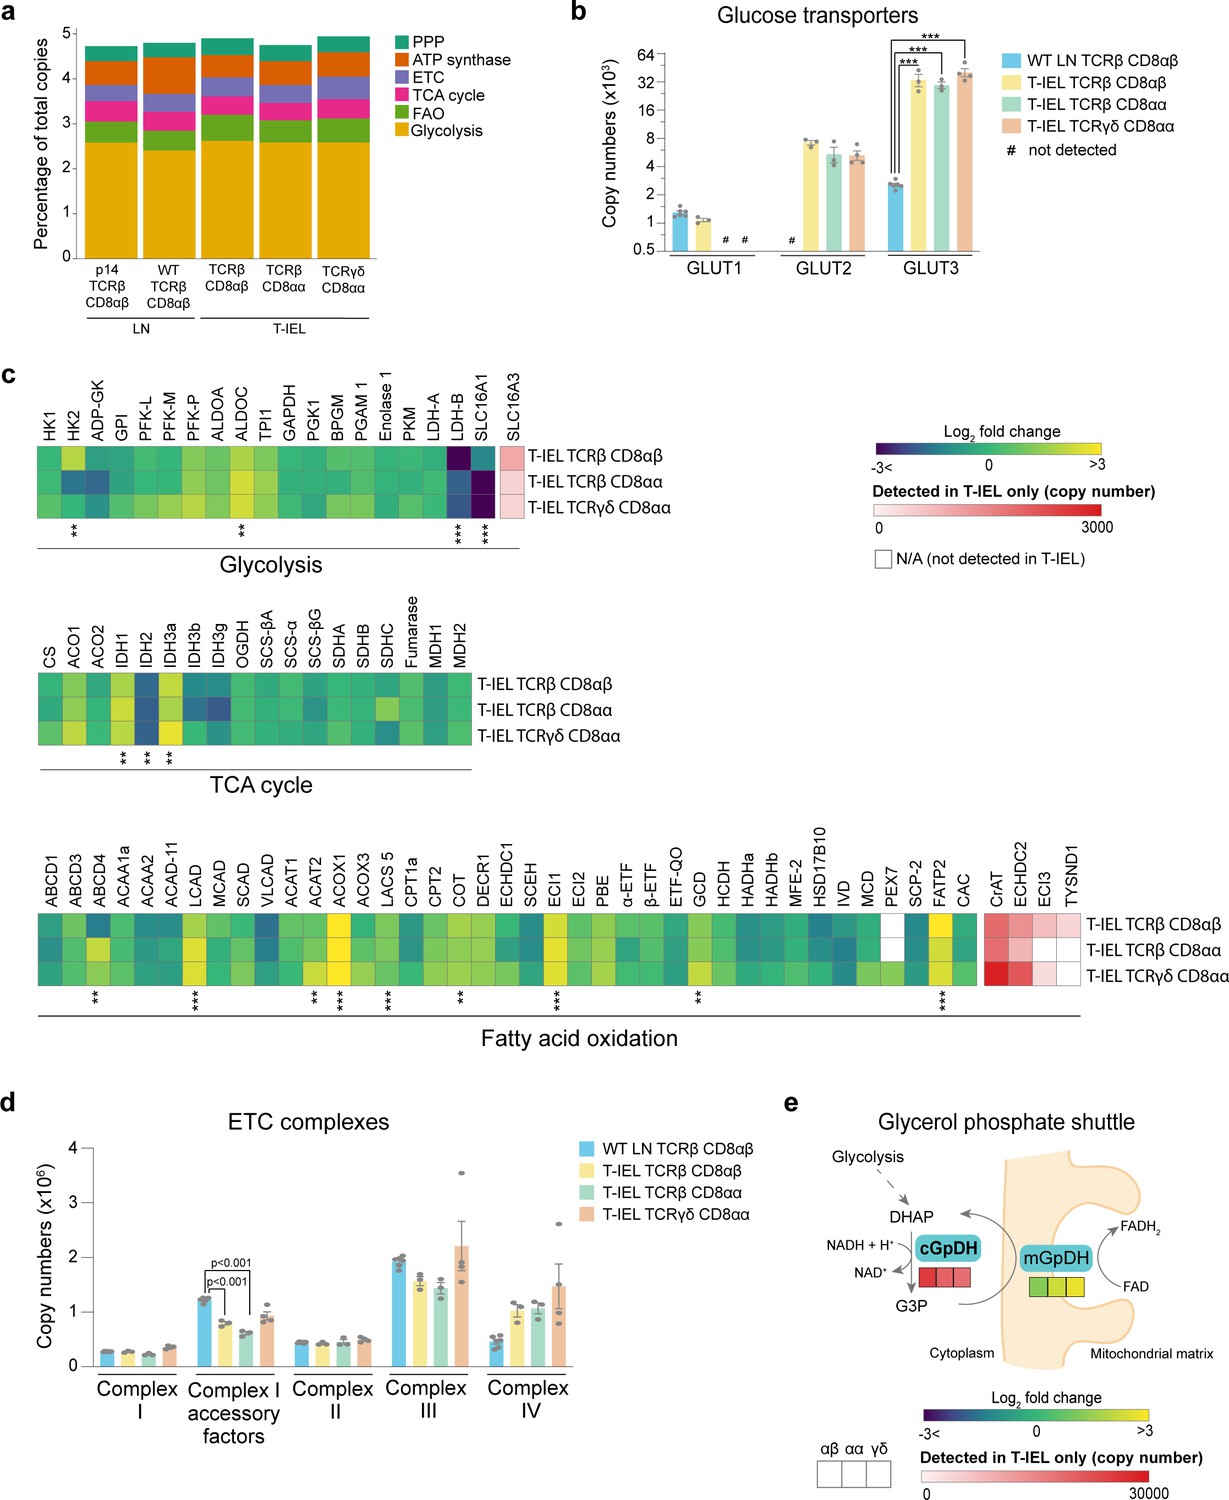
Metabolic profiling of the tissue-resident intestinal intraepithelial T lymphocytes (T-IEL) proteome.
(a) Stacked bar plots comparing the proportional representation of metabolic pathways in lymph node (LN) TCRβ CD8αβ and all T-IEL subsets. (b) Bar plots showing the estimated protein copy numbers of the glucose transporters, GLUT1, GLUT2, and GLUT3, for wild-type (WT) LN TCRβ CD8αβ and all three subsets of T-IEL. (c) Heatmaps displaying the Log2 fold change (T-IEL/ LN CD8 T cells) for all proteins involved in glycolysis, tricarboxylic acid (TCA) cycle, and fatty acid oxidation (FAO). (d) Bar plots showing the sum of the estimated protein copy numbers of the electron transport chain (ETC) components, for WT LN TCRβ CD8αβ and all three subsets of T-IEL. Sum of the copy numbers across all ETC complexes are available in Figure 4—source data 1. (e) Schematic representation of the glycerol-3-phosphate shuttle with heatmaps showing protein expression of cytosolic glycerol-3-phosphate dehydrogenase (cGpDH) and the Log2 fold change of mitochondrial glycerol-3-phosphate dehydrogenase (mGpDH) (T-IEL/LN CD8 T cells) in, from left to right, T-IEL TCRβ CD8αβ, T-IEL TCRβ CD8αα, and T-IEL TCRγδ CD8αα. All bar plots show the mean and SEM. Symbols on the bars represent the biological replicates. The proteomics data displayed on the plots include WT TCRαβ CD8αβ T cells (n = 6 biological replicates), TCRαβ CD8αβ T-IEL and TCRαβ CD8αα T-IEL (n = 3 biological replicates), and TCRγδ CD8αα T-IEL (n = 4 biological replicates). The p-values for individual proteins (b–c) were calculated in R with LIMMA, where ** = p < 0.001 and fold change greater than or equal to the median+1 standard deviation, *** = p < 0.0001 and fold change greater than or equal to the median±1.5 standard deviations, and in (d) in R with Welch’s t-test. For full protein names, see Supplementary file 4.
-
Figure 4—source data 1
Sum of median copy numbers for all the electron transport chain (ETC) complexes.
- https://cdn.elifesciences.org/articles/70055/elife-70055-fig4-data1-v4.xlsx
Figure 5
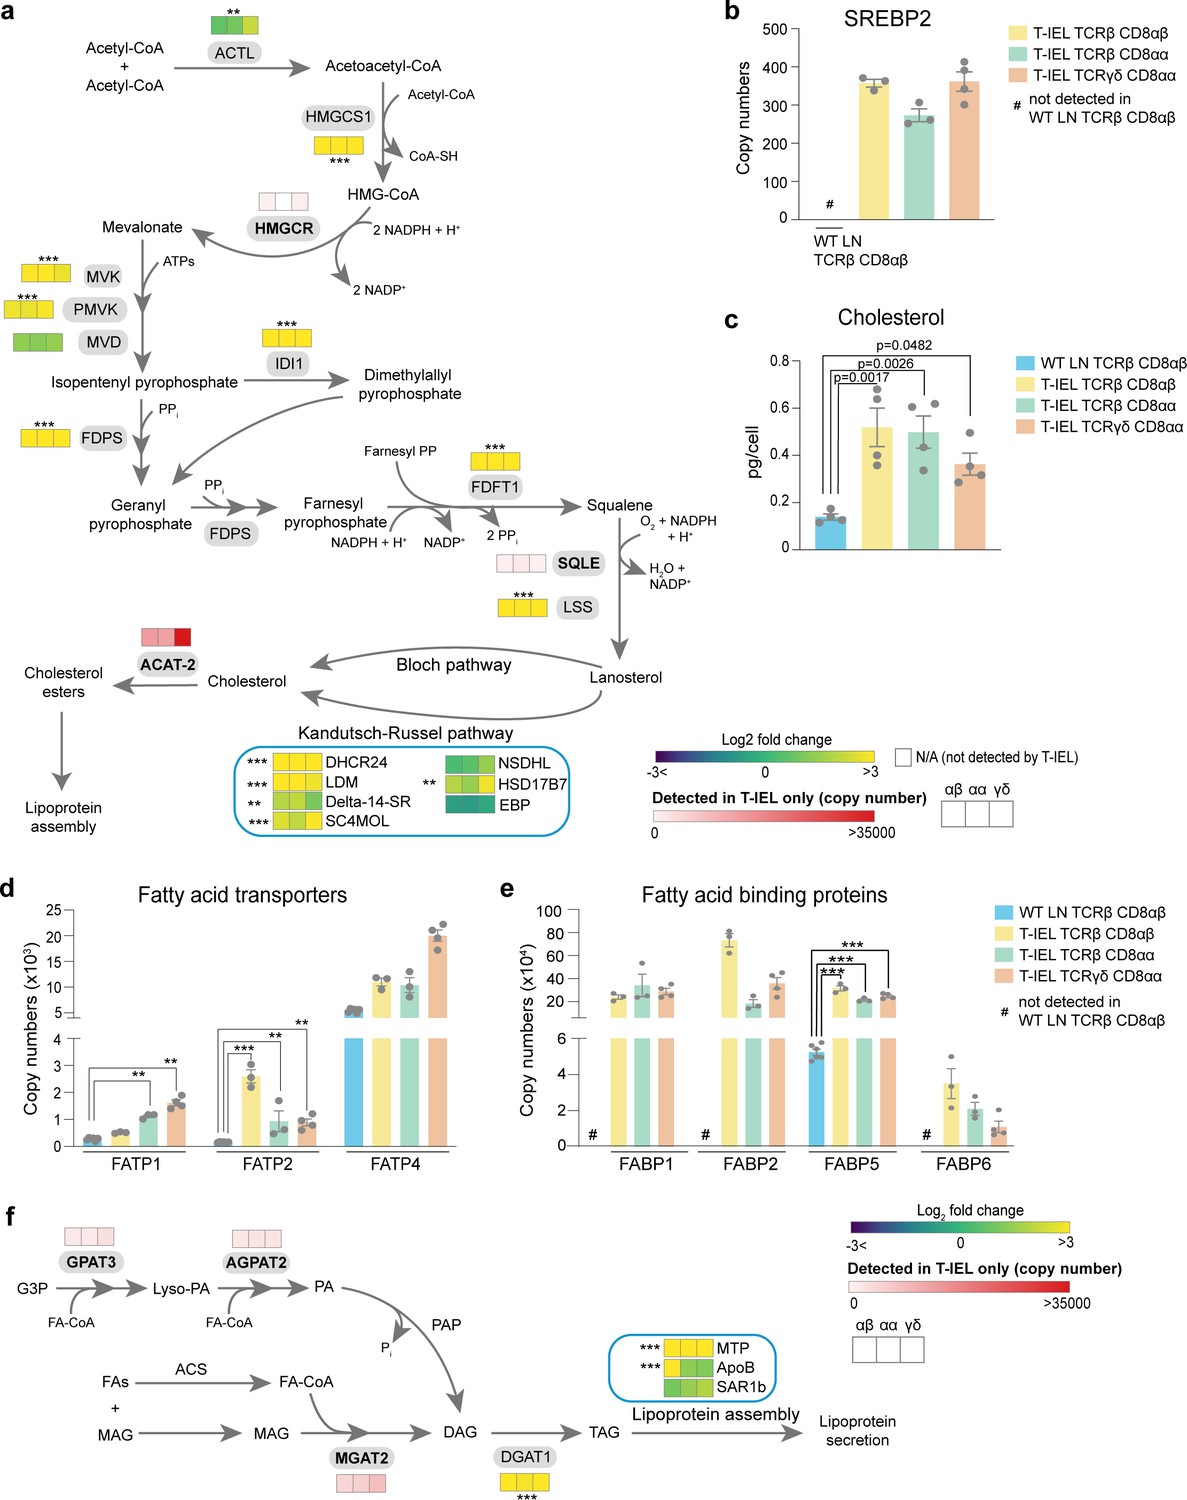
Tissue-resident intestinal intraepithelial T lymphocytes (T-IEL) have enhanced cholesterol and lipid metabolism.
(a) Schematic representation of proteins involved of the cholesterol biosynthetic pathway. Heatmap squares represent the Log2 fold change (T-IEL/lymph node [LN] CD8 T cells) in, from left to right, T-IEL TCRβ CD8αβ, T-IEL TCRβ CD8αα, and T-IEL TCRγδ CD8αα. Proteins expressed only by T-IEL are highlighted by red squares, representing the mean estimated protein copy numbers (from at least three biological replicates). (b) Bar plot showing the estimated protein copy number of SREBP2 for wild-type (WT) LN TCRβ CD8αβ and all three subsets of T-IEL. (c) Bar plot showing a comparison of total cellular cholesterol content in sorted WT LN TCRβ CD8αβ and all three subsets of T-IEL (n = 4 biological replicates). The p-values calculated using ordinary one-way ANOVA with Dunnett’s multiple comparison test. Data for the total cholesterol content are available in Figure 5—source data 1. (d) Bar plots showing the estimated protein copy numbers of the fatty acid transporters FATP1, FATP2, and FATP4 for WT LN TCRβ CD8αβ and all three subsets of T-IEL. (e) Bar plots showing the estimated protein copy numbers of the fatty acid binding proteins FABP1, FABP2, FABP5, and FABP6 for WT LN TCRβ CD8αβ and all three subsets of T-IEL. (f) Schematic representation of the triacylglycerol synthesis pathways and lipoprotein assembly. Coloured squares represent the Log2 fold change (T-IEL/LN CD8 T cells) in, from left to right, T-IEL TCRβ CD8αβ, T-IEL TCRβ CD8αα, and T-IEL TCRγδ CD8αα. Proteins expressed only by T-IEL are highlighted by red squares, representing estimated protein copy numbers (mean from at least three biological replicates). All bar plots show the mean and SEM. Symbols on the bars represent the biological replicates. The proteomics data displayed on the plots include WT TCRαβ CD8αβ T cells (n = 6 biological replicates), TCRαβ CD8αβ T-IEL and TCRαβ CD8αα T-IEL (n = 3 biological replicates), and TCRγδ CD8αα T-IEL (n = 4 biological replicates). The p-values for individual proteins (a,b,d,e,f) were calculated in R with LIMMA, where ** = p < 0.001 and fold change greater than or equal to the median+1 standard deviation, *** = p < 0.0001 and fold change greater than or equal to the median±1.5 standard deviations. For full protein names, see Supplementary file 4.
-
Figure 5—source data 1
Total cholesterol content across all populations.
- https://cdn.elifesciences.org/articles/70055/elife-70055-fig5-data1-v4.xlsx
Figure 6 with 1 supplement
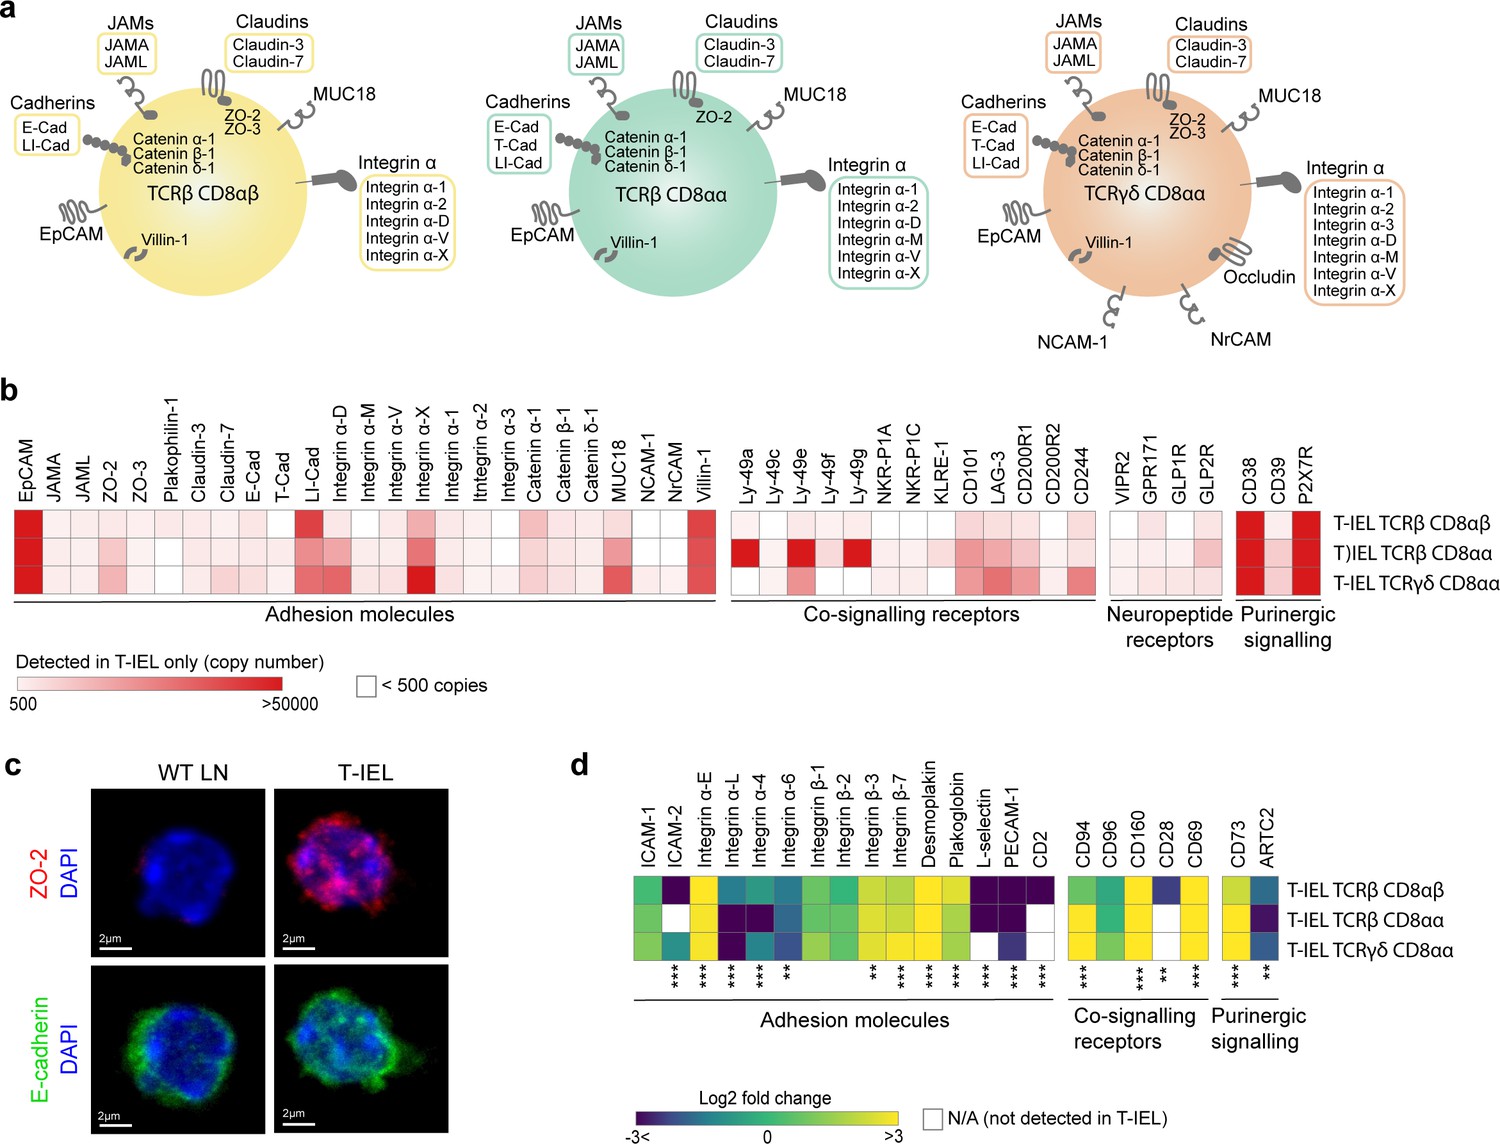
Cell surface proteins expressed on tissue-resident intestinal intraepithelial T lymphocytes (T-IEL).
(a) Schematic representation of proteins involved in cell-cell adhesion that are only expressed by the different T-IEL subsets. (b) Heatmaps displaying the estimated protein copy numbers of adhesion molecules, co-signalling receptors, neuropeptide receptors, and purinergic receptors expressed only by T-IEL. Data represent the mean of at least three biological replicates. (c) Purified lymph node (LN) CD8 T cells (left) and isolated T-IEL (right) were immunostained for ZO-2 (top, red), E-cadherin (bottom, green), and CD8α (not shown) and counterstained with DAPI to mark the nuclei (blue). Representative (of two independent experiments) maximal intensity projections of confocal sections spanning the entire cell thickness of selected CD8+ cells of each type are shown. Size bars = 2 µm. See also Figure 6—figure supplement 1. (d) Heatmap displaying Log2 fold change (T-IEL/ LN CD8 T) cells of adhesion molecules, co-signalling receptors, and purinergic receptors. The proteomics data displayed on the plots show the mean values and were calculated from wild-type (WT) TCRαβ CD8αβ T cells (n = 6 biological replicates), TCRαβ CD8αβ T-IEL and TCRαβ CD8αα T-IEL (n = 3 biological replicates), and TCRγδ CD8α T-IEL (n = 4 biological replicates). The p-values were calculated in R with LIMMA, where ** = p < 0.001 and fold change greater than or equal to the median+1 standard deviation, *** = p < 0.0001 and fold change greater than or equal to the median±1.5 standard deviations.
Figure 6—figure supplement 1
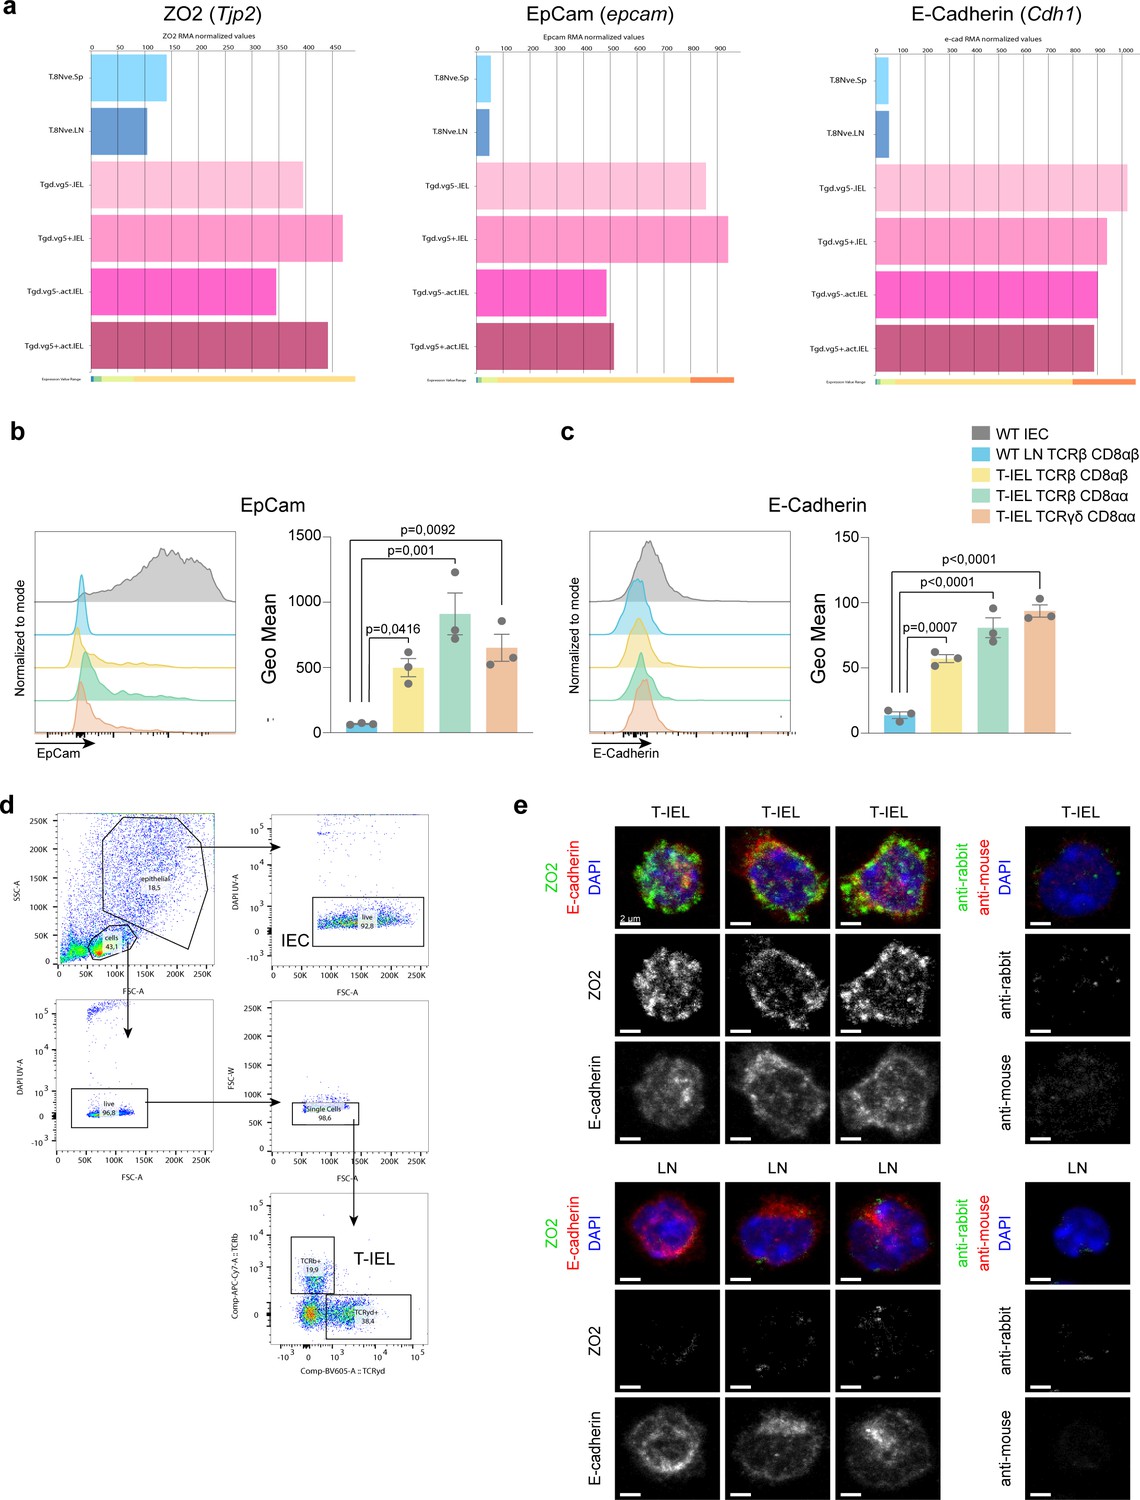
Expression of epithelial proteins in tissue-resident intestinal intraepithelial T lymphocytes (T-IEL).
(a) Bar plots showing the ImmGen microarray database (http://www.immgen.org/) derived normalised RMA values for Tjp2 (ZO-2), EpCam, and Cdh1 (E-cadherin) across wild-type (WT) naïve CD8 T cells (T.8Nve.Sp and T.8Nve.LN) and TCRγδ Vγ5-ve or Vγ5+ ve T-IEL (Tg.dVg5-.IEL, TgdVg5+T- IEL). (b–c) Comparison, by flow cytometry of the expression of EpCam (b) and E-cadherin (c) in WT lymph node (LN) CD8 T cells, all three subsets of T-IEL and intestinal epithelial cells (IEC). Bar plots presenting geometric mean fluorescence intensities of n = 3 biological replicates are shown on the side of each histogram. Mean ± SEM shown. The p-values were calculated using one-way ANOVA and Dunnett’s multiple comparisons test. (d) Gating strategy used to identify T-IEL and IEC for (b–c). Lymphocytes and IEC were gated by size using forward scatter (FCS) and side scatter (SSC) and doublets were excluded. T-IEL subsets were separated as described in the fluorescence activated cell sorting (FACS) strategy in Figure 1—figure supplement 1. (e) ZO-2 and E-cadherin immunofluorescence of T-IEL and WT LN CD8 T cells. Isolated T-IEL depleted of annexin V-positive contaminants (T-IEL, top) and isolated purified LN CD8 T cells (LN, bottom) were fixed, permeabilised, immunostained for ZO-2 (green on overlay, left panels), E-cadherin (red on overlay, left panels) and CD8α (not shown) or with secondary antibodies only (right panels), and counterstained with DAPI to mark the nuclei (blue). Representative maximal intensity projections of confocal sections spanning the entire cell thickness of CD8α-positive cells of each type are shown. Black and white images show individual ZO-2 (middle rows) or E-cadherin (bottom rows) staining or matching secondary antibody-only controls. All images were acquired and processed identically. Size bars are 2 µm.
-
Figure 6—figure supplement 1—source data 1
- https://cdn.elifesciences.org/articles/70055/elife-70055-fig6-figsupp1-data1-v4.xlsx
Figure 7
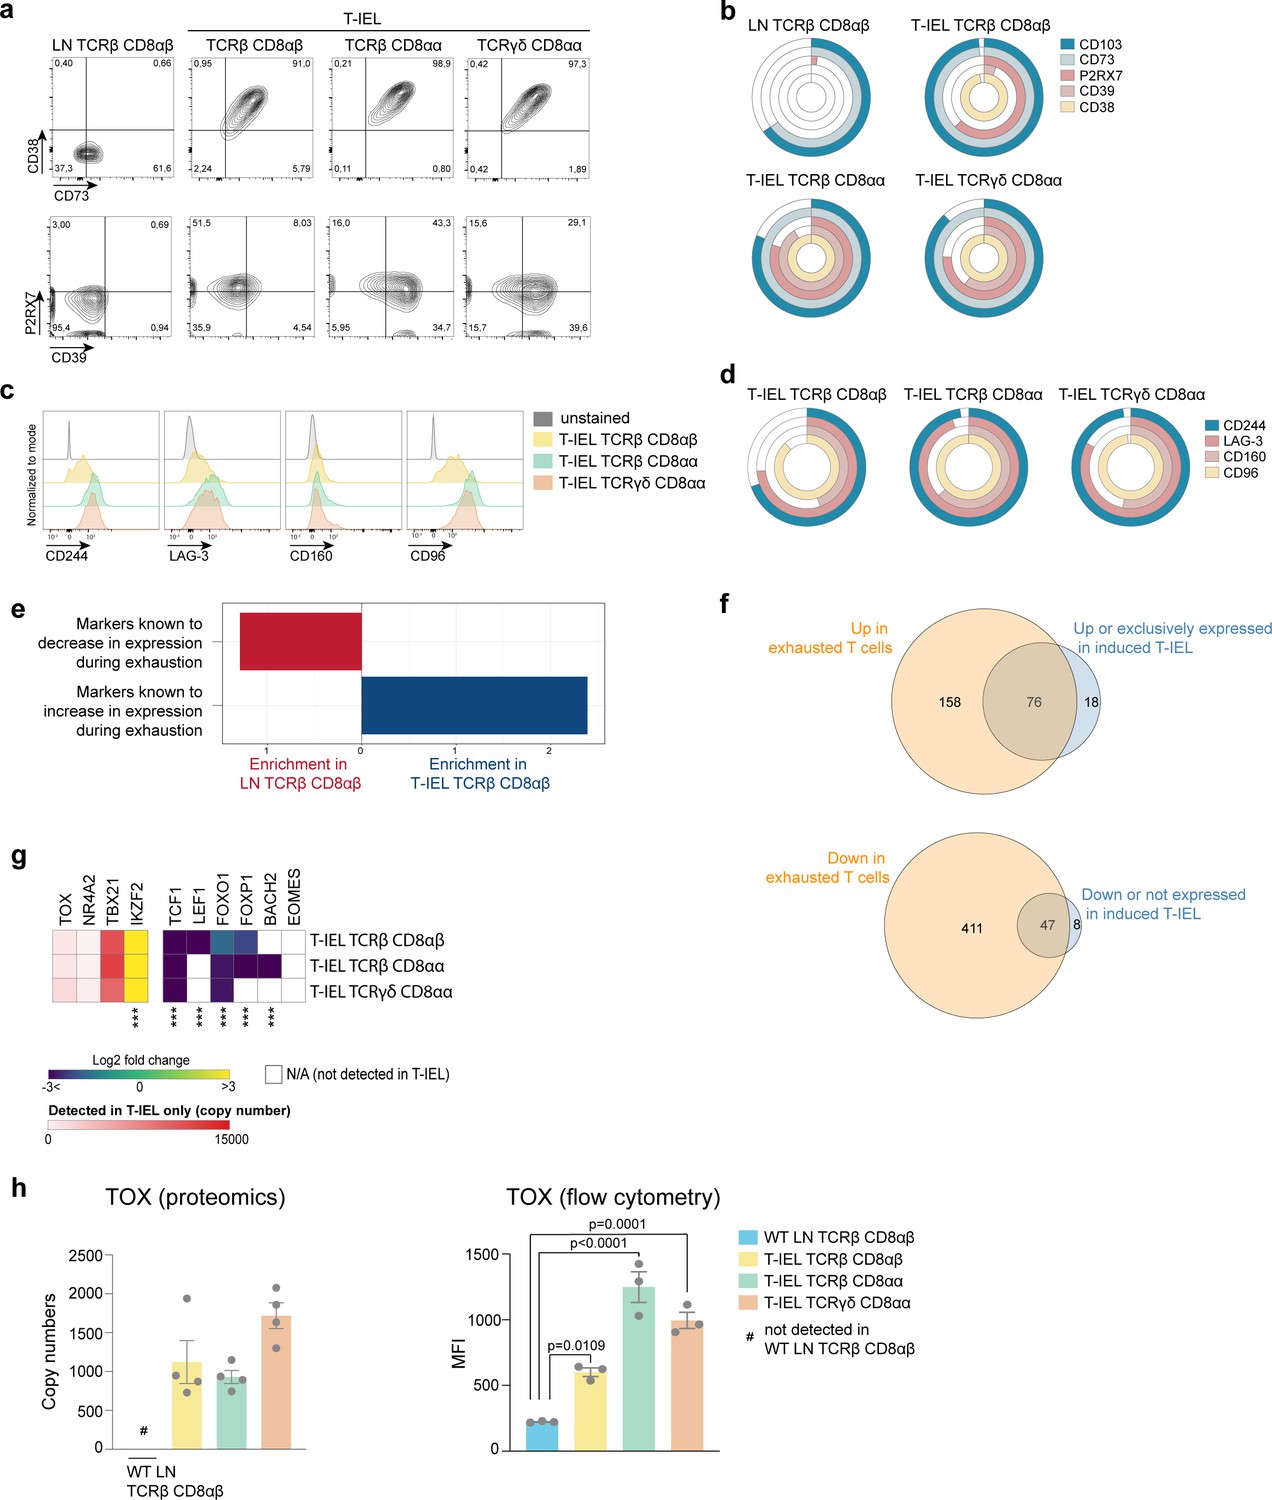
Tissue-resident intestinal intraepithelial T lymphocytes (T-IEL) share similarities with exhausted T cells.
(a) Flow cytometry dot plots comparing the expression of purinergic receptors (CD38/CD73, top and P2RX7/CD39, bottom) in wild-type (WT) lymph node (LN) TCRβ CD8αβ and all three subsets of T-IEL. (b) Stacked doughnut plot showing the percentages of cells from LN CD8 T cells and T-IEL expressing the indicated purinergic receptors, quantified by flow cytometry (n = 1 biological replicate). (c) Flow cytometric histograms comparing the protein expression of the exhaustion markers, CD244, LAG-3, CD160, and CD96 in all three subsets of T-IEL. (d) Stacked doughnut plot showing the percentage of cell from LN CD8 T cells and T-IEL expressing the indicated exhaustion markers quantified by flow cytometry (n = 4 biological replicates). (e) Bar plot showing the result of the T cells exhaustion overrepresentation analyses in LN TCRβ CD8αβ and in TCRβ CD8αβ T-IEL. (f) Venn diagrams showing the commonality of proteins upregulated (top) and downregulated (bottom) during exhaustion and in TCRβ CD8αβ T-IEL. (g) Heatmap displaying the Log2 fold change (T-IEL/LN CD8 T cells) of transcription factors associated with exhaustion in T cells. (h) Bar plots showing the estimated protein copy number of TOX (left) and flow cytometry derived MFI for TOX (right) for WT LN TCRβ CD8αβ and all three subsets of T-IEL. The proteomics data displayed on the plots include WT TCRαβ CD8αβ T cells (n = 6 biological replicates), TCRαβ CD8αβ T-IEL and TCRαβ CD8αα T-IEL (n = 3 biological replicates), and TCRγδ CD8αα T-IEL (n = 4 biological replicates). The flow cytometry was performed on three biological replicates, representative of two independent experiments. The p-values for individual proteins (g–h) were calculated in R with LIMMA where ** = p < 0.001 and fold change greater than or equal to the median+1 standard deviation, *** = p < 0.0001 and fold change greater than or equal to the median±1.5 standard deviations, for the flow cytometry data (h) in GraphPad Prism using one-way ANOVA with Dunnett’s multiple comparisons test. For full protein names, see Supplementary file 4.
-
Figure 7—source data 1
Flow cytometry-based percentage of cells expressing exhaustion markers and TOX MFI.
- https://cdn.elifesciences.org/articles/70055/elife-70055-fig7-data1-v4.xlsx
Figure 8
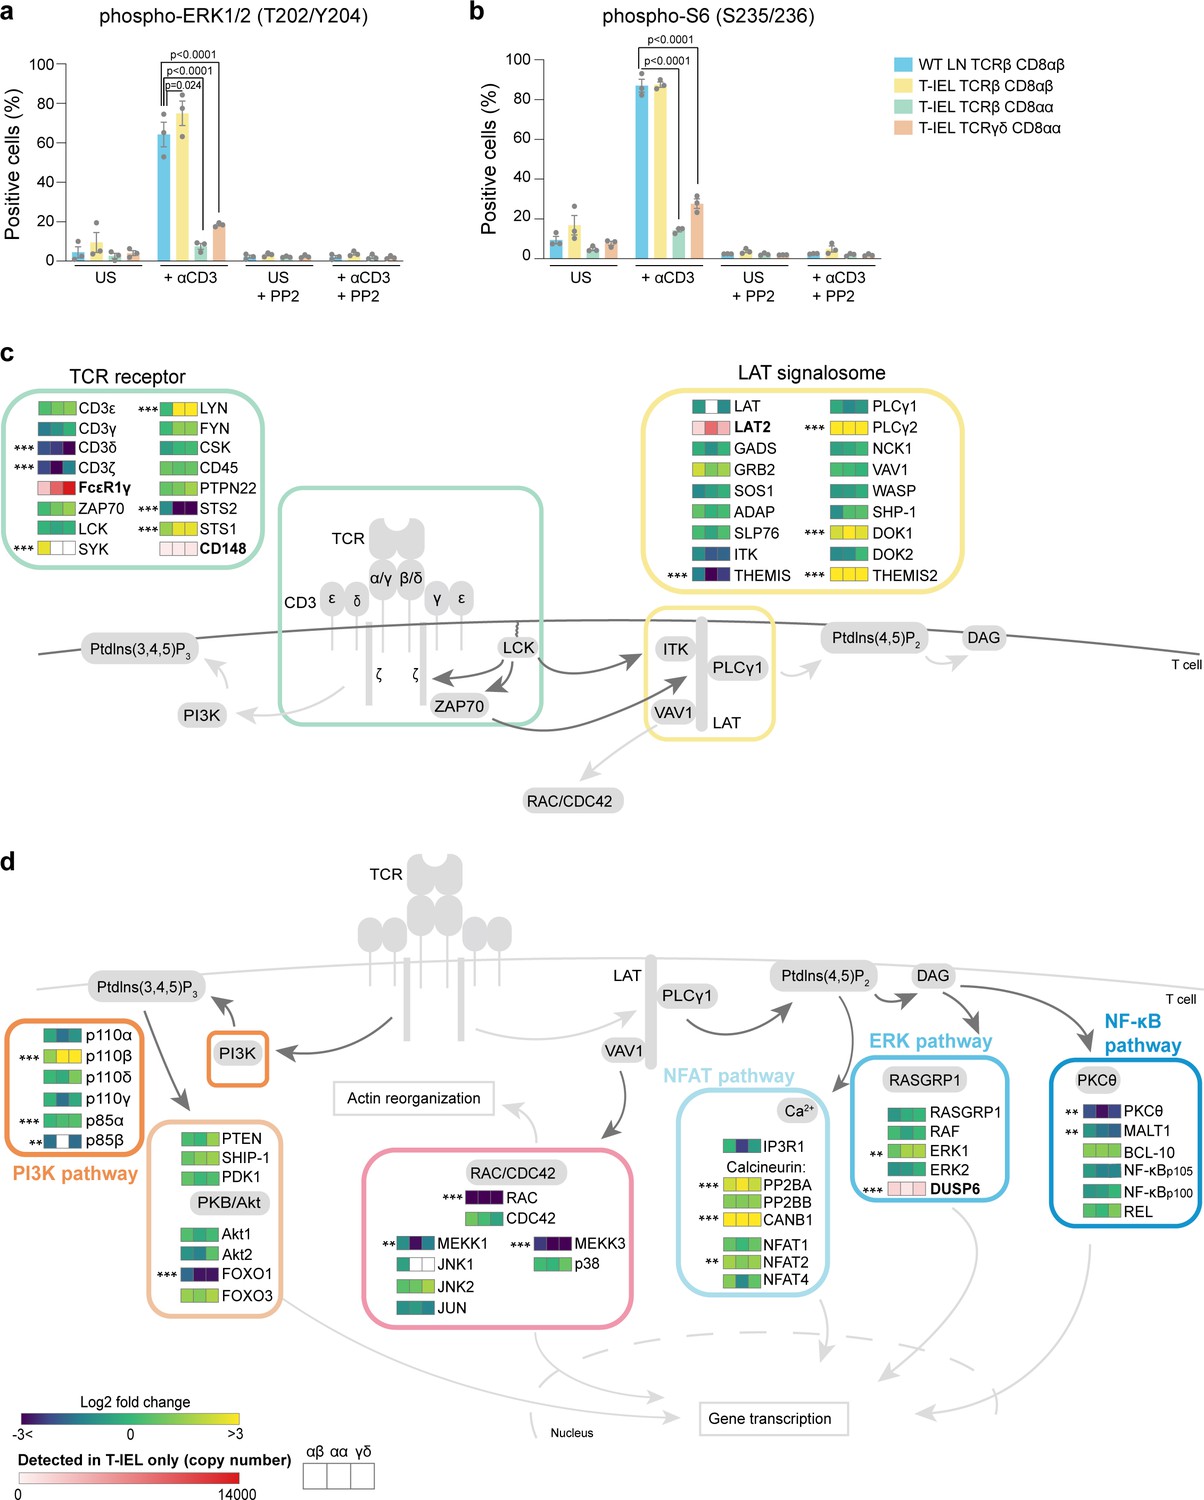
Rewiring of the T cell antigen receptor (TCR) signalosome in tissue-resident intestinal intraepithelial T lymphocytes (T-IEL).
(a–b) Responses of wild-type (WT) lymph node (LN) CD8 T cells and T-IEL to TCR stimulation. Bar plots show the percentage of cells positive for (a) phospho-ERK1/2 (T202/Y204) and (b) phospho-S6 (S235/236) before and after anti-CD3 stimulation. The Src kinase inhibitor PP2 was added as a control to show that induction of ERK1/2 and S6 phosphorylation was specific. n = 3 biological replicates, p-values were calculated by two-way ANOVA with Dunnett’s multiple comparisons test. Data are available in Figure 8—source data 1. (c–d) Schematic representation of the main TCR signalling pathways comparing the expression of selected proteins in T-IEL and LN naïve T cells. (c) TCR and LAT signalosome. (d) Signalling pathways downstream TCR receptor. All heatmap squares represent the Log2 fold change (T-IEL/LN CD8 T cells) in, from left to right, T-IEL TCRβ CD8αβ, T-IEL TCRβ CD8αα, and T-IEL TCRγδ CD8αα. Proteins expressed only by T-IEL are highlighted by red squares, representing estimated protein copy numbers (mean from at least three biological replicates). The proteomics data displayed on the plots was calculated from WT TCRαβ CD8αβ T cells (n = 6 biological replicates), TCRαβ CD8αβ T-IEL and TCRαβ CD8αα T-IEL (n = 3 biological replicates), and TCRγδ CD8αα T-IEL (n = 4 biological replicates). The p-values were calculated in R with LIMMA, where ** = p < 0.001 and fold change greater than or equal to the median+1 standard deviation, *** = p < 0.0001 and fold change greater than or equal to the median±1.5 standard deviations. For protein names, see Supplementary file 4.
-
Figure 8—source data 1
Flow cytometry-based percentage of cells positive for phospho ERK1/2 and phospho-S6.
- https://cdn.elifesciences.org/articles/70055/elife-70055-fig8-data1-v4.xlsx
Author response image 1
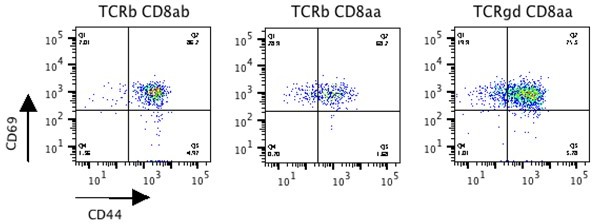
Representative flow cytometric dot plots showing the expression of activation markers CD69 and CD44 in all 3 populations of T-IEL.
Tables
Key resources table
| Reagent type (species) or resource | Designation | Source or reference | Identifiers | Additional information |
|---|---|---|---|---|
| Genetic reagent (Mus musculus) | P14 | PMID:2573841 | ||
| Strain, strain background (Mus musculus) | C57BL/6 J | Charles Rivers | RRID:IMSR_JAX:000664 | |
| Chemical compound, drug | DAPI | Thermo Fisher Scientific | Cat # D1306 | 1 µg/ml |
| Antibody | Anti-CD4 (rat, monoclonal) | Thermo Fisher Scientific (eBiosciences) | RRID:AB_494000 | Cell surface staining (1:200) |
| Antibody | Anti-CD8a (rat, monoclonal) | BioLegend | RRID:AB_2562558 | Cell surface staining (1:400) |
| Antibody | Anti-CD8a (rat, monoclonal) | BioLegend | RRID:AB_312746 | Immunofluorescence (1:100) |
| Antibody | Anti-CD8b (rat, monoclonal) | eBioscience | RRID:AB_657764RRID:AB_1121888 | Cell surface staining (1:400) |
| Antibody | Anti-CD38 (rat, monoclonal) | BioLegend | RRID:AB_312928RRID:AB_312929 | Cell surface staining (1:200) |
| Antibody | Anti-CD39 (rat, monoclonal) | BioLegend | RRID:AB_2563395 | Cell surface staining (1:200) |
| Antibody | Anti-CD44 (rat, monoclonal) | BD Biosciences | RRID:AB_1272244 | Cell surface staining (1:200) |
| Antibody | Anti-CD62L (rat, monoclonal) | Thermo Fisher Scientific | RRID:AB_469632 | Cell surface staining (1:200) |
| Antibody | Anti-CD73 (rat, monoclonal) | BioLegend | RRID:AB_11219608 | Cell surface staining (1:200) |
| Antibody | Anti-CD96 (rat, monoclonal) | BioLegend | RRID:AB_1279389 | Cell surface staining (1:200) |
| Antibody | Anti-CD103 (Armenian hamster, monoclonal) | BioLegend | RRID:AB_2563691 | Cell surface staining (1:200) |
| Antibody | Anti-CD160 (rat, monoclonal) | BioLegend | RRID:AB_10960740RRID:AB_10960743 | Cell surface staining (1:200) |
| Antibody | Anti-CD244 (rat, monoclonal) | eBioscience | RRID:AB_657872 | Cell surface staining (1:200) |
| Antibody | Anti-E-cadherin (mouse monoclonal) | BD Biosciences | RRID:AB_397581 | Immunofluorescence (1:100) |
| Antibody | Anti-LAG-3 (rat, monoclonal) | eBioscience | RRID:AB_2573427 | Cell surface staining (1:100) |
| Antibody | Anti-P2 × 7 R (rat, monoclonal) | BioLegend | RRID:AB_2650951 | Cell surface staining (1:200) |
| Antibody | Anti-TCRb (Armenian hamster, monoclonal) | BioLegend | RRID:AB_2629696 | Cell surface staining (1:100) |
| Antibody | Anti-EpCam (rat, monoclonal) | eBioscience | RRID:AB_953617 | Cell surface staining (1:200) |
| Antibody | Anti-E-cadherin (rat, monoclonal) | eBioscience | RRID:AB_1834417 | Cell surface staining (1:100) |
| Antibody | Anti-TCRγδ (Armenian hamster, monoclonal) | BioLegend | RRID:AB_2563356 | Cell surface staining (1:200) |
| Antibody | Anti-phospho S6 (S235/236) (rabbit, monoclonal) | Cell Signaling Technology | RRID:AB_916156 | Intracellular staining (1:25) |
| Antibody | Anti-phospho ERK1/2 (T202/Y204) (rabbit, monoclonal) | Cell Signaling Technology | RRID:AB_331775 | Intracellular staining (1:200) |
| Antibody | Anti-ZO-2 (rabbit polyclonal) | Cell Signaling Technology | RRID:AB_2203575 | Immunofluorescence (1:50) |
| Antibody | Anti-CD3e (Armenian hamster, monoclonal) | BioLegend | RRID:AB_312667 | TCR stimulation (30 µg/ml) |
| Chemical compound, drug | PP2 | Merck (Calbiochem) | Cat # 529,573 | TCR stimulation, Src inhibitor |
| Chemical compound, drug | O-Propargyl-puromycin | JenaBioscience | NU-931–05 | Protein synthesis measurements |
| Commercial assay or kit | EasySep CD8+ T cell isolation kit | STEMCELL Technologies, UK | Cat # 19,853 | For isolating CD8+ T cells from LN |
| Commercial assay or kit | EasySep Mouse CD8a-positive selection kit II | STEMCELL Technologies, UK | Cat # 18,953 | For enriching CD8α+ IEL |
| Commercial assay or kit | EasySep Dead Cell Removal (Annexin V) Kit | STEMCELL Technologies, UK | Cat # 17,899 | For removing dead epithelial cells and enriching IEL |
| Commercial assay or kit | Amplex Red cholesterol Assay Kit | Invitrogen | Cat # A12216 | Cholesterol assay |
| Commercial assay or kit | EZQ protein quantification kit | Thermo Fisher Scientific | Cat # R33200 | For accurate protein quantification for proteomics |
| Software, algorithm | MaxQuant | https://www.maxquant.org/ | RRID:SCR_014485 | Version 1.6.3.3 |
| Software, algorithm | Limma | Ritchie et al., 2015 | RRID:SCR_010943 | Version 3.7 |
| Software, algorithm | qvalue | Bioconductor | RRID:SCR_001073 | Version 2.10 |
| Software, algorithm | FlowJo | TreeStar | Version 10 | |
| Software, algorithm | OMERO.figure | https://pypi.org/project/omero-figure/ | Version 4.4.0 | |
| Other | RPMI 1640 | Thermo Fisher Scientific/GIBCO | 21875–034 | Media to culture cells |
Additional files
-
Supplementary file 1
Estimated protein copy numbers and differential expression analysis derived from the mass spectrometric proteomics data for the three tissue-resident intestinal intraepithelial T lymphocytes (T-IEL) subsets and wild-type (WT) and P14 lymph node (LN) T cells.
- https://cdn.elifesciences.org/articles/70055/elife-70055-supp1-v4.xlsx
-
Supplementary file 2
PANTHER gene ontology enrichment analysis.
- https://cdn.elifesciences.org/articles/70055/elife-70055-supp2-v4.xlsx
-
Supplementary file 3
DAVID functional annotation enrichment analysis.
- https://cdn.elifesciences.org/articles/70055/elife-70055-supp3-v4.xlsx
-
Supplementary file 4
Abbreviations and protein names.
- https://cdn.elifesciences.org/articles/70055/elife-70055-supp4-v4.docx
-
Supplementary file 5
Exhaustion related protein lists.
(related to Figure 7e–f): Proteins expressed in induced tissue-resident intestinal intraepithelial T lymphocytes (T-IEL) and found to be up-regulated in exhausted T cells gene set, and proteins missing or downregulated in induced T-IEL, found to be down-regulated in exhausted T cells gene set (Khan et al., 2019).
- https://cdn.elifesciences.org/articles/70055/elife-70055-supp5-v4.xlsx
-
Supplementary file 6
Set-up of tandem mass tags (TMT) labelling of samples for proteomics.
- https://cdn.elifesciences.org/articles/70055/elife-70055-supp6-v4.xlsx
-
Transparent reporting form
- https://cdn.elifesciences.org/articles/70055/elife-70055-transrepform1-v4.docx
Download links
A two-part list of links to download the article, or parts of the article, in various formats.
Downloads (link to download the article as PDF)
Open citations (links to open the citations from this article in various online reference manager services)
Cite this article (links to download the citations from this article in formats compatible with various reference manager tools)
Tissue environment, not ontogeny, defines murine intestinal intraepithelial T lymphocytes
eLife 10:e70055.
https://doi.org/10.7554/eLife.70055


