Silencing long ascending propriospinal neurons after spinal cord injury improves hindlimb stepping in the adult rat
- Interdisciplinary Program in Translational Neuroscience, School of Interdisciplinary and Graduate Studies, University of Louisville, United States
- Department of Anatomical Sciences and Neurobiology, University of Louisville, Louisville, United States
- Kentucky Spinal Cord Injury Research Center, University of Louisville, United States
- Speed School of Engineering, University of Louisville, United States
- Department of Neurological Surgery, University of Louisville, United States
Figures
Figure 1 with 1 supplement
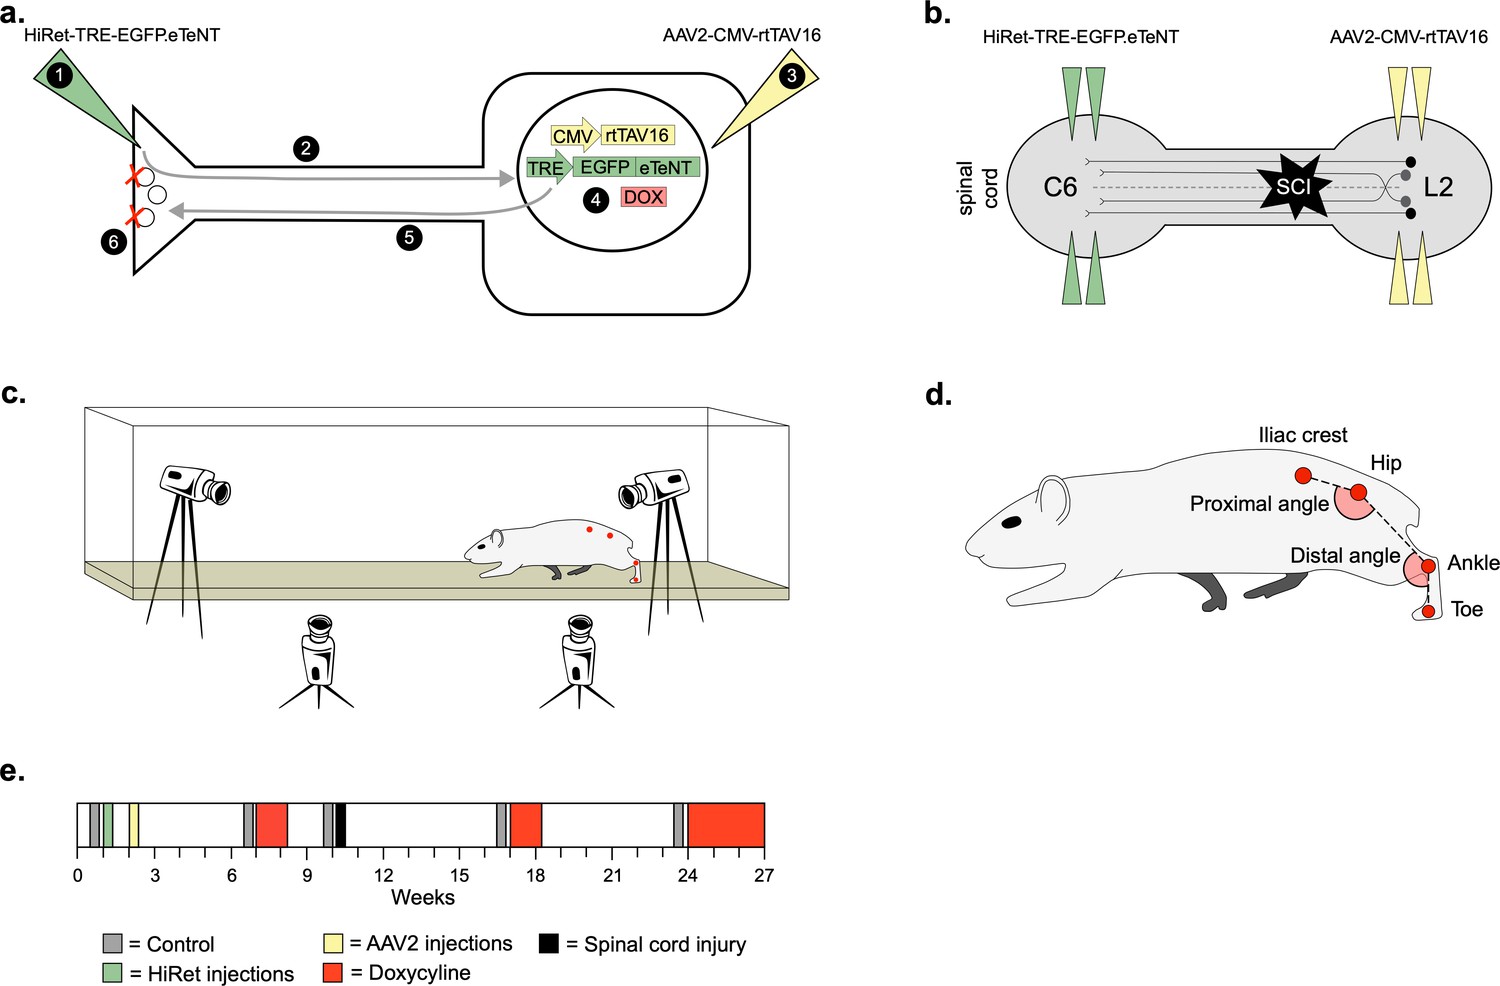
Experimental design to conditionally silence long ascending propriospinal neurons (LAPNs) after spinal cord injury (SCI).
(a) Viral injection protocol for viral silencing in neurons. HiRet-TRE-EGFP.eTeNT (‘eTeNT’), a lentiviral vector is injected at axon terminals (a1) and is retrogradely transported to cell bodies with high efficiency (a2). A second viral vector, AAV2-CMV-rtTAV16, is injected at the cell bodies and expresses the doxycycline (Dox)-dependent Tet-On sequence, a variant of the reverse tetracycline transactivator (a3). Without Dox, neurons constitutively express rtTAV sequence, but it is not active. Upon administration of Dox in the animals’ drinking water (a4), rtTAV16 becomes active and binds to the tetracycline response element (TRE) promoter on the lentiviral vector, leading to expression of EGFP.eTeNT only in doubly infected neurons. EGFP.eTeNT is then anterogradely transported to neuronal cell terminals (a5), where it cleaves vesicle associated membrane protein 2 (VAMP2) which impairs vesicles binding to the cell membrane, vesicle exocytosis, and neurotransmission (a6, Pocratsky et al., 2017; Kinoshita et al., 2012). Bilateral injections of enhanced tetanus neurotoxin (eTeNT, green triangles) (b) and Tet-On rtTAV16 (yellow triangles, b) were performed at C6 and L2 spinal cord levels, respectively, followed by an spinal cord injury (SCI) (black star, b). Kinematic measurements were obtained in a clear acrylic tank with two sagittal cameras and one ventral camera to obtain intralimb and interlimb coordination, respectively (c). Joint angles were obtained by marking animals’ iliac crest, hip, ankle, and toe using tattooing ink and physical palpation of the joints (d). The experimental timeline is shown in (e).
Figure 1—figure supplement 1
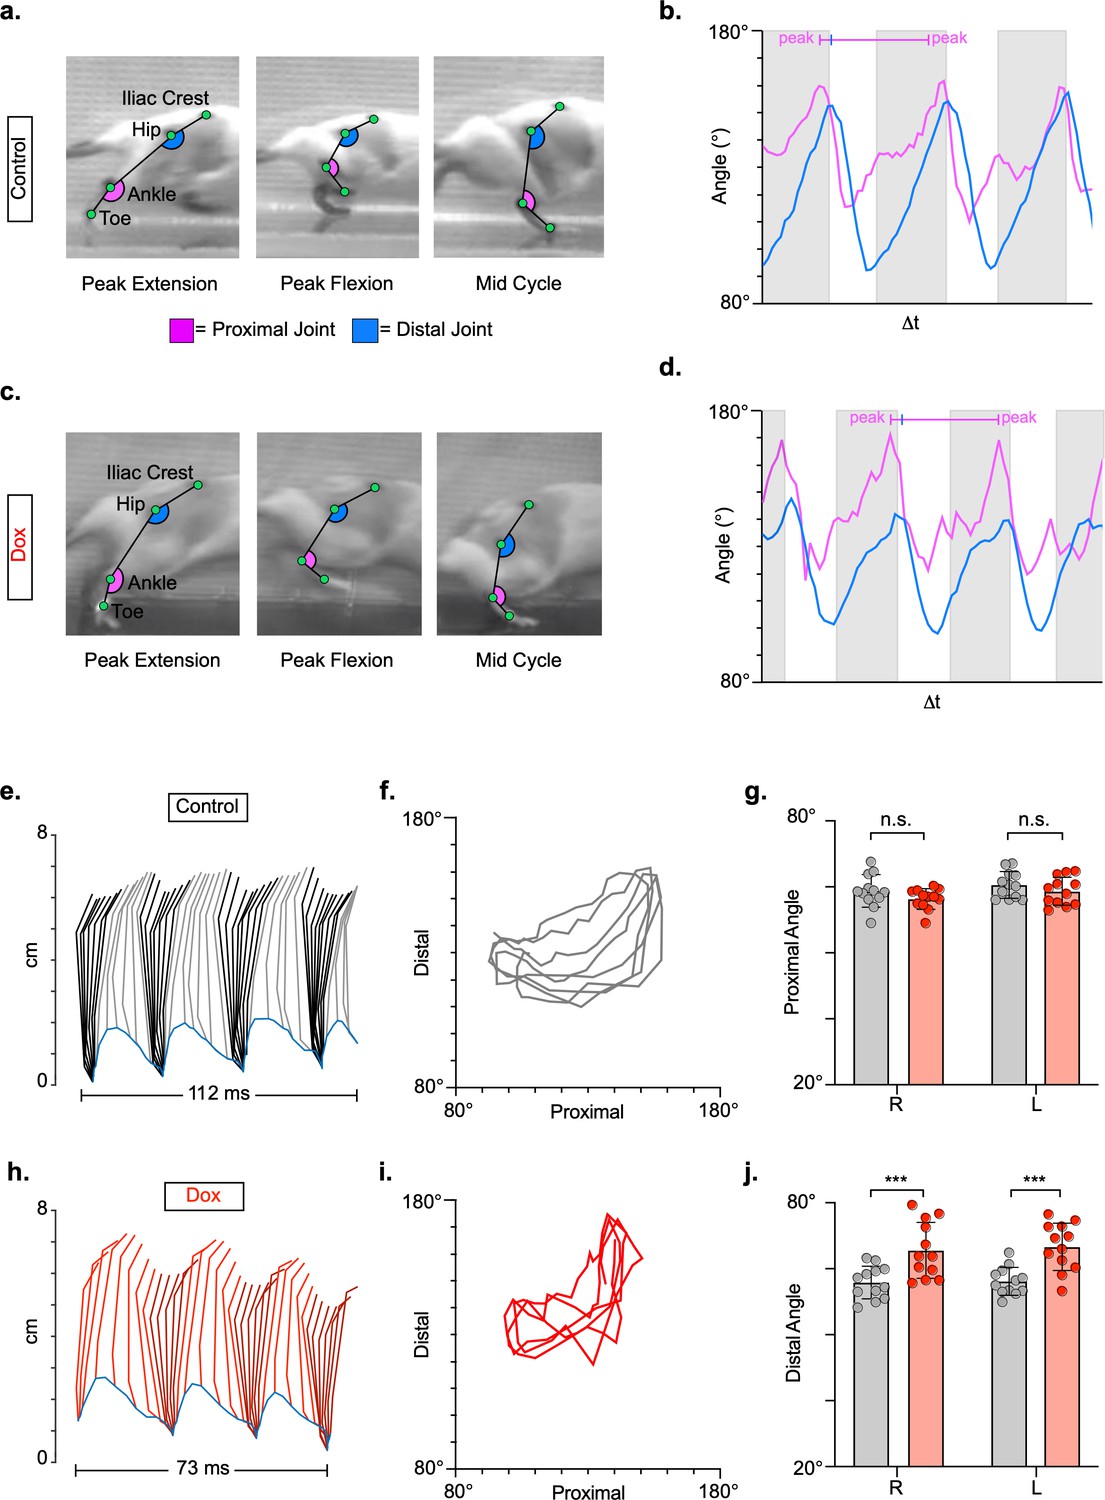
Long ascending propriospinal neurons (LAPNs) do not contribute to intralimb locomotor coordination of uninjured animals.
Representative images of intralimb joint angles of the proximal (iliac crest-hip-ankle) and distal (hip-ankle-toe) joints during control (a) and doxycycline (Dox) (C) timepoints. Example images are taken from three moments within a step cycle: peak extension, peak flexion, and mid stance. We examined the peak excursion of each angle at control and Dox timepoints using excursion traces of the proximal and distal joint angles, indicated by the blue and purple lines, respectively (b,d). Gray boxes indicate stance portions of the step cycle. Two-dimensional stick figures of hindlimb stepping (e,h) and angle-angle plots (f,i; sampling rate = 100 frames/s) from the same passes shown in (a,c). Toe height throughout the pass is indicated as a blue trace on the bottom of the two-dimensional stick figures. The average excursions of the proximal angles (g, control right: 58.79 ± 4.94 vs. Dox right: 56.56 ± 3.12, t = 2.08, df = 11, p = 0.062; control left: 60.40 ± 4.04 vs. Dox left: 58.65 ± 4.23, t = 2.17, df = 11, p = 0.053; paired t-tests) and distal angles (j, control right: 55.84 ± 4.93 vs. Dox right: 65.57 ± 8.46, t = 4.55, df = 11, p = 0.001; control left: 56.19 ± 4.24 vs. Dox left: 66.64 ± 7.16, t = 6.63, df = 11, p < 0.001; paired t-tests; bars indicate mean with individual animal averages shown as circles) for control and silenced timepoints are shown.
-
Figure 1—figure supplement 1—source data 1
Long ascending propriospinal neurons (LAPNs) do not contribute to intralimb locomotor coordination of uninjured animals.
- https://cdn.elifesciences.org/articles/70058/elife-70058-fig1-figsupp1-data1-v2.xlsx
Figure 2
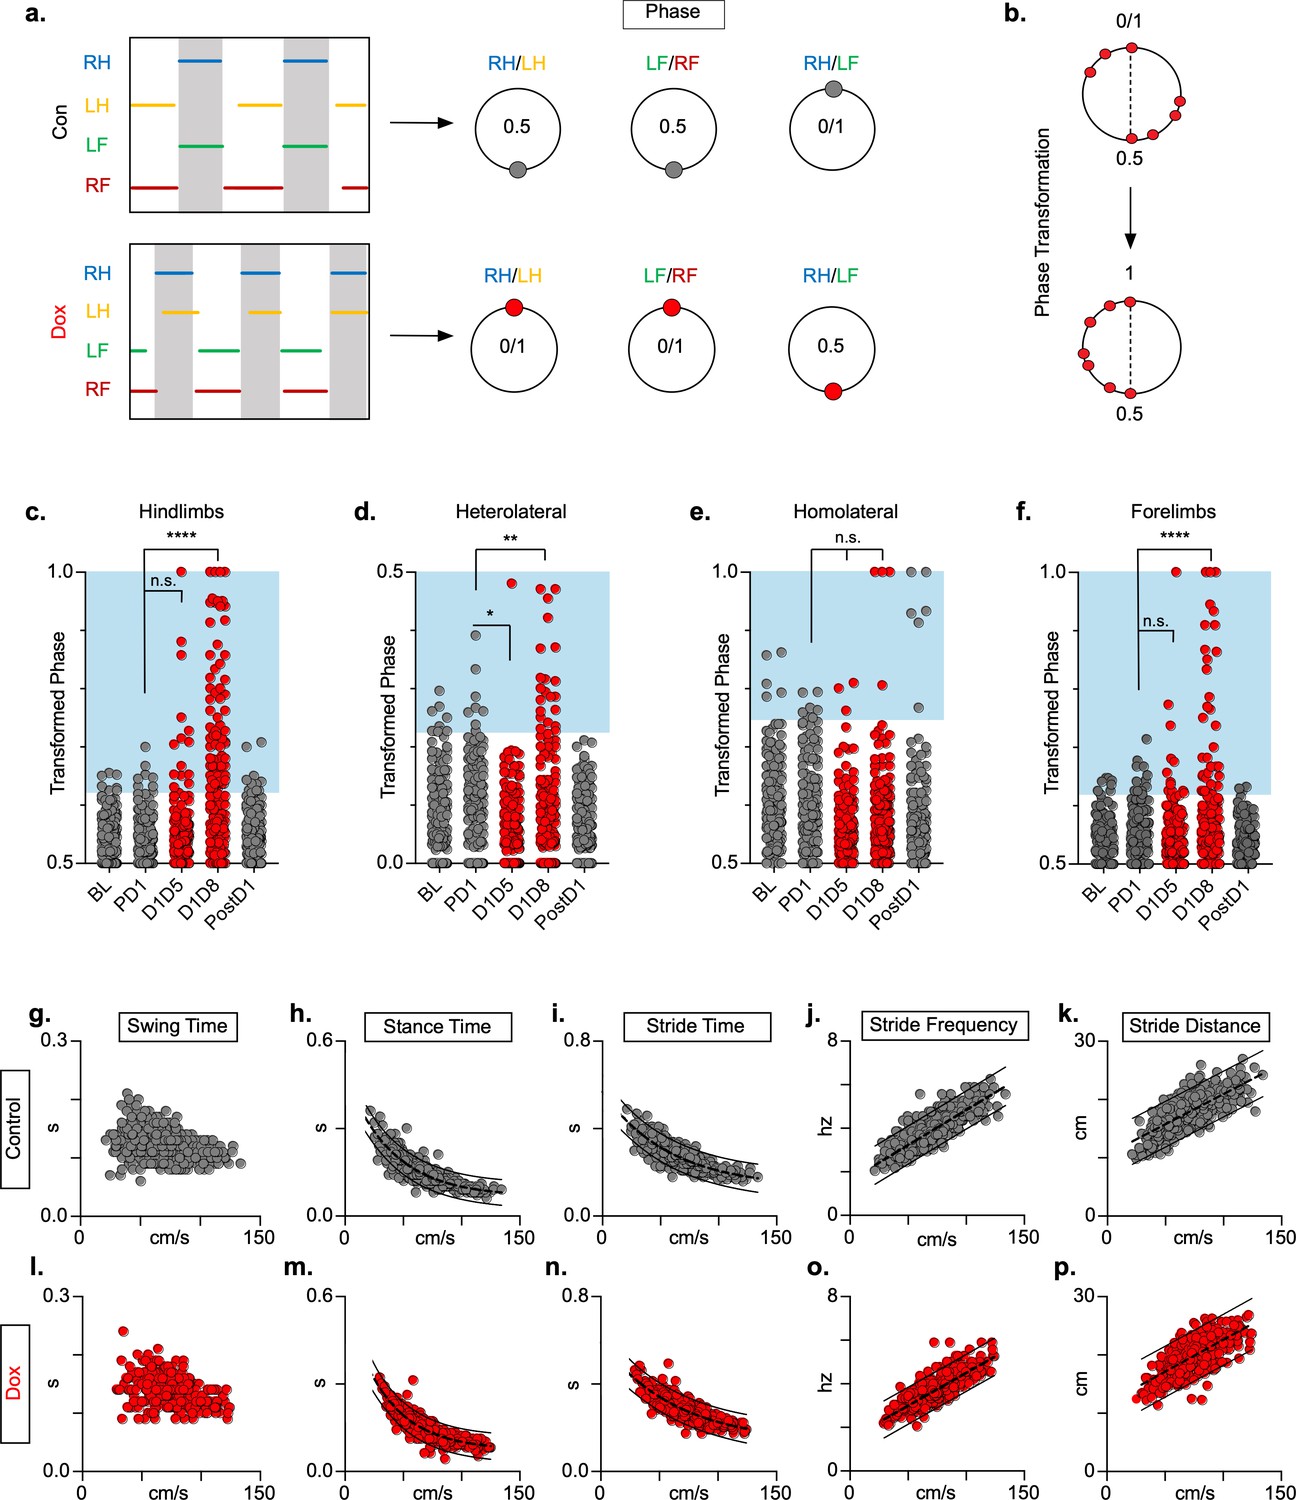
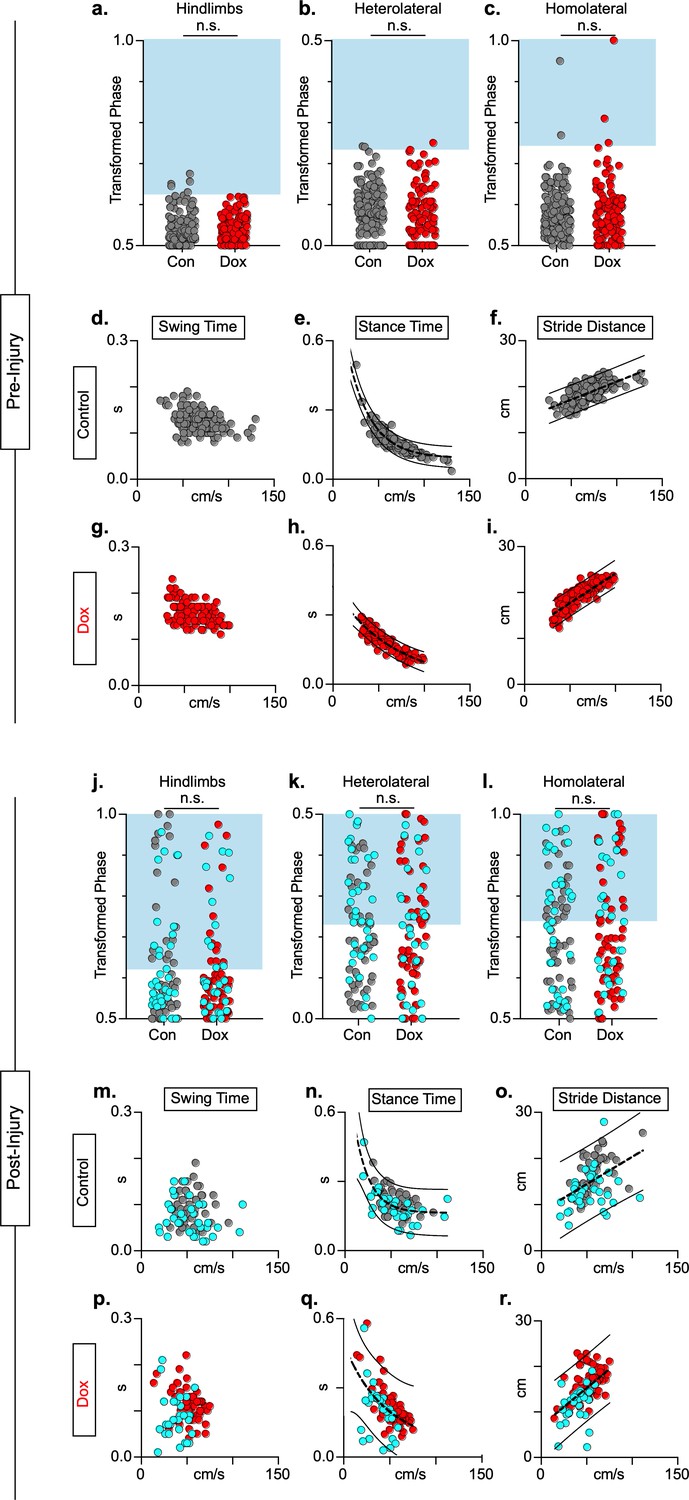
Silencing long ascending propriospinal neurons (LAPNs) disrupts interlimb coordination without affecting key features of locomotion.
(a) Representative footfall graphs are shown with corresponding coordination phase values for both control and doxycycline (Dox) timepoints (RH = right hindlimb, LH = left hindlimb, LF = left forelimb, RF = right forelimb). Shaded regions indicate swing phase of LH and RF within the footfall cycle. Phase values generated from footfall graphs were converted to a scale of 0–1 to 0.5–1 for the hindlimb, forelimb, and homolateral hindlimb-forelimb pairs and 0–0.5 for the heterolateral hindlimb-forelimb pair so they could be further examined on a linear scale (b). The hindlimb and forelimb pairs were significantly altered during LAPN silencing, while the heterolateral hindlimb-forelimb pair was mildly affected and the homolateral hindlimb-forelimb pairs remained unaffected (c–f), # steps beyond control variability: PD1 hindlimbs n = 7/168 [4.17%] vs. D1D5 hindlimbs n = 14/166 [8.43%]; n.s., z = 1.62; PD1 hindlimbs n = 7/168 [4.17%] vs. D1D8 hindlimbs n = 72/161 [44.72%]; p < 0.001, z = 9.63; PD1 heterolateral n = 8/168 [4.76%] vs. D1D5 heterolateral n = 1/166 [0.60%]; p < 0.05, z = 2.38; PD1 heterolateral n = 8/168 [4.76%] vs. D1D8 heterolateral n = 21/161 [13.04%]; p < 0.01, z = 2.65; PD1 homolateral n = 7/168 [4.17%] vs. D1D5 homolateral n = 3/166 [1.80%]; n.s., z = 1.27; PD1 homolateral n = 7/168 [4.17%] vs. D1D8 homolateral n = 4/161 [2.48%]; n.s, z = 0.85; PD1 forelimbs n = 14/168 [8.33%] vs. D1D5 forelimbs n = 12/166 [7.23%]; n.s., z = 0.38; PD1 forelimbs n = 14/168 [8.33%] vs. D1D8 forelimbs n = 35/161 [21.74%]; p = 0.001, z = 3.45; binomial proportion test; circles = individual step cycles; shaded region = values beyond control variability. Spatiotemporal measures (swing time, stance time, stride time, stride distance) were plotted against speed for control (g–k) and Dox (l-p) timepoints. An exponential decay line of best fit is displayed for stance time and stride time graphs (stance time: control R2 = 0.785 vs. Dox R2 = 0.735; stride time: control R2 = 0.708 vs. Dox R2 = 0.667), while a linear line of best fit is displayed for stride distance (stride distance: control R2 = 0.584 vs. Dox R2 = 0.513; line of best fit indicated by dotted line); 95% prediction intervals are also shown as solid lines.
-
Figure 2—source data 1
Silencing long ascending propriospinal neurons (LAPNs) disrupts interlimb coordination without affecting key features of locomotion.
- https://cdn.elifesciences.org/articles/70058/elife-70058-fig2-data1-v2.xlsx
Figure 3
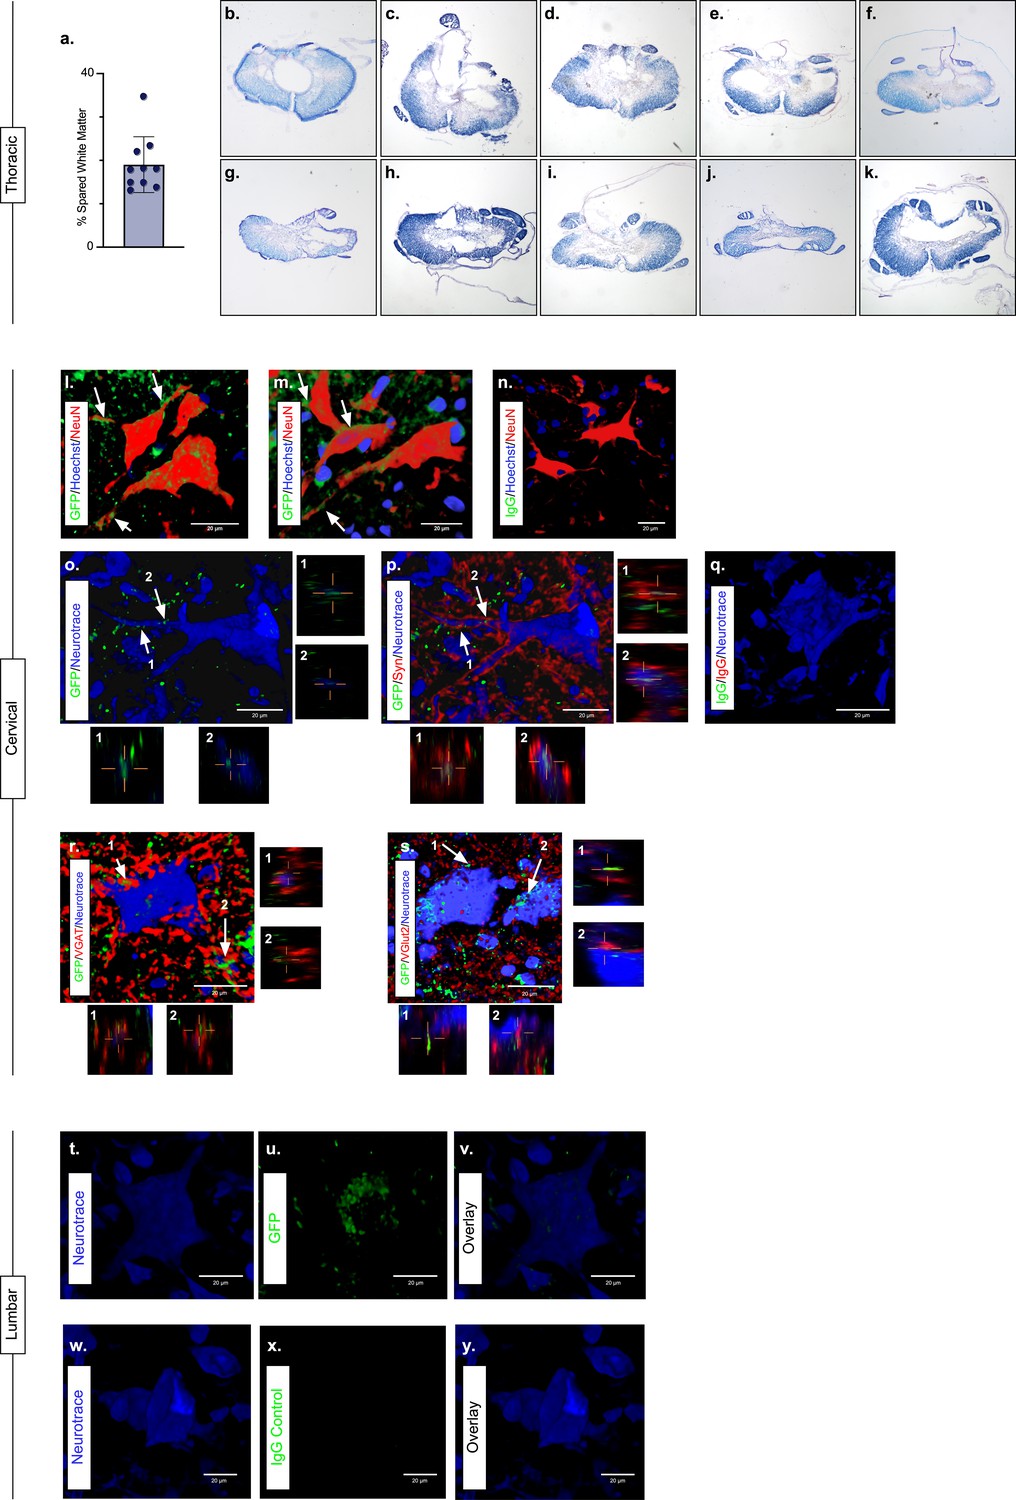
Presence of eTeNT.EGFP in putatively silenced long ascending propriospinal neurons (LAPNs) across the level of injury.
In the thoracic spinal cord, the percentage of spared white matter at the epicenter ranges from 13.01% to 34.64% (a). White matter damage at the spinal cord injury epicenter as confirmed by histology (b–k). Individual images represent the injury epicenter of each animal used in the main data set (N = 10; average white matter percentage: 19.02%, standard deviations (SD) 6.44%). High magnification, volume-rendered images (l-y) involved full z-stacks (Amira) that ranged from 55 to 64 slices at 0.45 µm optical steps (24.75–28.8 µm z-volume projection). Insets (o–s) show one 0.45 µm optical slice. These images demonstrate eTeNT.EGFP putatively positive fibers (green) surrounding NeuN-stained neurons (red) with Hoechst nuclear counterstain (blue) in cervical spinal cord segments of interest (l,m; C6-C7 spinal cord). White arrows indicate areas of co-localization. Isotype control reveals minimal immunoreactivity (n, IgG controls for eTeNT.EGFP shown). eTeNT.EGFP (green) signal co-localizes with neuronal processes (blue) and synaptophysin (red) (o,p). Isotype controls further show minimal reactivity (q, IgG controls of synaptophysin and eTeNT.EGFP shown). eTeNT.EGFP also co-localizes with the inhibitory neurotransmitter marker vesicular GABA transporter (r, VGAT, red) and the excitatory neurotransmitter vesicular glutamate transporter 2 (s, VGlut2, red). eTeNT.EGFP putative cell bodies (green) in the lumbar spinal cord co-localized with NeuroTrace fluorescent Nissl-stained neurons (blue) (t–v, L1-L2 spinal cord). Minimal presence of eTeNT.EGFP signal in isotype controls (w–y, L1-L2 spinal cord).
-
Figure 3—source data 1
Presence of eTeNT.EGFP in putatively silenced long ascending propriospinal neurons (LAPNs) across the level of injury.
- https://cdn.elifesciences.org/articles/70058/elife-70058-fig3-data1-v2.xlsx
Figure 4
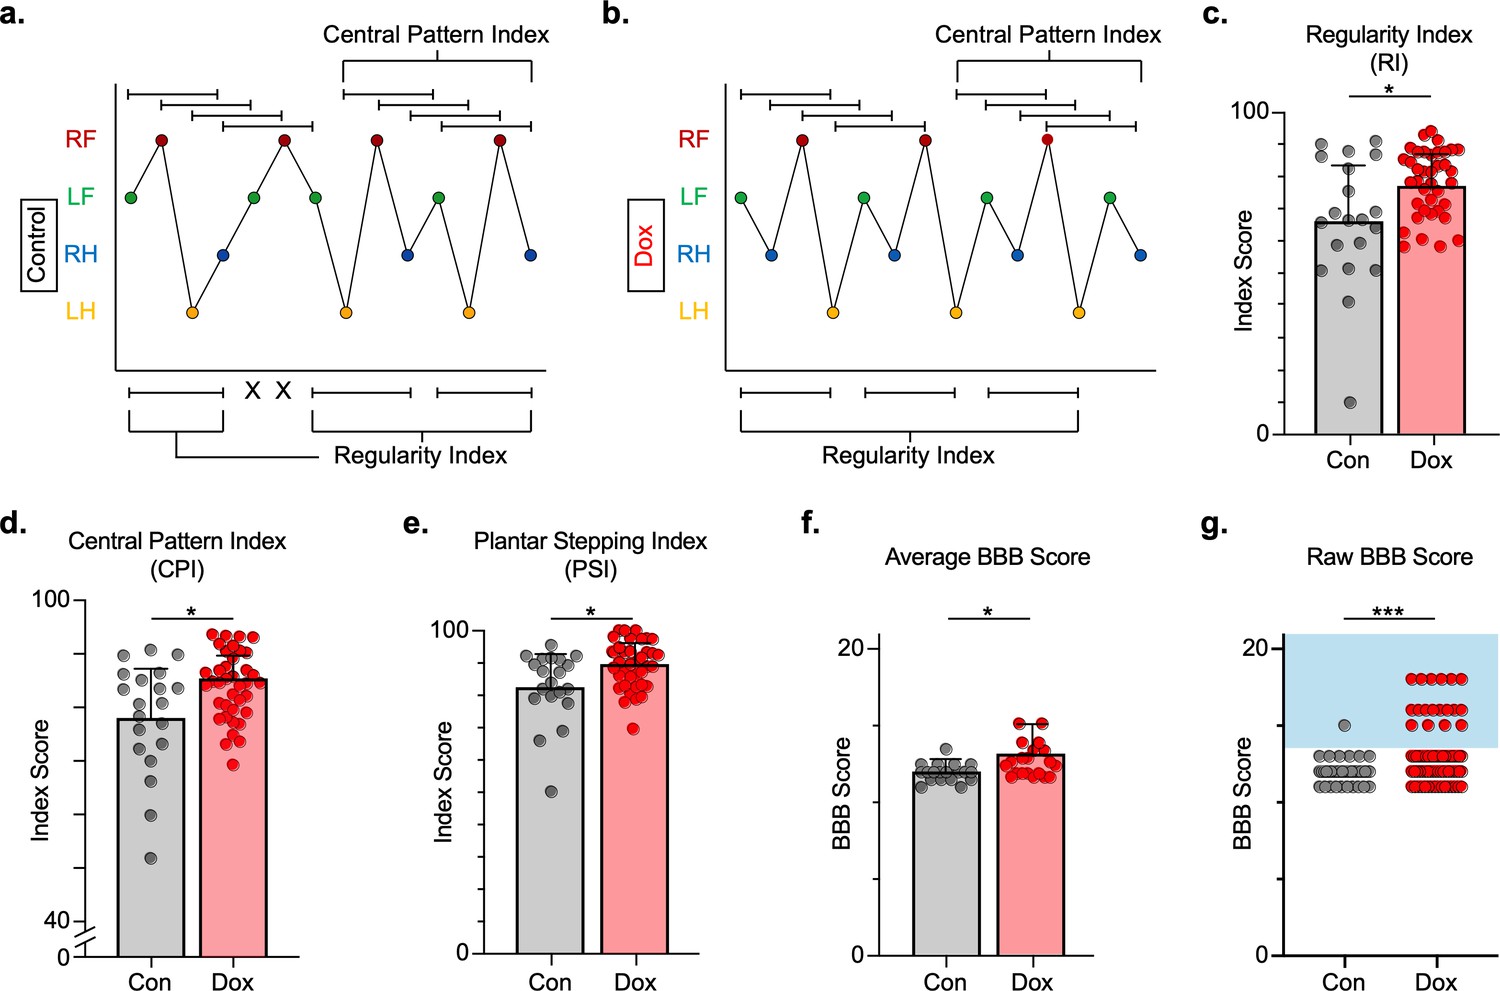
Silencing long ascending propriospinal neurons (LAPNs) post-spinal cord injury (SCI) restores coordination indices and improves gross locomotor outcomes.
Footfall patterns are shown from example stepping passes to demonstrate how the gait indices regularity index (RI) and central pattern index (CPI) differed between post-SCI control (a) and post-SCI doxycycline (Dox) (b) stepping (RF = right forelimb, LF = left forelimb, RH = right hindlimb, LH = left hindlimb). ‘X’ indicates incorrect footfall order as defined by the typical foot patterns in RI. The group average RI scores (c, control RI: 65.74 ± 18.52 vs. Dox RI: 76.97 ± 7.70, t = 2.88, df = 9, p = 0.018; paired t-test), CPI scores (d, control CPI: 78.37 ± 8.39 vs. Dox CPI: 84.84 ± 3.39, t = 2.94, df = 9, p = 0.016; paired t-test), and PSI scores (e, control PSI: 82.72 ± 9.97 vs. Dox PSI: 89.07 ± 4.87, t = 2.76, df = 9, p = 0.022; paired t-test) are demonstrated. Averages are calculated from animal average indices with individual animal index scores shown from each control and Dox timepoint for transparency (gray circles and red circles for control and Dox, respectively). Average Basso, Beattie, Bresnahan locomotor rating scale (BBB) scores for control and Dox timepoints are shown (f, group average ± standard deviations [SD] [control to Dox]; p = 0.663, mixed model analysis of variance (ANOVA), Bonferroni post hoc). No significant difference was found between right and left BBB scores so they were combined for average and raw score ([left vs. right]; p = 0.001, mixed model ANOVA, Bonferroni post hoc; data not shown). To demonstrate BBB scores prior to averaging, right and left hindlimb raw BBB scores are shown in (g, control: n = 1/40 [0.025%] vs. Dox: n = 18/76 [23.68%]; p < 0.001, z = 4.23; binomial proportion test; circles = individual left or right BBB scores; blue shaded region = values beyond post-SCI control variability).
-
Figure 4—source data 1
Silencing long ascending propriospinal neurons (LAPNs) post-spinal cord injury (SCI) restores coordination induces and improves gross locomotor outcomes.
- https://cdn.elifesciences.org/articles/70058/elife-70058-fig4-data1-v2.xlsx
Figure 5
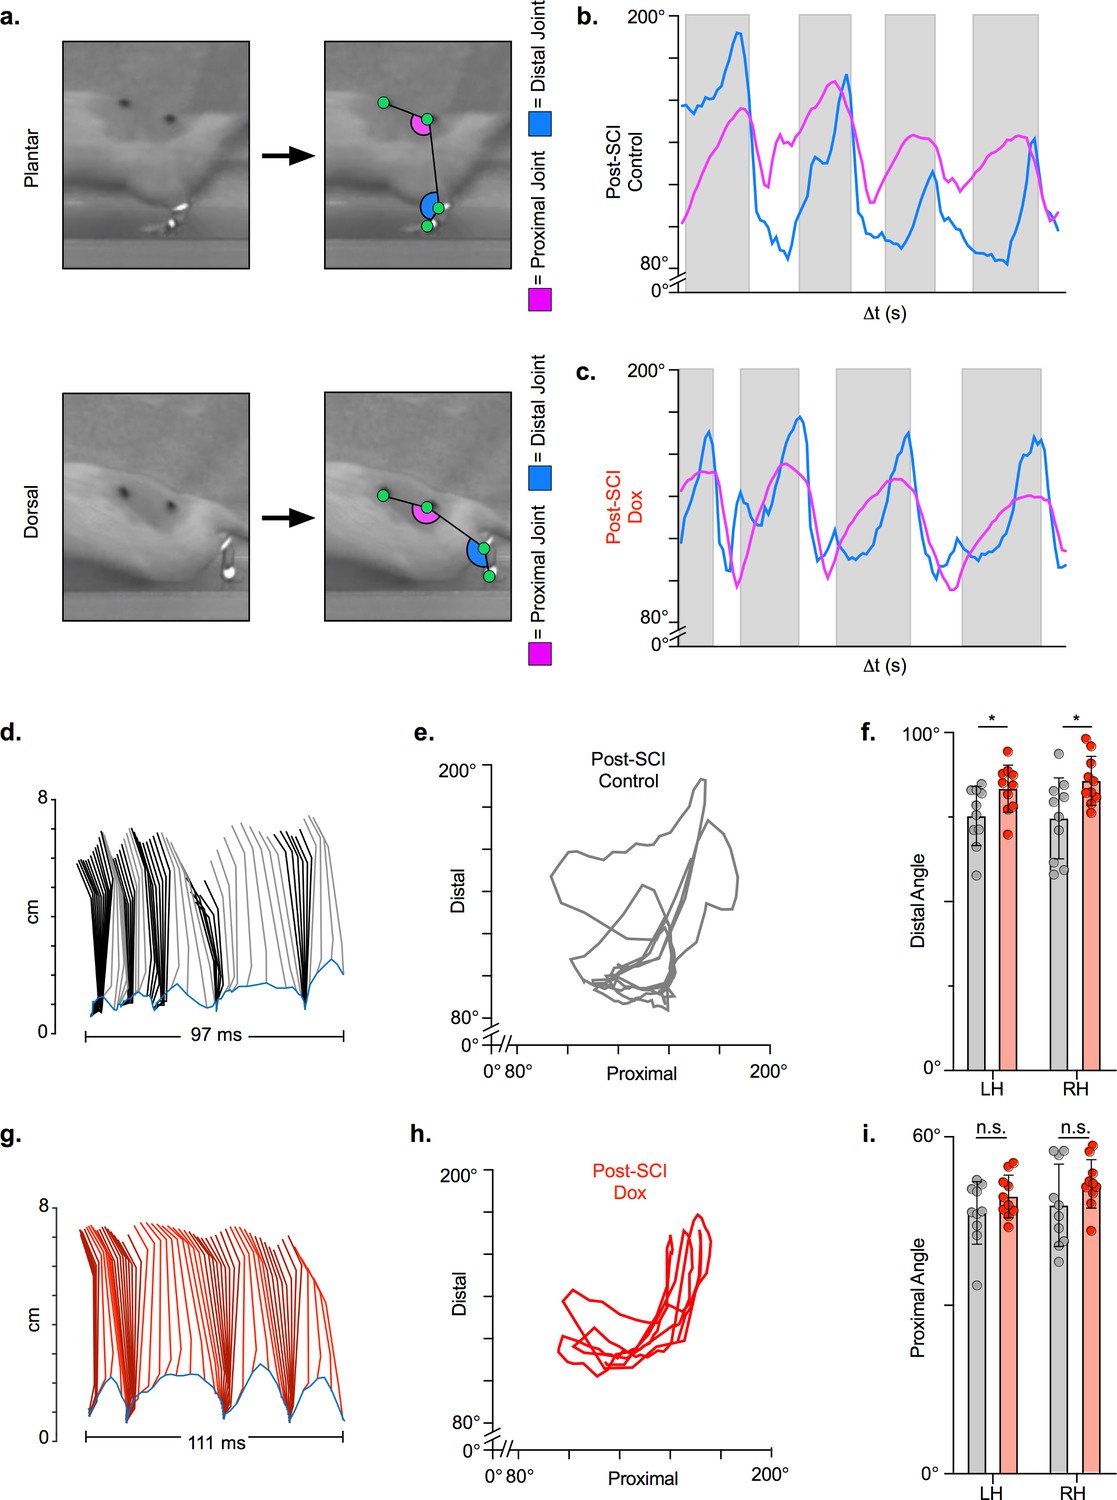
Long ascending propriospinal neuron (LAPN) silencing leads to modest improvements in intralimb coordination after spinal cord injury (SCI).
A representative sagittal view of kinematic markers for plantar steps and dorsal steps is shown in (a). Excursion traces of the proximal (purple) and distal (blue) joint angles during post-SCI control (b) and doxycycline (Dox) (c) timepoints are shown. Two-dimensional stick figures of hindlimb stepping (d,g) and angle-angle plots (e,h) from the same passes shown in (b,c). Toe height throughout the pass is indicated as a blue trace on the bottom of the two-dimensional stick figures in (d) and (g), with the angles around 2 cm indicating the distal joint movements (ankle) and the angles around 6 cm indicating the proximal joint movements (hip). Gray boxes indicate periods in which the paw is in contact with the surface (stance phase). Angle-angle plots are shown to directly compare the distal joint angle to the proximal joint angle for the same recording frame. In (f,i), gray boxes indicate post-SCI control data while pink boxes indicate post-SCI Dox data. Minor improvements in distal joint angle excursion (f, control left: 74.62 ± 11.96 vs. Dox left: 85.74 ± 7.24, t = 3.35, df = 9, p = 0.009; control right: 75.29 ± 8.73 vs. Dox right: 83.40 ± 6.99, t = 2.70, df = 9, p = 0.024; paired t-tests; LH = left hindlimb, RH = right hindlimb) and proximal joint angle excursion (i, control left: 47.64 ± 7.33 vs. Dox left: 51.47 ± 4.33, t = 2.65, df = 9, p = 0.027; control right: 46.45 ± 5.58 vs. Dox right: 49.37 ± 3.80, t = 2.93, df = 9, p = 0.017; paired t-tests; bar indicates group average with individual animal averages shown as colored circles) are demonstrated as a result of silencing.
-
Figure 5—source data 1
Long ascending propriospinal neuron (LAPN) silencing leads to modest improvements in intralimb coordination after spinal cord injury (SCI).
- https://cdn.elifesciences.org/articles/70058/elife-70058-fig5-data1-v2.xlsx
Figure 6 with 1 supplement

Hindlimb, but not hindlimb-forelimb, coupling relationships are restored during post-spinal cord injury (SCI) silencing.
A representative pass with multiple dorsal and plantar steps shown in (a; LH = left hindlimb, light yellow boxes = LH swing phase, dark yellow boxes = LH stance phase; RH = right hindlimb, light blue boxes = RH swing phase, dark blue boxes = RH stance phase). Dorsal stepping index (DSI) is shown in (b, control DSI: 24.41 ± 14.69 vs. doxycycline (Dox) DSI: 11.75 ± 5.79; t = 3.383, df = 7, p = 0.012; individual circles represent individual animal scores at each post-SCI control and Dox timepoint). DSI accounts for total dorsal steps for both left and right hindlimbs. The total dorsal steps from (b) were separated based on sidedness: right hindlimb (RH) and left hindlimb (LH) (c, control right: 0.568 ± 0.247 vs. Dox right: 0.605 ± 0.238, t = .554, df = 7, p = 0.597; control left: 0.432 ± 0.247 vs. Dox left: 0.395 ± 0.238, t = .554, df = 7, p = 0.597; paired t-tests). The right hindlimb showed more dorsal steps overall; however, it maintained that percentage during Dox. No significant differences were seen in sidedness. As with pre-SCI data, circular phase was transformed from a scale of 0–1 to 0.5–1.0 to eliminate lead limb preferences (d). Transformed phase values plantar and dorsal steps for hindlimb pair (e,f, number of control hindlimb plantar and dorsal steps above 2 standard deviations [SD]: n = 91/288 [31.59%] vs. number of Dox hindlimb plantar and dorsal steps above 2 SD: n = 62/514 [12.06%]; p < 0.001, z = 7.05), heterolateral hindlimb-forelimb pair (i,j, number of control heterolateral limb plantar and dorsal steps above 2 SD: n = 121/288 [42.01%] vs. number of Dox heterolateral limb plantar and dorsal steps above 2 SD: n = 189/514 [36.77%]; n.s., z = 1.46), and homolateral hindlimb-forelimb pair (l,m, number of control homolateral limb plantar and dorsal steps above 2 SD: n = 94/288 [32.64%] vs. number of Dox homolateral limb plantar and dorsal steps above 2 SD: n = 160/514 [31.13%]; n.s., z = 0.44) are shown. See Supplemental data for additional binomial proportions tests. Plantar steps are indicated by gray circles (post-SCI control) and red circles (post-SCI Dox), while dorsal steps are indicated by teal circles for both post-SCI control and Dox data sets. The blue boxes indicate step phase values outside of normal variability (>2 SD) and are calculated from the specified uninjured limb pair control mean. The percentage of abnormal steps found above normal variability (circles within the blue boxes) was calculated for their respective limb pair (f,j,m, percentage of steps above 2 SD from e, i, and l, respectively, shown in yellow portion of pie graphs). Passes with any left hindlimb dorsal steps were removed and plotted for each of the aforementioned limb pairs (g,k,n: control hindlimbs plantar steps only: n = 33/157 [21.02%] vs. Dox hindlimbs without dorsal steps: n = 39/397 [9.82%]; p < 0.005, z = 3.13; control heterolateral limbs plantar steps only: n = 59/157 [37.58%] vs. Dox heterolateral limbs plantar steps only: n = 144/397 [36.27%]; n.s., z = 0.29; control homolateral limbs plantar steps only: n = 44/157 [28.02%] vs. Dox homolateral limbs plantar steps only: n = 121/397 [30.48%]; n.s., z = 0.58, B.P. tests). For the forelimb pair, no significant differences were seen between control and Dox phase during the first post-injury Dox administration (h; PD2 forelimbs: n = 7/143 [4.90%] vs. D2D5 forelimbs: n = 4/137 [2.92%]; n.s., z = 0.86; PD2 forelimbs: n = 7/143 [4.90%] vs. D2D8 forelimbs: n = 4/133 [3.00%]; n.s., z = 0.81, BP tests). Significance was detected between control and Dox at the D1D8 timepoint during the second Dox administration (PD3; D3D8), but no significance was found at the extended Dox timepoint (D3D20; PD3 forelimbs: n = 14/145 [9.66%] vs. D3D8 forelimbs: n = 2/135 [1.48%]; p < 0.05, z = 2.94; PD3 forelimbs: n = 14/145 [9.66%] vs. D3D20 forelimbs: n = 4/109 [3.67%]; n.s., z = 1.84, BP tests).
-
Figure 6—source data 1
Hindimb, but not hindlimb-forelimb, coupling relationships are restored during post-spinal cord injury (SCI) silencing.
- https://cdn.elifesciences.org/articles/70058/elife-70058-fig6-data1-v2.xlsx
Figure 6—figure supplement 1
Animals excluded based on lack of behavioral outcomes pre-spinal cord injury (SCI) show no improvements in hindlimb coupling post-SCI.
N = 3 animals were excluded from post-injury group data based on the lack of behavioral phenotype at any timepoint during pre-injury silencing. No disruptions were seen in hindlimb-hindlimb (a, control hindlimbs: n = 5/160 [3.13%] vs. doxycycline (Dox) hindlimbs: n = 0/110 [0%]; n.s., z = 1.87), heterolateral hindlimb-forelimb (b: control heterolateral: n = 3/160 [1.88%] vs. Dox heterolateral: n = 3/110 [2.72%]; n.s., z = .45), homolateral hindlimb-forelimb (c; control homolateral: n = 2/160 [1.25%] vs. Dox homolateral: n = 3/110 [2.72%]; n.s., z = .83), or forelimb-forelimb (data not shown) phase values during silencing. Blue boxes indicate values outside of normal variability for the uninjured hindlimb pair mean > 2 standard deviations (SD). No changes were seen in relationships between swing time (d,g), stance time (e,h), or stride distance (f,i) prior to injury. Stride time and stride frequency have been omitted; however, no significant differences were observed. After SCI, improvements were not seen in hindlimb-hindlimb phase (j: control hindlimbs: n = 30/87 [34.48%] vs. Dox hindlimbs: n = 24/87 [27.57%]; n.s., z = 0.99) and similar disruptions in heterolateral hindlimb-forelimb (k: control heterolateral: n = 43/87 [49.42%] vs. Dox heterolateral: n = 38/87 [43.68%]; n.s., z = 0.76) and homolateral hindlimb-forelimb (l, control homolateral: n = 41/87 [47.12%] vs. Dox homolateral: n = 33/87 [37.93%]; n.s., z = 1.23) pairs were unchanged during silencing. Lack of improvement was seen in spatiotemporal measures during silencing (m–o, p–r). Control plantar steps = gray circles, Dox plantar steps = red circles. All dorsal steps are shown as teal circles.
-
Figure 6—figure supplement 1—source data 1
Animals excluded based on lack of phenotype.
- https://cdn.elifesciences.org/articles/70058/elife-70058-fig6-figsupp1-data1-v2.xlsx
Figure 7
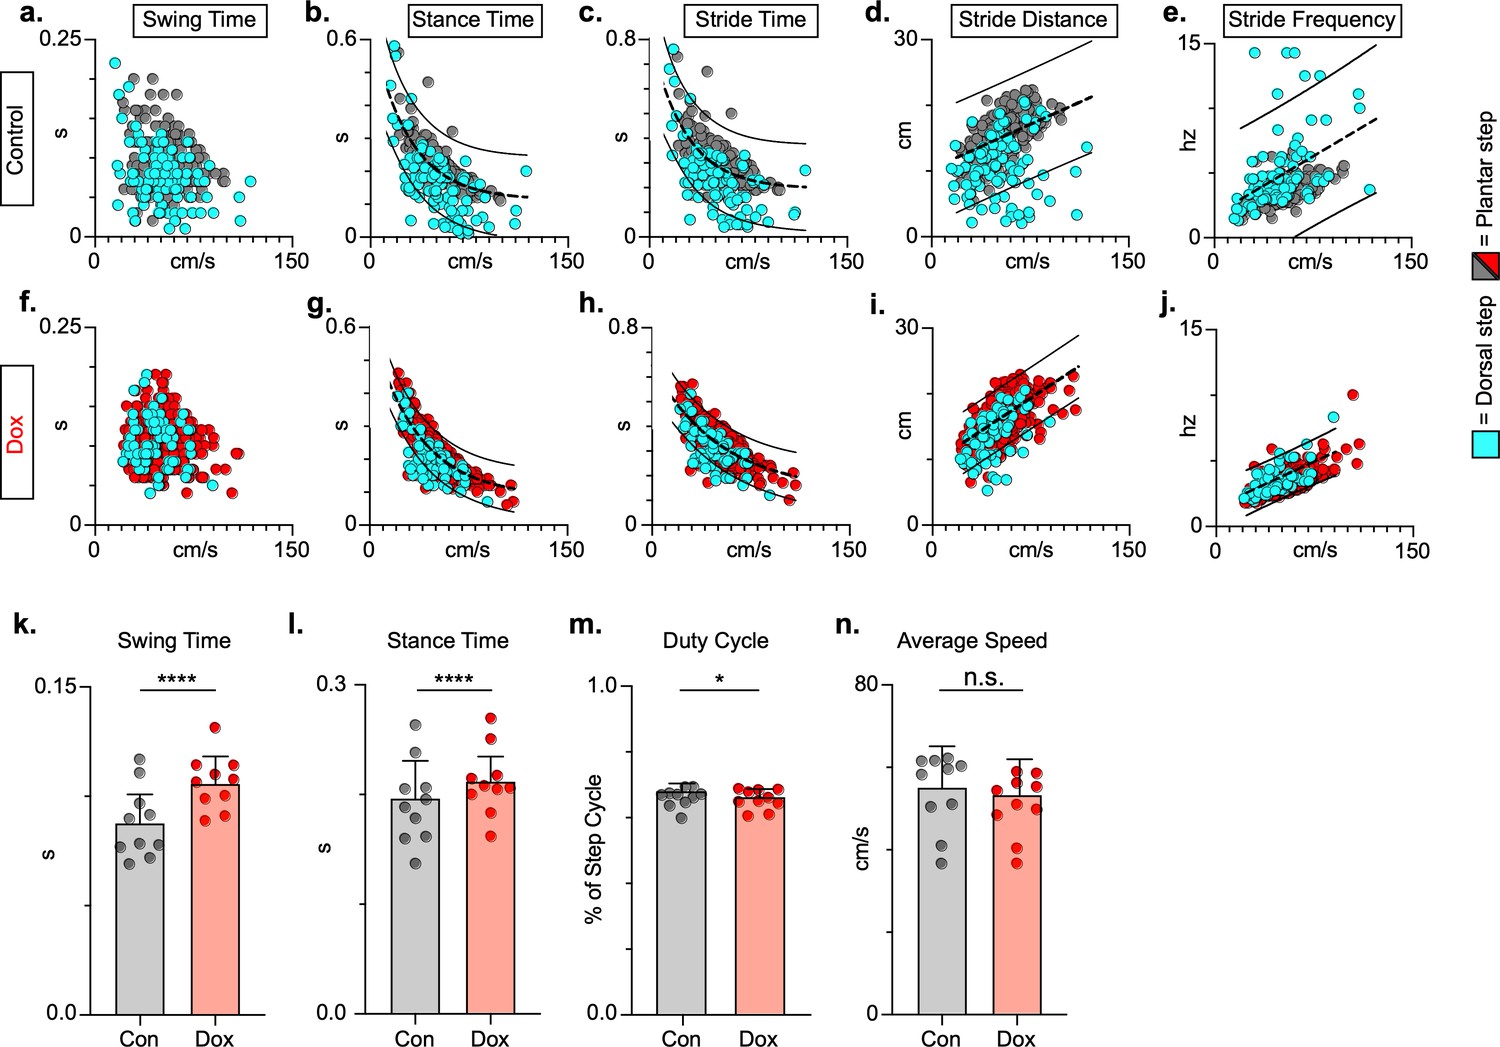
Key features of locomotion are improved following post-spinal cord injury (SCI) long ascending propriospinal neuron (LAPN) silencing.
Relationships between swing time, stance time, stride time, and stride distance are plotted against speed for control (a–e) and doxycycline (Dox) (f–j) timepoints. Dorsal steps are indicated with teal circles for both control and Dox, while plantar steps are indicated with either gray or red circles for control and Dox, respectively. An exponential decay line of best fit is displayed for stance time and stride time graphs, while a linear line of best fit is displayed for stride distance (dotted line indicates line of best fit; stance time: control R2 = 0.433 vs. Dox R2 = 0.656; stride time: control R2 = 0.351 vs. Dox R2 = 0.516; stride distance: control R2 = 0.124 vs. Dox R2 = 0.367). 95% prediction intervals are shown for lines of best fit as solid lines. Average swing time (k, control swing time: 0.087 ± 0.016 vs. Dox swing time: 0.106 ± 0.012, t = 7.062, df = 9, p < 0.001, paired t-test) and average stance time (l, control stance time: 0.196 ± .038 vs. Dox stance time: 0.213 ± 0.031, t = 4.994, df = 9, p = .001, paired t-test) are indicated with circles representing individual animal averages. The average duty cycle (stance time/stride time) (m, control duty cycle: 0.679 ± 0.028 vs. Dox duty cycle: 0.663 ± 0.030, t = 2.678, df = 9, p = 0.025, paired t-test, significant due to tightness of data) and average speed (n, control speed: 55.17 ± 9.20 vs. Dox speed: 52.70 ± 7.47, t = 1.789, df = 9, p = 0.107, paired t-test) are plotted for control (gray) and Dox (red) timepoints with averages indicated by bars. One standard deviation (SD) is shown.
-
Figure 7—source data 1
Key features of locomotion are improved following post-spinal cord injury (SCI) silencing.
- https://cdn.elifesciences.org/articles/70058/elife-70058-fig7-data1-v2.xlsx
Figure 8
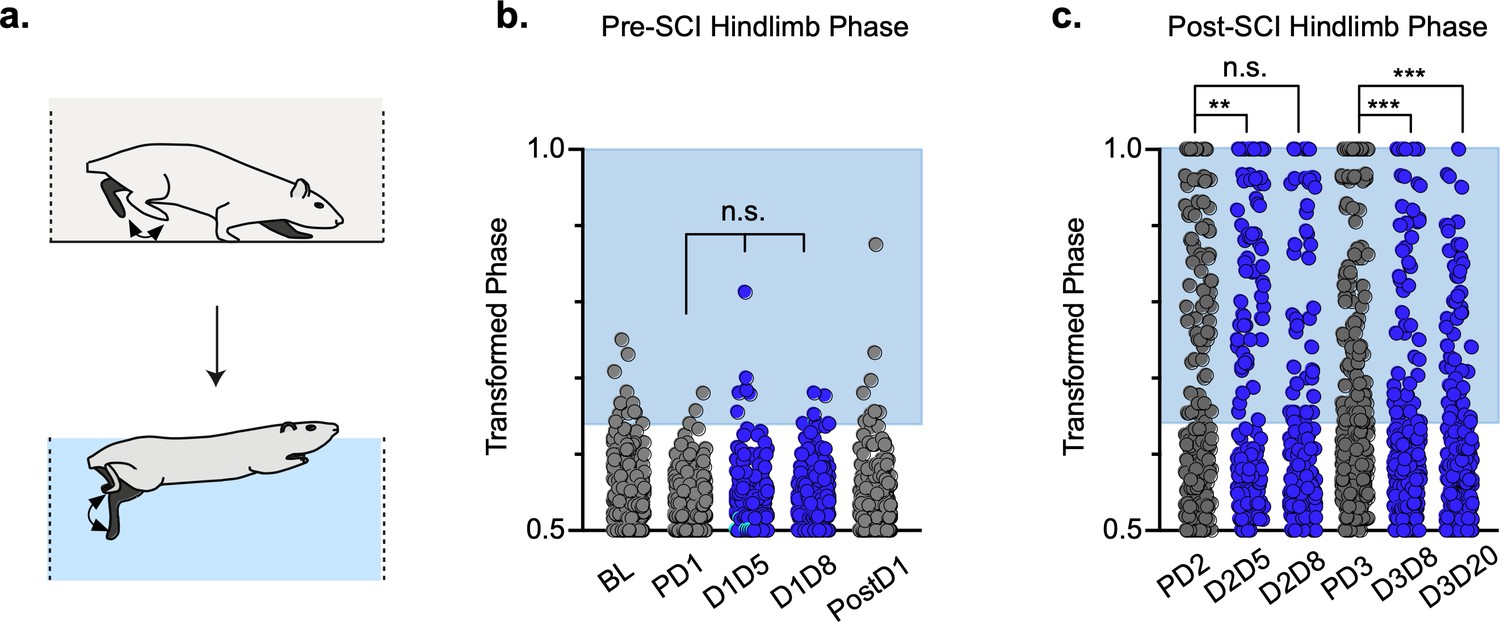
Interlimb coordination is improved during swimming.
Similar to hindlimb coordination during overground locomotion, phase can be calculated between the hindlimbs during a swimming task (a). Hindlimb alternation was maintained during silencing of long ascending propriospinal neurons (LAPNs) in the pre-spinal cord injury (SCI) swimming task (b, PD1 hindlimbs n = 3/294 [1.02%] vs. D1D5 hindlimbs n = 6/302 [1.99%]; n.s., z = 0.97; PD1 hindlimbs n = 3/294 [1.02%] vs. D1D8 hindlimbs n = 7/278 [2.52%]; n.s., z = 1.37; gray circles indicate control swim kicks, blue circles indicate doxycycline [Dox] swim kicks). Post-SCI hindlimb coordination was disrupted as a result of injury (c, dark gray circles) and was modestly improved as a result of silencing (c, blue circles; PD2 hindlimbs n = 77/188 [40.95%] vs. D2D5 hindlimbs n = 43/166 [25.90%]; p = .003, z = 2.99; PD2 hindlimbs n = 77/188 [40.95%] vs. D2D8 hindlimbs n = 73/178 [41.01%]; n.s., z = 0.01; PD3 hindlimbs n = 113/281 [40.21%] vs. D3D8 hindlimbs n = 57/245 [23.27%]; p < 0.001, z = 4.15; PD3 hindlimbs n = 113/281 [40.21%] vs. D3D20 hindlimbs n = 51/233 [21.89%]; p < 0.001, z = 4.44; binomial proportions test). Blue boxes indicate values outside of normal variability for the pre-injury hindlimb pair mean > 2 standard deviations (SD).
-
Figure 8—source data 1
Interlimb coordination is improved during swimming.
- https://cdn.elifesciences.org/articles/70058/elife-70058-fig8-data1-v2.xlsx
Videos
Video 1
Injured control example ‘bad’ pass from side camera view and ventral view (1× speed and 0.25× speed).
Video 2
Injured doxycycline (Dox) example ‘good’ pass from side camera view and ventral view (1× speed and 0.25× speed).
Tables
Key resources table
| Reagent type (species) or resource | Designation | Source or reference | Identifiers | Additional information |
|---|---|---|---|---|
| Strain, strain background (Rattus norvegicus, females) | Sprague-Dawley rats | Envigo | #002 (RRID:MGI:5651135) | 200–220 g, approximately 10–12 weeks of age |
| Antibody | Anti-GFP(rabbit polyclonal) | abcam | ab290 (RRID:AB_303395) | IHC (1:5,000) |
| Antibody | Anti-VGAT (goat polyclonal) | Frontier Institute | VGAT-Go-Af620 (RRID:AB_2571623) | IHC (1:100) |
| Antibody | Anti-VGlut1 (guinea pig polyclonal) | Synaptic Systems | 135–304 (RRID:AB_887878) | IHC (1:500) |
| Antibody | Anti-VGlut2 (guinea pig polyclonal) | Synaptic Systems | 135–404 (RRID:AB_887884) | IHC (1:250) |
| Antibody | Anti-synaptophysin (guinea pig polyclonal) | Synaptic Systems | 101–004 (RRID:AB_1210382) | IHC (1:750) |
| Other | Neurotrace 640/660 | Fisher Scientific | 2047616(RRID:AB_2572212) | IHC (1:50)Stain selective for Nissl substance. |
| Antibody | Anti-rabbit Alexa-Fluor Plus 488 (donkey polyclonal) | Invitrogen | A32790(RRID:AB_2762833) | IHC (1:400) |
| Antibody | Anti-guinea pig Alexa-Fluor 594 (donkey polyclonal) | Jackson ImmunoResearch | #706-585-148 (RRID:AB_2340474) | IHC (1:200) |
| Antibody | Donkey anti-goat Alexa-Fluor 647 (donkey polyclonal) | Jackson ImmunoResearch | #705-605-147 (RRID:AB_2340437) | IHC (1:200) |
| Genetic reagent (Rattus norvegicus, females) | HiRet-TRE-EGFP.eTeNT | Generous gift from Tadashi Isa | n/a | Intraspinal injections of 1.6 × 10⁷ vp/ml |
| Genetic reagent (Rattus norvegicus, females) | AAV2-CMV-rtTAV16 | Generous gift from Tadashi Isa | n/a | Intraspinal injections of 4.8 × 10¹² vp/ml |
| Genetic reagent (Rattus norvegicus, females) | HiRet-Cre | Generous gift from Zhigang He | n/a | Intraspinal injections of 1.6 × 10¹² vp/ml |
| Genetic reagent (Rattus norvegicus, females) | AAV2-CAG-FLEx-GFP | UNC Vector Core | Ed Boyden 100 μl – Control Vectors | Intraspinal injections of 3.5 × 10¹² vp/ml |
| Chemical compound, drug | Non-immune sera (rabbit IgG) | Jackson ImmunoResearch | #711-005-152 (RRID:AB_2340585) | IHC (1:5,000) |
| Chemical compound, drug | Sylgard | Dow Corning | Sylgard 184 Silicone Elastomer Kit | Applied to walkway chamber |
| Software, algorithm | SPSS | IBM | RRID:SCR_002865 | Version 22 |
| Software, algorithm | SigmaPlot | Systat | RRID:SCR_003210 | Version 11, used to generate polar plots |
| Software, algorithm | MaxTRAQ | Innovision Systems | n/a | Motion capture analysis |
| Software, algorithm | Matlab | Mathworks | Custom-written code to analyze laminar distribution | |
| Software, algorithm | Excel | Microsoft | Custom-written code to analyze gait |
Additional files
Download links
A two-part list of links to download the article, or parts of the article, in various formats.
Downloads (link to download the article as PDF)
Open citations (links to open the citations from this article in various online reference manager services)
Cite this article (links to download the citations from this article in formats compatible with various reference manager tools)
Silencing long ascending propriospinal neurons after spinal cord injury improves hindlimb stepping in the adult rat
eLife 10:e70058.
https://doi.org/10.7554/eLife.70058


