Modality-specific tracking of attention and sensory statistics in the human electrophysiological spectral exponent
- Max Planck UCL Centre for Computational Psychiatry and Ageing Research, Max Planck Institute for Human Development, Germany
- Center for Lifespan Psychology, Max Planck Institute for Human Development, Germany
- Department of Cognitive Science, University of California, San Diego, United States
- Eriksholm Research Centre, Oticon A/S, Denmark
- Neurosciences Graduate Program, University of California, San Diego, United States
- Halıcıoglu Data Science Institute, University of California, San Diego, United States
- Kavli Institute for Brain and Mind, University of California, San Diego, United States
- Department of Psychology, University of Lübeck, Germany
- Center of Brain, Behavior, and Metabolism, University of Lübeck, Germany
Figures
Figure 1 with 2 supplements
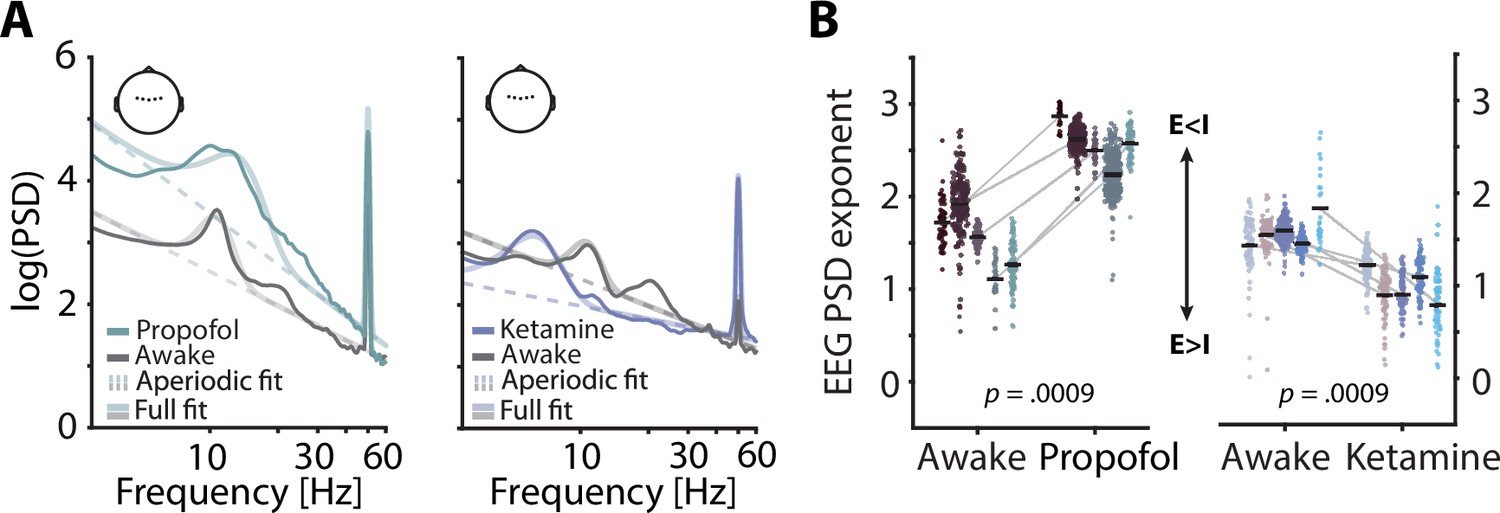
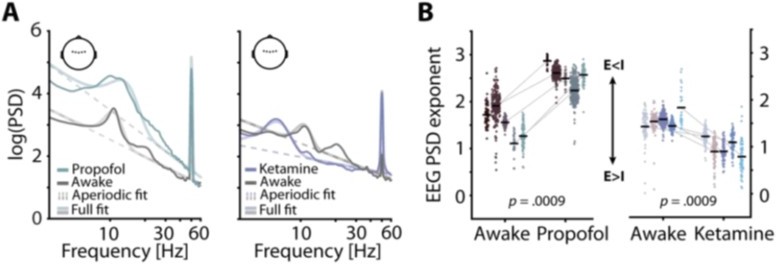
Electroencephalography (EEG) spectral exponents track anaesthesia-induced E:I changes.
(A) Normalized EEG spectra averaged across five subjects and five central electrodes (inset) displaying a contrast between rest and propofol (left) and ketamine anaesthesia (right). Spectral parameterization yielded aperiodic fits that estimated the spectral exponent (dashed lines) and full fits that included oscillatory spectral peaks (transparent lines). (B) Pairwise scatter plots depicting subject-wise averaged EEG spectral exponents during awake rest, propofol (left) and ketamine (right). Coloured dots represent spectral exponents of 5 s snippets, black horizontal bars single subject means. p-Values based on 1000 random permutations of data.
Figure 1—figure supplement 1
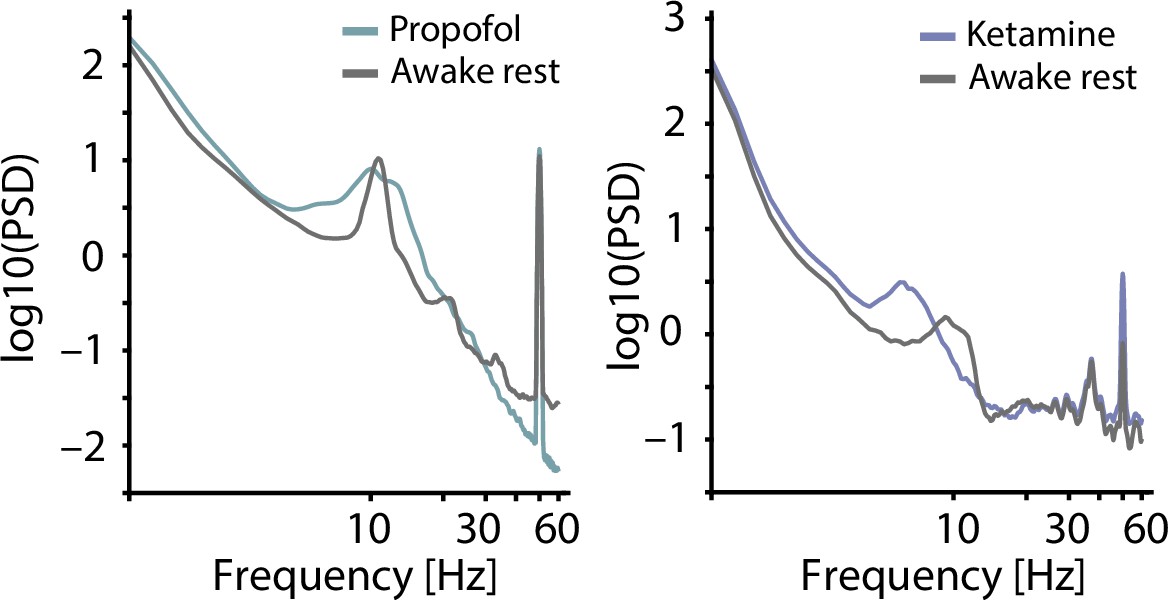
Raw EEG power spectra during awake rest, ketamine, and propofol anaesthesia.
Non-normalized EEG spectra averaged across five subjects and five central electrodes (inset) displaying a contrast between rest and propofol (left) and ketamine anaesthesia (right) with awake rest in grey. While propofol entails a steepened spectrum as compared to rest, ketamine is associated with spectral flattening.
Figure 1—figure supplement 2
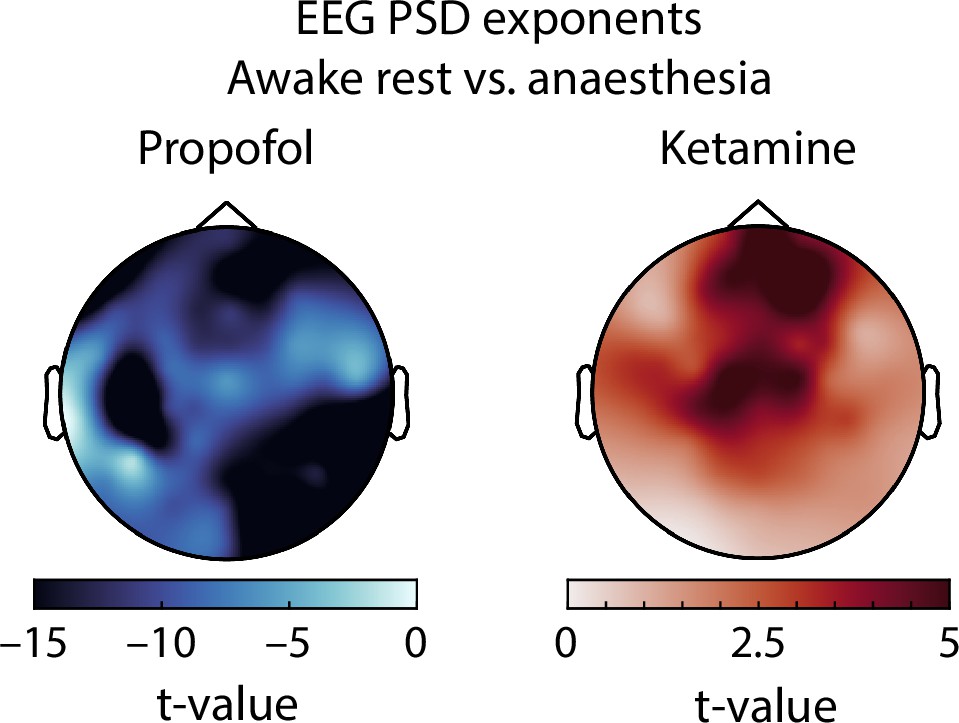
Topographically-resolved t-statistics comparing EEG spectral exponents between awake rest and different anaesthetics.
Propofol leads to a wide-spread increase in spectral exponents that is present across the entire scalp (left). Ketamine leads to a reduction in spectral exponents that is widely distributed but appears to peak at frontal and central electrodes (right).
Figure 2
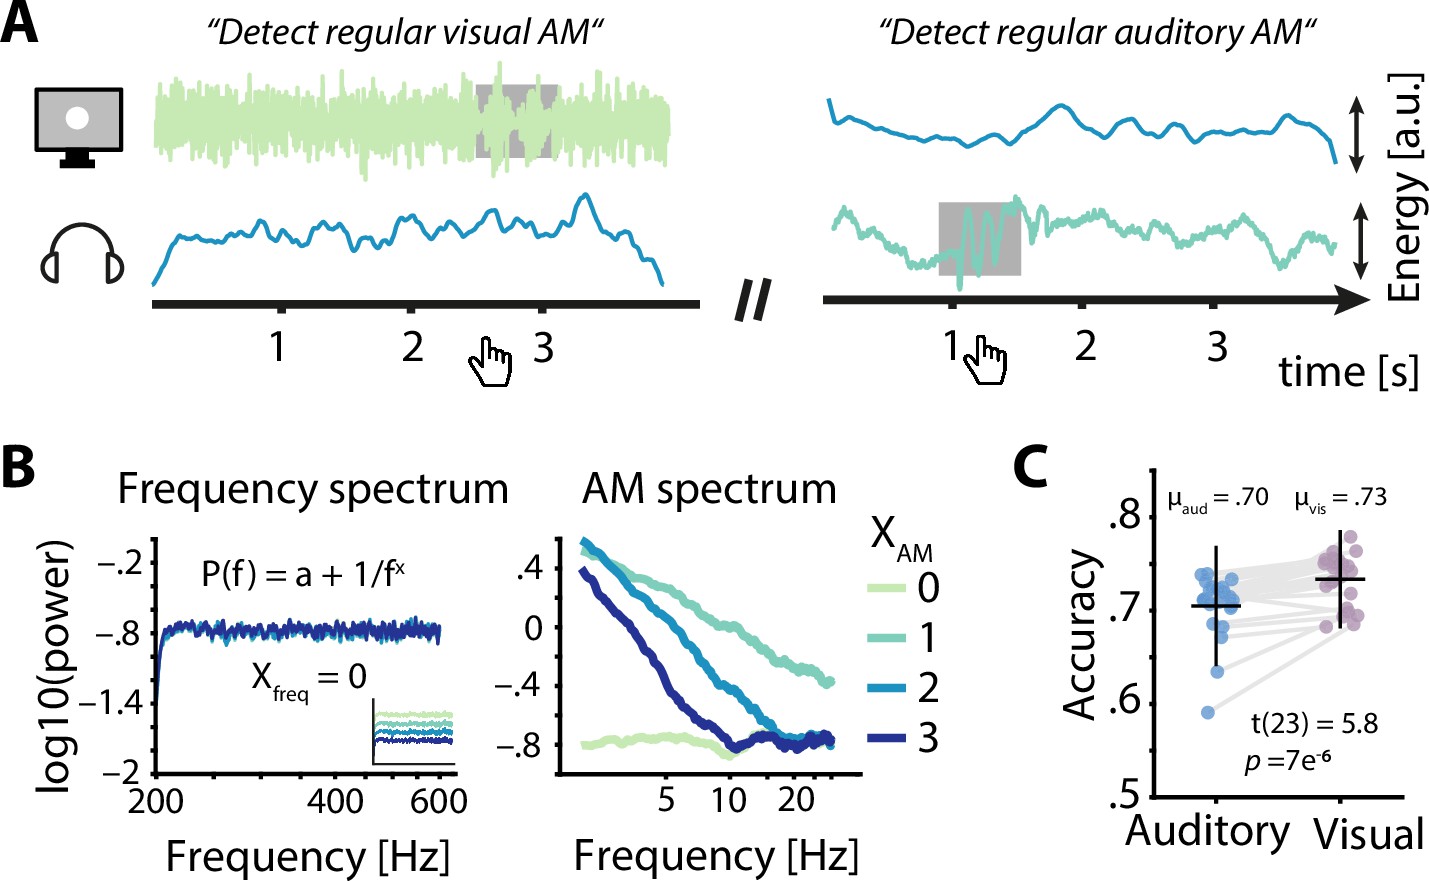
Task design and behavioural performance.
(A) Participants were simultaneously presented with auditory and visual amplitude modulated (AM) noise and had to detect periods of sinusoidal AM (grey box) in the luminance variations of a visually presented disk (left) or in auditory presented white noise (right) by pressing a button. Example visual stimuli correspond to spectral exponents of 0 (left) and 2 (right), auditory stimuli to spectral exponents of 2 (left) and 1 (right). (B) Frequency spectra for four sets of AM spectra (left) demonstrate the identical flat spectra (white noise), further visualized by artificially offset spectra in the inset. AM spectra displayed spectral exponents between 0 and 3 (right). (C) Auditory accuracy (70 %) was significantly lower than visual accuracy (73 %). Dots represent single subject data, horizontal lines the mean, and vertical lines ± one standard error.
Figure 3 with 1 supplement
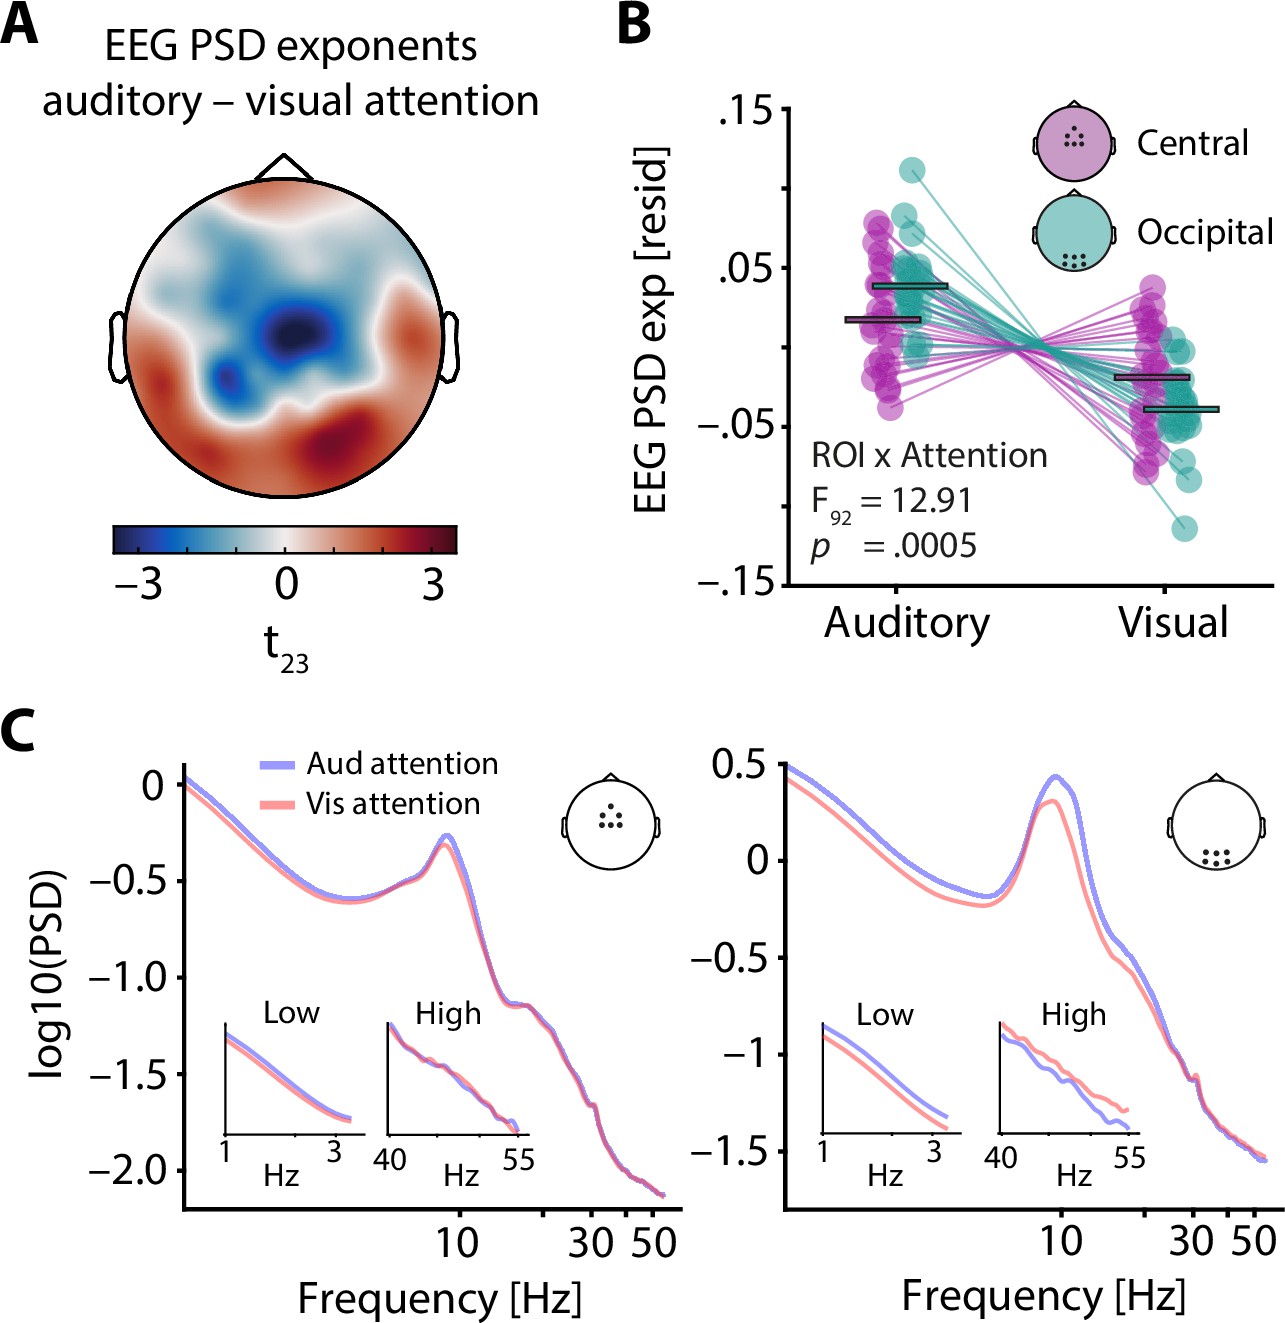
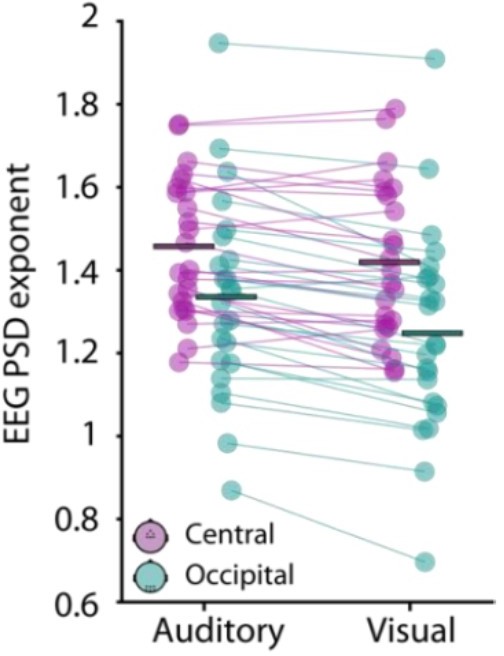
Electroencephalography (EEG) spectral exponents track the focus of selective attention.
(A) t-values of the average difference between EEG spectral exponents during auditory and visual attention. Note that exponents were controlled for neural alpha power and other confounding variables before subject-wise differences were calculated. A central negative and an occipital positive cluster are clearly visible. (B) Average central (lilac) and occipital EEG spectral exponents (teal) for auditory and visual attention (residuals shown). Horizontal bars denote the grand average. While visual attention as compared to auditory attention was associated with a decrease of spectral exponents at central and occipital sites, this decrease was more pronounced at occipital electrodes. This interaction of ROI × Attention is captured by the cross-over of lilac and teal lines. (C) Grand average spectra for auditory (blue) and visual attention (red), shown for a central (left) and an occipital ROI (right). Insets display enlarged versions of spectra for low and high frequencies, separately.
Figure 3—figure supplement 1
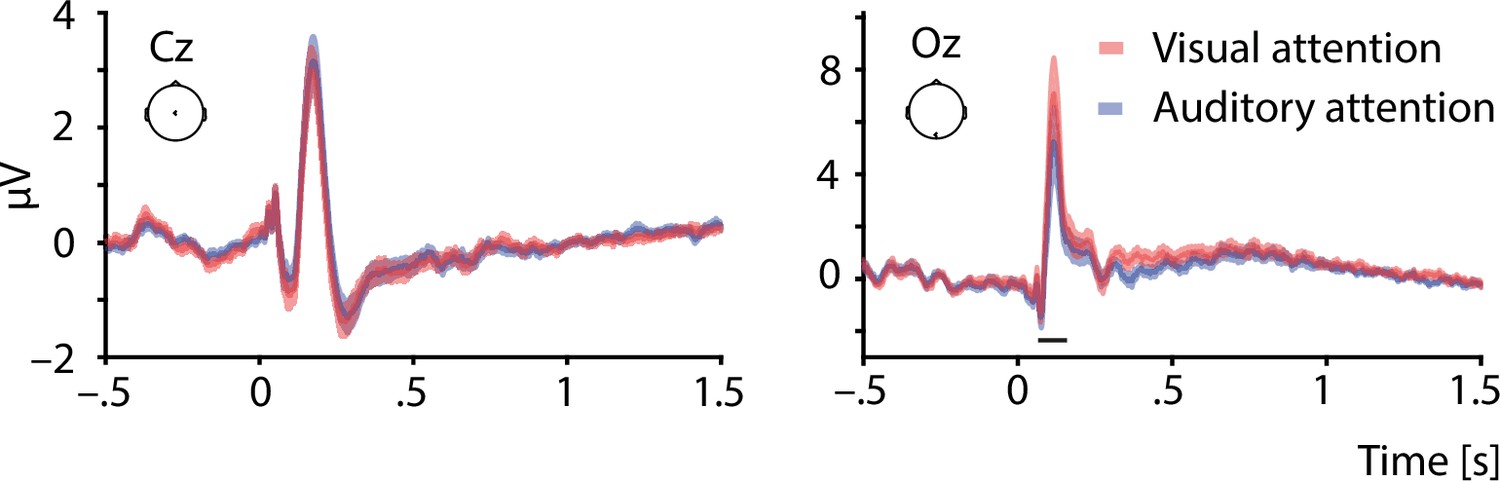
Evoked responses (ERPs) as a function of attentional focus.
Grand average noise onset ERPs (± standard error of the mean, SEM) at electrode Cz (left panel) and electrode Oz (right panel) for visual attention (red) and auditory attention (blue). ERPs are baseline corrected to 500 ms prior to noise onset. Visual attention entailed increased evoked responses at electrode Oz, indicated by the black horizontal line (pFDR <0.05).
Figure 4 with 7 supplements
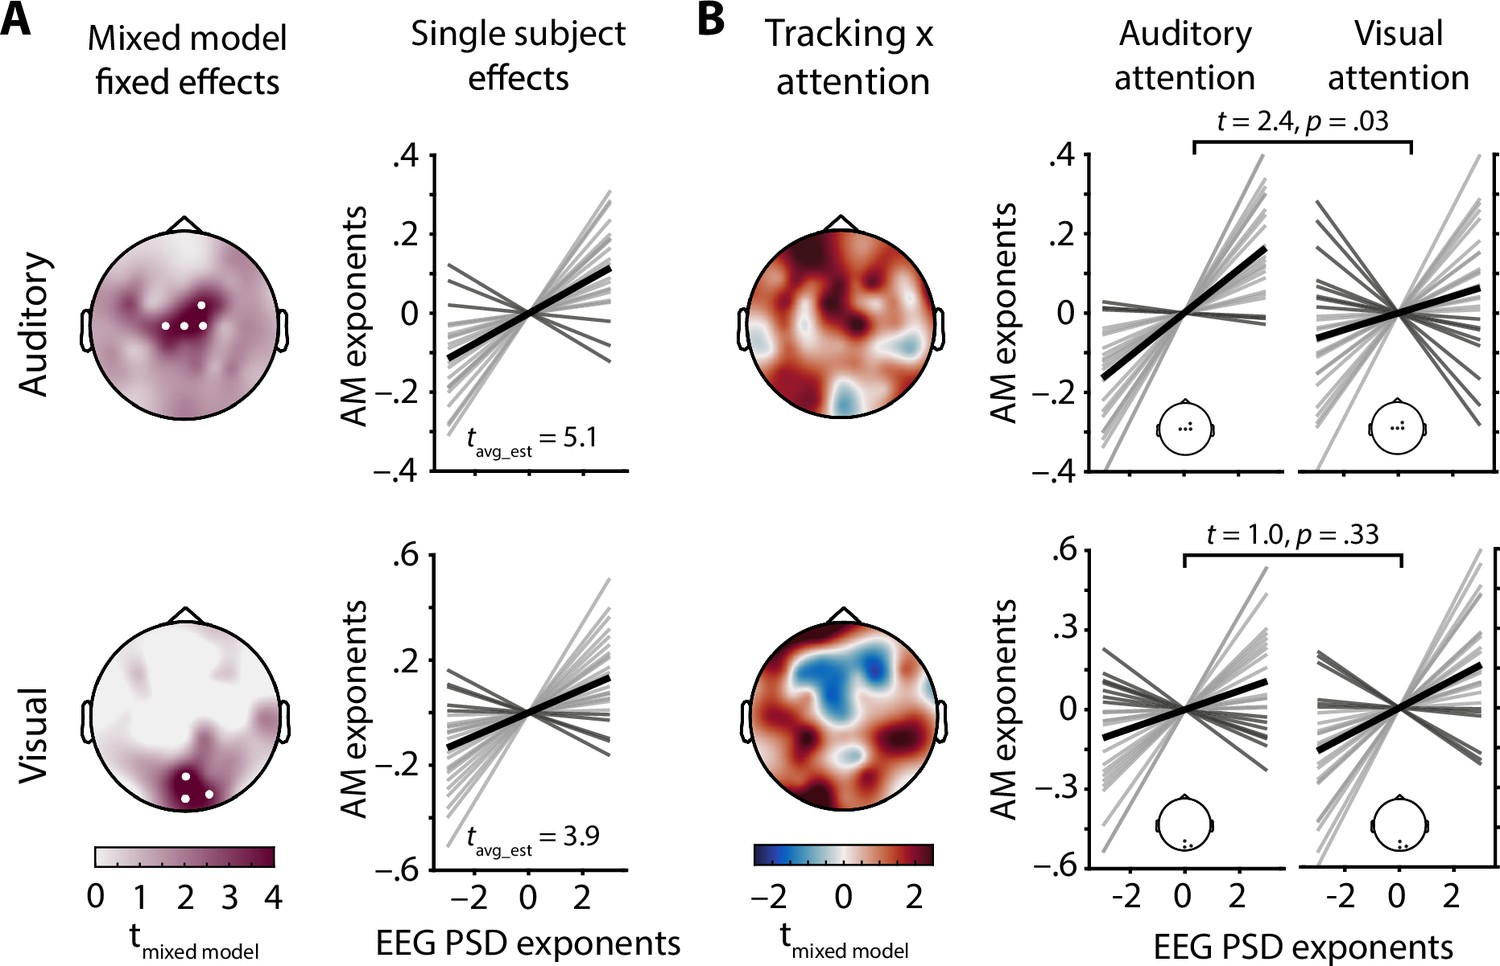
Electroencephalography (EEG) spectral exponents track stimulus spectral exponents.
(A) Topographies depict t-values for the main effect of stimulus spectral exponent, taken from a mixed model of EEG spectral exponents. White dots represent electrodes with significant effects after Bonferroni correction. Auditory stimulus tracking (upper row) clusters at central electrodes, visual stimulus tracking (lower row) at occipital electrodes. Line plots show single subject tracking estimates (standardized betas), dark grey lines represent negative betas, black lines the grand average. (B) Topographies show t-values for the interaction of attentional focus and stimulus spectral exponent, taken from the same mixed model as in A. Positive clusters appear over central (auditory) and occipital (visual) areas and represent improved tracking during selective attention to the modality in question. Line plots visualize single subject effects of selective attention on stimulus tracking for the clusters found in A (insets). Note that t-values for the auditory stimulus × attention interaction were inverted to remove the sign change caused by zero-centred effect coding of attentional focus. In this way, positive t-values represent evidence for an increase in stimulus tracking if attention is directed towards this modality.
Figure 4—figure supplement 1
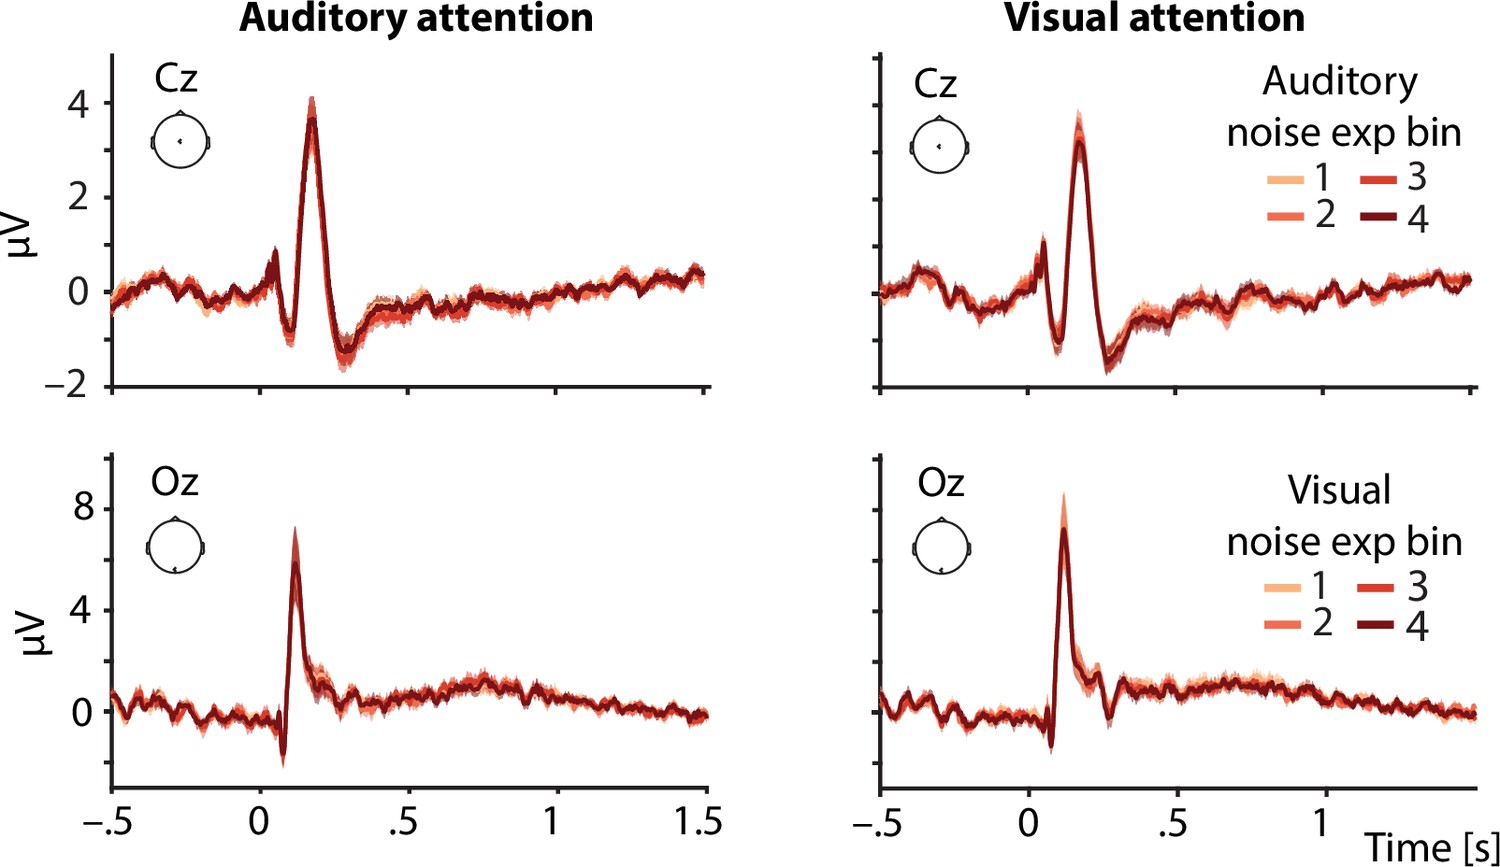
Evoked responses (ERPs) as a function of stimulus spectral exponents.
(A) Grand average noise onset ERPs (± standard error of the mean, SEM) at electrode Cz (upper panel) and electrode Oz (lower panel) for auditory attention (left column) and visual attention (right column). ERPs are baseline corrected to 500 ms prior to noise onset. Noise onset ERPs (± SEM) for four bins of increasing stimulus spectral exponents (from brighter to darker colours) did not differ significantly.
Figure 4—figure supplement 2
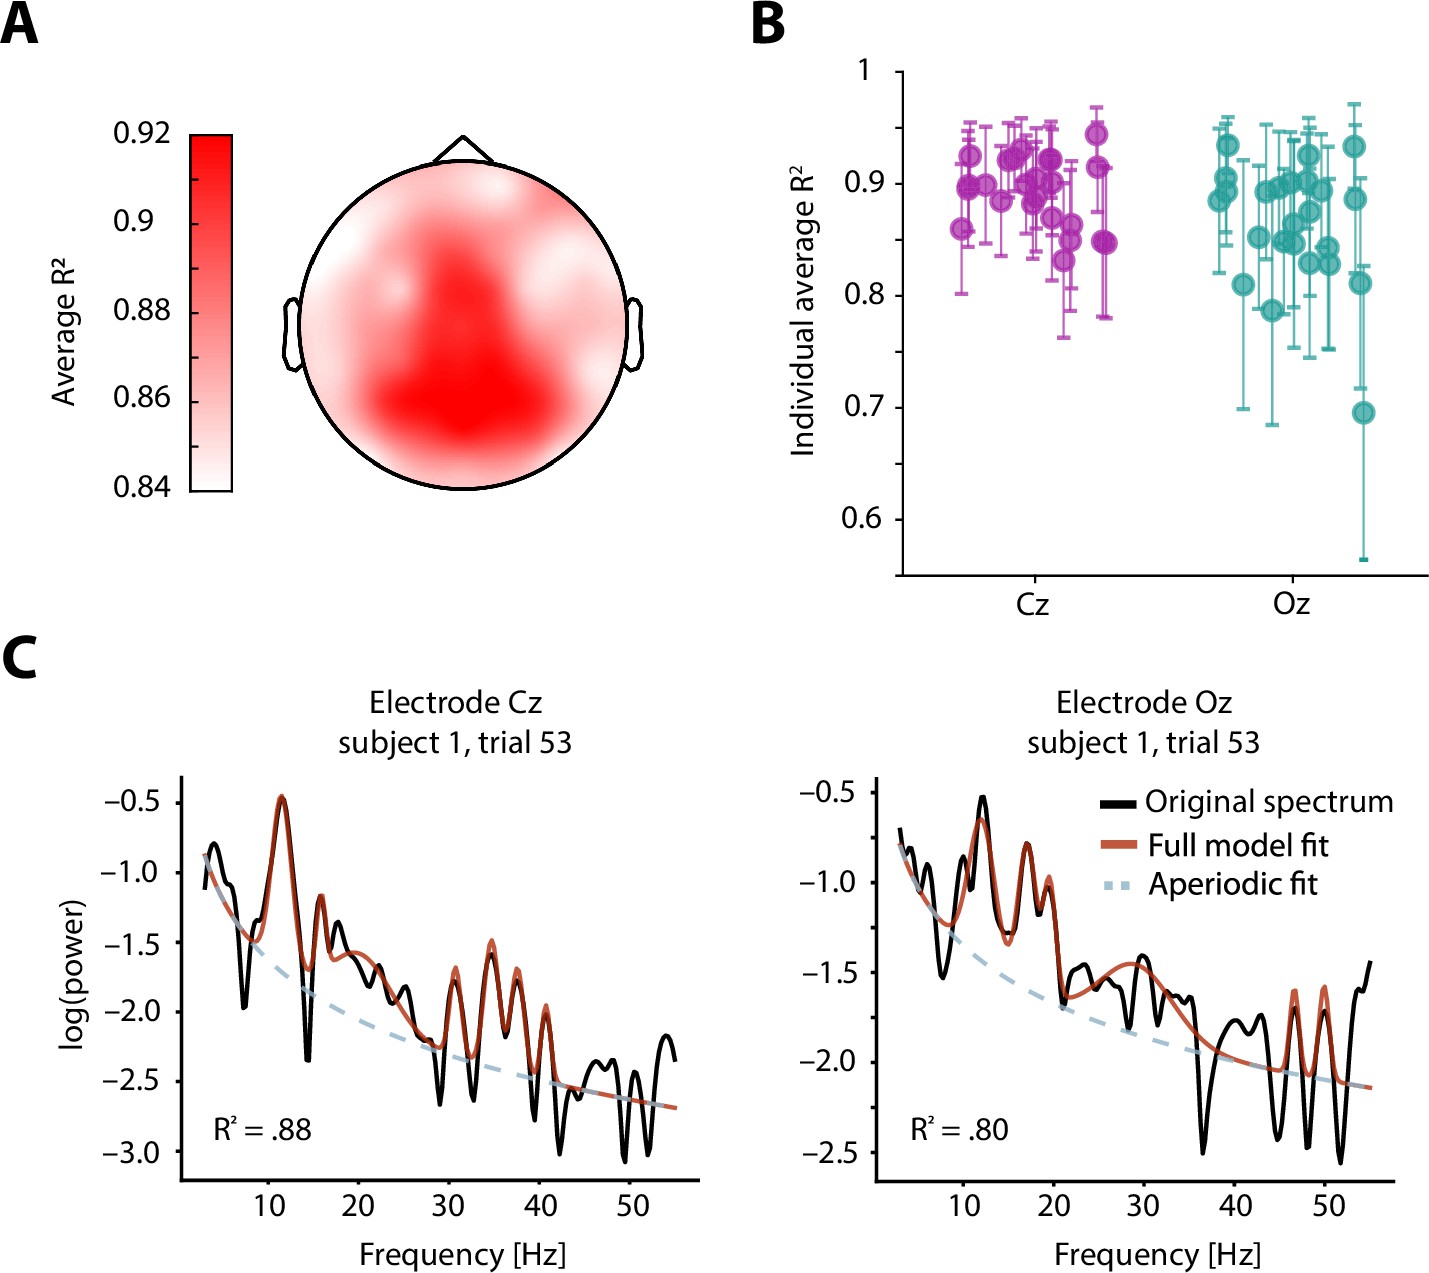
Trial-wise spectral parameterization fit statistics and examples.
(A) Topography of grand average R-squared values from parameterizing single subject EEG spectra. Despite the variation across electrodes, no electrode displayed fits below 0.84. (B) Single subject average (± SD) R-squared values for electrode Cz (left, liac) and electrode Oz (right, teal). (C) Representative example of a single trial parameterization result based on data from subject 1, trial 53.
Figure 4—figure supplement 3
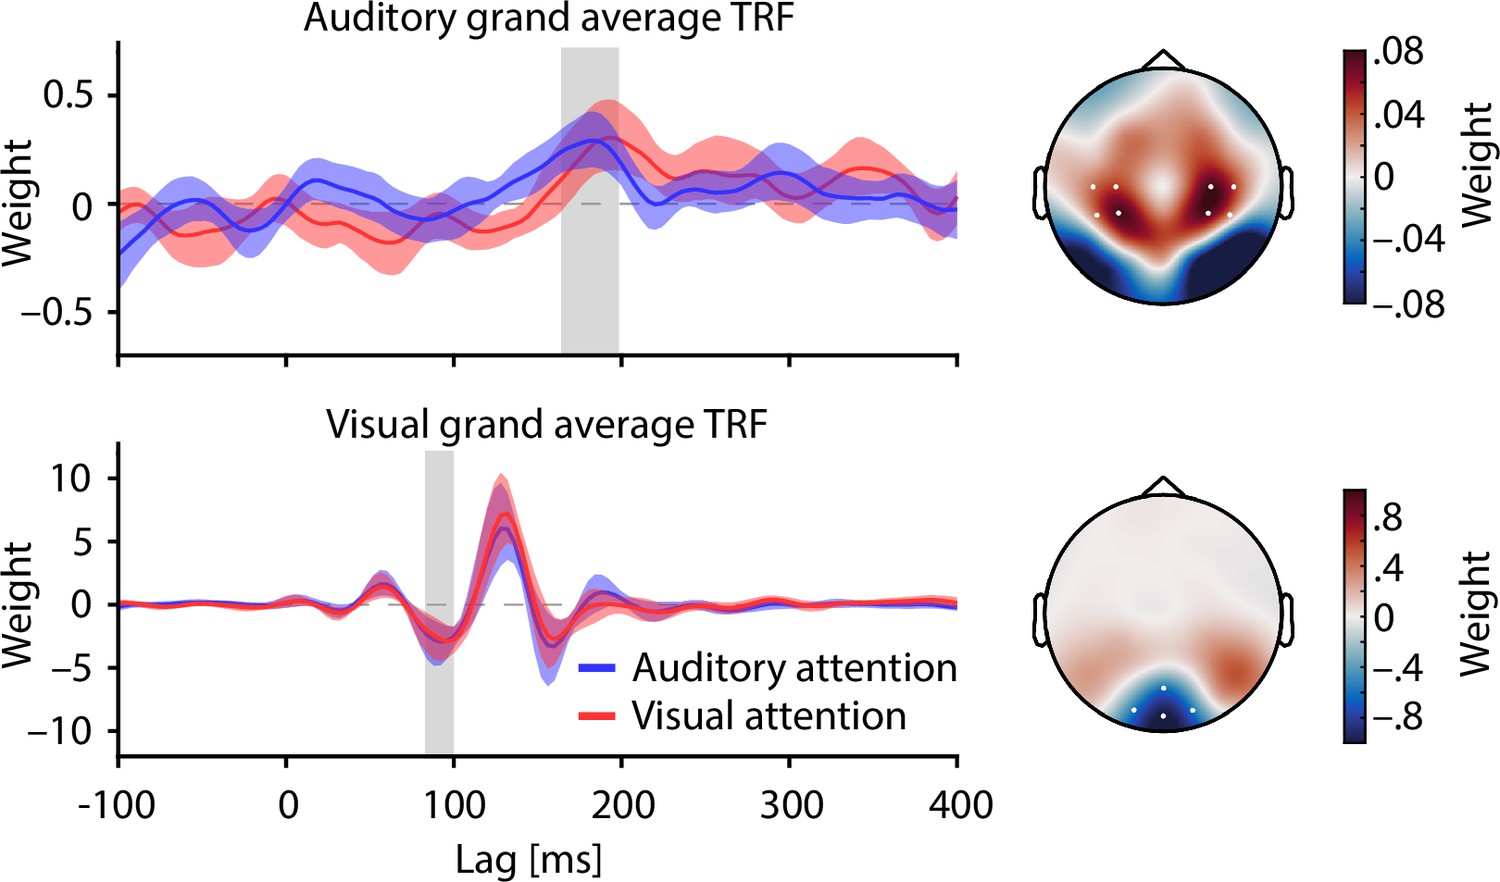
Grand average auditory (top) and visual (bottom) temporal response functions for auditory (blue) and visual attention (red).
Shaded areas depict bootstrapped 95% confidence intervals (CIs). Temporal response functions (TRFs) were averaged across the electrodes highlighted in the respective topographies. Topographies display weights averaged across time within periods denoted by grey rectangles. Positive lags imply the stimulus preceding the response in time.
Figure 4—figure supplement 4
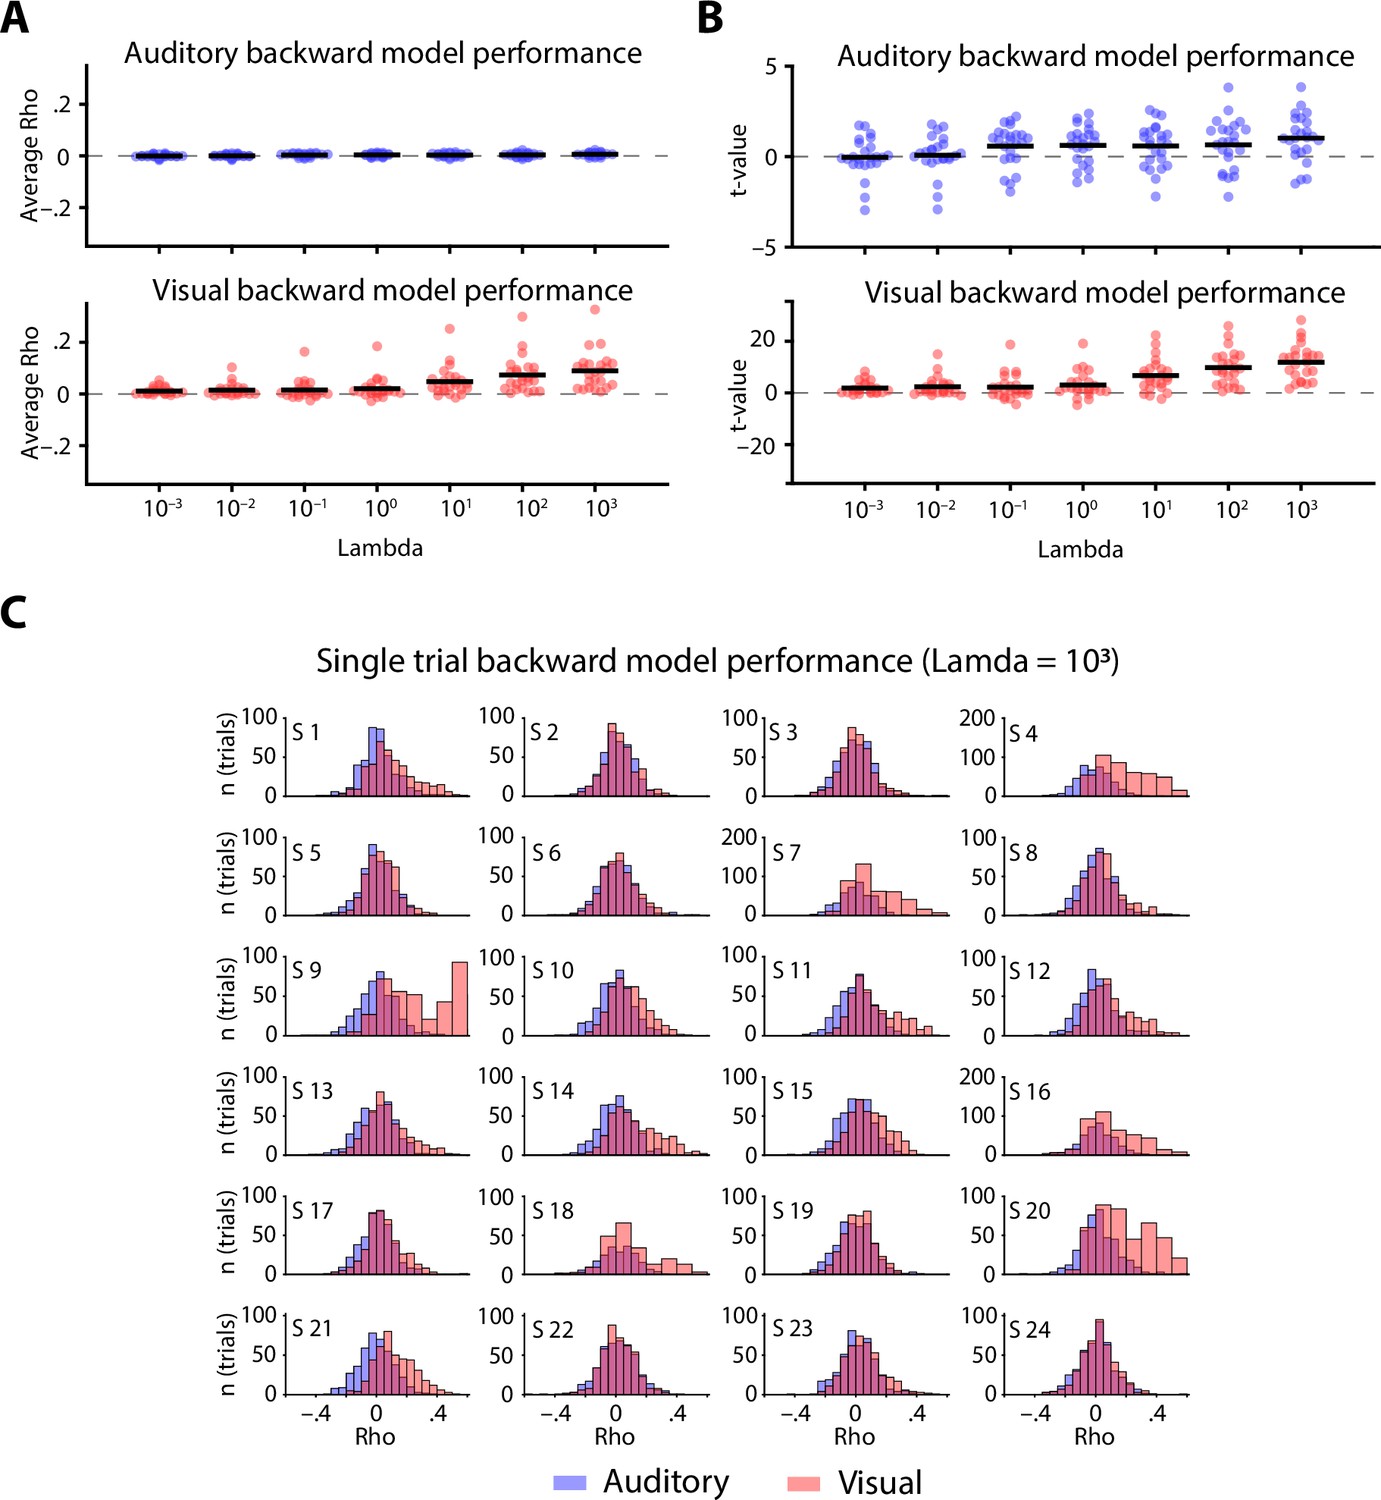
Overview of backward model performance.
(a) Auditory (blue) and visual (red) backward model performance expressed as the average correlation between predicted and observed stimulus time-series across different regularization parameters (Lambda). Dots represent individual Rhos, averaged across trials, horizontal lines denote the mean. (b) Individual t-values for auditory and visual backward model performance across different Lambdas, capturing the comparison of individual correlation distributions against zero. Note the difference in y-axes. (c) Subject-wise distributions of single trial correlations between predicted and observed stimuli for auditory (blue) and visual (red) stimuli at a Lambda of 103.
Figure 4—figure supplement 5
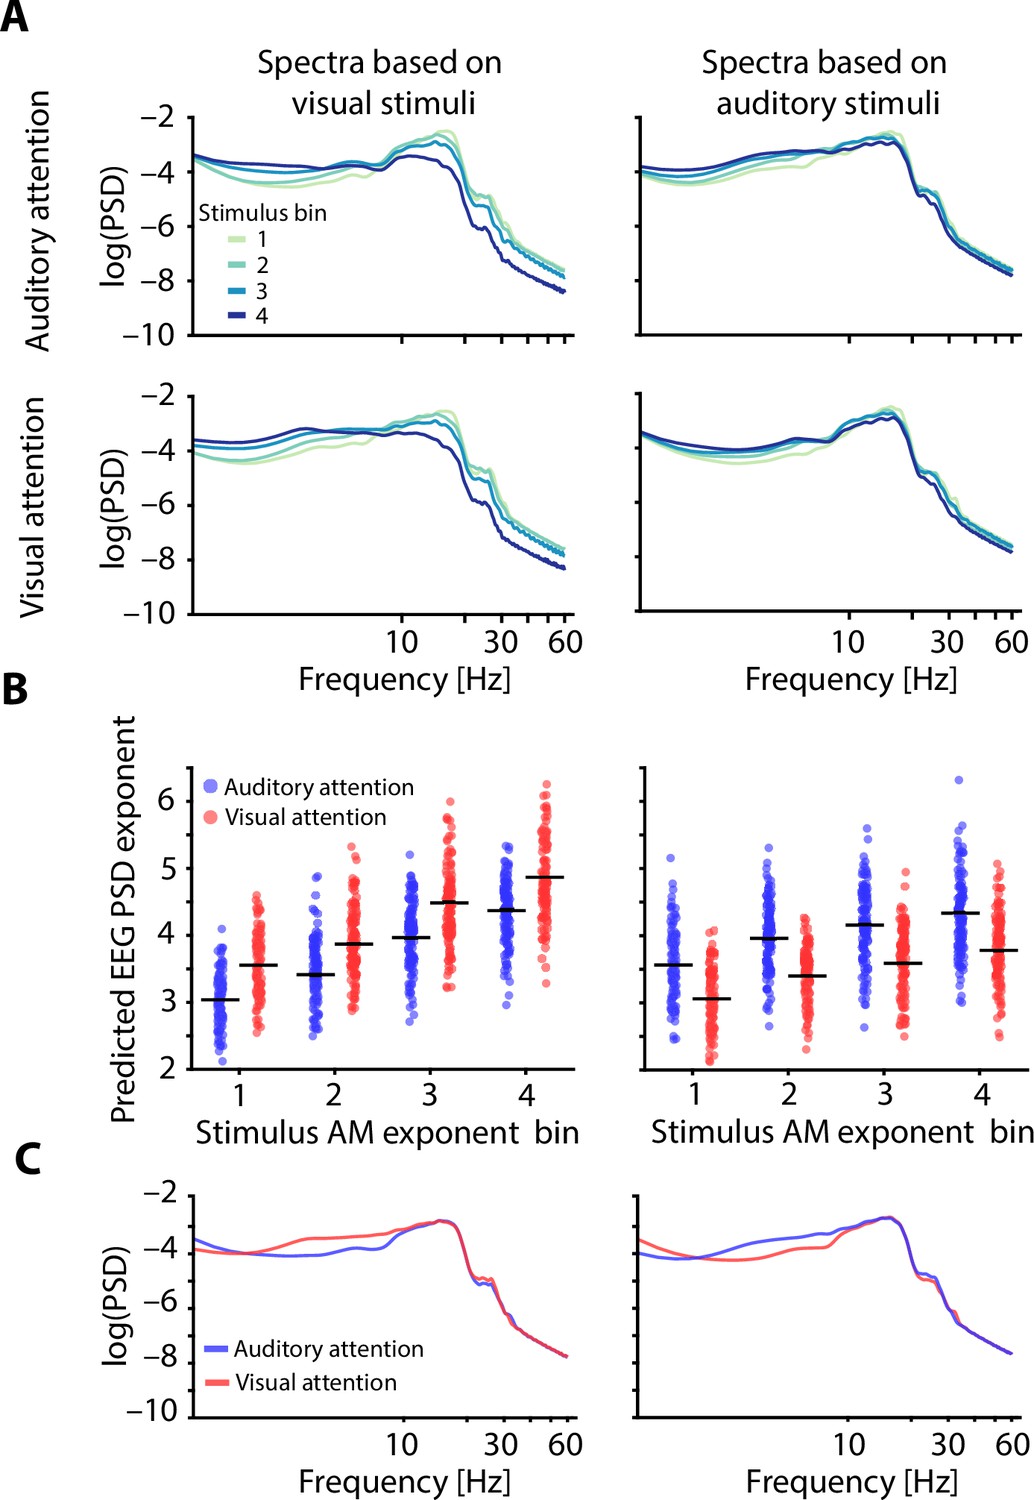
Predicted Electroencephalography (EEG) spectra.
(a) Power spectra of predicted EEG signals based on visual stimuli (left) and auditory stimuli (right). Separate predictions based on canonical temporal response functions (TRFs) of auditory attention (top) and visual attention (bottom). Spectra are averaged within four bins of increasing AM stimulus exponent. (b) Power spectral density (PSD) exponents of predicted spectra based on visual (left) and auditory stimuli (right) and for visual (red) and auditory attention (blue). Dots represent single trial estimates, horizontal lines denote across trial averages. Note the positive link between stimulus and EEG spectral exponent as well as the change of predicted EEG exponents with attentional focus. (c) Average power spectra of precited EEG, based on visual (left) and auditory stimuli (right), displayed for visual (red) and auditory attention (blue). Note that a match of predicting stimulus modality and attended modality results in a steepening of spectra.
Figure 4—figure supplement 6
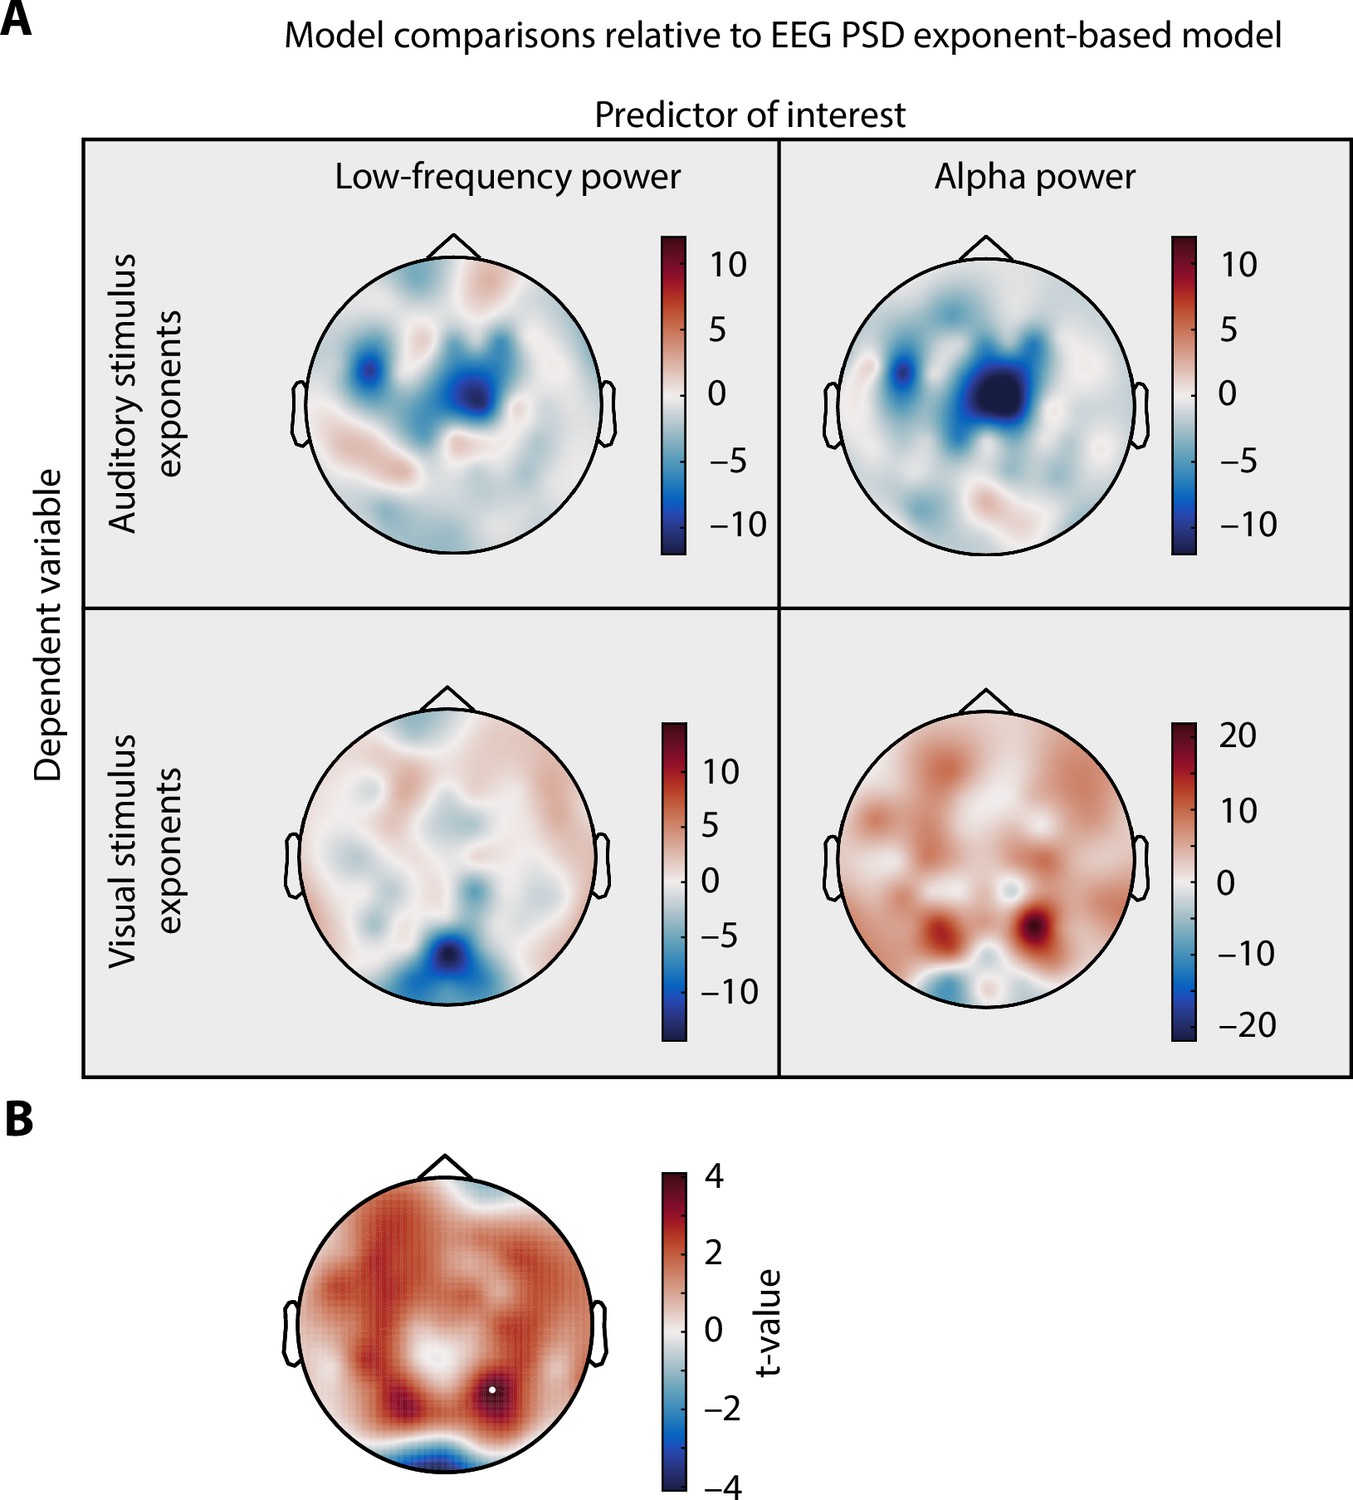
Model comparison topographies.
(a) Single trial auditory (upper row) or visual stimulus exponents (lower row) were modelled based on electrode-wise low-frequency power (left column) or alpha power (right) column, among other covariates. Models were compared to a model of same size that only differed in the main predictor that consisted of single trial electroencephalography (EEG) spectral exponents. Topographies display the likelihood ratio test statistic, illustrating no improvements in model fit compared to EEG spectral exponent-based models in all but one model family, illustrating the unique predictive power of aperiodic EEG activity in this context. Alpha power at one parietal electrode explained significantly more variance in visual stimulus exponents. (b) T-values representing the main effect of alpha power on visual stimulus exponents. Highlighted electrode represents p < 0.05 after false discovery rate (FDR) correction.
Figure 4—figure supplement 7
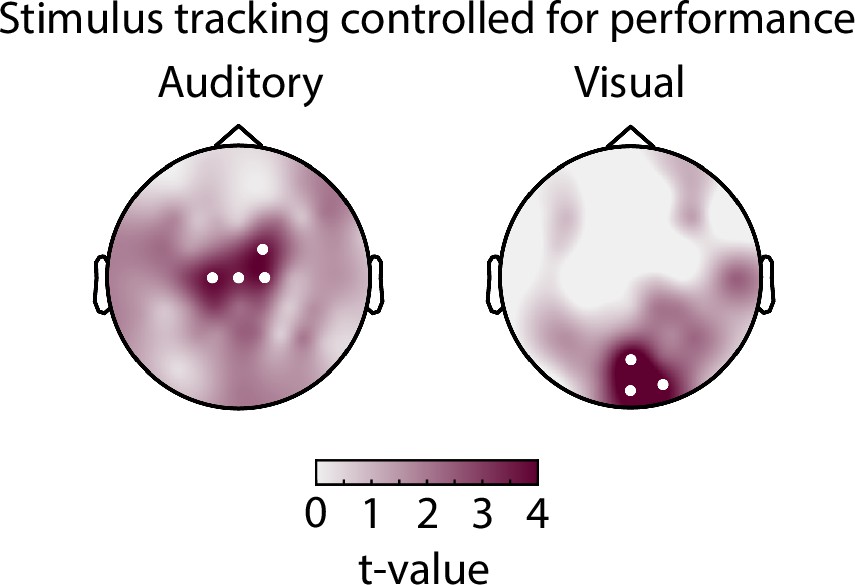
Mixed model results, controlling for single trial performance.
Topographies depict t-values for the main effect of stimulus spectral exponent, taken from a mixed model of EEG spectral exponents. White dots represent electrodes with significant effects after Bonferroni correction. Auditory stimulus tracking (left) clusters at central electrodes, visual stimulus tracking (right) ad occipital electrodes. Models were identical to tables in Supplementary files 1 and 2 but additionally included main effects of single trial accuracy and interactions with auditory and visual stimulus exponents, respectively.
Figure 5
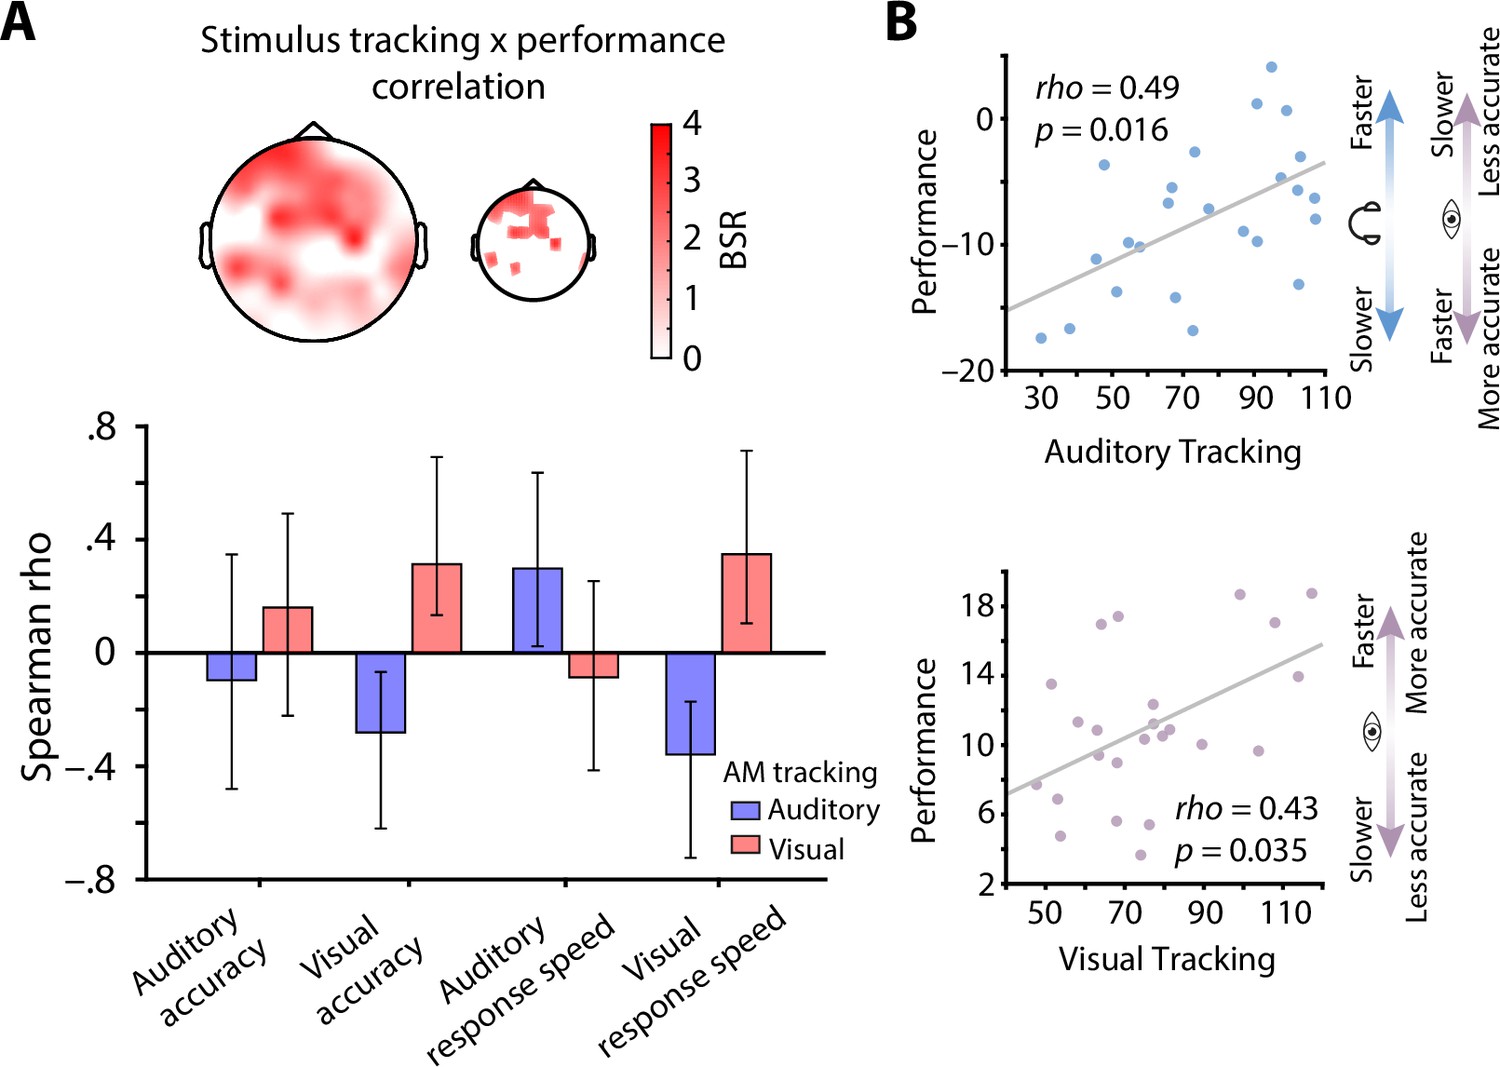
Stimulus tracking explains inter-individual differences in performance.
(A) Results of a multivariate neuro-behavioural correlation between stimulus tracking and performance using partial least squares analysis (PLS). The topography depicts bootstrap ratios (BSR) of the first latent variable and can be interpreted as z-values. Within the smaller topography, BSRs are thresholded at a BSR of 2 (p < 0.05). Bar graphs represent the correlation (Spearman rho) between auditory (blue) and visual stimulus tracking (red) with performance (accuracy as % correct and response speed; RS in s–1) in both modalities. Vertical lines denote 95 % bootstrapped confidence intervals. (B) Scatter plots of latent correlations between latent auditory (upper panel) and visual tracking (lower panel) with latent performance, respectively. Auditory stimulus tracking was positively linked with auditory performance but negatively linked with visual performance. Visual stimulus tracking was positively linked with visual performance. Headphones and eye symbolize auditory and visual performance, respectively.
Author response image 1
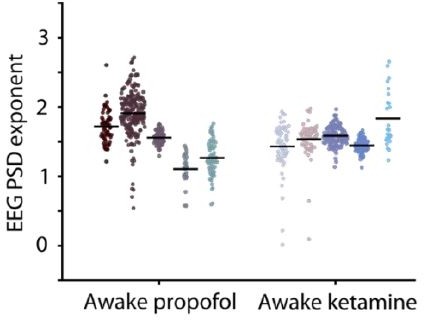
EEG PSD exponents do not significantly differ during awake rest.
EEG PSD exponents are shown for two groups of subjects, one that later received propofol and another that received ketamine anaesthesia. Single dots represent spectral exponents from 5 second long snippets, horizontal lines depict individual averages. Despite higher inter individual differences in the propofol group, no significant difference between these awake EEG PSD exponents of both groups was found (p = .75).
Author response image 2
EEG PSD exponents track anaesthesia-induced E:I changes.
(A) Normalized EEG spectra averaged across 5 subjects and 5 central electrodes (inset) displaying a contrast between rest and propofol (left) and ketamine anaesthesia (right). Spectral parameterization yielded aperiodic fits that estimated the spectral exponent (dashed lines) and full fits that included oscillatory spectral peaks (transparent lines). (B) Pairwise scatter plots depicting subject-wise averaged EEG PSD exponents during awake rest, propofol (left) and ketamine (right). Coloured dots represent PSDexponents of 5 s snippets, black horizontal bars single subject means. P-values are based on 1000 random permutations.
Author response image 3
Raw EEG spectral exponents change with attention.
As in figure 3A, but based on raw EEG spectral exponents instead of model residuals. Individual average exponents are depicted by dots, grand averages by horizontal lines. Coloured lines denote subject identity. Exponents are shown for auditory (left) and visual attention (right) and for a cluster of central (lilac) and occipital electrodes (teal).
Additional files
-
Transparent reporting form
- https://cdn.elifesciences.org/articles/70068/elife-70068-transrepform1-v2.pdf
-
Supplementary file 1
Stimulus tracking model electrode Cz.
- https://cdn.elifesciences.org/articles/70068/elife-70068-supp1-v2.docx
-
Supplementary file 2
Stimulus tracking model electrode Oz.
- https://cdn.elifesciences.org/articles/70068/elife-70068-supp2-v2.docx
Download links
A two-part list of links to download the article, or parts of the article, in various formats.
Downloads (link to download the article as PDF)
Open citations (links to open the citations from this article in various online reference manager services)
Cite this article (links to download the citations from this article in formats compatible with various reference manager tools)
Modality-specific tracking of attention and sensory statistics in the human electrophysiological spectral exponent
eLife 10:e70068.
https://doi.org/10.7554/eLife.70068


