mTORC1-induced retinal progenitor cell overproliferation leads to accelerated mitotic aging and degeneration of descendent Müller glia
- Department of Biological Sciences, Korea Advanced Institute of Science and Technology, Republic of Korea
- Department of Biochemistry, College of Life Science and Biotechnology, Yonsei University, Republic of Korea
- Department of Convergence Medicine, Asan Medical Center, University of Ulsan College of Medicine, Republic of Korea
- Department of Obesity and Internal Inflammation; Bioregulation and Pharmacological Medicine, Fukushima Medical University, Japan
- Institute of Molecular Genetics of the Czech Academy of Sciences, Czech Republic
Figures
Figure 1 with 4 supplements

MG degeneration and rosette formation in Tsc1fl/fl;Tyrp1-Cre mouse retina.
(A) Developmental changes of eye and retinal structures in Tsc1fl/+;Tyrp1-Cre and Tsc1fl/fl;Tyrp1-Cre littermate mice were examined by hematoxylin and eosin (H&E) staining of the eye sections. ONL, outer nuclear layer; OPL, outer plexiform layer; INL, inner nuclear layer; IPL, inner plexiform layer; GCL, ganglion cell layer. (B) The Cre-affected cells in the mouse retinas were visualized by R26EYFP Cre reporter, and mTORC1 activation of the cells was determined by immunostaining of pS6. Nuclei of the cells were visualized by DAPI staining. (C) Distributions of MG in the mouse retinas were examined by immunostaining of the MG markers, Sox9 and glutamine synthetase (GS). (D) Retinal cell type-specific marker-positive cells among DAPI-positive total retinal cells in 350 μm × 350 μm areas were counted and shown their relative values against those of Tsc1fl/+;Tyrp1-Cre mouse retinas in the graph. Representative staining images of retinal markers are provided in (C) and Figure 1—figure supplement 2A. Error bars denote standard deviations (SD). The numbers of samples are 5 from five independent litters. **p < 0.01; ***p < 0.001; ****p < 0.0001.
Figure 1—figure supplement 1
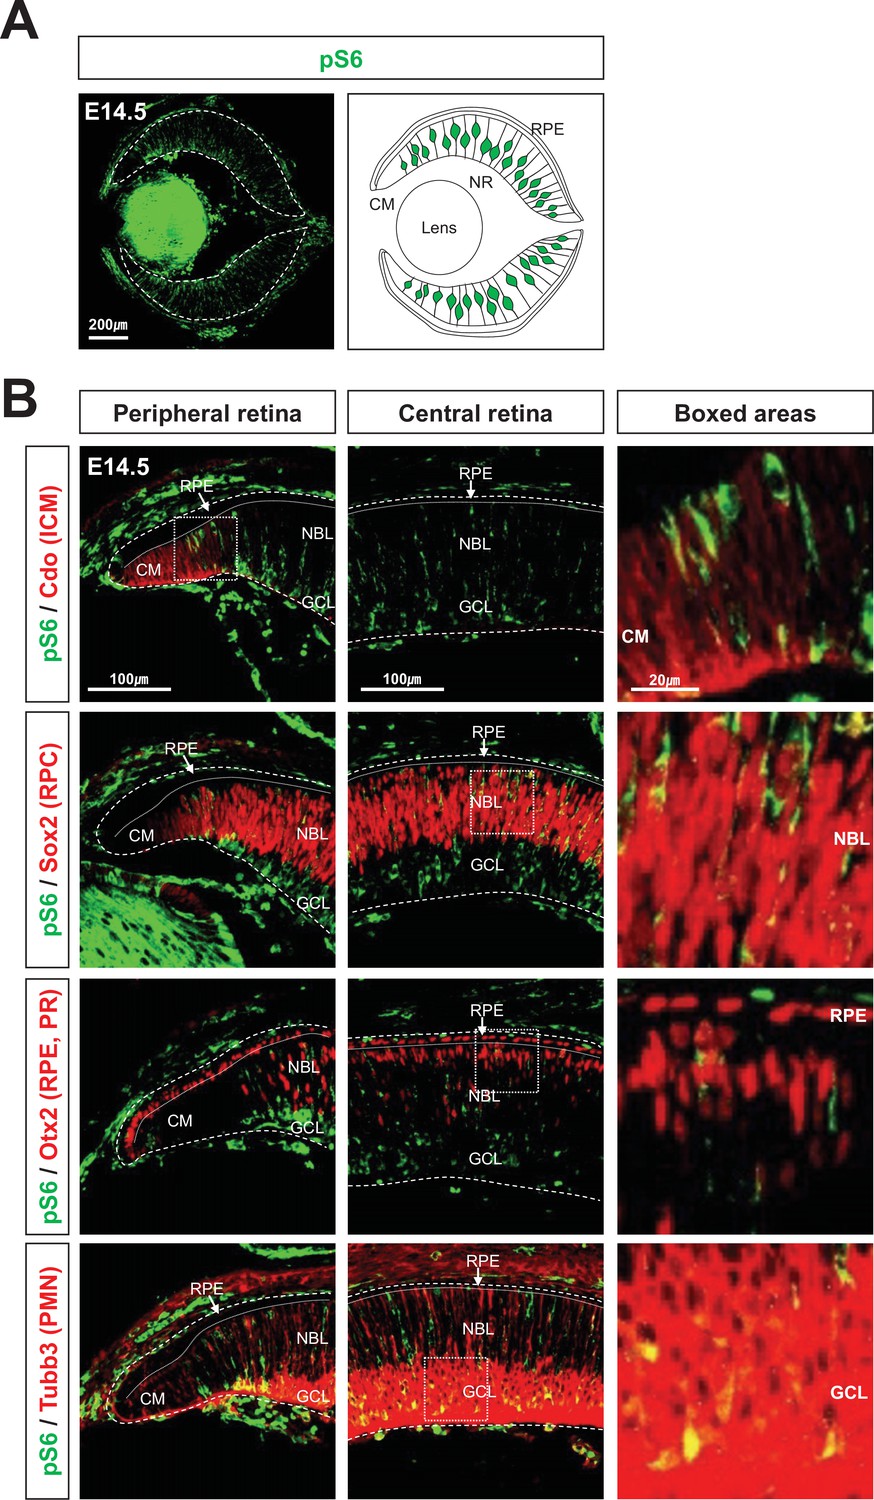
Spatially restricted mTORC1 activation in developing mouse eyes.
(A) The eye section image of E14.5 mouse embryo, which was stained with anti-pS6 antibody (left), and the drawing that shows the distribution of pS6-positive cells in the eye section. (B) Identities of pS6-positive cells were determined by co-immunostaining of pS6 with Cdo (a marker for ciliary margin [CM] cells), Sox2 (a marker for retinal progenitor cell [RPC]), Otx2 (a marker for retinal pigment epithelium [RPE] and photoreceptor [PR] in the retina), or Tubb3 (tubulin βIII, a marker for post-mitotic neurons). NBL, neuroblast layer; GCL, ganglion cell layer.
Figure 1—figure supplement 2
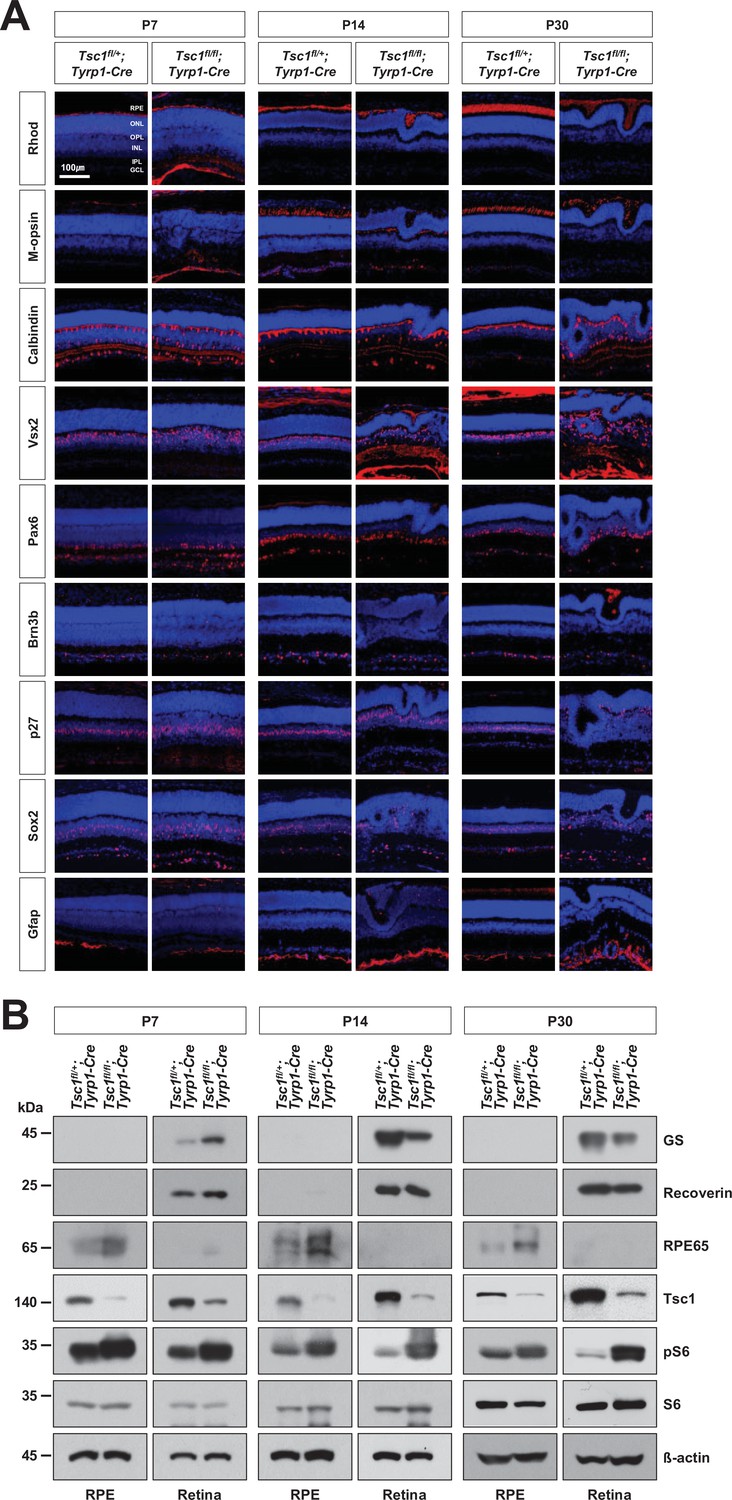
Cell composition of Tsc1fl/+;Tyrp1-Cre and Tsc1fl/fl;Tyrp1-Cre mouse retinas.
Cell composition of Tsc1fl/fl;Tyrp1-Cre and Tsc1fl/fl;Tyrp1-Cre littermate mouse retinas at the indicated ages were investigated by immunostaining of Rhodopsin (Rhod, a marker for rod photoreceptor [rPR]), M-opsin (a marker for cone photoreceptor [cPR]), Calbindin (a marker for horizontal cells [HC] [signals at the OPL] and amacrine cell [AC] subset [signals in the IPL]), Vsx2 (a maker for bipolar cells [BC]), Pax6 (a marker for AC), Brn3b (a marker for retinal ganglion cell [RGC]), p27 (a marker for MG), Sox2 (a marker for MG [signals in the middle IPL] and AC subset [signals in the lower IPL]), and glial fibrillary acidic protein (Gfap, a marker for astrocyte) in the retinal sessions. Quantification data are provided in Figure 1D. (B) Relative levels of glutamine synthetase (GS), Recoverin, and retinal pigment epithelium (RPE)65 proteins in the retinal and RPE lysates were determined by Western blot (WB). The levels of mTORC1 pathway components (Tsc1, pS6, and S6) in the retinal and RPE lysates were also examined by WB. Relative amounts of proteins in each sample were determined by WB detection of β-actin.
Figure 1—figure supplement 3
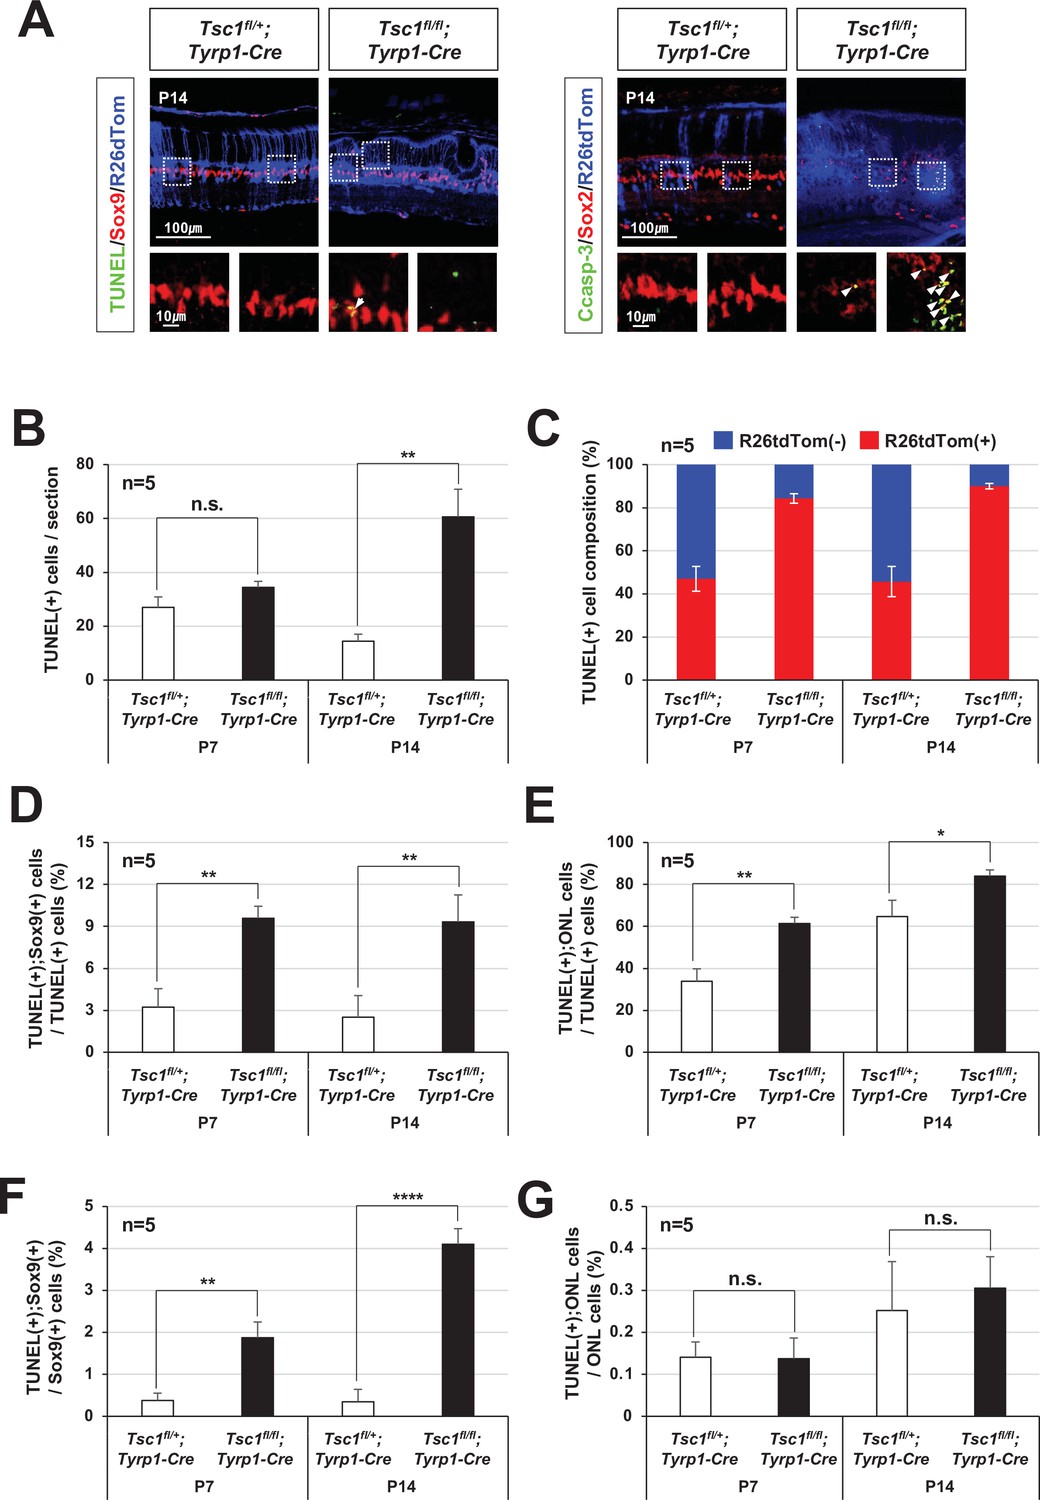
Apoptotic cell death of tuberous sclerosis complex 1 (Tsc1)-deficient MG.
(A) Distributions of apoptotic cells, which are positive to terminal deoxynucleotidyl transferase dUTP nick end labeling (TUNEL) and activated caspase-3 (Casp-3), in P14 Tsc1fl/fl;Tyrp1-Cre and Tsc1fl/fl;Tyrp1-Cre littermate mouse retinas were investigated by immunostaining. MG identity of the apoptotic cells was determined by co-immunostaining of a MG marker, Sox2 or Sox9, and Tsc1-deficiency of the cells were assessed by R26tdTom Cre reporter expression. Outset images are magnified versions of boxed areas in the images on top row. (B) Numbers of TUNEL-positive apoptotic cells in P7 and P14 Tsc1fl/fl;Tyrp1-Cre and Tsc1fl/fl;Tyrp1-Cre littermate mouse retinal sections were counted and shown in the graph. (C) Cre-affected R26tdTom(+) and Cre-unaffected R26tdTom(-) cell populations among TUNEL-positive apoptotic cells were shown in the graph. (D) TUNEL;Sox9-positive MG population among total TUNEL-positive apoptotic cells were shown in the graph. (E) TUNEL-positive cells in the ONL, which are composed of photoreceptors (PRs), among total TUNEL-positive apoptotic cells in the retinal sections were shown in the graph. (F) Sox9;TUNEL-positive apoptotic MG population among total MG were shown in the graph. (G) TUNEL-positive apoptotic ONL cell population among total ONL cells were shown in the graph. Error bars in all these graphs are SD (n = 5, 4 independent litters). *p < 0.05; **p < 0.01; ***p < 0.001; ****p < 0.0001; n.s., not significant.
Figure 1—figure supplement 4
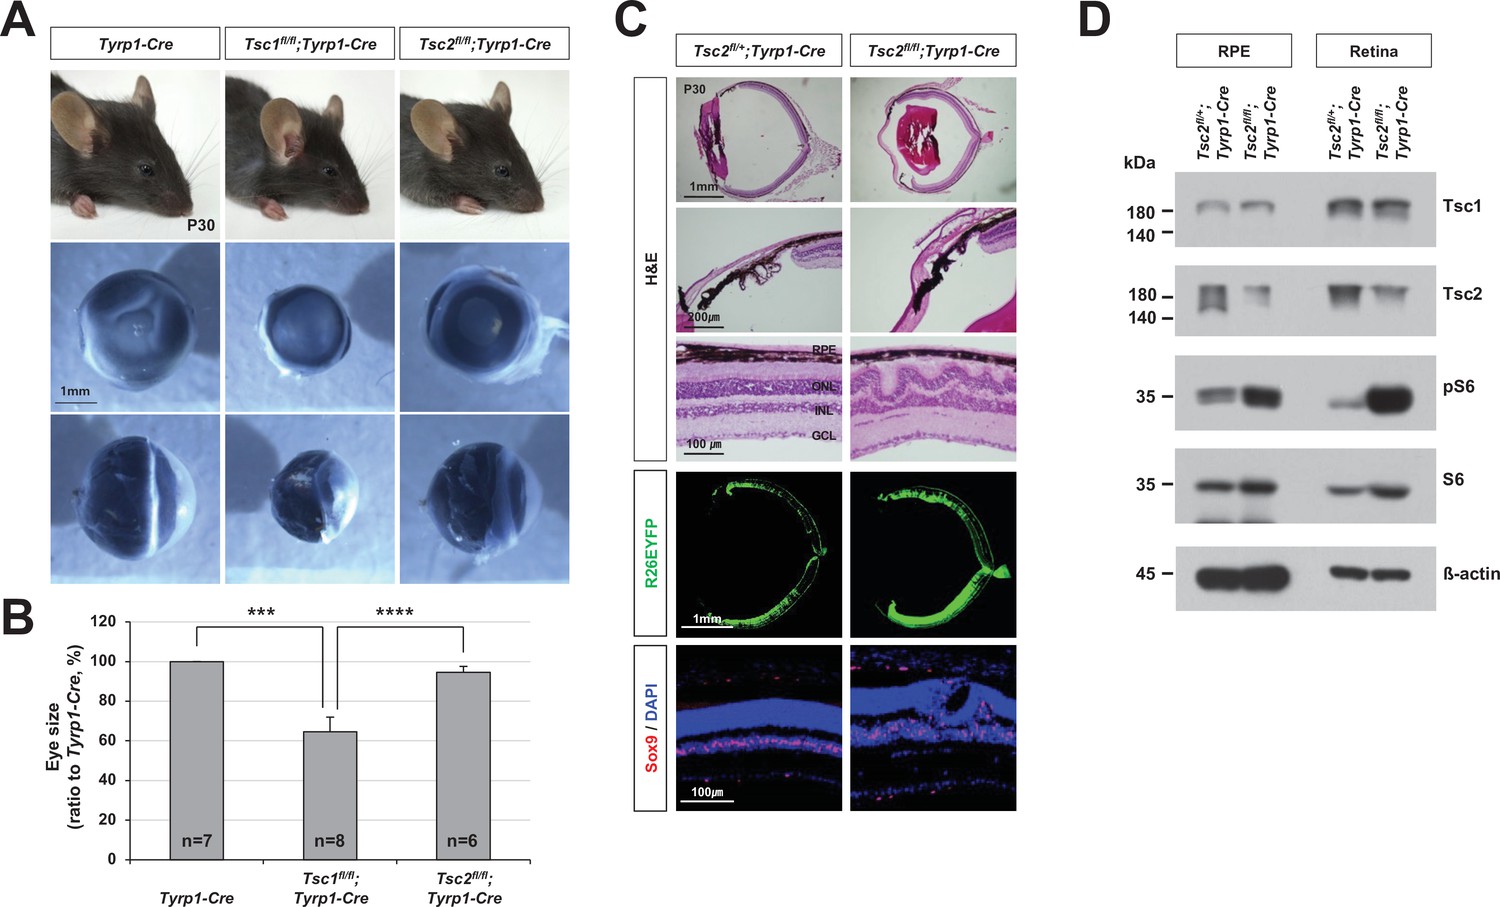
MG degeneration and rosette formation in Tsc2fl/fl;Tyrp1-Cre mouse retinas.
(A) Eyes of P30 mice with the indicated genotypes were isolated, and their front (middle row) and side (bottom row) views are shown. (B) Relative sizes of mouse eyes against those of tyrosinase-related protein 1-Cre (Tyrp1-Cre) mice are shown in the graph. Error bars are SD and numbers of samples analyzed are shown in the graph (four independent litters). ***p < 0.001; ****p < 0.0001. (C) Sections of P30 Tsc2fl/+;Tyrp1-Cre and Tsc2fl/fl;Tyrp1-Cre littermate mouse eyes were stained with hematoxylin and eosin (H&E) to examine the structures of the ciliary body (CB)/iris (second row) and the retina (third row). Distributions of the cells expressing R26EYFP Cre reporter and Sox9-positive MG in the eye sections were examined by immunostaining with anti-GFP antibody and anti-Sox9 antibody, respectively. Nuclei of the cells in the sections were visualized by DAPI staining. (D) Relative levels of indicated proteins in the retinal pigment epithelium (RPE) and retinas were examined by Western blot (WB).
Figure 2
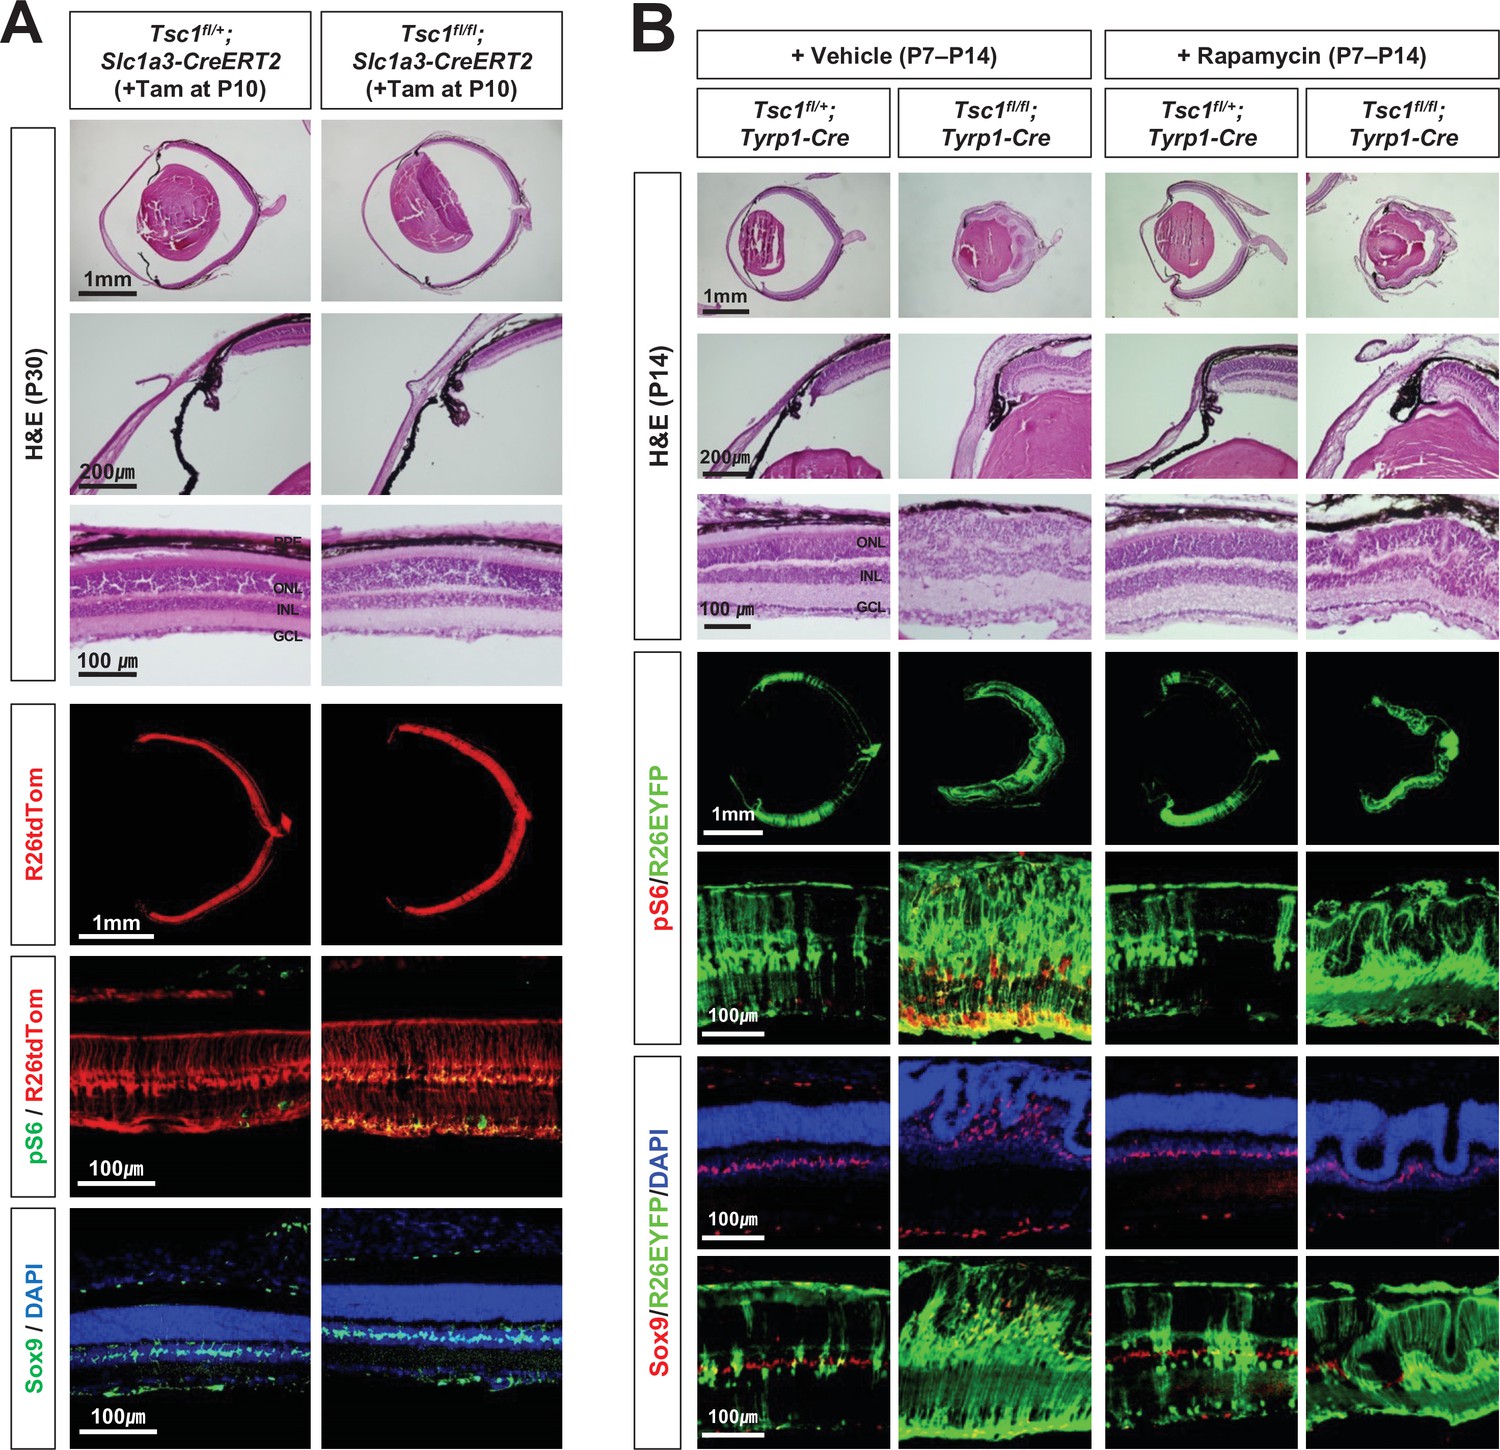
Inhibition of mTORC1 cannot suppress MG degeneration in the mature mouse retina.
(A) The Tsc1fl/+;Slc1a3-CreERT2 and Tsc1fl/fl;Slc1a3-CreERT2 littermate mice were injected with tamoxifen (Tam) at P10 before the isolation of the eyes for cryosection at P30. The eye sections were stained with hematoxylin and eosin (H&E) to investigate the eye and retinal structures. Distributions of the cells expressing R26tdTom Cre reporter, mTORC1 activitation marker pS6, and MG marker Sox9 in the eye sections were examined by immunostaining. Nuclei of the cells in the sections were visualized by DAPI staining. (B) Tsc1fl/+;Tyrp1-Cre and Tsc1fl/fl;Tyrp1-Cre littermate mice were injected with rapamycin (2 mg/kg) daily from P7 to P13 to inhibit mTORC1. Alternatively, the mice were injected with same volume of the vehicle (5% poly-ethylene glycol and 5% Tween 80 in PBS). Retinal structures of the injected mice were investigated at P14 by H&E staining of their eye sections. Distribution of Cre-affected cells and mTORC1 activation of the cells were examined by co-immunostaining of R26EYFP and pS6. Distributions of MG in the mouse retinas were examined by immunostaining of Sox9.
Figure 3
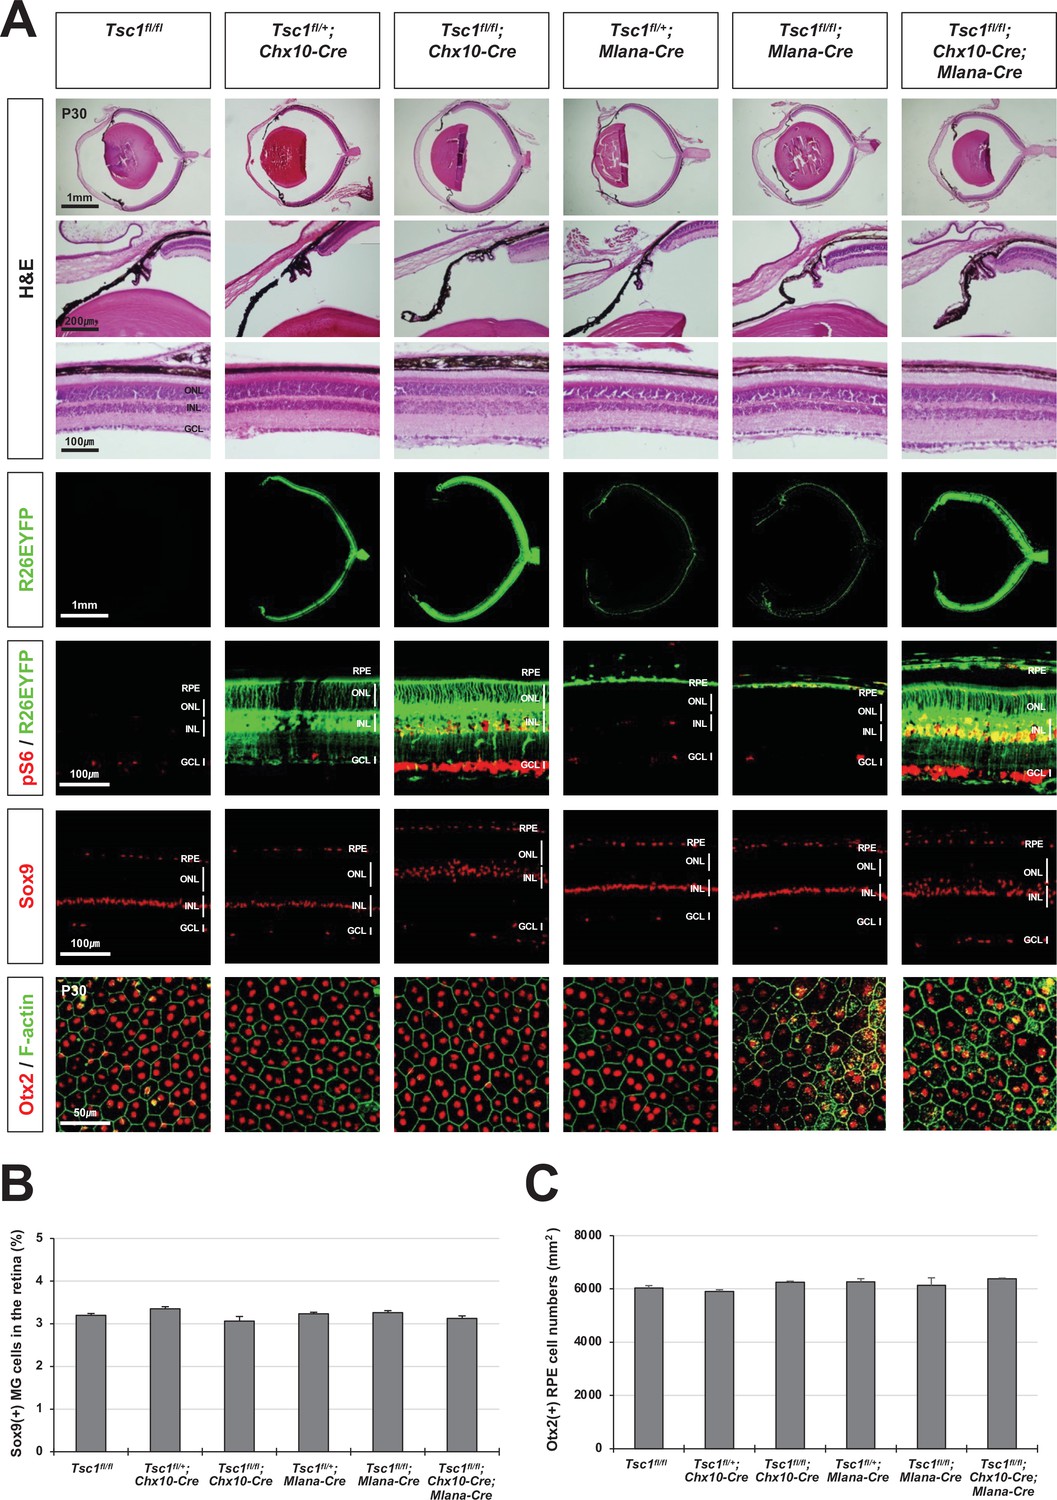
Normal eye and retinal structures in the mice lacking tuberous sclerosis complex 1 (Tsc1) in majority retina and retinal pigment epithelium (RPE) populations.
(A) Retinal structures of P30 mice deleted of Tsc1 in majority retinal progenitor cells (RPCs) by Chx10-Cre or in the RPE by Mlana-Cre were investigated by hematoxylin and eosin (H&E) staining of the eye sections. Distribution of Cre-affected cells and mTORC1 activitation of the cells were examined by co-immunostaining of R26EYFP and pS6. Distributions of MG in the mouse retinas were examined by immunostaining of Sox9. RPE in whole-mount eye cups was visualized by immunostaining of Otx2, which locates in the RPE nuclei, and F-actin, which marks RPE cell boundary. Numbers of Sox9-positive MG in the retinal sections (B) and Otx2-postive RPE in the whole-mount eye cups (C) were counted and shown in the graphs. Error bars denote SD and numbers of samples are 6 from four independent litters.
Figure 4 with 4 supplements

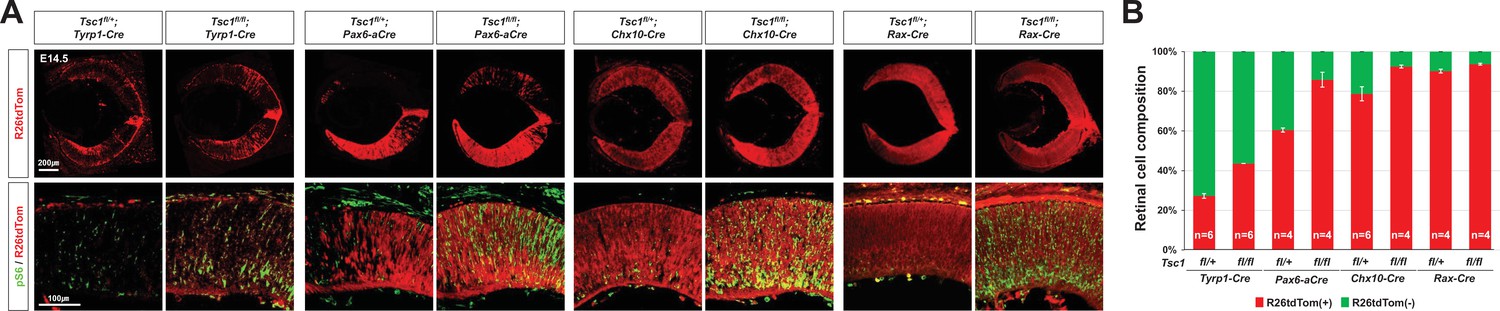
MG degeneration is caused by clonal hyperexpansion of tuberous sclerosis complex 1 (Tsc1)-deficient cells in developing mouse retina.
(A) Eye and retinal structures of P30 mice with the indicated genotypes were examined by hematoxylin and eosin (H&E) staining. Distribution of Cre-affected cells and mTORC1 activation of the cells were examined by co-immunostaining of R26tdTom and pS6. (B) Cre-affected Tsc1-heterozygote (Tsc1fl/+;Cre) and Tsc1-deficient (Tsc1fl/fl;Cre) cells, which emitted red fluorescence of R26tdTom Cre reporter, are isolated from Cre-unaffected wild-type cells in same retinas by FACS and the histograms are presented. (C) Relative composition of R26tdTom-positive and -negative cell populations in the retinas are shown in the graph. Error bars denote SD. Numbers of samples analyzed are shown in the graph columns. ***p < 0.001; n.s., not significant. (D) Distributions of the Cre-affected cells in the corresponding E14.5 and P30 mouse retinas are summarized in the drawings. (E) Developmental changes of R26tdTom-positive Cre-affected population in Tsc1fl/+;Tyrp1-Cre and Tsc1fl/fl;Tyrp1-Cre littermate mouse retinas were determined by FACS and shown in the graph. Error bars denote SD. Numbers of samples analyzed are shown in the graph (four independent litters). **p < 0.01; ****p < 0.0001. (F) Tsc1+/- and Tsc1-/- retinal progenitor cells (RPCs) were isolated from E13 Tsc1fl/+;Chx10-Cre and Tsc1fl/fl;Chx10-Cre and were cultured to form the neurospheres. Representative images of the neurospheres at the indicated post-culture days are provided. (G) Sizes of neurospheres in culture were counted at the indicated post-culture days and their average values are shown in the graph. (H) Average numbers of neurosphere in the indicated area are also shown in the graph. Numbers of samples analyzed are shown in the graphs (± independent culture batches). *p < 0.05; ***p < 0.001; ****p < 0.0001; n.s., not significant.
Figure 4—figure supplement 1
Distributions of tuberous sclerosis complex 1 (Tsc1)-deficient cells in E14.5 Tsc1-conditional knock-out (cko) mouse retinas.
(A) Distributions of the cells affected by Cre recombinases in the eye sections, which were obtained from the mice with the indicated genotypes, were visualized by R26tdTom Cre reporter. The cells having active mTORC1 were visualized by immunostaining of pS6. (B) Composition of R26tdTom(-) wild-type cells and R26tdTom(+) Tsc1-heterozygote or Tsc1-deficient cells in the mouse retinas was determined byFACS and shown in the graph. Retinal cells collected from littermate mice sharing a same genotype were combined in a tube for FACS analysis. Therefore, the numbers of samples analyzed are provided in the graph are the numbers of mouse litters.
Figure 4—figure supplement 2
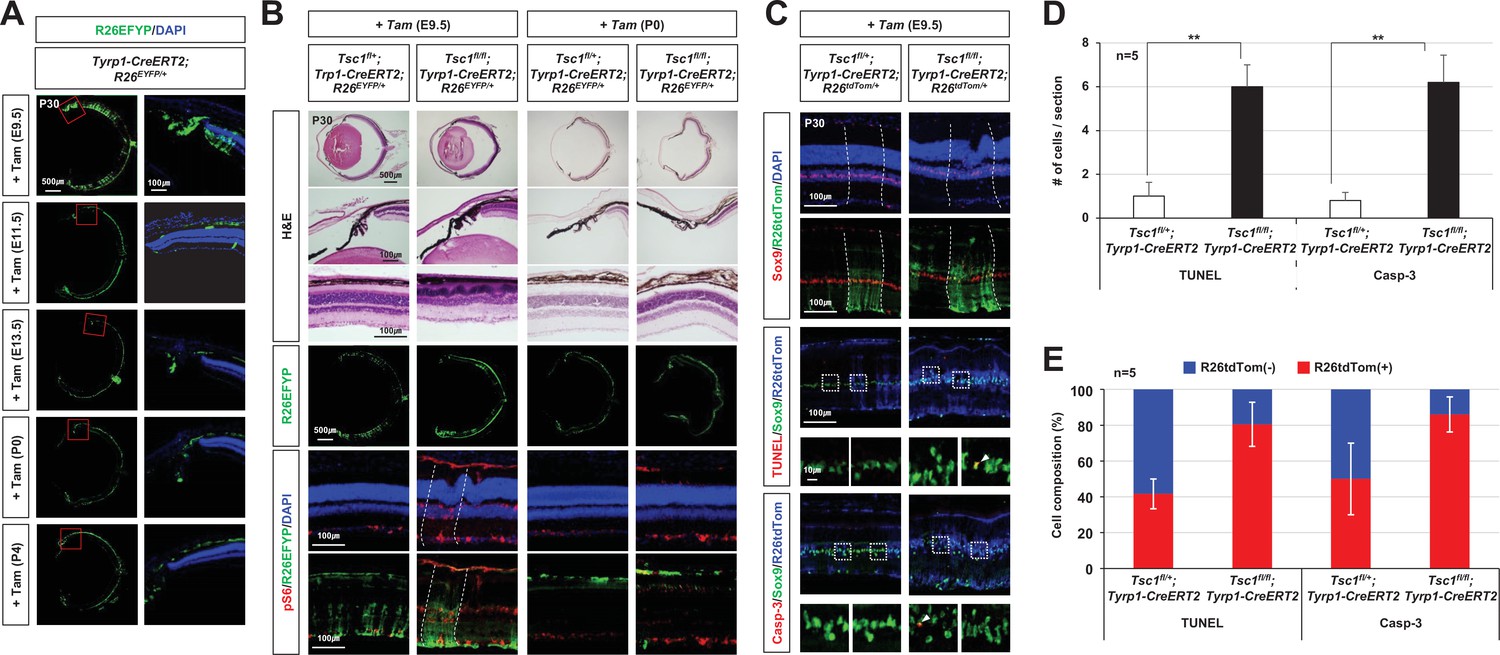
MG degeneration and retinal rosette formation upon the deletion of tuberous sclerosis complex 1 (Tsc1) in ciliary margin (CM)-derived minor retinal progenitor cell (RPC) clones by tyrosinase-related protein 1-Cre (Tyrp1-Cre)ERT2.
(A) Retinal cells affected by Tyrp1-CreERT2, which was activated by Tam injection at the indicated developmental stages, were visualized by R26EYFP Cre reporter. Nuclei of the cells in the sections were visualized by DAPI staining. (B) Floxed Tsc1 allele was deleted by Tyrp1-CreERT2 in the mouse retinas by Tam injection at E9.5 or P0. Retinal structures of the mice were examined by hematoxylin and eosin (H&E) staining of the eye section. Cells having active mTORC1 in the mouse retinas were visualized by immunostaining of pS6. (C) Distribution of MG in the mouse retinas was investigated by immunostaining of Sox9, a marker for MG. Distribution of apoptotic cells was examined by terminal deoxynucleotidyl transferase dUTP nick end labeling (TUNEL) and immunostaining of caspase-3 (Casp-3). The outsets of TUNEL and Casp-3 staining images are the magnified versions of the boxed areas on top. Arrowheads point TUNEL- or Casp-3-positive apoptotic cells. (D) Numbers of the apoptotic cells per section were counted and shown in the graph. (E) Cre-affected R26tdTom(+) and Cre-unaffected R26tdTom(-) cell populations among the apoptotic cells were shown in the graph. Numbers of samples analyzed are provided in the graph.
Figure 4—figure supplement 3
Autonomous effects of tuberous sclerosis complex 1 (Tsc1) deletion on mitotic aging of mouse retinal progenitor cells (RPCs) in neurosphere culture.
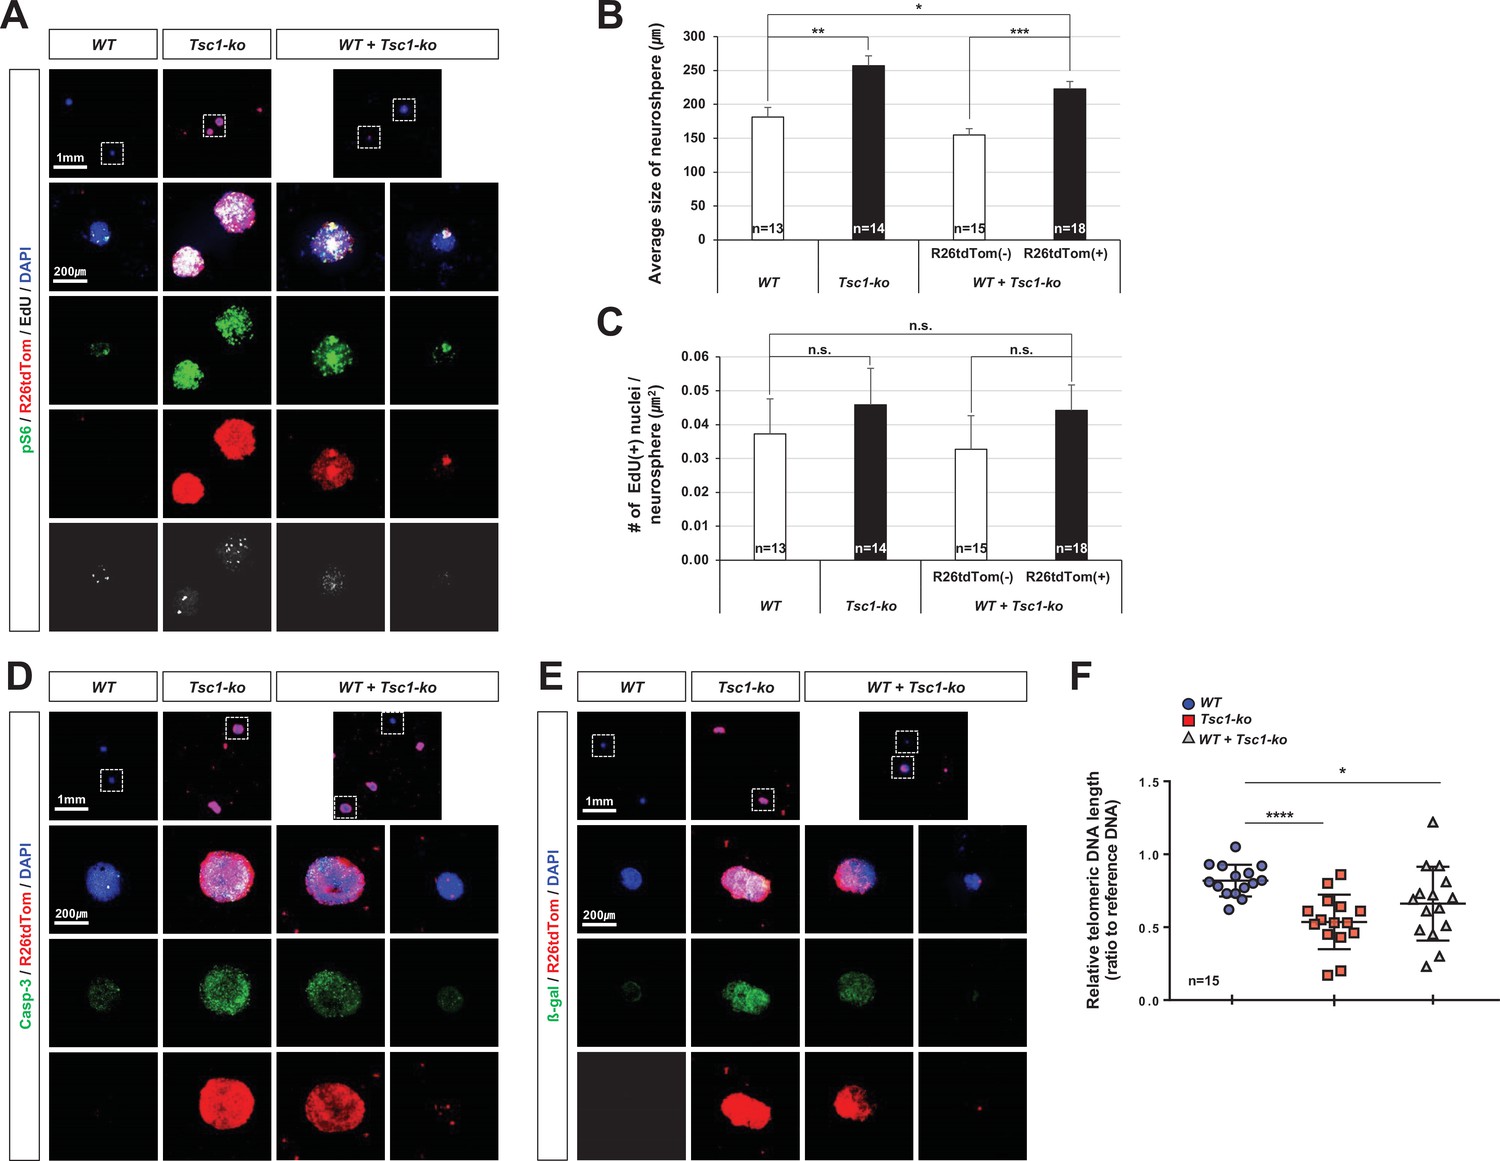
(A)Tsc1+/+ (wild-type [WT]) and Tsc1-/- (Tsc1-knock-out [ko]) RPCs were isolated from E13 C57BL/6J and C57BL/6J-Tsc1fl/fl;Chx10-Cre;R26tdTom/+ mice, respectively, and were cultured to form the neurospheres for 24 days. EdU was added into the growth media at 24 hr ahead of the immunostaining of the neurospheres with the corresponding antibodies. Neurospheres derived from Tsc1-ko RPCs were identified by R26tdTom Cre reporter and mTORC1 activation was determined by detecting pS6. The images in bottom four rows are the boxed areas in top row. (B) Sizes of neurospheres in culture were counted and their average values are shown in the graph. (C) Numbers of EdU-labeled nuclei in the neurospheres are counted and average numbers within μm2 are shown in the graph. (D and E) The neurospheres were stained with anti-caspase-3 (Casp-3) antibody (D) and anti-β-gal antibody (E) to detect apoptotic cells and senescent cells, respectively. (F) Telomere lengths of the cells comprising the neurospheres were measured and are shown in the graph. *p < 0.05; ****p < 0.0001. Numbers of samples analyzed are shown in the graphs.
Figure 4—figure supplement 4
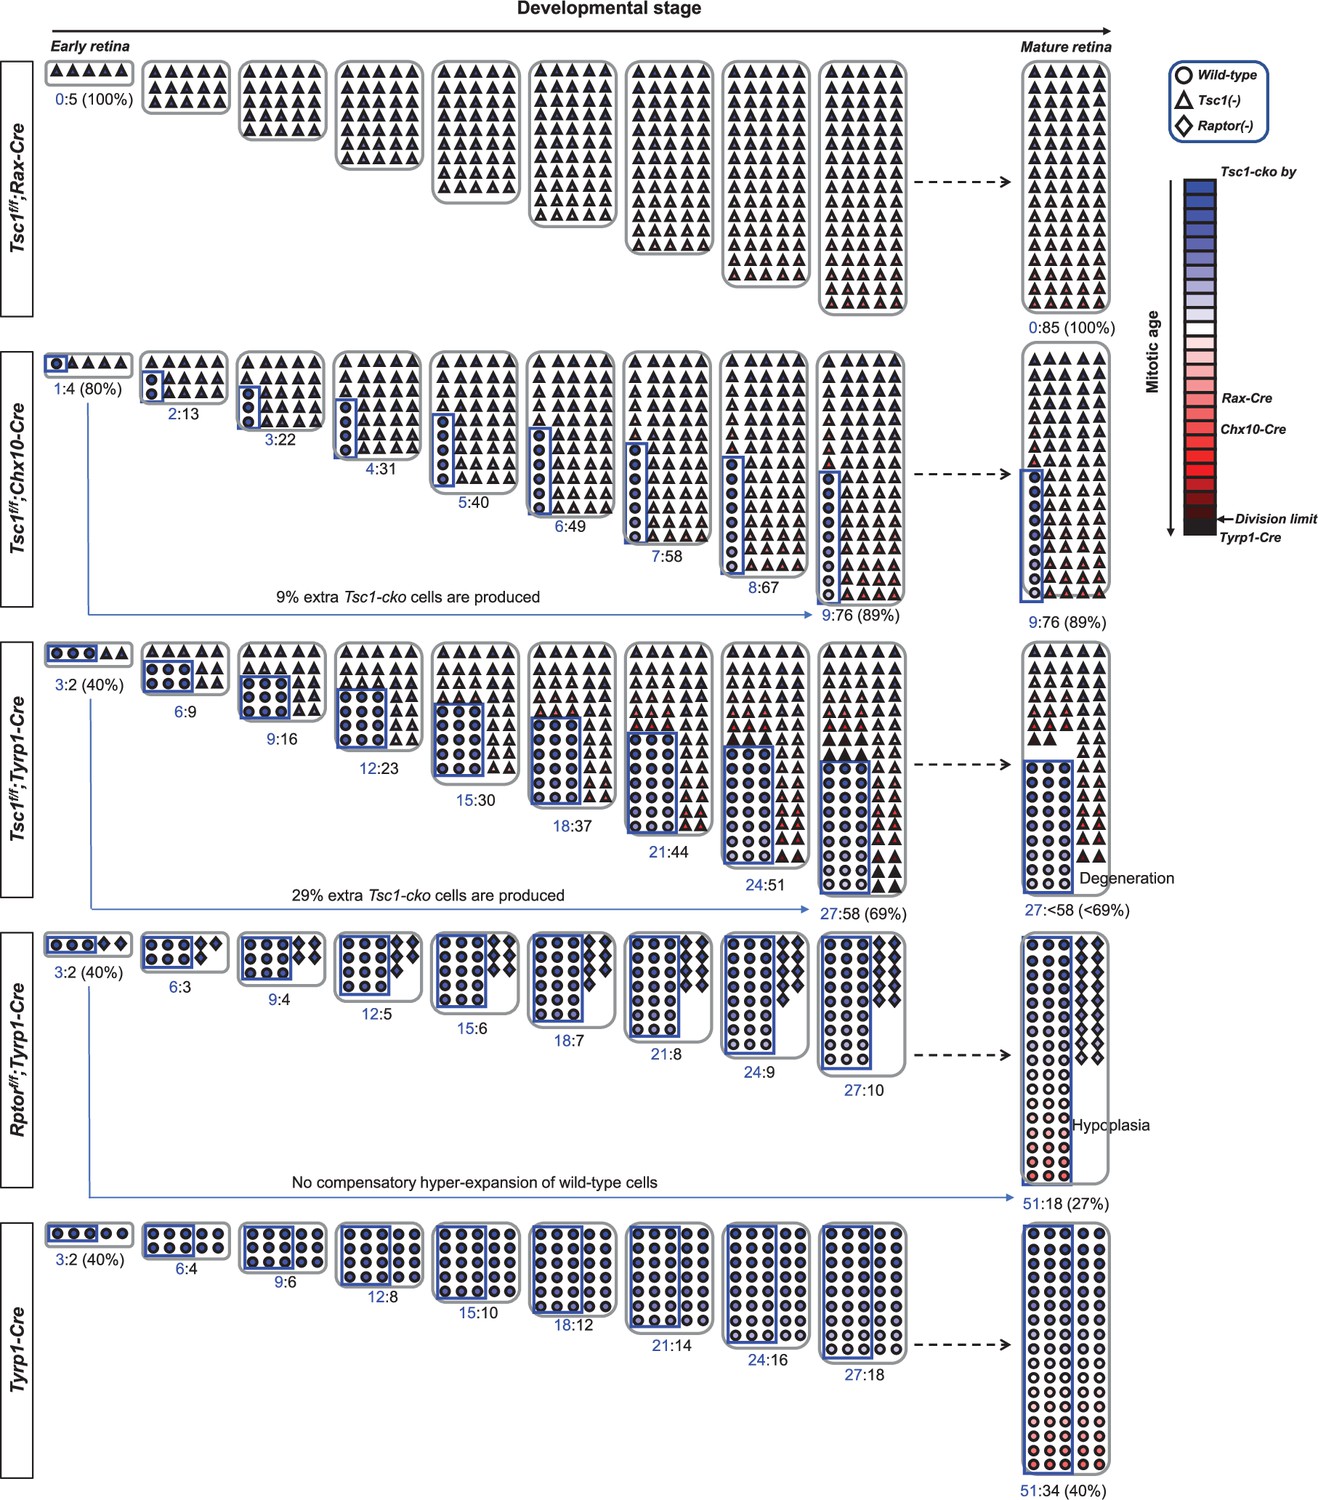
Hypothetical model depicts the clonal hyperexpansion of tuberous sclerosis complex 1 (Tsc1)-deficient.
retinal progenitor cells (RPCs).
We hypothesize that the Cre recombinases are expressed in the entire (Rax-Cre), 80% (Chx10-Cre), and 40% (tyrosinase-related protein 1-Cre [Tyrp1-Cre]) RPC populations (blue boxed areas). The lineage of five RPCs in each retina is then traced based on the assumption that Tsc1-deficient RPCs divide twice when wild-type RPCs divide once in an asymmetric manner. Conversely, the Rptor-deficient RPCs are inefficient to progress cell cycle, consequently they can divide once while wild-type RPCs divide twice. In these conditions, Tsc1-deficient RPCs in Tsc1fl/fl;Rax-Cre mouse retina can finish histogenesis precociously when wild-type RPCs in Tyrp1-Cre mouse retina have completed eight rounds of cell division. The spaces of Tsc1fl/fl;Chx10-Cre and Tsc1fl/fl;Tyrp1-Cre mouse retinas are also filled faster, despite the incomplete Cre penetration. In these mouse retinas, Tsc1-deficient RPCs entered extra cell division to fill the open space unoccupied by slowly dividing wild-type RPCs. This precocious completion of retinal development of Tsc1fl/fl;Chx10-Cre and Tsc1fl/fl;Tyrp1-Cre mice was reported in a previous report (Choi et al., 2018) and in this work (Figure 1D), respectively. Moreover, the invasive overproliferation of Tsc1-deficient RPCs leads them to the mitotic division limit earlier in Tsc1fl/fl;Tyrp1-Cre mouse retina, in which MG derived from the Tsc1-deficient RPCs are degenerated significantly from senescence-associated cell death (Figure 5C–E). However, wild-type RPCs did not make compensatory extra cell division to fill the space, which was left from cell division-impaired Rptor-deficient clones. Consequently, Tsc1fl/fl;Rptor-Cre mouse retina exhibits severe tissue hypoplasia (Figure 5F).
Figure 5 with 4 supplements

Mitotic aging and senescence of tuberous sclerosis complex 1 (Tsc1)-deficient retinal cells.
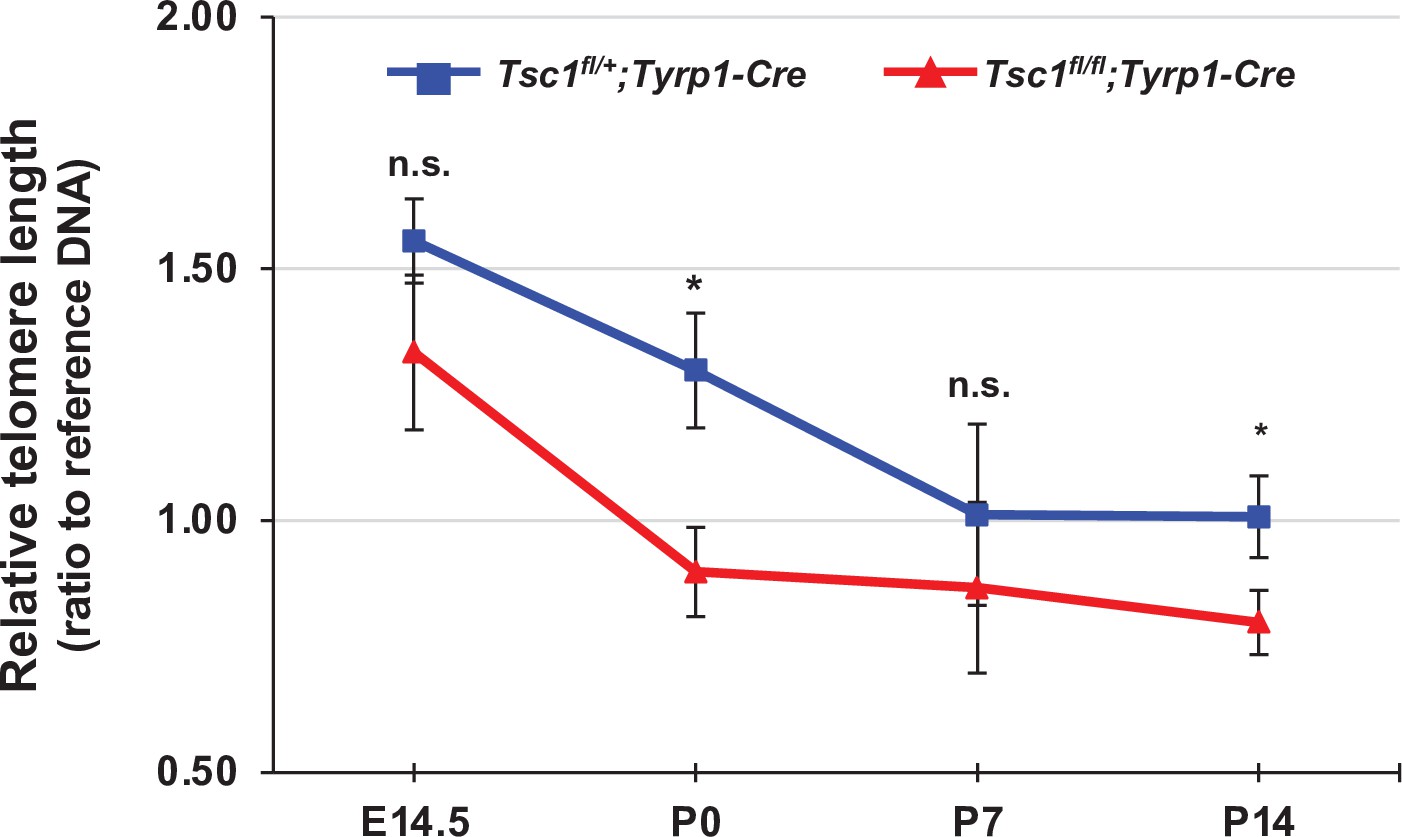
(A) Telomere lengths of the retinal cells, which were isolated from P30 Tsc1fl/+ and Tsc1fl/fl mice with the indicated Cre drivers, were compared with that of control sample, and relative values are shown in the graph. Error bars denote SD. Numbers of samples analyzed are shown in the graph. All samples were obtained from independent litters. **p < 0.01; n.s., not significant. (B) Telomere lengths of the FACS-isolated retinal cells from P14 Tsc1fl/+;Tyrp1-Cre and Tsc1fl/fl;Tyrp1-Cre littermate mice were compared with that of control sample, and their relative values are shown in the graph. *p < 0.05; ***p < 0.001. (C) Senescence markers (β-gal, p53, p21, and c-Myc) expressed in the corresponding P30 Tsc1fl/+;Cre and Tsc1fl/fl;Cre mouse retinas were detected by Western blot (WB). Relative amounts of the proteins used in each sample were determined by WB detection of β-actin. (D) Expression of senescence markers (β-gal and p53) in the MG was determined by co-immunostaining with an MG marker, Sox9. The cells experienced Cre-mediated recombination were also visualized by R26tdTom reporter. Images in the right columns are the magnified versions of the boxed areas indicated by corresponding numbers in the low magnification images. (E) Sox9-positive MG, Pax6-positive amacrine cell (AC), and Vsx2-positive bipolar cell (BC) populations that express the senescence markers were determined and shown in the graph (Pax6 and Vsx2 staining images are provided in Figure 5—figure supplement 4). Number of samples analyzed are shown in the graph (five independent litters). n.d., not detected. (F) Eye and retinal structures of P30 Rptorfl/+;Tyrp1-Cre and Rptorfl/fl;Tyrp1-Cre mice were investigated by hematoxylin and eosin (H&E) staining of the eye sections. Distribution of the Cre-affected cells and mTORC1 activation of the cells were examined by the immunostaining of R26tdTom and pS6, respectively. (G) R26tdTom-positive Cre-affected cell population in the mouse retinas were quantified by FACS and shown in the graph. ****p < 0.0001. (H) Telomere lengths of unsorted (whole retina) and the FACS-isolated retinal cells from P14 Rptorfl/+;Tyrp1-Cre and Rptorfl/fl;Tyrp1-Cre mice were compared with that of control sample and their relative values are shown in the graph. Number of samples analyzed are shown in the graph. *p < 0.05. (I) Relative levels of senescence markers and mTORC1 pathway components of the mouse retinas were analyzed by WB. (J) Distribution of the cells expressing senescence markers and R26tdTom Cre reporter in the retinas was also examined by immunostaining.
Figure 5—figure supplement 1
Telomere shortening in developing mouse retina.
Relative lengths of telomeres in the cells isolated from mouse retinas at the indicated developmental stages were measured as described in Materials and methods and shown in the graph. Error bars denote SD (n = 10). *p < 0.05; n.s., not significant.
Figure 5—figure supplement 2
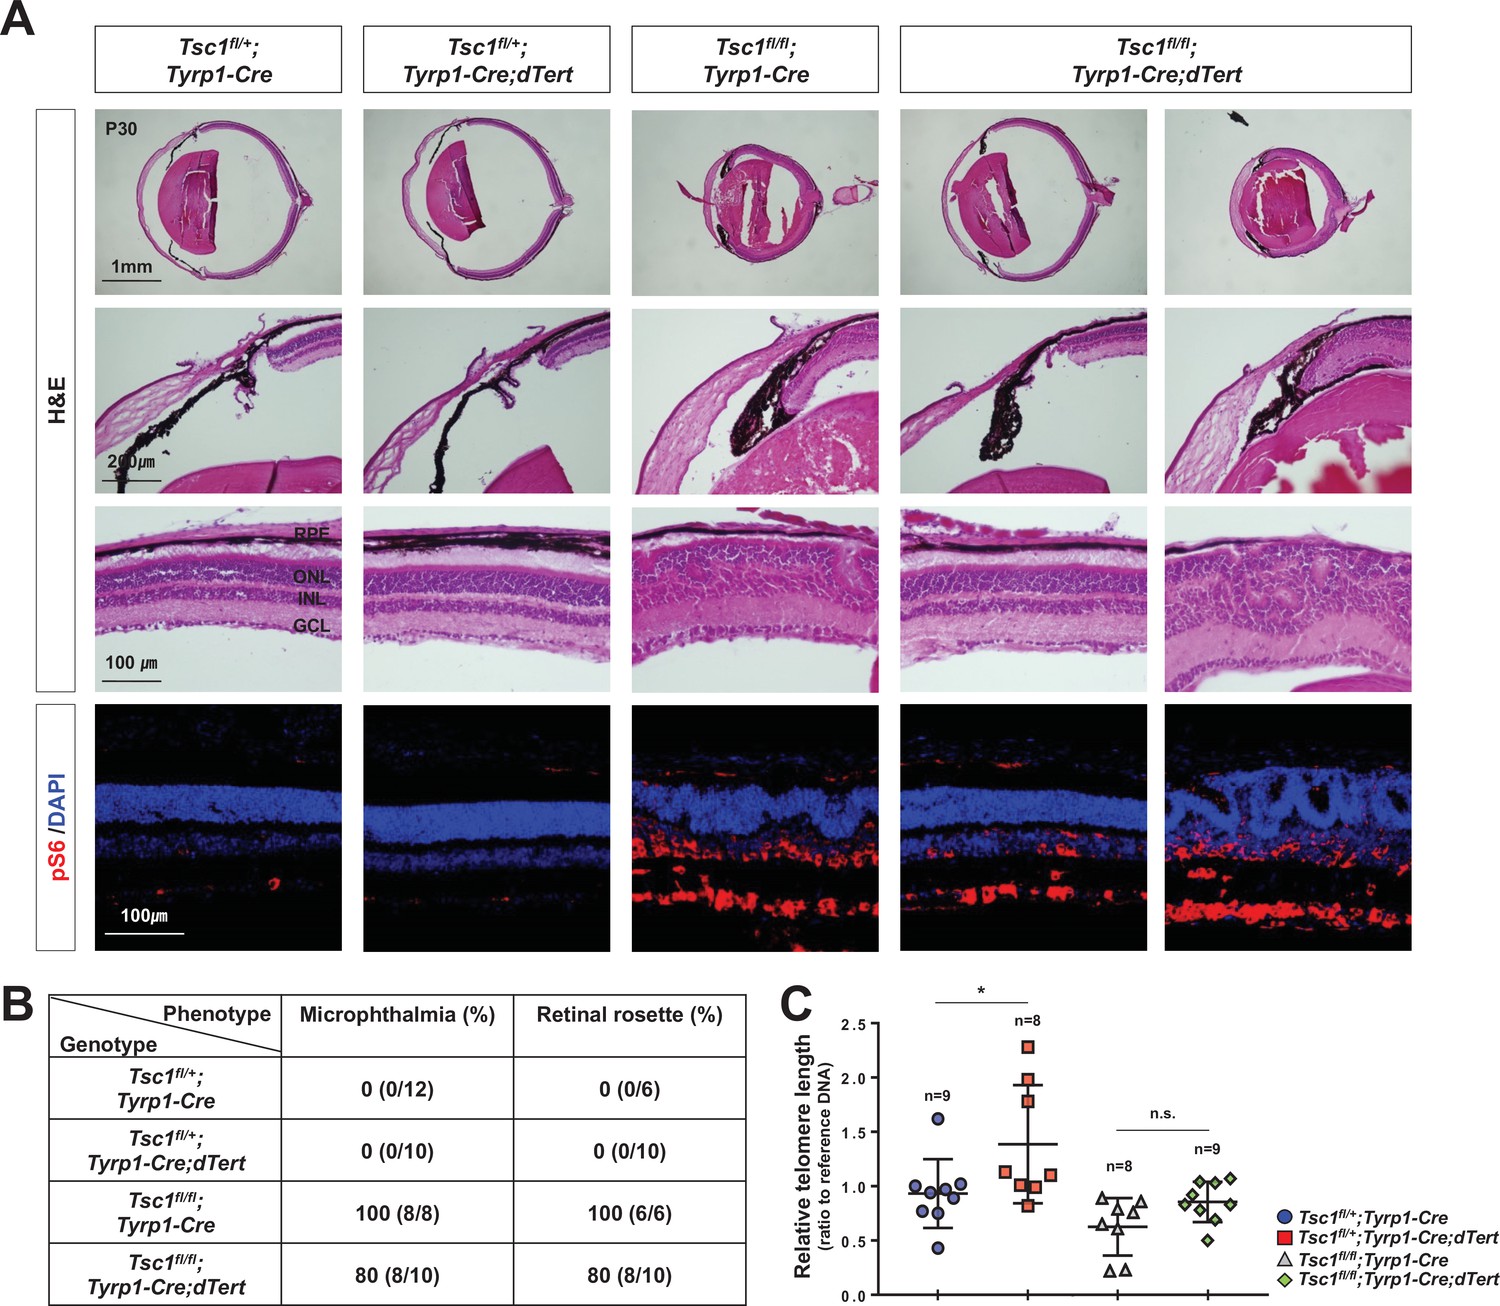
Telomerase overexpression could not rescue the phenotypes in Tsc1fl/fl;Tyrp1-Cre mouse retinas.
(A) Eye and retinal structures of P30 mice with the indicated genotypes were analyzed by hematoxylin and eosin (H&E) staining of their eye sections. Cells having active mTORC1 in the mouse retinas were examined by immunostaining of pS6. Nuclei of the cells in the sections were visualized by DAPI staining. (B) Populations of mice exhibited microphthalmia and retinal rosettes are provided in the table. The values are percentages, which were obtained by dividing the numbers of mice exhibiting the phenotypes among total mice analyzed. (B) Telomere lengths of the retinal cells from P30 littermate mice were compared with that of control sample and shown in the graph. Numbers of samples analyzed are shown in the graph. *p < 0.05; n.s., not significant.
Figure 5—figure supplement 3
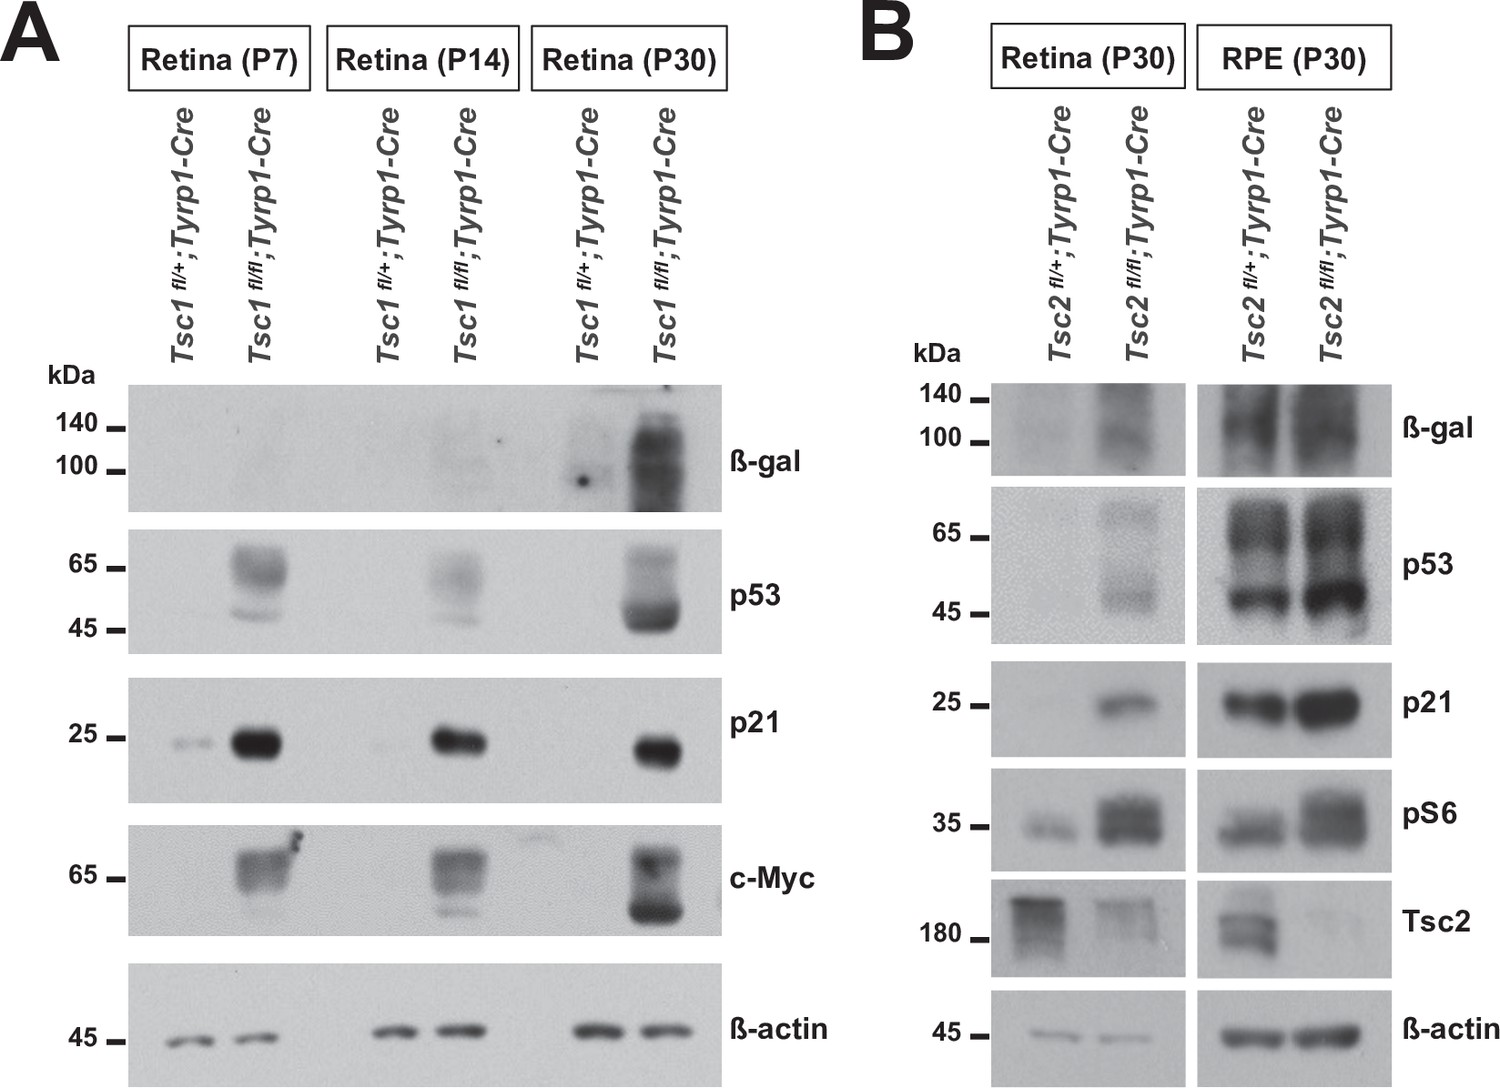
Expression of senescence markers in the postnatal tuberous sclerosis complex 1 (Tsc1)- and Tsc2-conditional knock-out (cko) mouse retinas.
(A) Retinas of Tsc1fl/fl;Tyrp1-Cre and Tsc1fl/fl;Tyrp1-Cre littermate mice were isolated at the indicated postnatal stages and the levels of senescence markers in the retinal cell lysates were examined by Western blot (WB). (B) Relative levels of the senescence markers in P30 Tsc2fl/+;Tyrp1-Cre and Tsc2fl/fl;Tyrp1-Cre littermate mouse retinas and retinal pigment epithelium (RPE) were examined by WB.
Figure 5—figure supplement 4
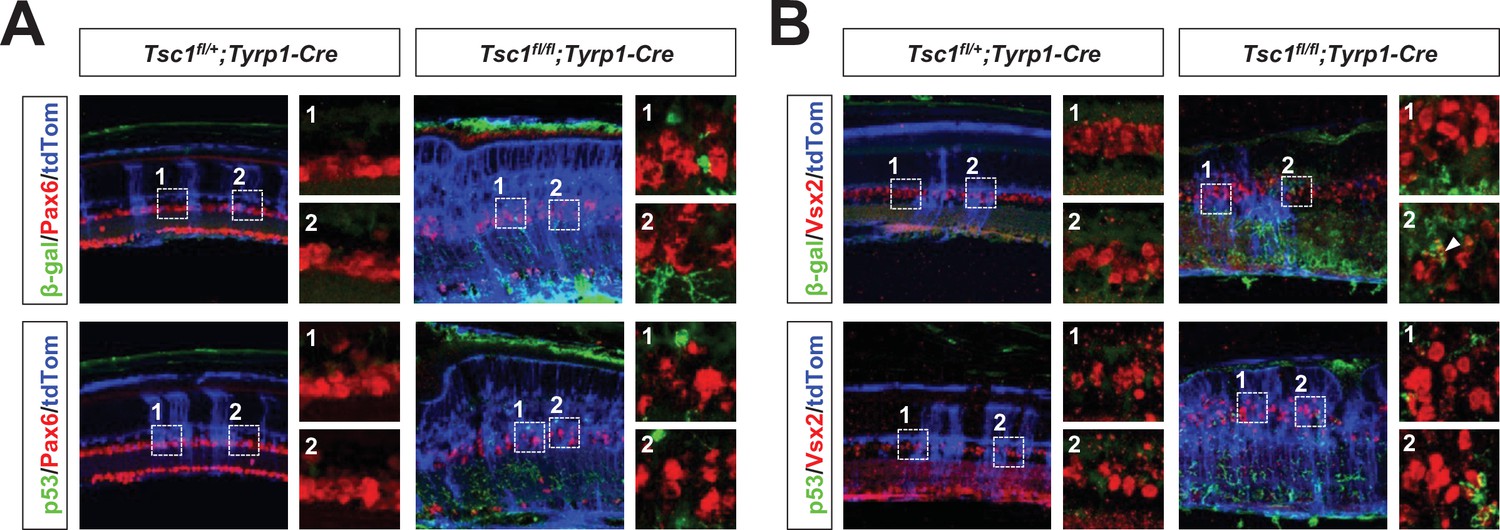
Senescence is not evident in amacrine cells (ACs) and bipolar cells (BCs) of Tsc1fl/fl;Tyrp1-Cre mouse retina.
Expression of the senescence markers, β-gal and p53, in BCs and ACs of P30 Tsc1fl/+;Tyrp1-Cre and Tsc1fl/fl;Tyrp1-Cre littermate mouse retinas was determined by co-immunostaining of an AC marker, Pax6 (A), and a BC marker, Vsx2 (B), respectively. The cells affected by Cre recombinase were visualized by R26tdTom reporter. Images in the right columns are the magnified versions of the boxed areas with the corresponding numbers in the low magnification images. Quantification data are shown in Figure 5E.
Figure 6 with 2 supplements
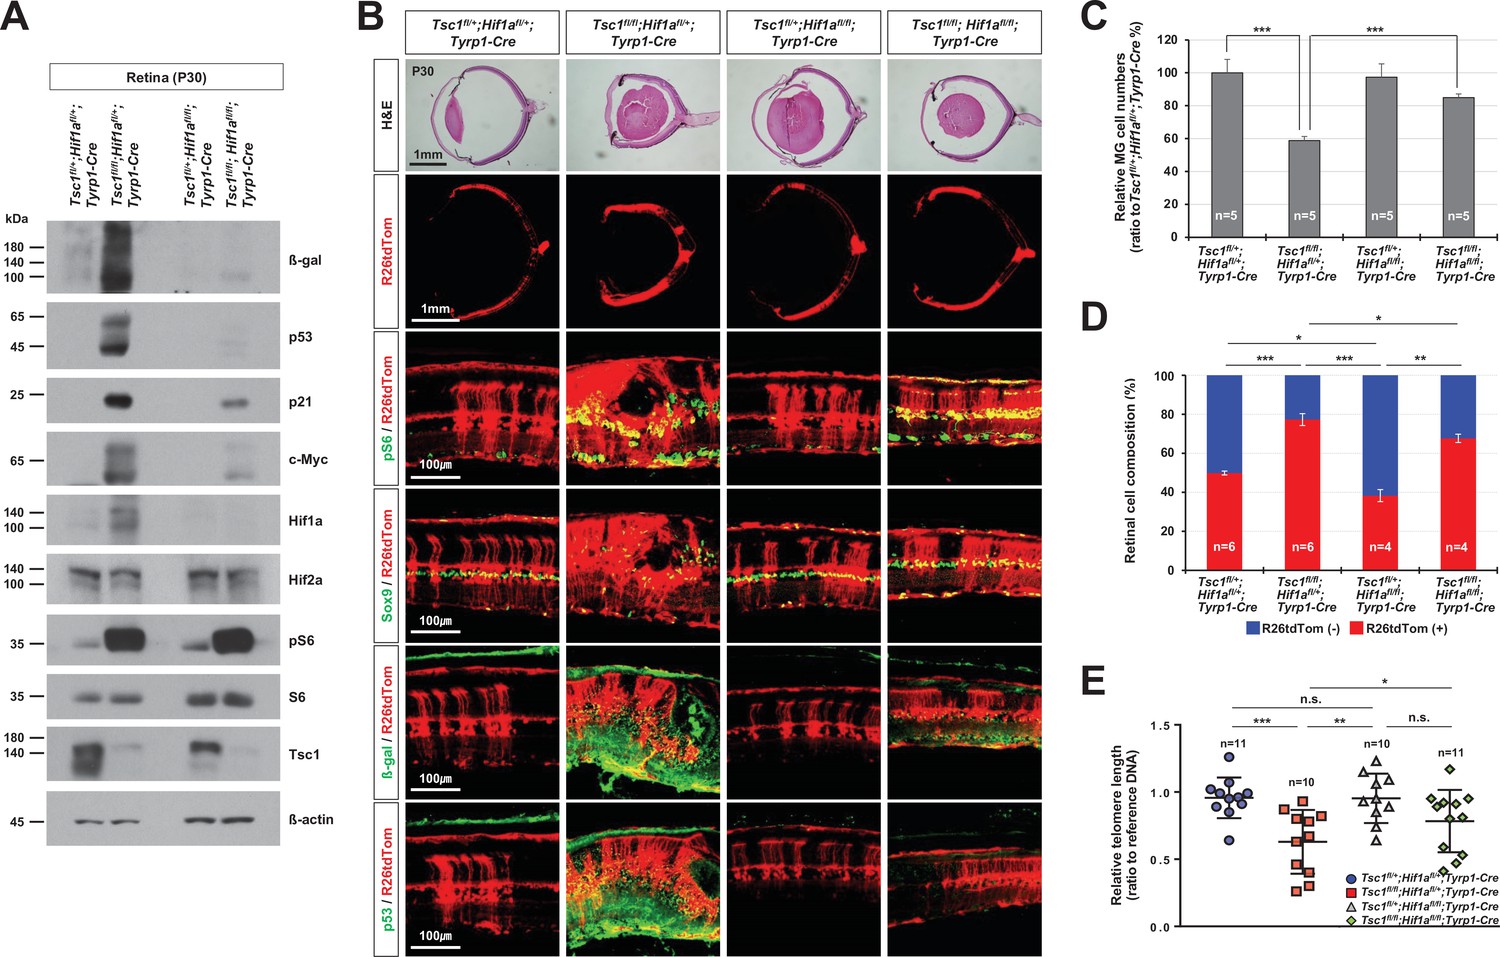
Rescue of Tsc1fl/fl;Tyrp1-Cre mouse retinal phenotypes by concomitant deletion of hypoxia-induced factor 1-alpha (Hif1a).
(A) Levels of senescence markers in P30 mouse retinas with indicated genotypes were analyzed by Western blot (WB). Relative amounts of proteins used in each sample were determined by WB detection of β-actin. (B) Distributions of mTORC1-active cells, which are positive to pS6, MG, which are positive to Sox9, and senescent cells, which are positive to β-gal and p53, were examined by immunostaining of the eye sections. Expression of those markers in the Cre-affected cells were determined by comparing the expression of the Cre reporter R26tdTom. (C) Numbers of Sox9-positive MG in the mouse retinas were counted and the relative numbers are shown in the graph. (D) R26tdTom-negative wild-type cells and R26tdTom-positive Cre-affected cells in the retinas were determined byFACS and shown in the graph. (E) The lengths of telomeres of the cells isolated from P30 mouse retinas with the indicated genotypes were compared with that of control sample, and their relative values are shown in the graph. Error bars denote SD. Numbers of samples analyzed are shown in the graphs. n.s., not significant; *p < 0.05; **p < 0.01; ***p < 0.001.
Figure 6—figure supplement 1
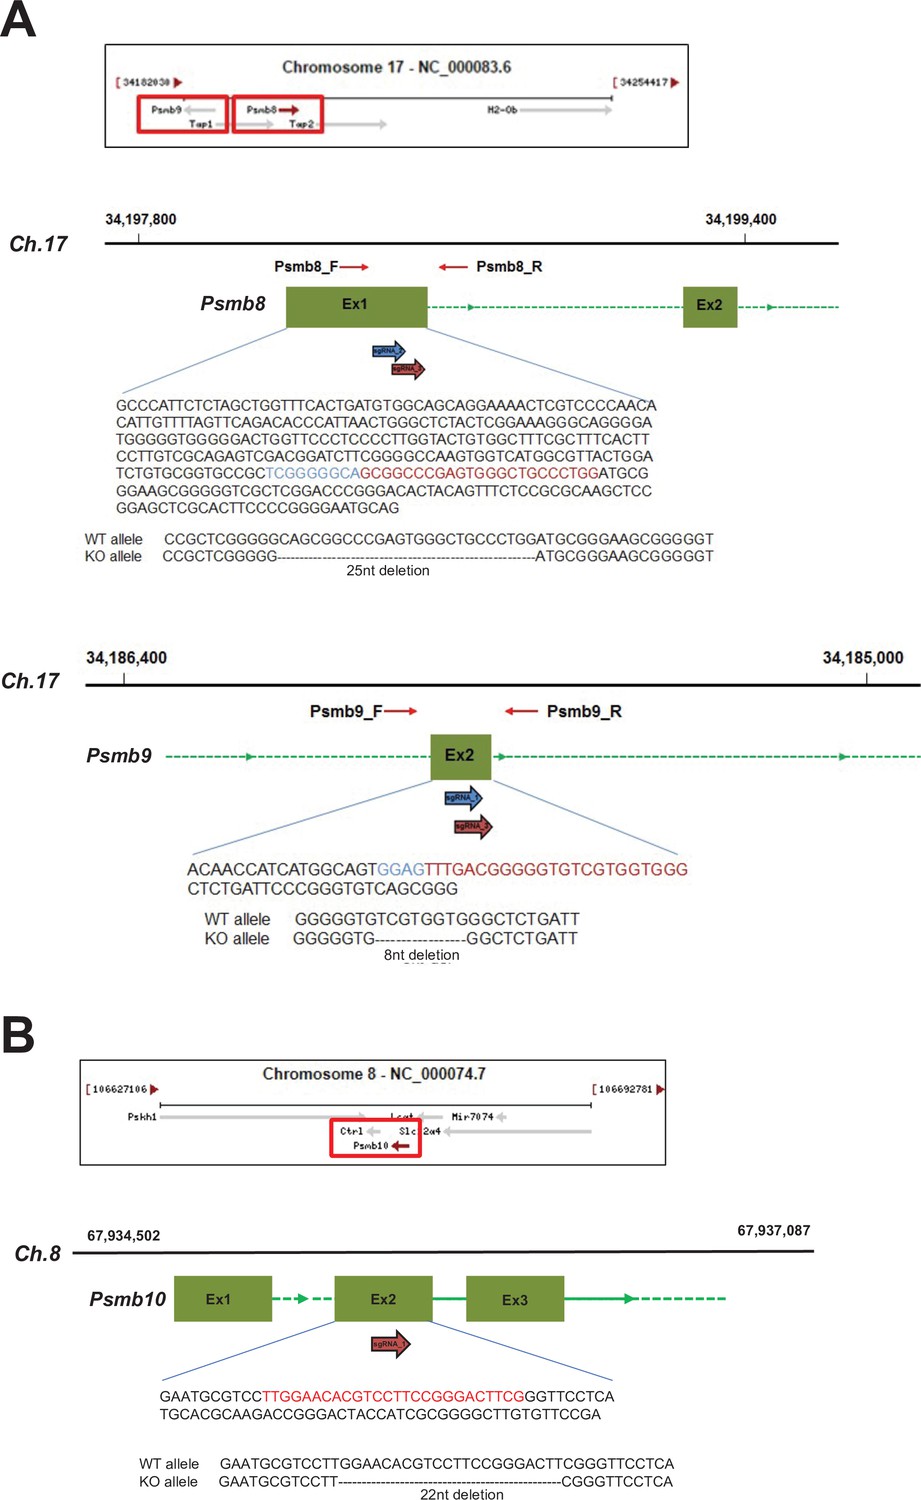
CRISPR/Cas9 gene targeting of mouse proteasome subunit beta 8, 9, and 10 (Psmb8,9,10) genes.
(A) Locations of Psmb8 and Psmb9 genes in mouse chromosome 17 (Ch.17) are shown. The gRNAs for the sequences in the exon 1 (Ex1) of Psmb8 and the exon 2 (Ex2) of Psmb9 genes are used to introduce the deletions and shown in red and blue. (B) Location of Psmb10 gene in mouse chromosome 8 (Ch.8) are shown. The gRNAs for the sequences in the Ex2 of Psmb10 gene are used to introduce the deletions and shown in red.
Figure 6—figure supplement 2
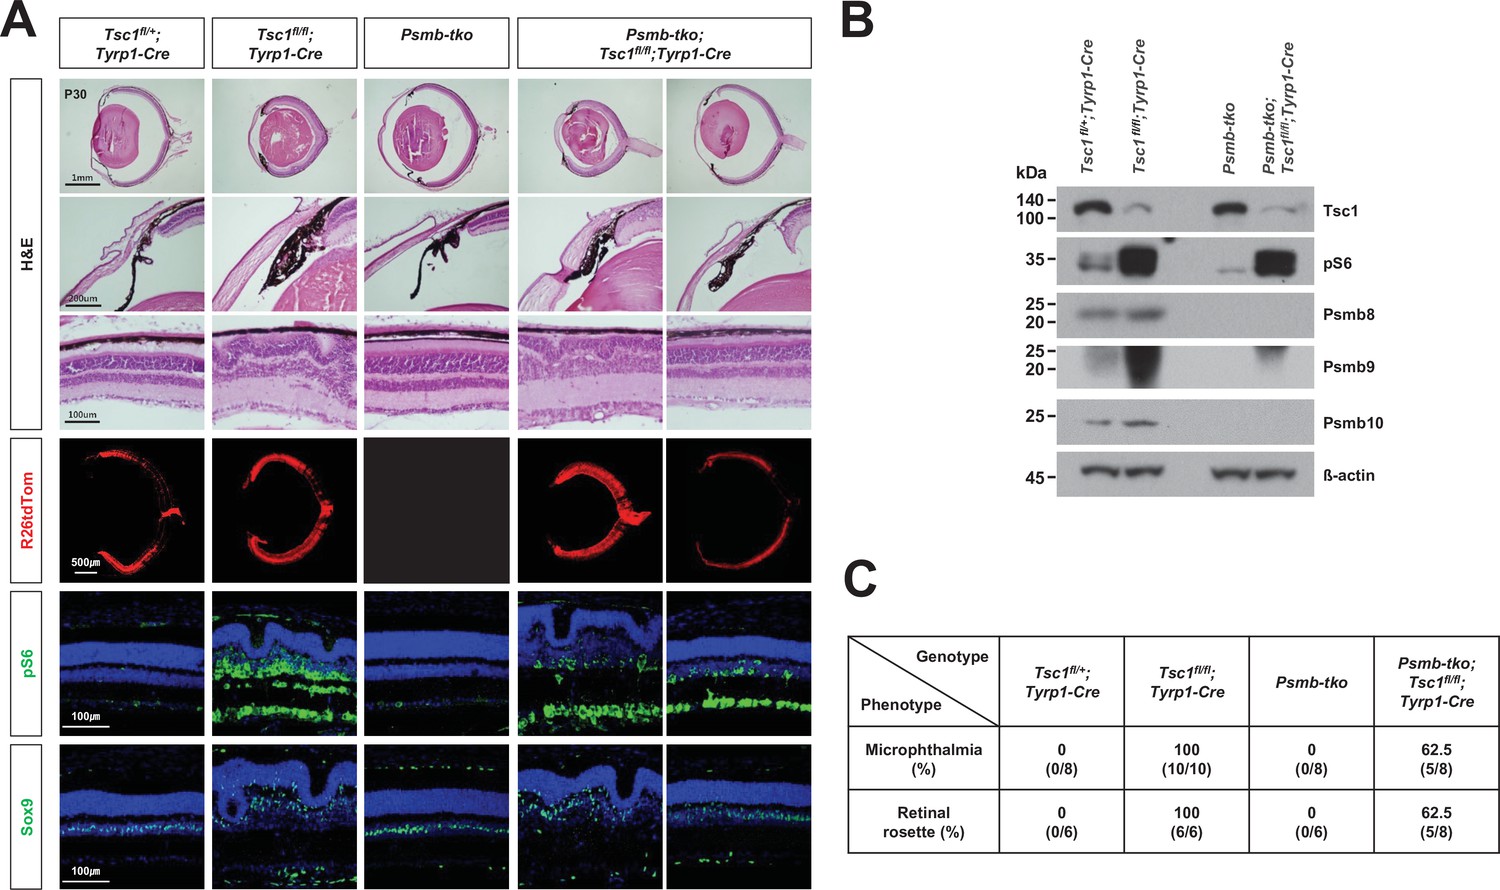
Immunoproteasome deficiency rescues the retinal phenotypes of Tsc1fl/fl;Tyrp1-Cre mice incompletely.
(A) Eye and retinal structures of P30 mice with the indicated genotypes were analyzed by hematoxylin and eosin (H&E) staining of the eye sections. Distributions of the Cre-affected cells and the cells having active mTORC1 in the mouse retinas were assessed by detecting R26tdTom Cre reporter and immunostaining of pS6, respectively. Nuclei of the cells in the sections were visualized by DAPI staining. (B) Relative levels of Tsc1, pS6, and immunoproteasome subunits (Psmb 8, 9, and 10) in P30 mouse retinas with the indicated genotypes were examined by Western blot (WB). (C) Numbers of mice exhibited microphthalmia and retinal rosettes are provided in the table. The values are percentages, which were obtained by dividing the numbers of mice exhibiting the phenotypes among total mice analyzed.
Figure 7 with 1 supplement
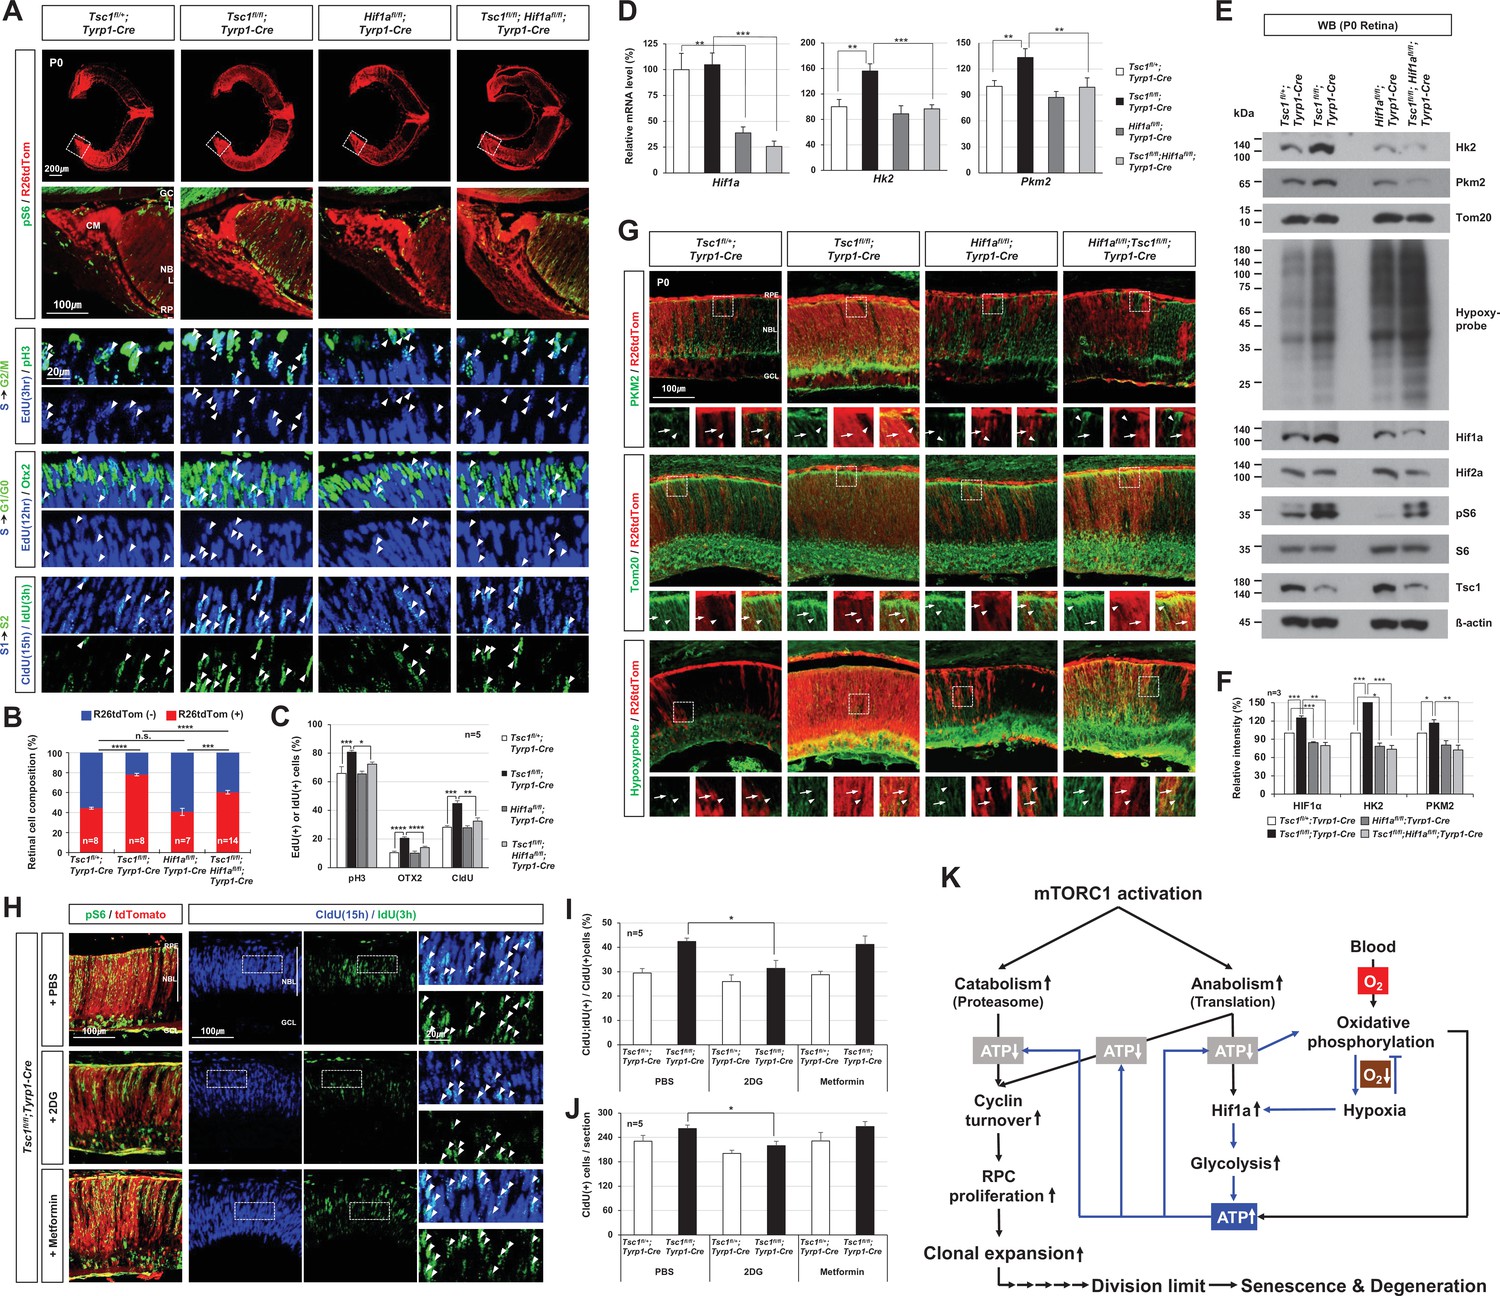
Hif1a supports mTORC1-induced retinal progenitor cell (RPC) proliferation through the expression of glycolytic enzymes.
(A) The Cre-affected cells in P0 mouse retinas with the indicated genotypes were visualized by R26tdTom Cre reporter. Distribution of mTORC1-active cells in the boxed areas was also examined by immunostaining of pS6 and shown in the second row. Proliferation and cell cycle progression of RPCs in the mouse retinas were also examined by 5-ethynyl-2′-deoxyuridine (EdU)/5-chloro-2'-deoxyuridine (CldU) labeling and chasing experiments as described in Materials and methods. (B) R26tdTom-positive Cre-affected cell population in the mouse retinas were quantified by FACS and shown in the graph. Error bars, SD. Numbers of samples analyzed are shown in the graph (four independent litters). (C) RPCs that had progressed from S-phase to G2/M-phase for 3 hr (EdU;pH3-positive); PRs that had been born for 12 hr (EdU;Otx2-positive); and RPCs that had reentered cell cycle for 15 hr (CldU;IdU-positive) in the mouse retinas were counted and shown in the graph. Error bars denote SD (n = 5, five independent litters). *p < 0.05; **p < 0.01; ***p < 0.001; ****p < 0.0001. (D) Relative mRNA levels of Hif1a, hexokinase 2 (Hk2), and pyruvate kinase M2 (Pkm2) in P0 mouse retinas with the indicated genotypes were examined by real-time quantitative polymerase chain reaction (RT-qPCR). The y-axis values are relative 2-ΔCt values against those of Tsc1fl/+;Tyrp1-Cre mouse retinas. Error bars, SD (n = 4, three independent litters). (E) Expressions of the indicated proteins in the mouse retinas were examined by Western blot (WB). Relative amounts of the proteins used in each sample were determined by WB detection of β-actin. (F) Relative WB band intensities of the proteins are determined by the ImageJ software and shown in the graph. Error bars, SD (n = 3, three independent litters). (G) Distributions of Pkm2, Tom20, and hypoxyprobe-labeled proteins in the mouse retinas were examined by immunostaining. (H) P0 Tsc1fl/fl;Tyrp1-Cre littermate mice were injected with a chemical inhibitor of glycolysis (2DG) or mitochondrial oxidative phosphorylation (Metformin), and the eye sections of the mice were obtained at 12 hr post-injection for the immunodetection of RPCs that had proliferated (CldU-positive) and/or reentered second cell cycle (CldU;IdU-positive) for 15 hr. Relative numbers of those cells in the mouse retinas were shown in the graphs in (I) and (J), respectively. Error bars, SD (n = 5, four independent litters). (K) Schematic diagram depicts the mTORC1-Hif1a-glycolysis cascade in developmental RPC clonal hyperexpansion, which leads to senescence-associated degeneration of MG in the mature retina.
Figure 7—figure supplement 1
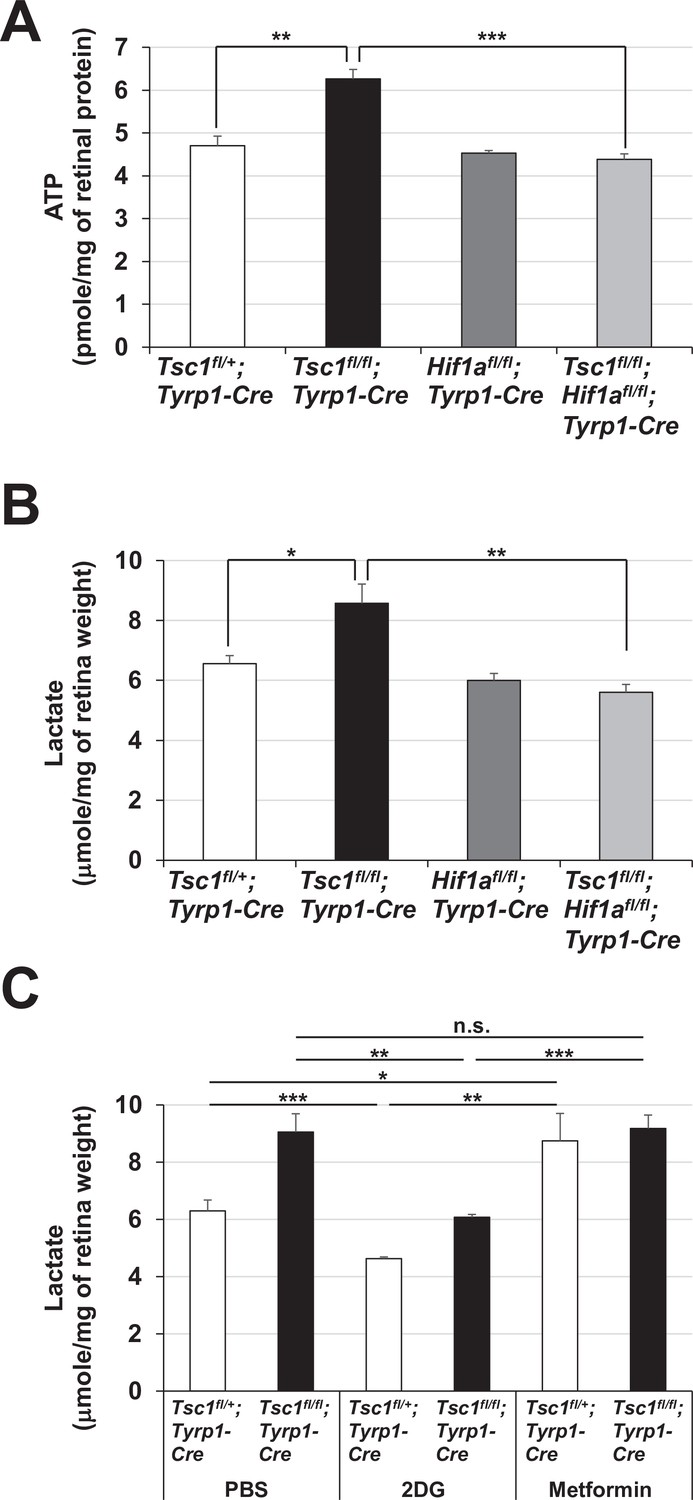
Enhanced glycolytic ATP synthesis in Tsc1fl/fl;Tyrp1-Cre mouse retinas.
Levels of ATP (A) and lactate (B) in P0 mouse retinal lysates were determined as described in Materials and methods and shown in the graphs. (C) P0 Tsc1fl/+;Tyrp1-Cre and Tsc1fl/fl;Tyrp1-Cre littermate mice were injected peritoneally with PBS, 2-deoxy-D-glucose (2DG) (500 mg/kg), and metformin (250 mg/kg). The retinas were then isolated from the mice after 12 hr and the levels of lactate in the mouse retinas were determined. Error bars denote SD (n = 4, four independent litters). *p < 0.05; **p < 0.01; ***p < 0.001; n.s., not significant.
Author response image 1
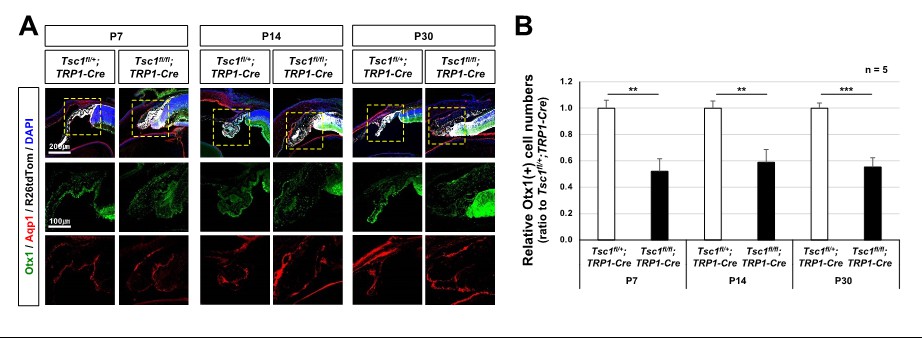
CB malformation in Tsc1f/f;TRP1-Cre mouse eyes.
(A) Distribution of CB cells in the littermate mouse eyes was investigated by immunostaining of specific markers, such as Otx1 and Aqp1. (B) Numbers of Otx1-stained nuclei in the peripheral part of the eye sections were counted and relative numbers against Tsc1f/+;TRP1-Cre samples are shown in the graph. **, p<0.01; ***, p<0.001.
Author response image 2
Degeneration of retinal neurons in Tsc1f/f;TRP1-Cre adult mice.
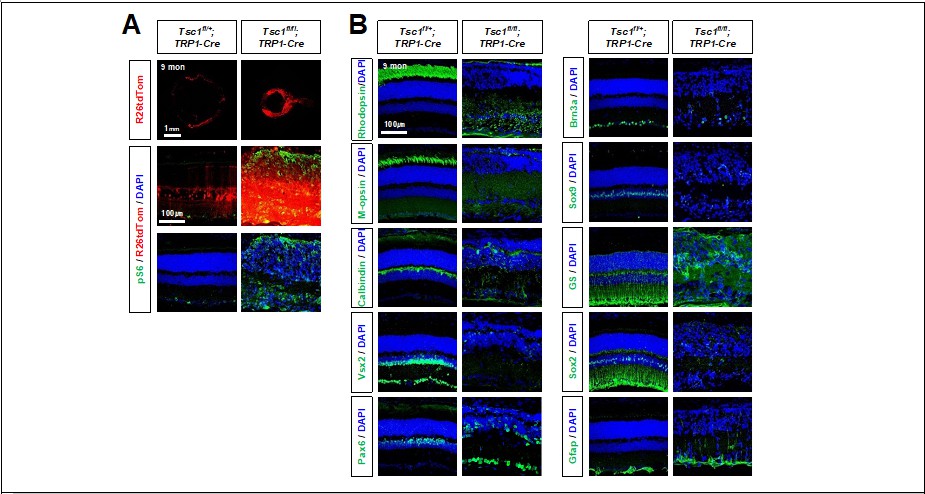
(A) Distribution of Cre-affected cells in 9 months-old littermate mouse retinas are visualized by R26tdTom reporter. Activation of mTORC1 in the retinas were determined by pS6 immunostaining. (B) Distribution of retinal cell type-specific markers (explained in Figure 1 and Figure 1 —figure supplement 2) in the retinas were also investigated by immunostaining.
Author response image 3

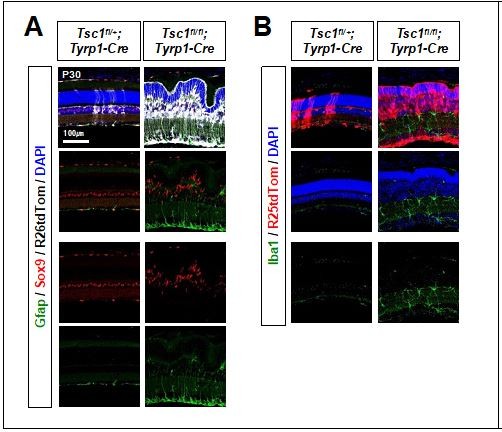
Activation and gliosis of MG in the mouse retinas were determined by co-staining of Sox9, a MG marker, and Gfap, which is expressed in astrocytes and activated MG.
Author response image 4
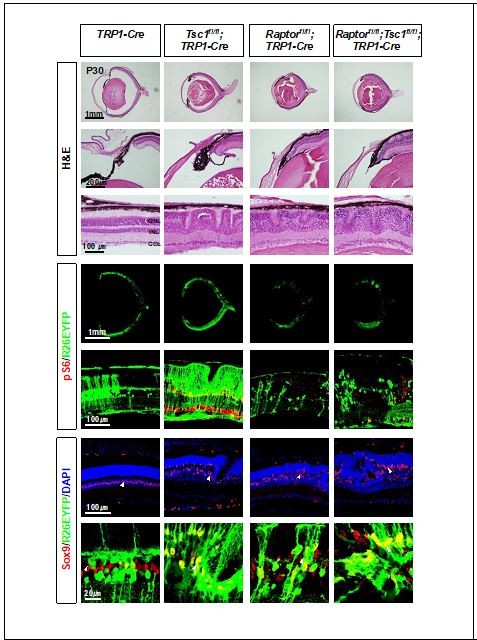
Eye and retinal structures of P30 littermate mice with indicated genotypes were investigated by H&E staining.
Distribution of the Cre-affected cells and mTORC1 activation of the cells were examined by the immunostaining of R26EYFP and pS6, respectively.
Author response image 5

Proliferation of MG in P14 littermate mouse retinas was determined by the presence of GS-positive MG, which incorporated EdU for 24h.
Author response image 6
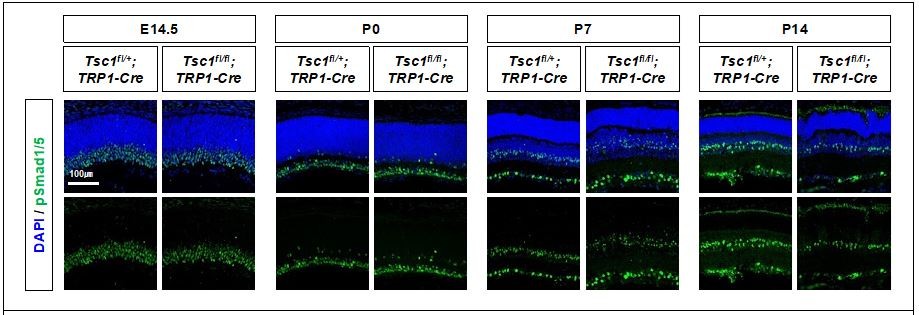
Activity of BMP signaling pathway in mouse retinas were determined indirectly by detecting phosphorylated Smad 1 and 5 (pSmad1/5), which are induced by BMP-activated receptors.
Author response image 7
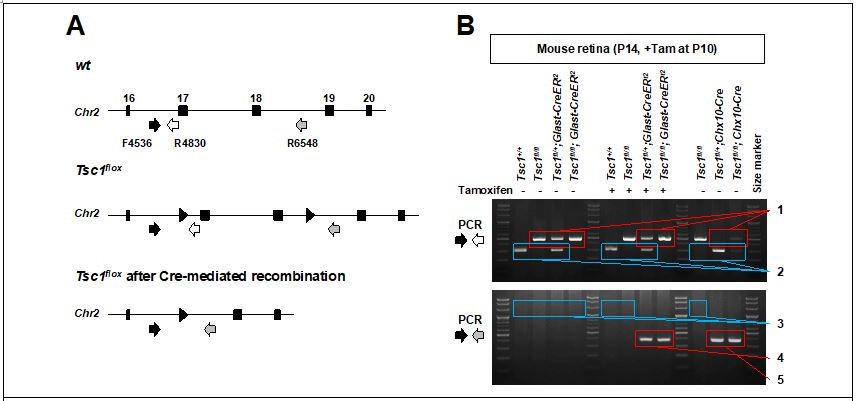
PCR detection of Glast-CreER-mediated deletion in mouse Tsc1 gene locus.
(A) Schematic diagram of Tsc1 gene locus of wt and Tsc1flox mice. (B) Agarose gel images of DNA bands amplified by the PCR with indicated primers. 1. loxP containing DNA fragments of Tsc1 gene, which were not affected by Cre recombinase (495bp). 2. wt DNA fragments of Tsc1 gene (295bp). 3. 2.01kbp and 2.24kbp DNA fragments are expected to be amplified from wt and Tsc1flox alleles, respectively. However, those are too big to be amplified in our PCR condition (extension time = 60 seconds). 4. Tsc1 exon 17&18 were deleted in MG subpopulation by Glast-CreERt2 only upon Tam injection (368bp). 5. Tsc1 exon 17&18 were deleted in majority retinal cells by Chx10-Cre (368bp).
Author response image 8
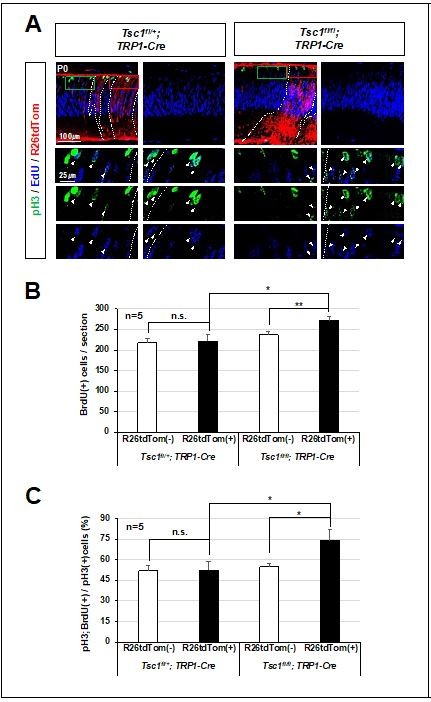
Relative overproliferation of Tsc1-deficient RPCs in Tsc1f/f;TRP1-Cre mouse retina.
(A) EdU-labeled proliferating cells and those moved to G2/M phase of cell cycle to express pH3 in P0 mouse retinas were examined by co-immunostaining after the injection of EdU to the mice at 3 h prior to tissue preparation. (B) Numbers of EdU-labeled proliferating cells in R26tdTom(+) Cre-affected cell areas and R26tdTom(-) wild-type cell areas were counted and shown in the graph. (C) Numbers of EdU;pH3-positive cells in R26tdTom(+) Cre-affected areas and R26tdTom(-) wild-type cell areas were counted and shown in the graph.
Author response image 9
Distribution of glia in the mouse retina.
Tables
Key resources table
| Reagent type (species) or resource | Designation | Source or reference | Identifiers | Additional information |
|---|---|---|---|---|
| Antibody | Anti-Aquaporin(AQP1)(Mouse monoclonal) | Novus Biologicals | NB600-749 | IHC (1:200) |
| Antibody | Anti-beta-actin(Rabbit polyclonal) | Santa Cruz Biotechnology | sc-1616 | WB (1:1000) |
| Antibody | Anti-beta-catenin(Rabbit polyclonal) | Cell Signaling Technology | 9562 | IHC (1:200) |
| Antibody | Anti-beta-galactosidase(Mouse monoclonal) | Developmental Studies Hybridoma Bank (DSHB) | JIE7 | WB (1:500)IHC (1:100) |
| Antibody | Anti-BrdU(CldU)(Rat monoclonal) | Novus Biologicals | NB500-169 | IHC (1:200) |
| Antibody | Anti-BrdU(IdU)(Mouse monoclonal) | EXBIO | 11–286 C100 | IHC (1:200) |
| Antibody | Anti-Brn3b(Rabbit polyclonal) | Santa Cruz Biotechnology | sc-31989 | IHC (1:200) |
| Antibody | Anti-Calbindin(Rabbit polyclonal) | Swant Inc. | CB-38 | IHC (1:200) |
| Antibody | Anti-Cdo(Goat polyclonal) | R&D Systems | AF2429 | IHC (1:200) |
| Antibody | Anti-c-myc(Mouse monoclonal) | Santa Cruz Biotechnology | sc40 | WB (1:1000) |
| Antibody | Anti-Cleaved caspase-3(Rabbit polyclonal) | Cell Signaling Technology | 9661 | IHC (1:200) |
| Antibody | Anti-Ezrin(Mouse monoclonal) | Invitrogen Biotechnology | 35–7300 | IHC (1:200) |
| Antibody | Anti-GFAP(Rabbit polyclonal) | Abcam | ab48050 | IHC (1:200) |
| Antibody | Anti-GFP(Chicken polyclonal) | Abcam | ab13970 | IHC (1:2000) |
| Antibody | Anti-Glutamine synthase (Rabbit polyclonal) | Sigma-Aldrich | G-2781 | IHC (1:200) |
| Antibody | Anti-Hif1a(Mouse monoclonal) | R&D Systems | MAB1536 | WB (1:1000) |
| Antibody | Anti-Hif2α/Epas1(Rabbit polyclonal) | Novus Biologicals | NB100-122 | WB (1:1000) |
| Antibody | Anti-Hk2(Rabbit polyclonal) | Cell Signaling Technology | 2867 | WB 1:1,000IHC (1:200) |
| Antibody | Anti-Hydroxy-Hif1alpha(Rabbit polyclonal) | Cell Signaling Technology | 3434 | WB (1:1000) |
| Antibody | Anti-M-opsin | Merck Millipore | AB5405 | IHC (1:200) |
| Antibody | Anti-Otx2(Rabbit polyclonal) | Abcam | ab25985 | IHC (1:200) |
| Antibody | Anti-Otx2(Rabbit polyclonal) | Abcam | ab183951 | IHC (1:200) |
| Antibody | Anti-Otx2(Goat polyclonal) | R&D Systems | AF1979-SP | IHC (1:200) |
| Antibody | Anti-p21/Cip1(Mouse monoclonal) | Santa Cruz Biotechnology | SC817 | WB (1:1000)IHC (1:200) |
| Antibody | Anti-p53(Mouse monoclonal) | Merck Millipore | OP03-100 | WB (1:1000)IHC (1:200) |
| Antibody | Anti-Pax6(Rabbit polyclonal) | Covance | PRB-278P | IHC (1:200) |
| Antibody | Anti-Phospho Smad1/5(S463/465)(Rabbit polyclonal) | Invitrogen Biotechnology | 700047 | IHC (1:200) |
| Antibody | Anti-phospho Smad2(ser465/467)(Rabbit polyclonal) - | Cell Signaling Technology | 18338 | IHC (1:200) |
| Antibody | Anti-phospho-Histone H3(S10) (pH3; Rabbit polyclonal) | Merck Millipore | 04–1093 | IHC (1:200) |
| Antibody | Anti-phospho-S6(S235/236) (pS6; Rabbit polyclonal) | Cell Signaling Technology | 2211 | WB (1:1000)IHC (1:200) |
| Antibody | Anti-Psmb8(Mouse monoclonal) | Enzo Life Science | BML-PW8845 | WB (1:1000) |
| Antibody | Anti-Psmb9(Mouse monoclonal) | Santa Cruz Biotechnology | sc-373996 | WB (1:1000) |
| Antibody | Anti-Psmb10(Rabbit polyclonal) | Abcam | ab1183506 | WB (1:1000) |
| Antibody | Anti-Raptor(Rabbit polyclonal) | Cell Signaling Technology | 2280 | WB (1:1000) |
| Antibody | Anti-PKM2(Rabbit polyclonal) | Abgent | ap7173d | WB (1:1000) |
| Antibody | Anti-PKM2(Rabbit polyclonal) | Cell Signaling Technology | 4053 | IHC (1:200) |
| Antibody | Anti-Recoverin(Rabbit polyclonal) | Chemicon | AB5585 | WB (1:1000) |
| Antibody | Anti-RPE65(Mouse monoclonal) | Abcam | ab13826 | WB (1:1000) |
| Antibody | Anti-Rhodopsin(Mouse monoclonal) | Chemicon | MAB5356 | IHC (1:200) |
| Antibody | Anti-S6(Mouse monoclonal) | Cell Signaling Technology | 2317 | WB (1:1000) |
| Antibody | Anti-Tom20(Rabbit polyclonal) | Santa Cruz Biotechnology | sc-11415 | WB (1:1000) |
| Antibody | Anti-Tsc1(Rabbit polyclonal) | Cell Signaling Technology | 4906 | WB (1:1000) |
| Antibody | Anti-Tsc2(Rabbit polyclonal) | Cell Signaling Technology | 3612 | WB (1:1000) |
| Antibody | Anti-Tubulin-ßIII (Tuj1; Mouse monoclonal) | Covance | MMS-435P | IHC (1:200) |
| Antibody | Anti-Vsx2(Mouse monoclonal) | Santa Cruz Biotechnology | sc365519 | WB (1:1000)IHC (1:200) |
| Genetic reagent (Mus musculus) | B6.129-Hif1atm3Rsjo/J | Jackson Laboratory | 007561 | Hif1аfl/fl |
| Genetic reagent (Mus musculus) | B6.Cg-Rptortm1.1Dmsa/J | Jackson Laboratory | 013188 | Rptorfl/fl |
| Genetic reagent (Mus musculus) | Tsc1tm1Djk/J | Jackson Laboratory | 005680 | Tsc1fl/fl |
| Genetic reagent (Mus musculus) | Tsc2tm2.1Djk/Mmjax | Jackson Laboratory | 37154-JAX | Tsc2fl/fl |
| Genetic reagent (Mus musculus) | CAG-loxP-3xpolyA-loxP-mTERT-IRES-Hygro-r | Hidema et al., 2016 | dTert | |
| Genetic reagent (Mus musculus) | Tg(Tyrp1-cre)1Ipc | Mori et al., 2002 | Tyrp1-Cre | |
| Genetic reagent (Mus musculus) | Tg(Mlana-cre)5Bee | Aydin and Beermann, 2011 | Mlana-Cre | |
| Genetic reagent (Mus musculus) | Tg(Chx10-EGFP/cre,-ALPP)2Clc | Rowan and Cepko, 2004 | Chx10-Cre | |
| Genetic reagent (Mus musculus) | Tg(Pax6-cre,GFP)2Pgr | Marquardt et al., 2001 | Pax6-аCre | |
| Genetic reagent (Mus musculus) | Tg(Rax-cre)1Zkoz | Klimova et al., 2013 | Rax-Cre | |
| Genetic reagent (Mus musculus) | Tg(Slc1a3-cre/ERT)1Nat/J | Jackson Laboratory | 012586 | Slc1a3-CreERT2 |
| Genetic reagent (Mus musculus) | B6.129 × 1-Gt(ROSA)26Sortm1(EYFP)Cos/J | Jackson Laboratory | 006148 | R26EYFP |
| Genetic reagent (Mus musculus) | B6.Cg-Gt(ROSA)26Sortm14(CAG-tdTomato)Hze/J | Jackson Laboratory | 007914 | R26tdTomato |
| Genetic reagent (Mus musculus) | Tg(Tyrp1-cre/ERT2)1Jwk | This paper | Tyrp1-CreERT2 | |
| Genetic reagent (Mus musculus) | B6-Psmb8em1hwl Psmb9em1hwl/Korl | This paper | Psmb8-/-,9-/- | |
| Genetic reagent (Mus musculus) | B6-Psmb10em1Jwk | This paper | Psmb10-/- | |
| Chemical compound, drug | Phalloidin-AlexaFluor 647 | Abcam | ab176759 | 1:200 |
| Chemical compound, drug | Hoechst 33,342 | Invitrogen | H1399 | 1:1,000 |
| Chemical compound, drug | Click-iT EdU Cell Proliferation Kit for Imaging, Alexa Fluor 647 dye | Invitrogen | C10340 | |
| Chemical compound, drug | 2-Deoxy-D-glucose | Sigma-Aldrich | D6134 | |
| Chemical compound, drug | Metformin hydrochloride | Sigma-Aldrich | PHR1084 | |
| Chemical compound, drug | 2-Chloro-5-deoxyuridine (CldU) | Sigma-Aldrich | C6891 | |
| Chemical compound, drug | 5-Iodo-2′-deoxyuridine | Sigma-Aldrich | I7125 | |
| Chemical compound, drug | Methyl cellulose | Sigma-Aldrich | M7140 | |
| Chemical compound, drug | L-Glutamine | GIBCO | 25030–081 | |
| Chemical compound, drug | B27 supplement | GIBCO | 17504–044 | |
| Chemical compound, drug | N2 supplement | GIBCO | 17502–048 | |
| Chemical compound, drug | Heparin | Millipore | M535142 | |
| Chemical compound, drug | Protease inhibitor | Millipore | M535142 | |
| Peptide, recombinant protein | Dnase I | Sigma-Aldrich | DN25-100mg | |
| Peptide, recombinant protein | Epidermal growth factor (EGF) | Sigma-Aldrich | E4127 | |
| Peptide, recombinant protein | Fibroblast growth factor 2(hBFGF) | Sigma-Aldrich | F0291 | |
| Commercial assay or kit | ENLITEN ATP Assay System | Promega | FF2000 | |
| Commercial assay or kit | Lactate-Glo Assay | Promega | J5021 | |
| Commercial assay or kit | SuperSignal West Pico plus chemiluminescent substrate | Thermo Scientific | 34580 | |
| Commercial assay or kit | SuperSignal West Femto plus chemiluminescent substrate | Thermo Scientific | 34095 | |
| Commercial assay or kit | In situ Cell death Detection Kit, TMR-red | Roche | 12156792910 | |
| Commercial assay or kit | In situ Cell Death Detection Kit, Fluorescein (TUNEL green) | Roche | 11684 795910 | |
| Commercial assay or kit | Hypoxyprobe Kit | Hypoxyprobe | HP1-100kit | |
| Software, algorithm | Fluoview 4.0 | Olympus Corporation | N/A | |
| Software, algorithm | Imaris 9.3 | Bitplane | N/A | |
| Software, algorithm | GraphPad Prism v7.0 | GraphPad software | N/A | |
| Sequence-based reagent | Actinß1-forward | Bioneer | RT-qPCR primer | CTGGCTCCTAGCACCATGAAGAT |
| Sequence-based reagent | Actinß1-reverse | Bioneer | RT-qPCR primer | GGTGGACAGTGAGGCCAGGAT |
| Sequence-based reagent | Pkm2-forward | Bioneer | RT-qPCR primer | TCGCATGCAGCACCTGATT |
| Sequence-based reagent | Pkm2-reverse | Bioneer | RT-qPCR primer | CCTCGAATAGCTGCAAGTGGTA |
| Sequence-based reagent | Hk2-forward | Bioneer | RT-qPCR primer | TGATCGCCTGCTTATTCACGG |
| Sequence-based reagent | Hk2-reverse | Bioneer | RT-qPCR primer | AACCGCCTAGAAATCTCCAGA |
| Sequence-based reagent | Hif1a-forward | Bioneer | RT-qPCR primer | ACCTTCATCGGAAACTCCAAAG |
| Sequence-based reagent | Hif1a-reverse | Bioneer | RT-qPCR primer | CTGTTAGGCTGGGAAAAGTTAGG |
| Sequence-based reagent | Psmb8-forward | Bioneer | Genotyping primer | TTGGTACTGTGGCTTTCGCTTTC |
| Sequence-based reagent | Psmb8-reverse | Bioneer | Genotyping primer | ACACTCCTTCCTCTGTGCCACC |
| Sequence-based reagent | Psmb9-forward | Bioneer | Genotyping primer | GACCTTGAGTCGGTCACCTCC |
| Sequence-based reagent | Psmb9-reverse | Bioneer | Genotyping primer | CACTTAGGGCCACCAGCTTCC |
| Sequence-based reagent | Psmb10-forward | Bioneer | Genotyping primer | ACGCGAGTCACCCCA ATGTTT |
| Sequence-based reagent | Psmb10-reverse | Bioneer | Genotyping primer | CGCCACAACCGAATCGTTAGT |
| Sequence-based reagent | Psmb8-gRNA forward | Bioneer | CRISPR/Cas9 | TCGGGGGCAGCGGCCCGAGTGGG |
| Sequence-based reagent | Psmb8-gRNA reverse | Bioneer | CRISPR/Cas9 | CCAGGGCAGCCCACTCGGGCCGC |
| Sequence-based reagent | Psmb9-gRNA forward | Bioneer | CRISPR/Cas9 | GGAGTTTGACGGGGGTGTCGTGG |
| Sequence-based reagent | Psmb9-gRNA reverse | Bioneer | CRISPR/Cas9 | CCCACCACGACACCCCCGTCAAA |
| Sequence-based reagent | Psmb10-gRNA #3 forward | Bioneer | CRISPR/Cas9 | CACCGAACACGTCCTTCCGGGACTT |
| Sequence-based reagent | Psmb10-gRNA #3 reverse | Bioneer | CRISPR/Cas9 | AAACAAGTCCCGGAAGGACGTGTTC |
| Sequence-based reagent | Psmb10-gRNA #5 forward | Bioneer | CRISPR/Cas9 | CACCGCTGCCAGAGGAATGCGTCCT |
| Sequence-based reagent | Psmb10-gRNA #5 reverse | Bioneer | CRISPR/Cas9 | AAACAGGACGCATTCCTCTGGCAGC |
Additional files
-
Transparent reporting form
- https://cdn.elifesciences.org/articles/70079/elife-70079-transrepform1-v2.docx
-
Source data 1
Uncropped Western blot (WB) images for those used in Figures 5C and I–7E are provided.
- https://cdn.elifesciences.org/articles/70079/elife-70079-supp1-v2.pdf
-
Source data 2
Uncropped Western blot (WB) images for those used in Figure 1—figure supplement 2B, Figure 5—figure supplement 3A, Figure 5—figure supplement 3A, Figure 5—figure supplement 3B, Figure 6—figure supplement 2B are provided.
- https://cdn.elifesciences.org/articles/70079/elife-70079-supp2-v2.pdf
-
Source data 3
Uncropped WB scan images for Main Figures.
- https://cdn.elifesciences.org/articles/70079/elife-70079-supp3-v2.zip
-
Source data 4
Uncropped WB scan images for figure supplements 1.
- https://cdn.elifesciences.org/articles/70079/elife-70079-supp4-v2.zip
-
Source data 5
Uncropped WB scan images for figure supplements 2.
- https://cdn.elifesciences.org/articles/70079/elife-70079-supp5-v2.zip
Download links
A two-part list of links to download the article, or parts of the article, in various formats.
Downloads (link to download the article as PDF)
Open citations (links to open the citations from this article in various online reference manager services)
Cite this article (links to download the citations from this article in formats compatible with various reference manager tools)
mTORC1-induced retinal progenitor cell overproliferation leads to accelerated mitotic aging and degeneration of descendent Müller glia
eLife 10:e70079.
https://doi.org/10.7554/eLife.70079


