Dysfunctional TRPM8 signalling in the vascular response to environmental cold in ageing
- Section of Vascular Biology and Inflammation, School of Cardiovascular Medicine and Sciences, BHF Centre of Research Excellence, King’s College London, United Kingdom
- Cancer Research UK, Cambridge Institute, University of Cambridge, United Kingdom
- Skin Research Institute, Agency of Science, Technology, and Research (A*STAR), Singapore
Figures
Figure 1 with 1 supplement

Cold-induced vascular response is impaired with ageing.
(a) Diagram illustrates the experimental setup of cold-induced vascular response protocol; FLPI from top measures the blood flow in the hindpaw of the anaesthetised mouse when on a heating mat in response to cold water immersion. The expanded component (highlighted by dotted red lines) shows the hindpaw region in which the blood flow is recorded, and a graph of typical blood flow response is shown. Recording is paused for cold treatment where one of the hindpaw is immersed in cold water for 5 min. (b) Representative FLPI image shows the blood flow in cold-treated hind paw at baseline, 2 min and 30 min after the cold water treatment. (c) Graph shows the raw blood flow trace (mean ± s.e.m.) of vascular response with cold (4 °C) water treatment (n = 8). (d) % change in hindpaw blood flow from baseline to 0–2 min following cold water treatment (maximum vasoconstriction). (e) The AUC to maximum vasoconstriction point assessed by area under the curve (AUC). (f) Time of blood flow recovery immediately after maximum vasoconstriction until the start of the plateau period. (g–h) RT-PCR CT analysis shows fold change of P21 and P16 gene expression normalised to three housekeeping genes in dorsal root ganglia (DRG) of young and aged mice. (i) Representative western blot of p21 in hindpaw skin of young and aged mice and densitometric analysis normalised to GAPDH. (BL = baseline). Data is presented as mean and all error bars indicate s.e.m. (n = 6–11) **p < 0.01, ***p < 0.001. (Two-tailed Student’s t-test).
Figure 1—figure supplement 1
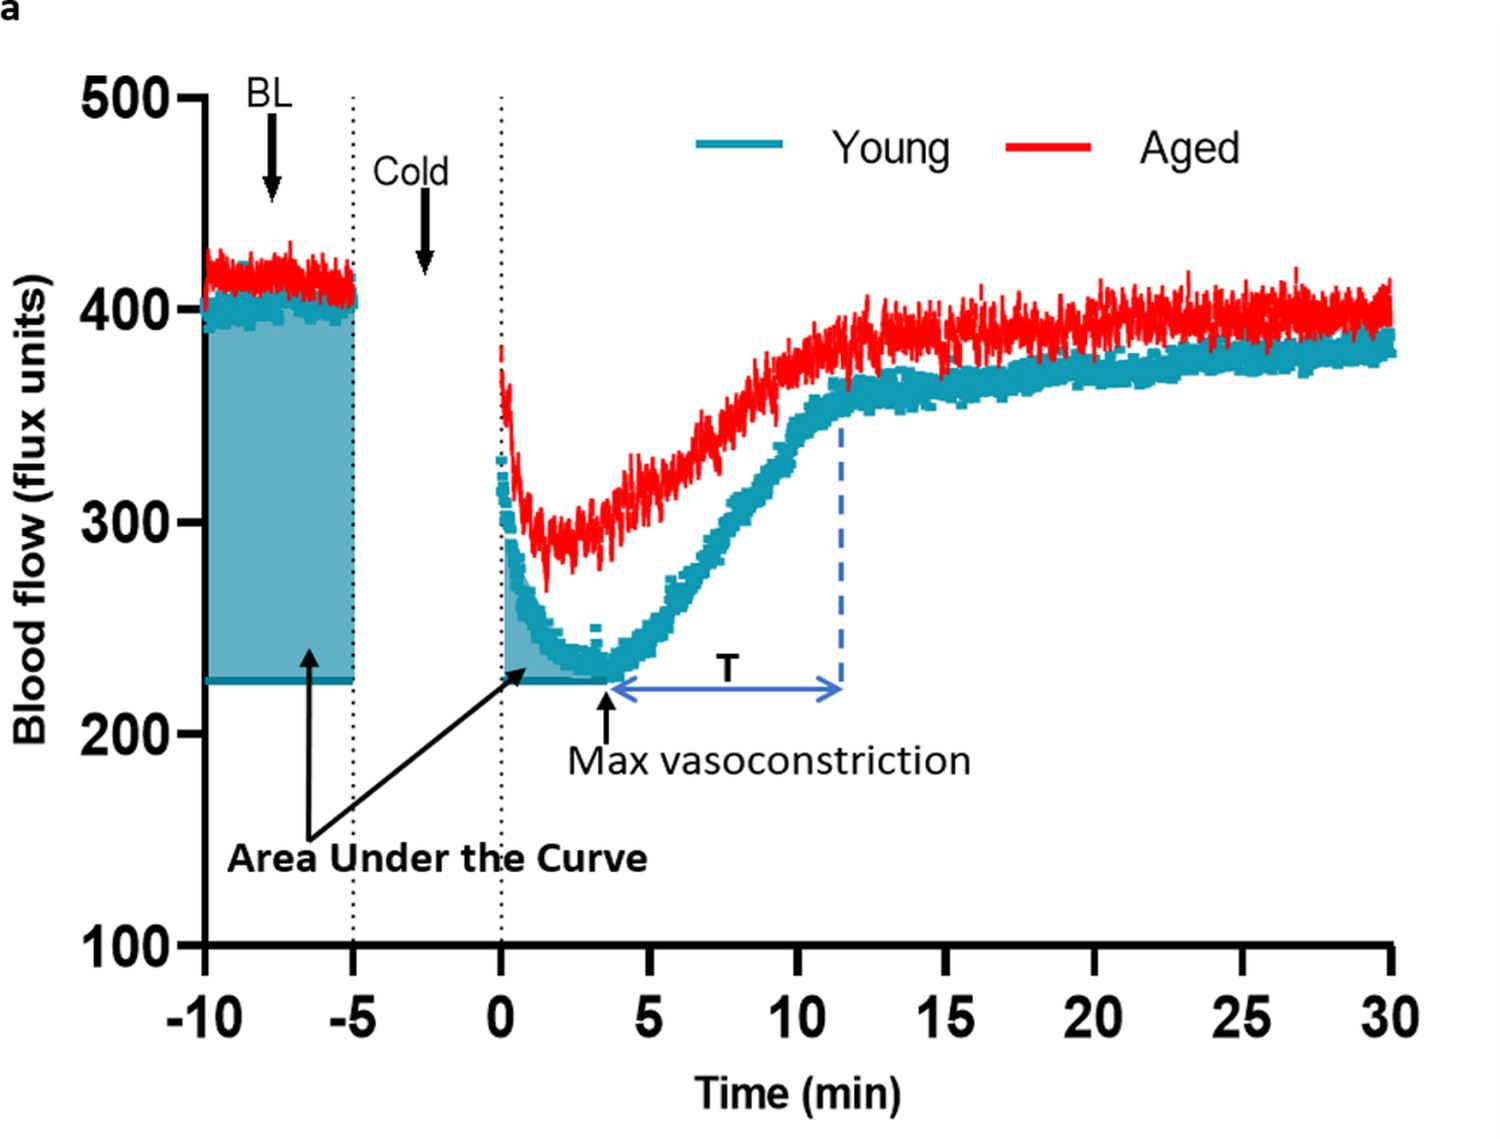
Analysis of cold-induced blood flow in the mouse paw.
(a) The blood flow graph from cold treatment was used to calculate the maximum vasoconstriction, area under the curve (AUC) analysis of vasoconstriction and recovery of blood flow from cold treatment. It was not possible to measure blood flow whilst the paw was being cooled. The highlighted areas in blue shows the area of the graph from start of the 5 min baseline (BL) until peak vasoconstriction that was used to calculate the AUC analysis to detail the magnitude of the vasoconstrictor event. The time of immediate blood flow recovery (T) was calculated by measuring the time immediately after maximum vasoconstriction until it started to plateau back to baseline level (as shown by blue lines). (BL = Baseline). The maximum change of blood flow (%) was calculated using the equation below.
Figure 2 with 1 supplement
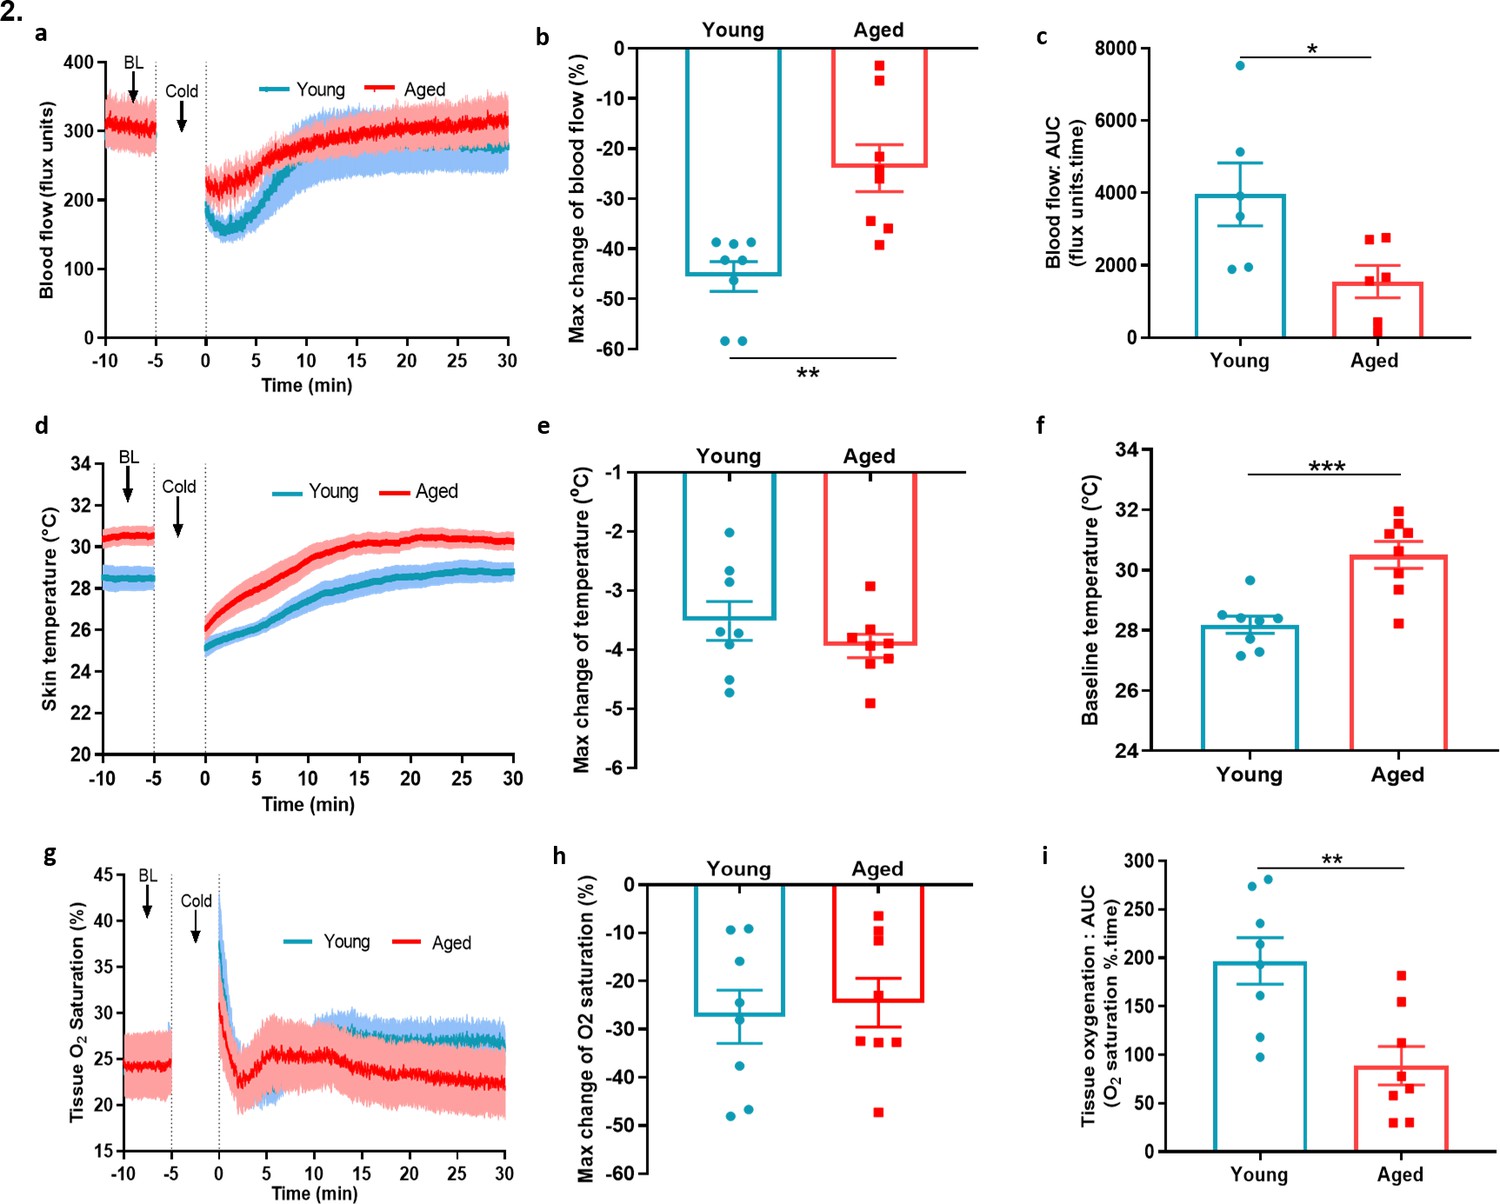
Blood flow, skin temperature and tissue oxygen saturation with cold treatment in ageing.
(a) The mean ± s.e.m. blood flow trace of the vascular response with cold (4 °C) water treatment (n = 8). (b) % change in hindpaw blood flow from baseline to 0–2 min following cold treatment (maximum vasoconstriction). (c) The vasoconstriction response caused by cold water treatment represented by area under curve (AUC). (d) The mean ± s.e.m. recordings of hindpaw skin temperature with cold water treatment. (e) Maximum reduction in skin temperature following 5 min cold treatment. (f) The baseline skin temperature. (g) % mean ± s.e.m. tissue oxygen saturation during cold water treatment. (h) % maximum change in tissue oxygen saturation from baseline following cold water treatment (i) % tissue oxygen saturation recovery after cold water treatment assessed by area under the curve. (BL = baseline). Data is presented as mean and all error bars indicate s.e.m. (n = 8) *p < 0.05, **p < 0.01, ***p < 0.001. (Two-tailed Student’s t-test).
Figure 2—figure supplement 1
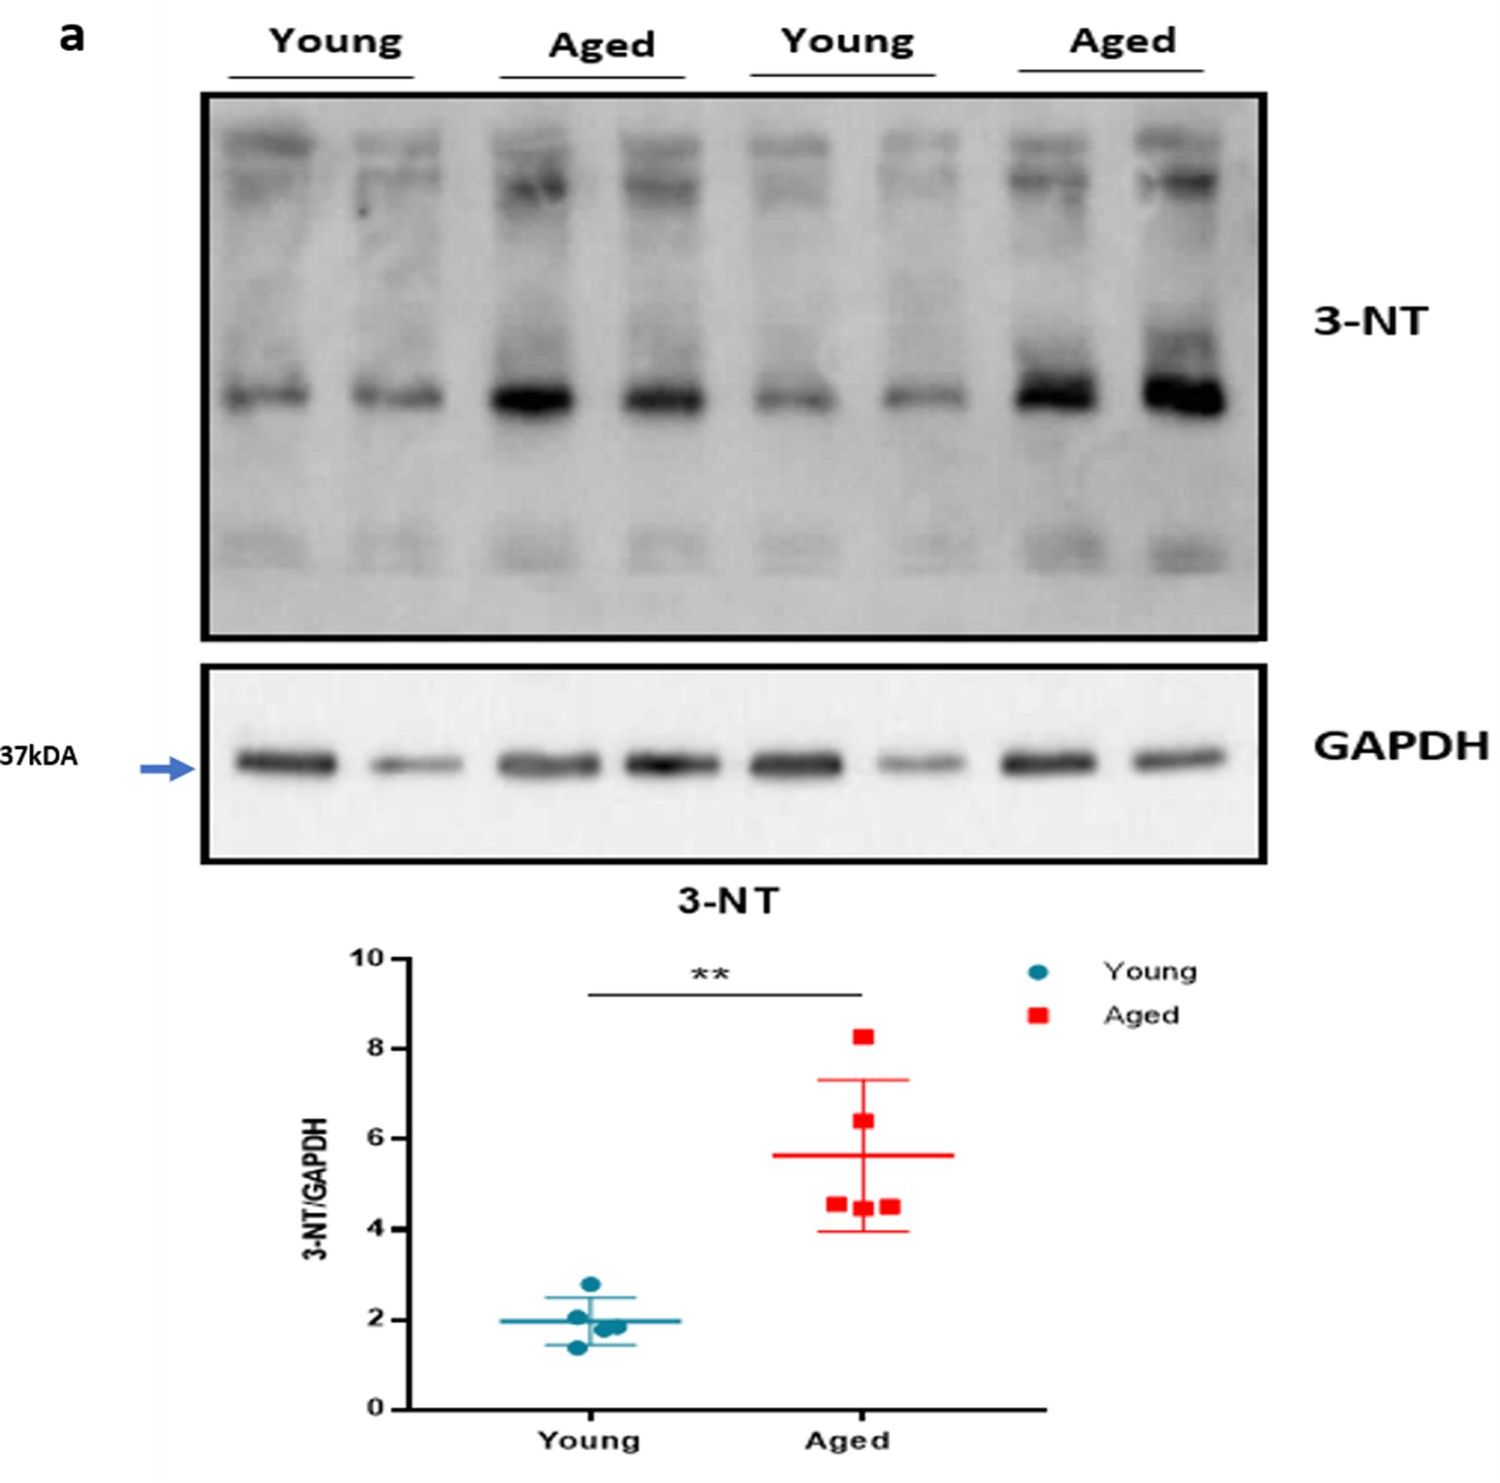
Oxidative stress with ageing.
(a) The representative western blot analysis of 3-nitrotyrosine (3-NT), which is a biomarker of oxidative stress produced by reactive nitrogen species, in hind paw skin of naïve young and aged mice. The densitometric analysis is shown normalised to GAPDH housekeeping gene. Results are shown as mean ± s.e.m. (n = 5) **p < 0.01. (Two-tailed Student’s t-test).
Figure 3
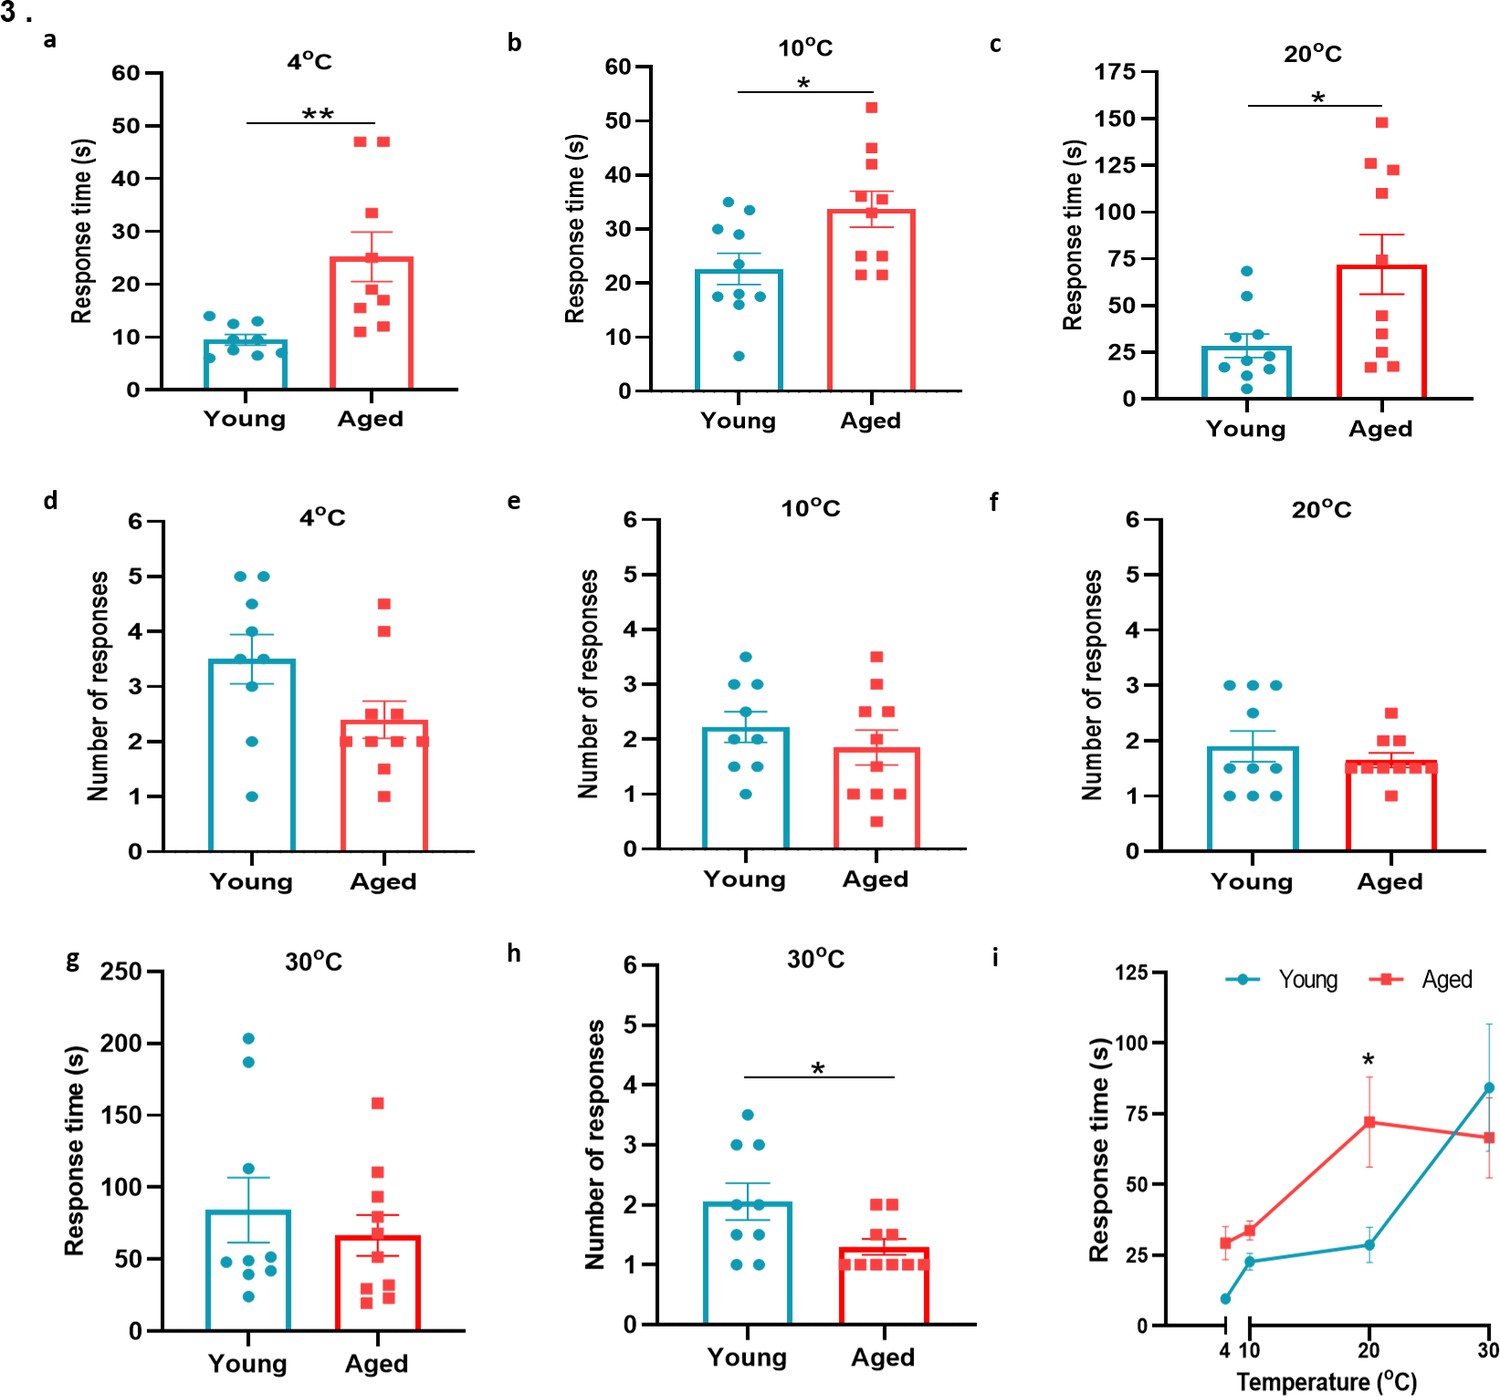
Behavioural analysis with cold plate in young and aged mice.
(a–c) Time of first response of mice to cold plate set at 4 °C, 10 °C, and 20 °C. (d-f) The total number of responses from mice during the cold plate experiment at 4 °C, 10 °C, and 20 °C. (g–h) Time of first response of mice to cold plate set at 30 °C and total number of responses. (i) Line graph illustrates the difference in mean response time at the four different temperatures the cold plate assay was performed, between young and aged mice. All results are shown as mean ± s.e.m. (n = 9–10) *p < 0.05, **p < 0.01. (Two-tailed Student’s t-test or [Two-way ANOVA with Tukey’s post hoc test]).
Figure 4
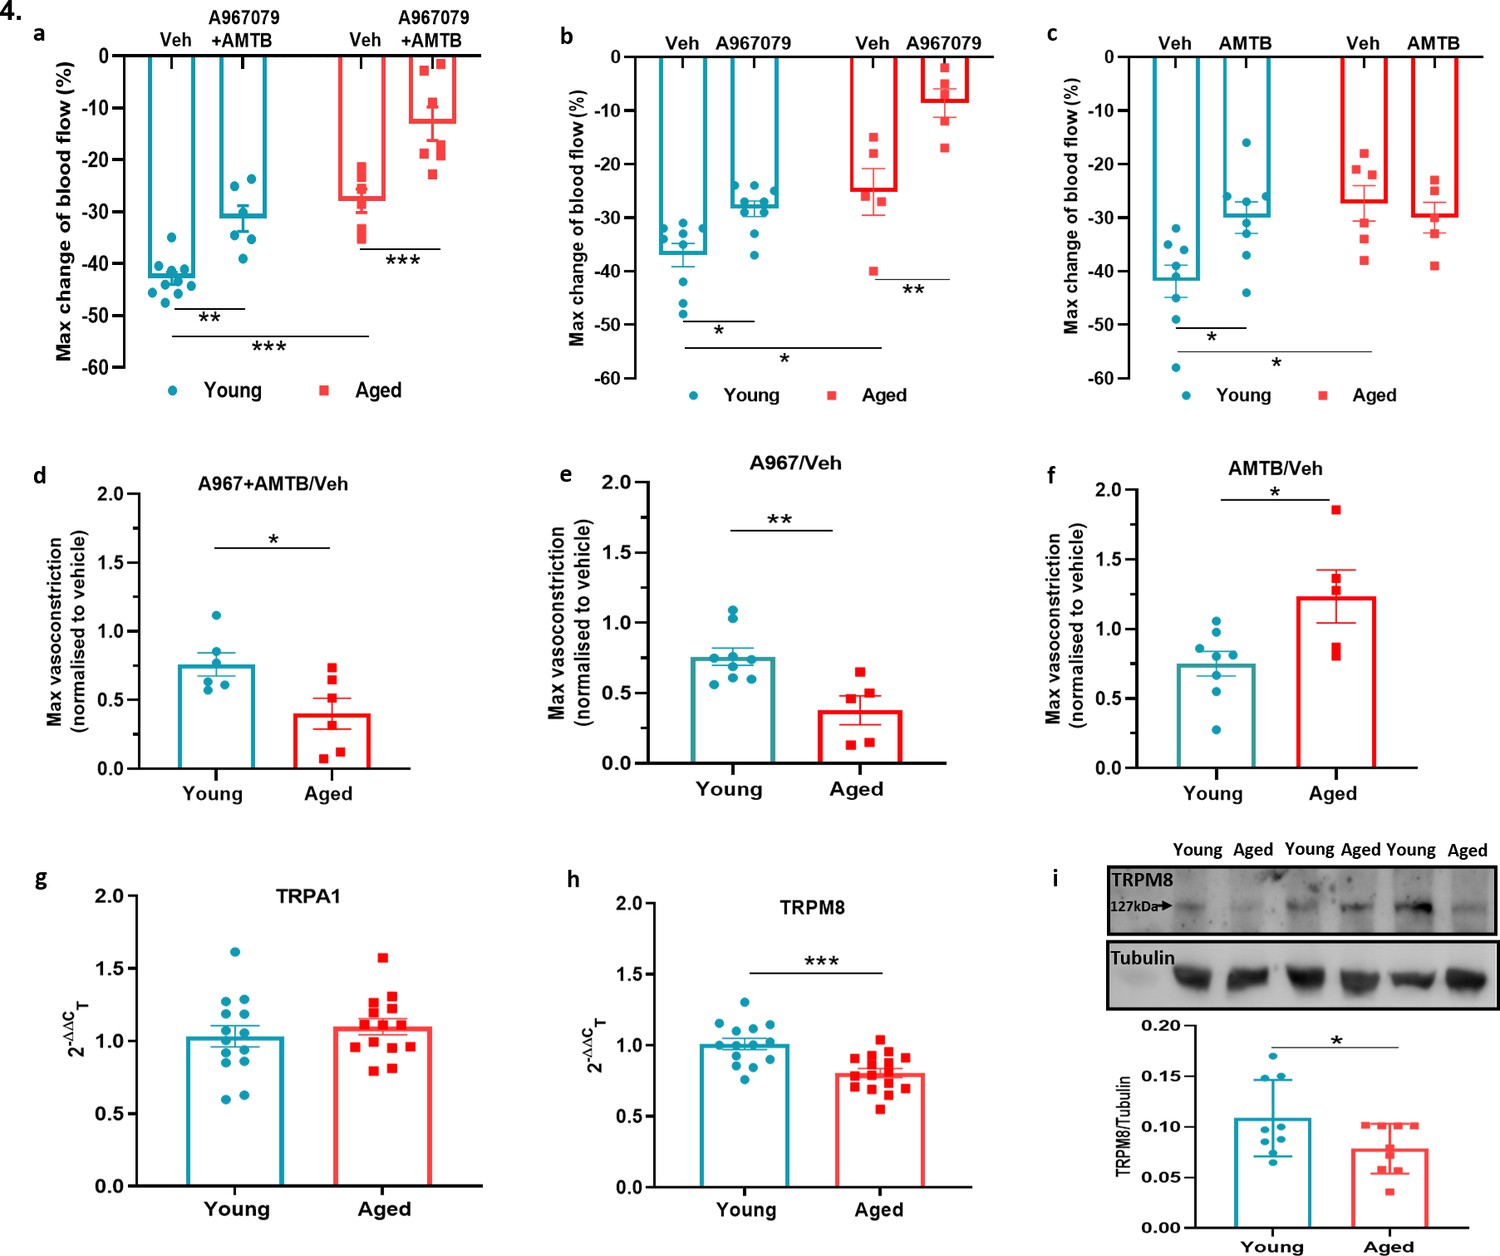
TRPA1 and TRPM8 are involved in cold-induced vascular response.
Vascular responses with cold (4 °C) water treatment in mice pre-treated with combined TRPA1 antagonist A967079 (100 mg kg–1) and TRPM8 antagonist AMTB (10 mg kg–1), or vehicle control (Veh - 10 % DMSO, 10 % Tween in saline) i.p. 30 min before cold treatment. (a–c) % change in hindpaw blood flow from baseline to 0–2 min following cold treatment (maximum vasoconstriction) in mice treated with combined antagonist (a) A967079+ AMTB, (b) A967079, and (c) AMTB. (d-f) Maximum vasoconstriction caused by cold water treatment in mice treated with combined antagonist (d) A967079+ AMTB, (e) A967079, and (f) AMTB normalised against vehicle treated mice. (n = 5–10) (g–h) RT-PCR CT analysis shows fold change of (g) Trpa1 and (h) Trpm8 normalised to three housekeeping genes in DRG. (n = 14–15) (i) Representative western blot of TRPM8 in DRG of young and aged mice and densitometric analysis normalised to Tubulin (Y = young, A = aged) (n = 9). All results are shown as mean ± s.e.m. *p < 0.05, **p < 0.01, ***p < 0.001. (Two-way ANOVA with Tukey’s post hoc test or Student’s t-test).
Figure 5 with 1 supplement

TRPA1 and TRPM8 activity deteriorates with ageing (a) Graph shows the % mean ± s.e.m.
of blood flow change from baseline in response to topical application of menthol (10%) and vehicle (Veh - 10 % DMSO in ethanol) in ear of young and aged mice. (b) % maximum change in ear blood flow induced by menthol application in young and aged mice. (c) AUC analysis of % blood flow increase from baseline after menthol application compared to vehicle. (d) Graph shows the % mean ± s.e.m. of blood flow change from baseline in response to topical application of cinnamaldehyde (10 % CA) and vehicle (10 % DMSO in ethanol) in ear of young and aged mice. (e) % maximum change in ear blood flow induced by CA application in young and aged mice. (f) AUC analysis of % blood flow increase from baseline after CA application compared to vehicle. (g) Graph shows the % mean ± s.e.m. of blood flow change from baseline in response to topical application of capsaicin (10%) and vehicle (10 % DMSO in ethanol) in ear of young and aged mice. (h) % maximum change in ear blood flow induced by capsaicin application in young and aged mice. (i) AUC analysis of % blood flow increase from baseline after capsaicin application compared to vehicle. All results are shown as mean ± s.e.m. (n = 5–11) *p < 0.05, **p < 0.01, ***p < 0.001. (Two-way ANOVA with Tukey’s post hoc test).
Figure 5—figure supplement 1
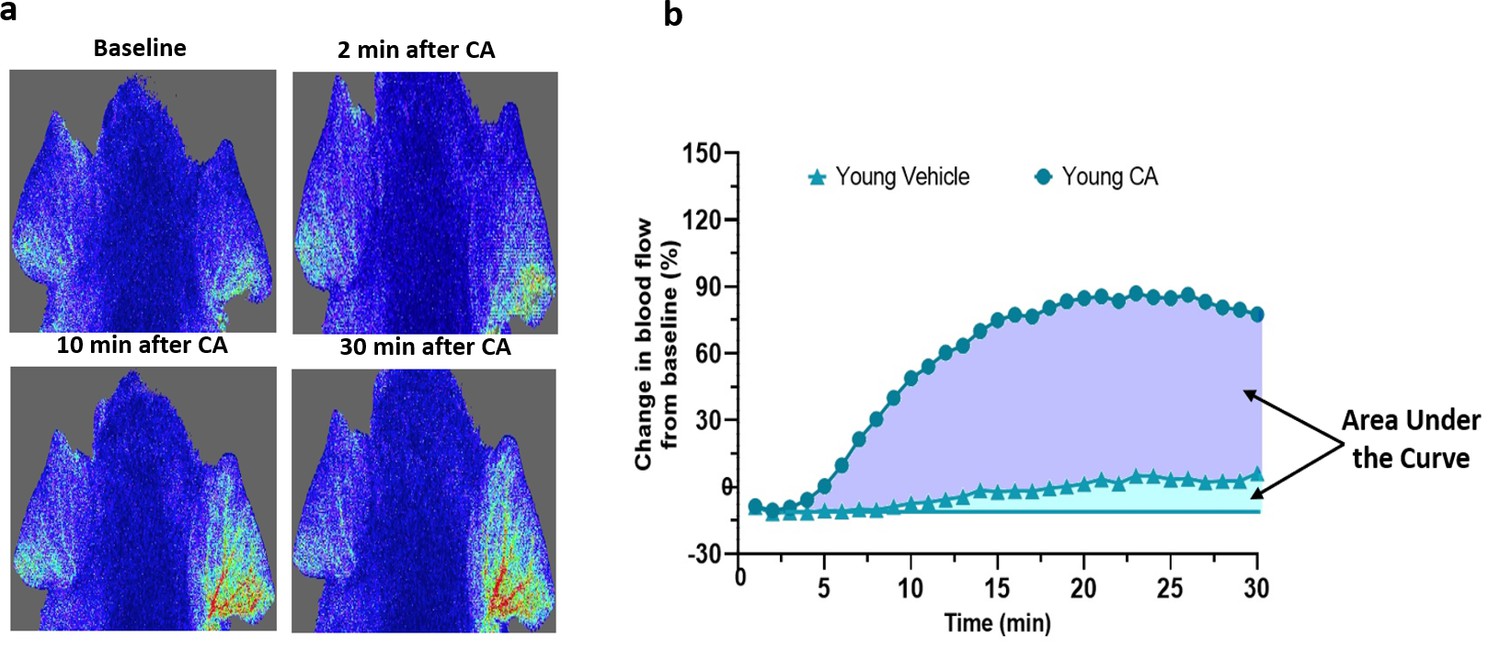
Agonist induced blood flow response in mouse ear.
(a) The representative image from FLPI shows the blood flow response induced by topical application of vehicle (left ear) and 10 % cinnamaldehyde (right ear) in the anaesthetised mouse. (b) The representative blood flow response graph illustrates the area used for the area under the curve analysis for vehicle (light blue) and cinnamaldehyde (purple).
Figure 6 with 1 supplement
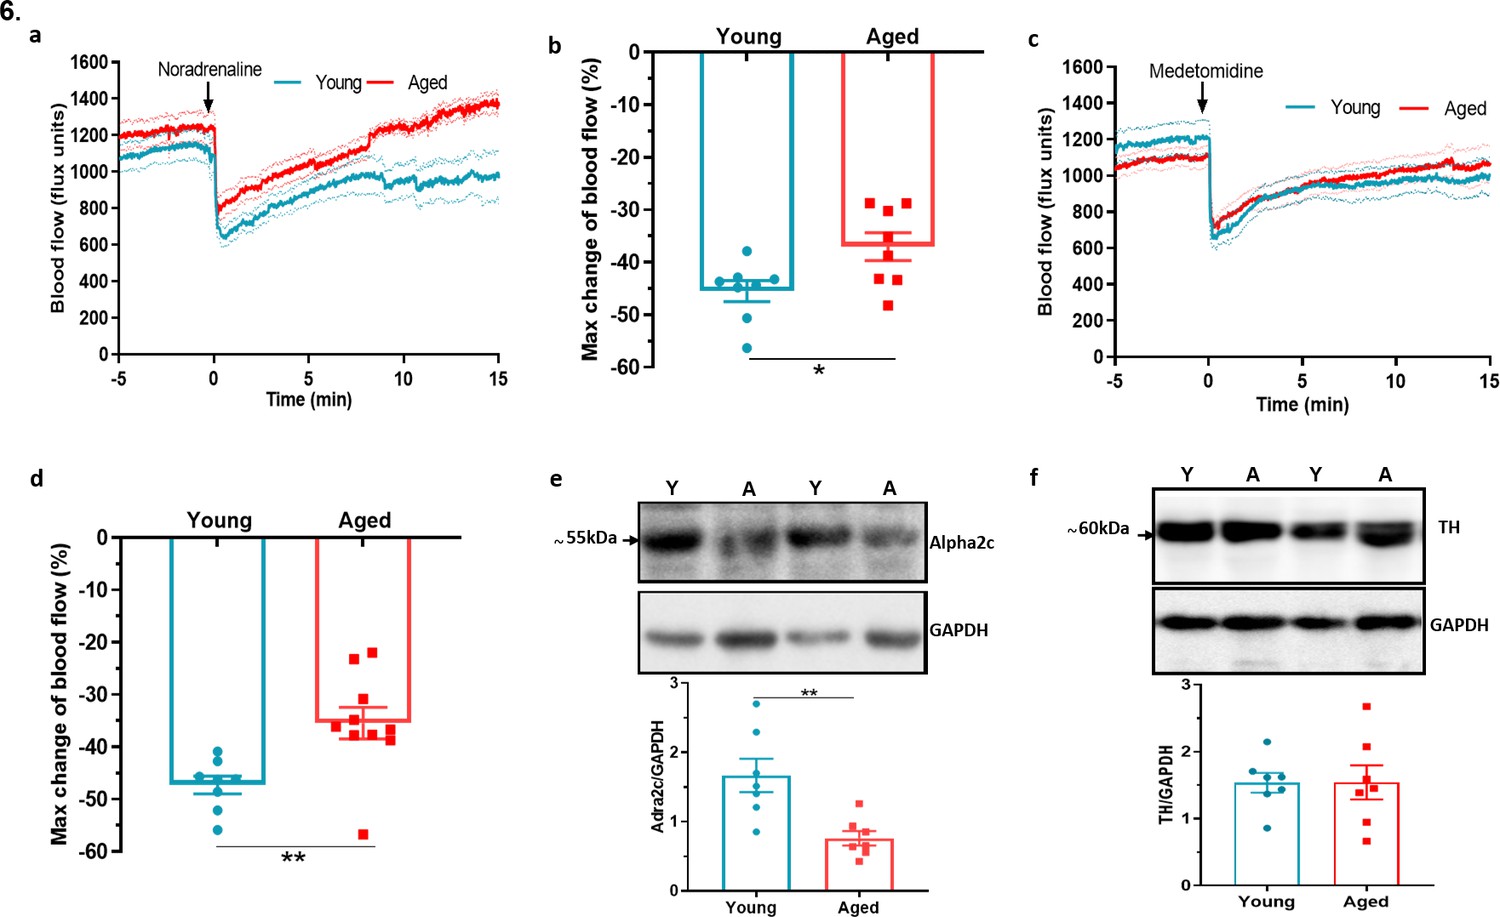
Dysfunctional sympathetic signalling in ageing (a) Graph shows the mean ± s.e.m.
blood flow in hindpaw with intraplantar injection of noradrenaline (1.25 ng/µl in saline in 20 µl) in young and aged mice (n = 8). (b) % maximum change in blood flow from baseline induced by noradrenaline (maximum vasoconstriction). (c) Graph shows the mean ± s.e.m. blood flow in hindpaw with intraplantar injection of medetomidine (1.25 ng/µl in saline in 20 µl) in young and aged mice (n = 8–10) (d) % maximum change in blood flow from baseline induced by medetomidine (maximum vasoconstriction). (e) Representative western blot of alpha2C (α2c) adrenoceptor in mice hindpaw skin with densitometric analysis normalised to GAPDH. (f) Representative western blot of tyrosine hydroxylase (TH) in mice hindpaw skin with densitometric analysis normalised to GAPDH (Y = young, A = aged). (n = 7) *p < 0.05, **p < 0.01. (Two-tailed Student’s t-test).
Figure 6—figure supplement 1
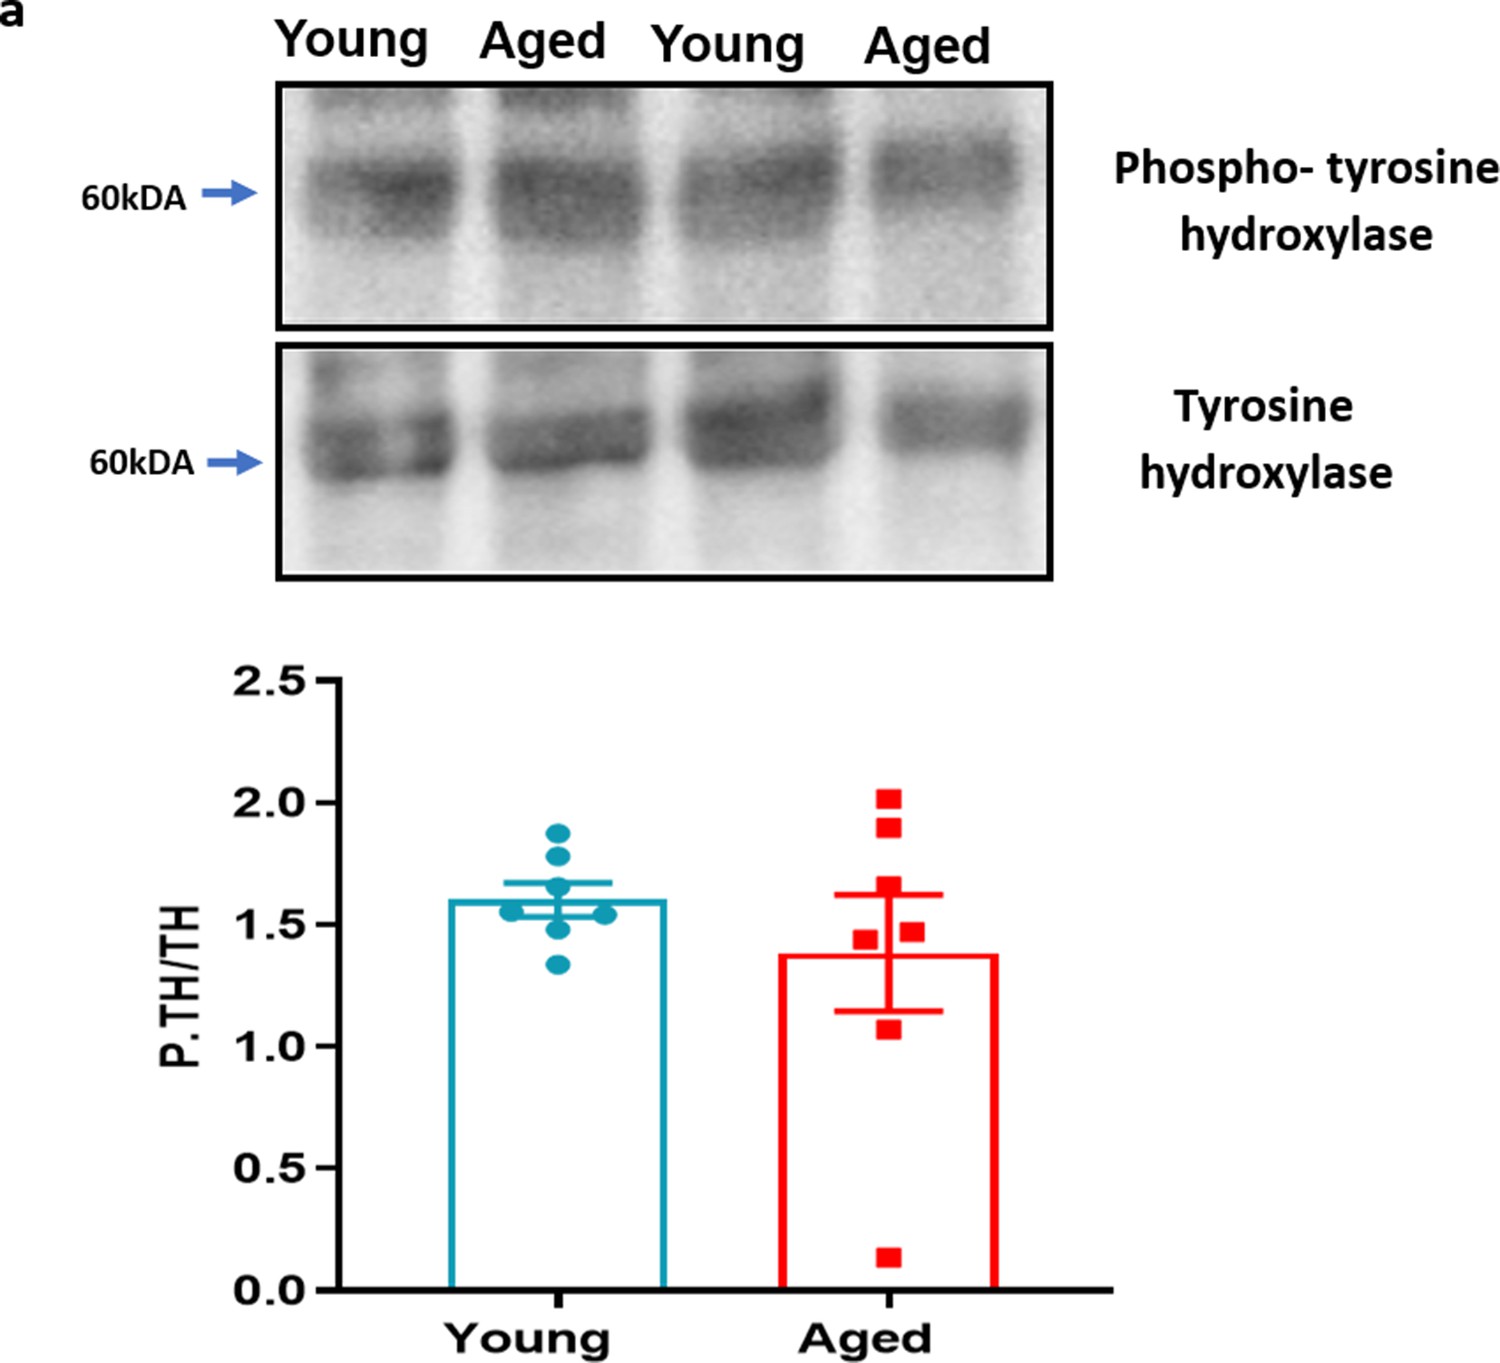
Phospho-tyrosine hydroxylase with ageing.
(a) The representative western blot analysis of phospho-tyrosine hydroxylase in hind paw skin of naïve young and aged mice. The densitometric analysis is normalised to total tyrosine hydroxylase. Results are shown as mean ± s.e.m. (n = 7) (Two-tailed Student’s t-test).
Figure 7 with 2 supplements
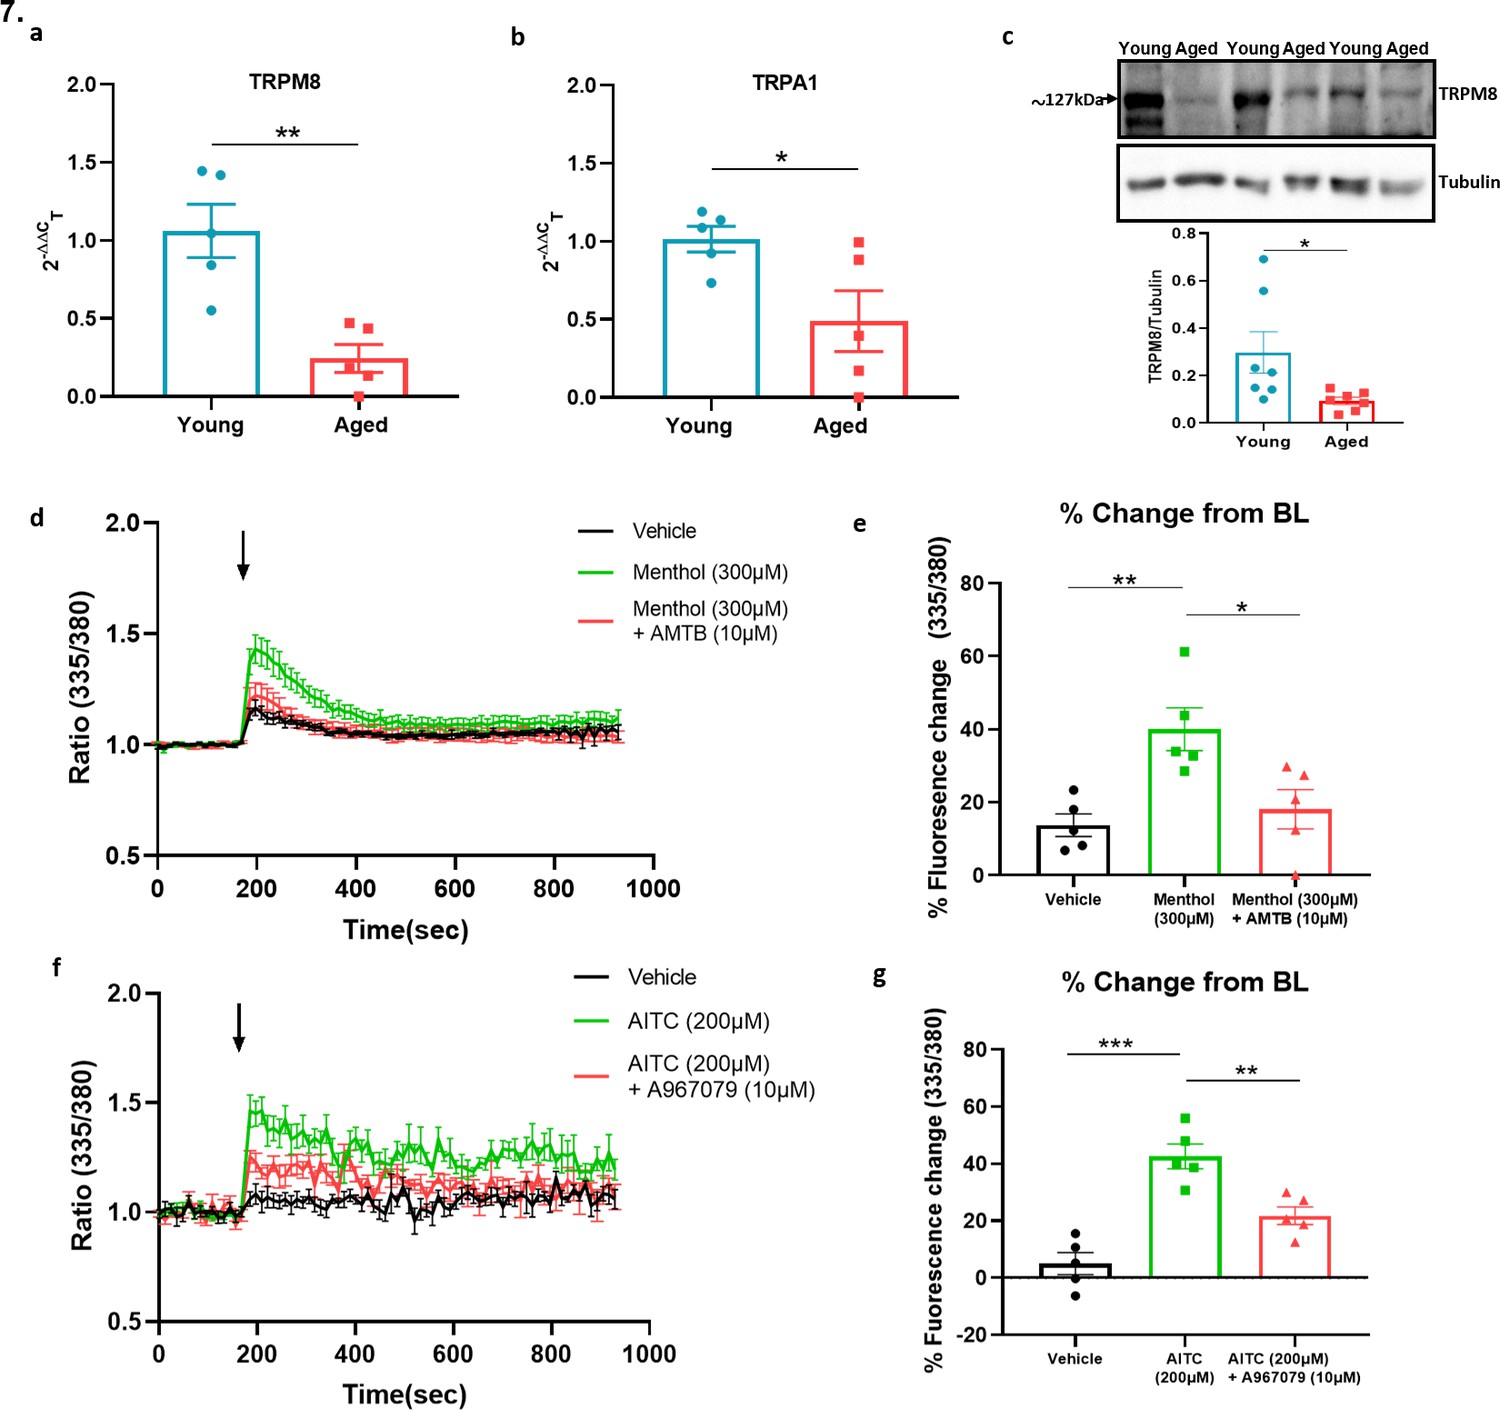
Sympathetic-sensory signalling and influence of ageing.
(a–b) RT-PCR CT analysis shows the expression and fold change of Trpa1 and Trpm8 in young and aged SG normalised to three housekeeping genes collected from the cervical and thoracic paravertebral region. (c) The western blot analysis of TRPM8 in SG of young and aged mice. All results are shown as mean ± s.e.m. (n = 5–7) *p < 0.05, **p < 0.01. (Two-tailed Student’s t-test). (d) Shows the raw trace of intracellular calcium change (mean ± s.e.m.) induced by menthol (300 µM) shown by the ratiometric fura-2 fluorescence change over time. (e) Maximum % change in fluorescence change from baseline caused by menthol in the presence and absence of AMTB (10 µM). (f) Shows the raw trace of intracellular calcium change (mean ± s.e.m.) induced by AITC (200 µM) shown by the ratiometric fura2 fluorescence change over time. (g) Maximum % change in fluorescence change from baseline caused by AITC in the presence and absence of A967079 (10 µM). Arrow represents the time-point of agonist injection. n = 5 independent experiments, where each treatment was a mean of replicate values. All results are shown as mean ± s.e.m. *p < 0.05, **p < 0.01, ***p < 0.01. (One-way ANOVA with Tukey’s post hoc test or Two-tailed Student’s t-test).
Figure 7—figure supplement 1
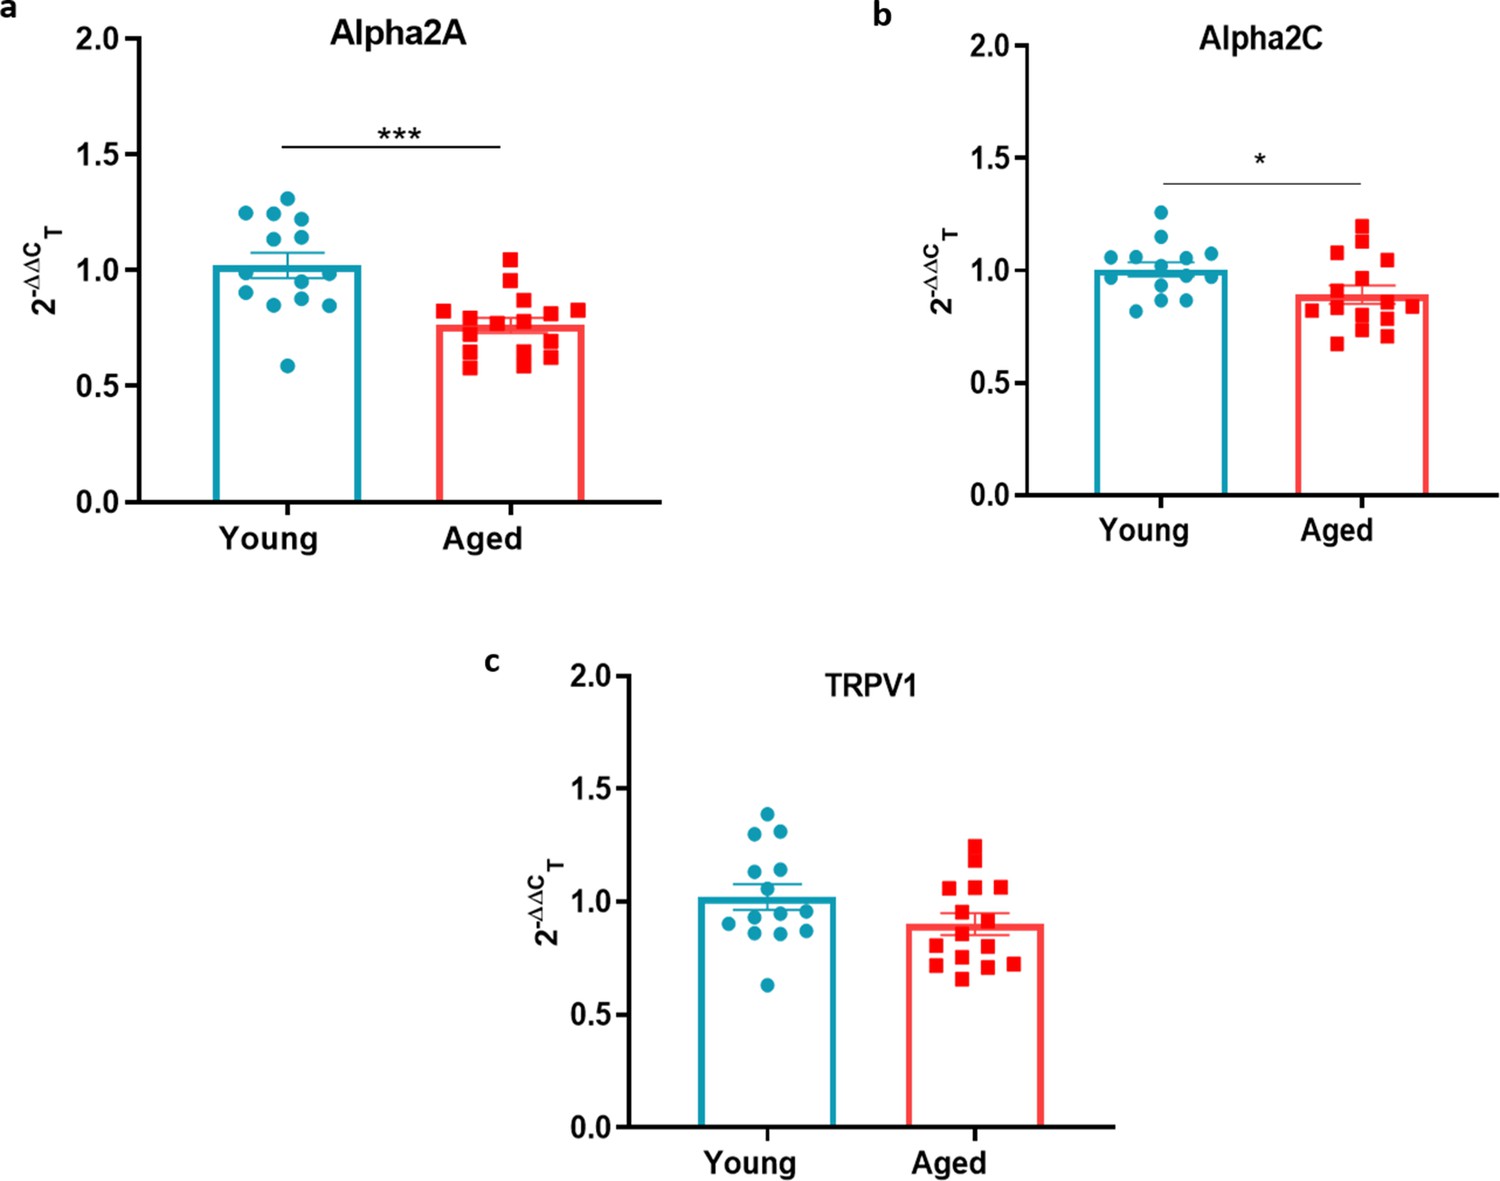
Sympathetic-sensory signalling in young and aged mice.
(a–c) RT-PCR CT analysis shows fold change of α2a adrenoceptor, α2c adrenoceptor and Trpv1 in young and aged mice normalised to three housekeeping genes in (DRG). Results are shown as mean ± s.e.m. (n = 14–16) *p < 0.05, ***p < 0.001. (Two-tailed Student’s t-test).
Figure 7—figure supplement 2
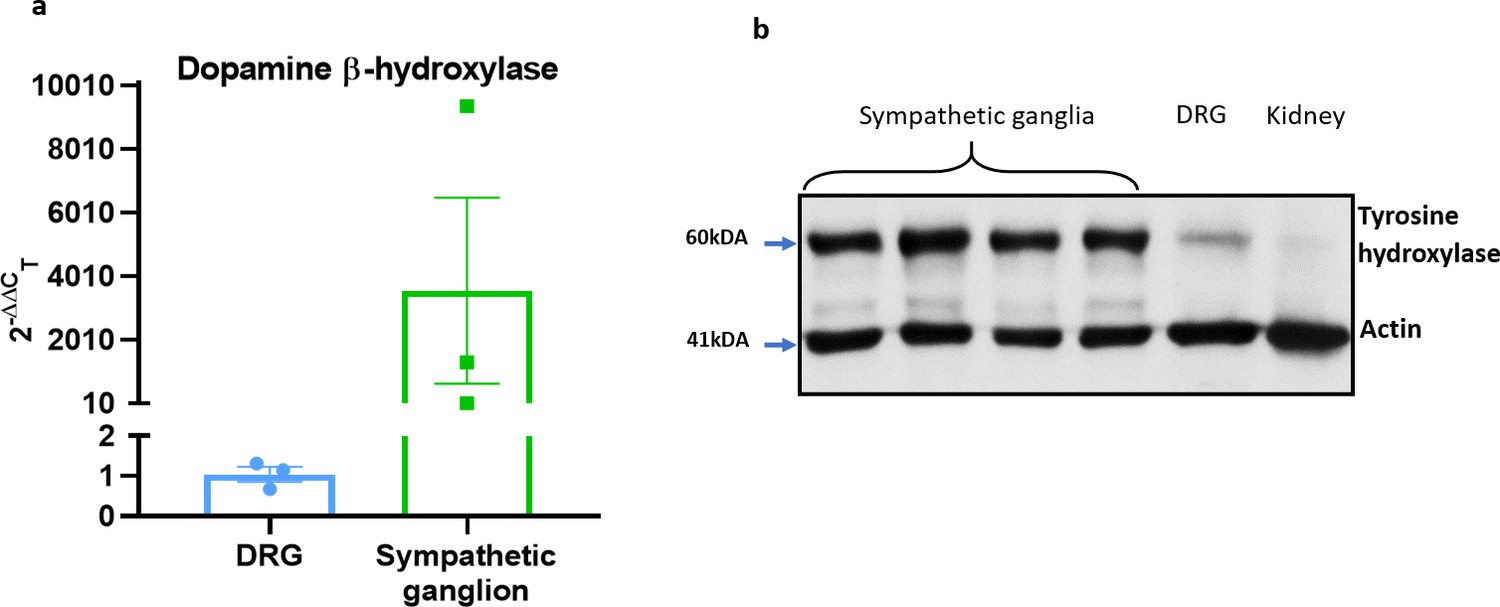
Characterisation of sympathetic markers.
(a) RT-PCR CT analysis shows fold change of the sympathetic nerve marker Dopamine β-hydroxylase (Dbh) in DRG and SG normalised to three housekeeping genes. (b) The western blot analysis of the sympathetic nerve marker tyrosine hydroxylase (TH) in SG, DRG and kidney. Results are shown as mean ± s.e.m. (n = 3).
Figure 8
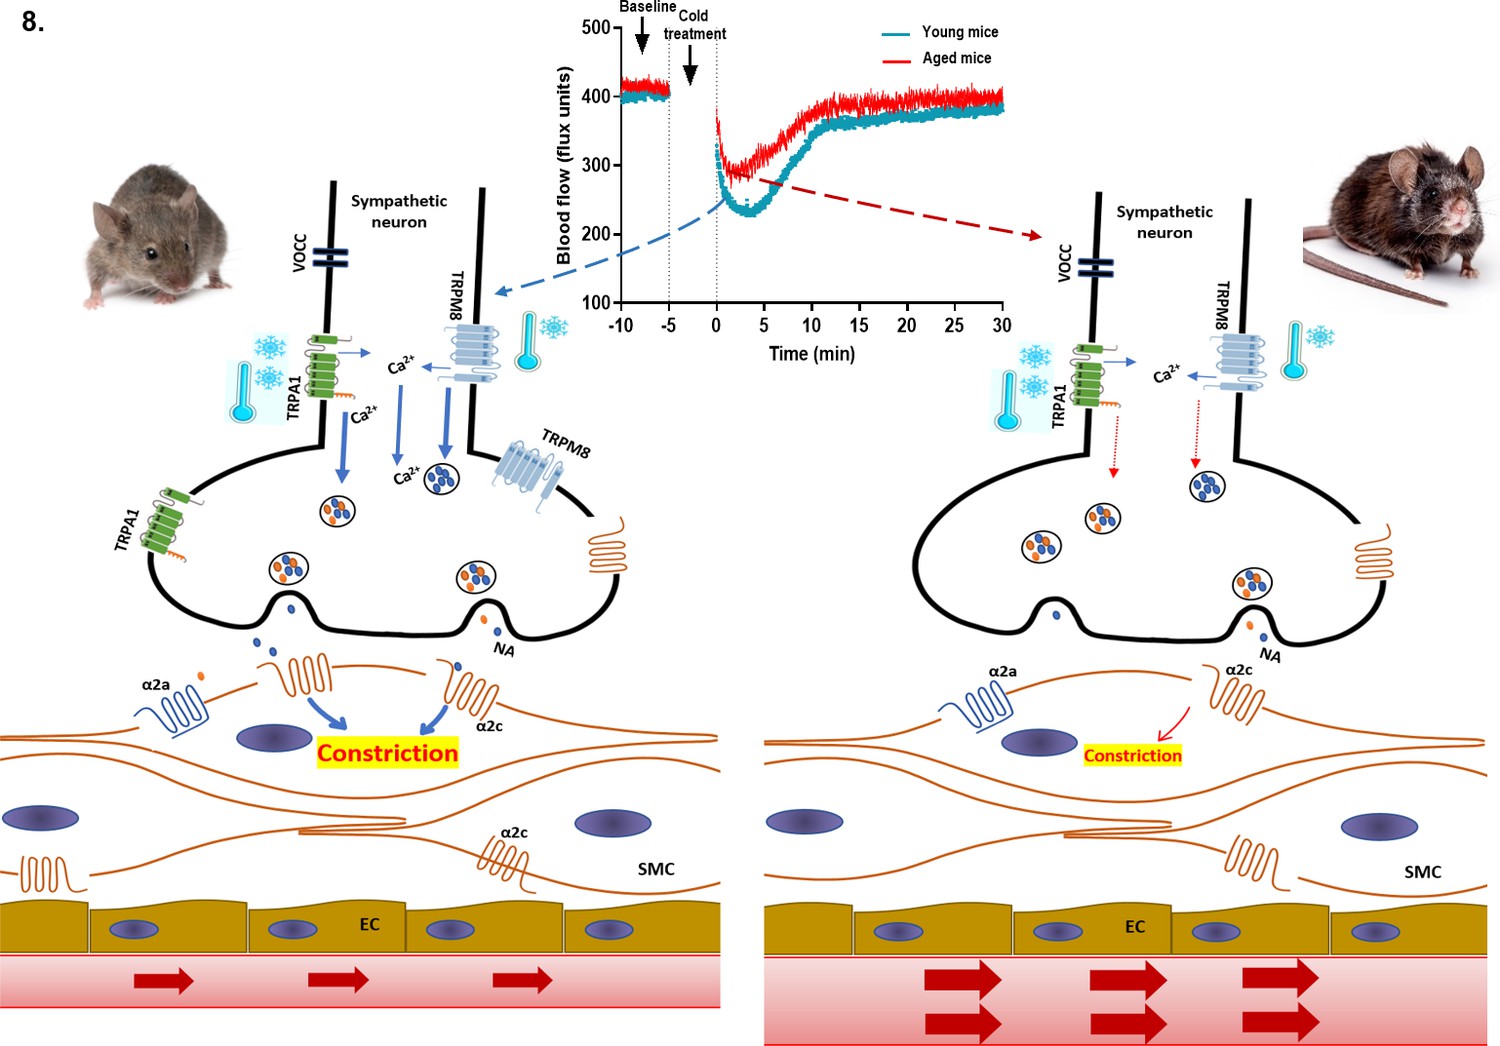
Proposed cold-induced vasoconstriction signalling pathway in young and aged mice.
The local cold exposure produces rapid vasoconstriction which is significantly blunted in the aged mice (see blood flow graph at top centre). Cold water (4 °C) exposure to hindpaw activates the cold receptors TRPA1 and TRPM8 in sympathetic nerves, which leads to increased intracellular calcium and release of NA. This signalling, however, is significantly downregulated in aged mice due to diminished expression of TRPA1/TRPM8 in sympathetic nerves. NA acts on the post-synaptic α2c adrenergic receptors on smooth muscle cells to mediate vasoconstriction. However, α2c adrenergic receptor are also significantly diminished in aged mice, which leads to reduced signalling. All these factors contribute to an attenuated vascular cold response in aged mice compared to young mice.
Tables
Key resources table
| Reagent type (species) or resource | Designation | Source or reference | Identifiers | Additional information |
|---|---|---|---|---|
| Other | CD1 | Charles River | 022; RRID:IMSR_CRL:22 | Mouse (Mus musculus) |
| Antibody | Anti- TRPM8 (Rabbit polyclonal) | Alomone Labs | Cat# ACC-049, RRID:AB_2040254 | “(1:500)” |
| Antibody | Anti-alpha2c adrenergic receptor (Rabbit polyclonal) | Novus Biologicals | Cat# NB100-93554, RRID:AB_1236641 | “(1:1000)” |
| Antibody | Anti-tyrosine hydroxylase (phospho ser41) (Rabbit polyclonal) | Novus Biologicals | Cat# NB300-173, RRID:AB_2201648 | “(1:1000)” |
| Antibody | Anti-tyrosine hydroxylase (Rabbit polyclonal) | Novus Biologicals | Cat# NB300-109, RRID:AB_10077691 | “(1:1000)” |
| Antibody | Anti-p21 (Mouse monoclonal) | Santa Cruz Biotechnology | Cat# sc-6246, RRID:AB_628073 | “(1:1000)” |
| Antibody | Anti- GAPDH (Rabbit polyclonal) | Thermo Fisher Scientific | Cat# PA1-987, RRID:AB_2107311 | “(1:2000)” |
| Antibody | Anti- β- actin(Mouse monoclonal) | Sigma-Aldrich | Cat# A5441, RRID:AB_476744 | “(1:2000)” |
| Antibody | Anti-α- tubulin(Rat monoclonal) | Millipore | Cat# MAB1864, RRID:AB_2210391 | “(1:2000)” |
Additional files
-
Supplementary file 1
List of primer sequences.
- https://cdn.elifesciences.org/articles/70153/elife-70153-supp1-v2.docx
-
Transparent reporting form
- https://cdn.elifesciences.org/articles/70153/elife-70153-transrepform1-v2.docx
-
Source data 1
Orginal blots.
- https://cdn.elifesciences.org/articles/70153/elife-70153-supp2-v2.docx
-
Source data 2
Raw source files.
Figure 1c: FLPI blood flow data; Figure 2a: VMS Blood flow data; Figure 2d: Skin Temperature; Figure 2g: Oxygen Saturation; Figure 4a: BF data with antagonist; Figure 4b: BF data A967; Figure 4c: BF data AMTB; Figure 5a: BF - Menthol; Figure 5d: BF - CA; Figure 5g: BF – Capsaicin; Figure 6a: BF – NA; Figure 6c: BF - Medetomidine; Figure 7d: Calcium imaging data; Figure 7f: Calcium imaging data.
- https://cdn.elifesciences.org/articles/70153/elife-70153-supp3-v2.xlsx
Download links
A two-part list of links to download the article, or parts of the article, in various formats.
Downloads (link to download the article as PDF)
Open citations (links to open the citations from this article in various online reference manager services)
Cite this article (links to download the citations from this article in formats compatible with various reference manager tools)
Dysfunctional TRPM8 signalling in the vascular response to environmental cold in ageing
eLife 10:e70153.
https://doi.org/10.7554/eLife.70153


