Widespread discrepancy in Nnt genotypes and genetic backgrounds complicates granzyme A and other knockout mouse studies
- QIMR Berghofer Medical Research Institute, Australia
- Department of Virology I, National Institute of Infectious Diseases, Japan
- Department of Biochemistry and Molecular Biology, Biomedicine Discovery Institute, Monash University, Australia
- Australian Infectious Disease Research Centre, GVN Center of Excellence, Australia
Figures
Figure 1 with 1 supplement
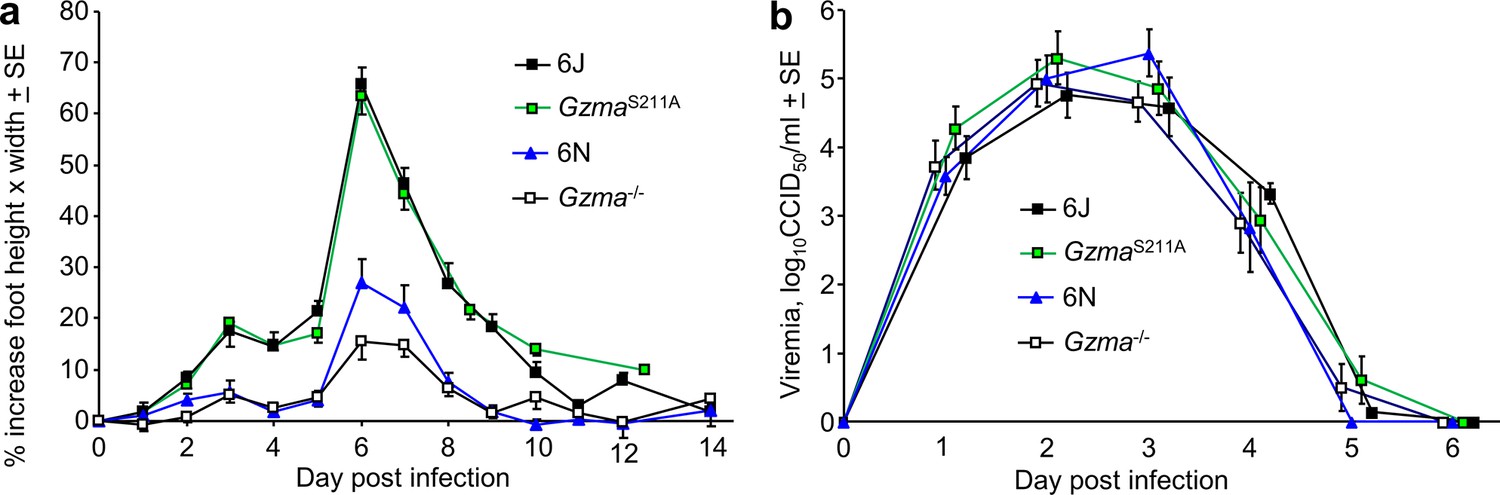
Chikungunya virus (CHIKV) infection in Gzma-/-, GzmaS211A, 6N, and 6J mice.
(a) Percent increase in foot swelling for the indicated mouse strains. Data is from 2 to 4 independent experiments with 5–6 mice (10–12 feet) per group per experiment. From day 3 to day 10, feet from GzmaS211A and 6J mice were significantly more swollen than feet from Gzma-/- and 6N mice (Kolmogorov–Smirnov tests, p<0.002). (b) Viremia for the mice in (a) (6N n = 12, GzmaS211A n = 18, Gzma-/- n = 15, 6J n = 17).
Figure 1—figure supplement 1
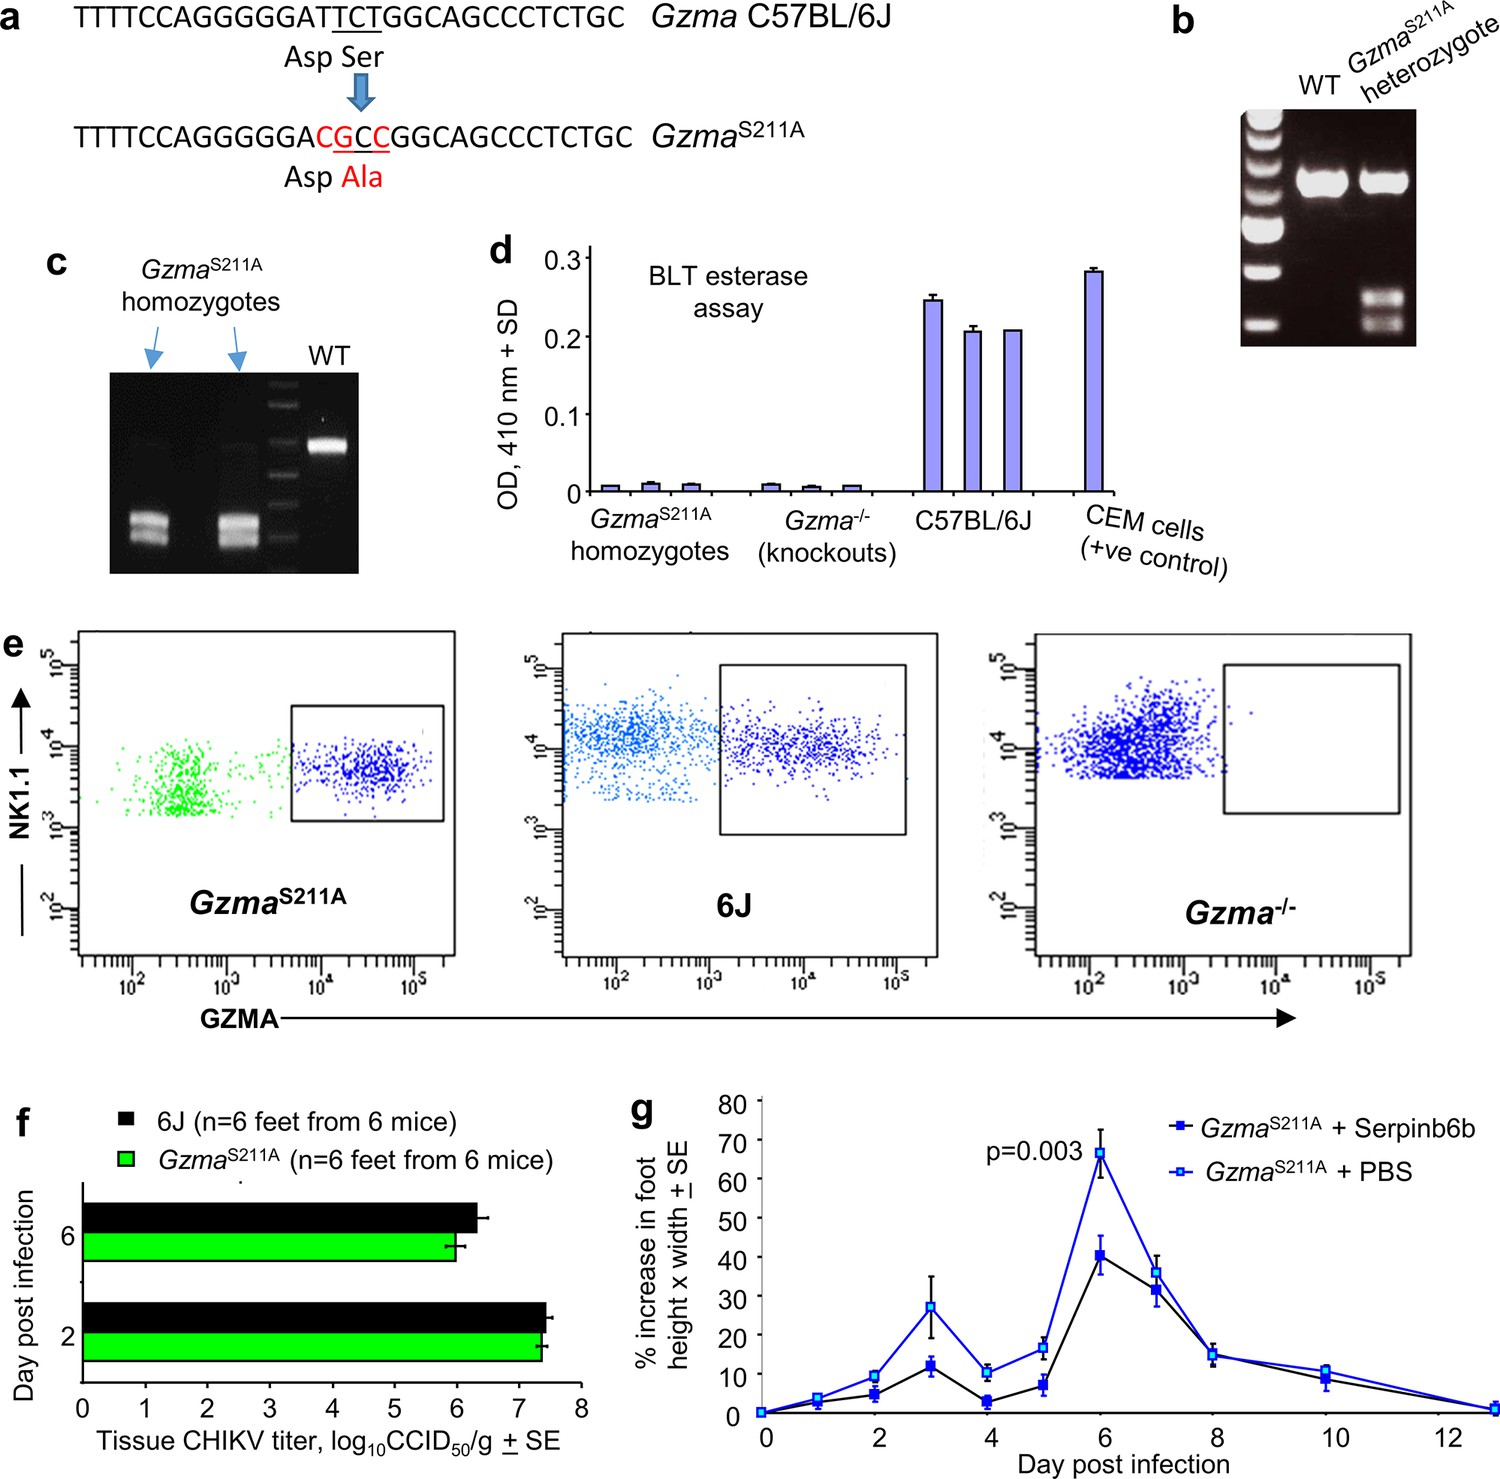
Construction and characterization of GzmaS211A mice.
(a) The GzmaS211A mouse was generated by CRISPR of C57BL/6J mice by the Australian Phenomics Network (APN), Monash University, Melbourne, Australia. (b) Genotyping was undertaken at APN using F 5′ TCAGCTGCTTTTGCCTGTTTCA 3′ and R 5′ GAGAAAGTCCCCTGTCC-TCGG 3′ primers to generate a 628 bp product, with BsaHI digestion (blue arrow in a) generating 290 bp and 338 bp fragments for the GzmaS211A allele. (c) Heterozygous GzmaS211A mice were interbred to generate homozygous GzmaS211A mice at QIMR Berghofer MRI. The undigested 628 bp PCR products were sequenced to confirm that the correct product had been amplified. (d) Mouse splenic NK cells constitutively express active GZMA protein. NK cells from spleens were FACS sorted (NK1.1+, CD3-) and lysates analyzed by the benzyloxycarbonyl-L-lysine thiobenzylester (BLT) esterase activity in duplicate as described (Schanoski et al., 2019). (e) NK cells (NK1.1+, CD3-) from spleens from the indicated mouse strains were analyzed by FACS for mouse GZMA expression using intracellular anti-GZMA antibody staining as described (Schanoski et al., 2019). (f) GzmaS211A and 6J mice were infected with chikungunya virus (CHIKV) and tissue viral titers in the feet determined as described (Gardner et al., 2010). (g) Treatment of CHIKV-infected mice with Serpinb6b as described previously (Wilson et al., 2017) except using GzmaS211A mice. Statistics (day 6) by t-test n = 12 feet from six mice per group.
Figure 2
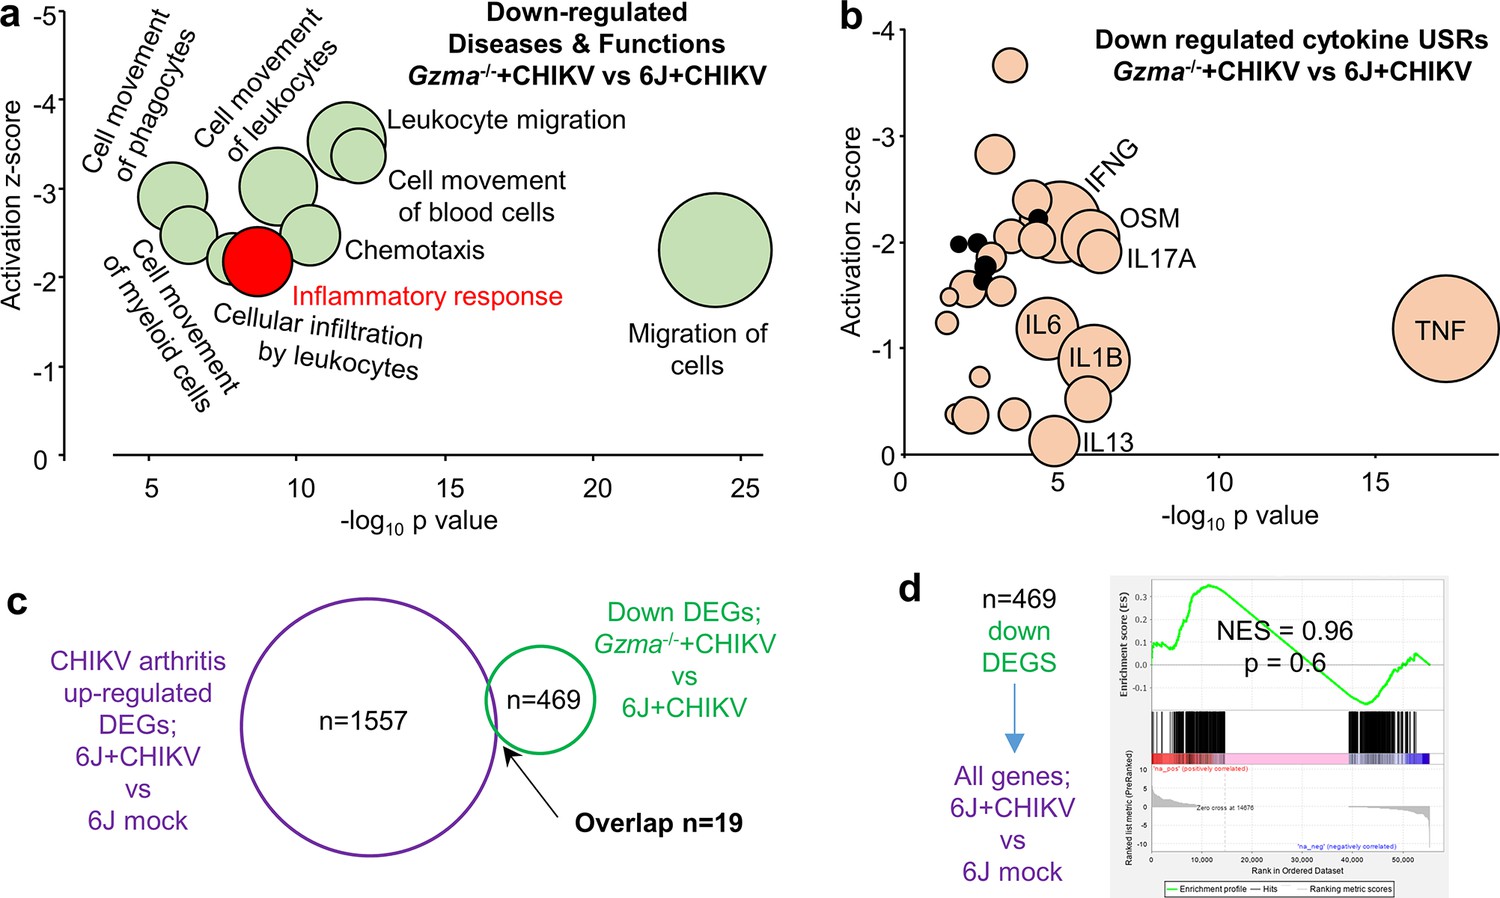
RNA-Seq of Gzma-/- + chikungunya virus (CHIKV) vs. 6J + CHIKV day 6 feet.
(a) Selected Ingenuity Pathway Analysis (IPA) Diseases and Function annotations for the 469 downregulated differentially expressed genes (DEGs) for Gzma-/- + CHIKV vs. 6J + CHIKV (full set of annotations shown in Supplementary file 2c). (b) IPA cytokine upstream regulators (USRs) downregulated in CHIKV-infected feet of Gzma-/- mice (Gzma-/-+CHIKV vs. 6J + CHIKV; Supplementary file 2e) plotted by p-value and z-score. Black circles – minor USRs for Gzma-/- + CHIKV vs. 6J + CHIKV not identified for 6J + CHIKV vs. 6J mock (see also Figure 4e). (c) RNA-Seq identified 1557 DEGs upregulated in feet for 6J + CHIKV vs. 6J mock infection (Supplementary file 2g). RNA-Seq of Gzma-/- + CHIKV vs. 6J + CHIKV day 6 feet identified 469 downregulated DEGs in Gzma-/- mice associated with the reduced foot swelling (Supplementary file 2b). Only 19 of these DEGs were shared by these datasets. (d) Gene Set Enrichment Analysis (GSEA) of downregulated DEGs from Gzma-/- + CHIKV vs. 6J + CHIKV day 6 feet (Supplementary file 2b) vs. all genes (preranked by fold change) from feet 6J + CHIKV vs. 6J mock infection (Supplementary file 2f).
Figure 3 with 3 supplements
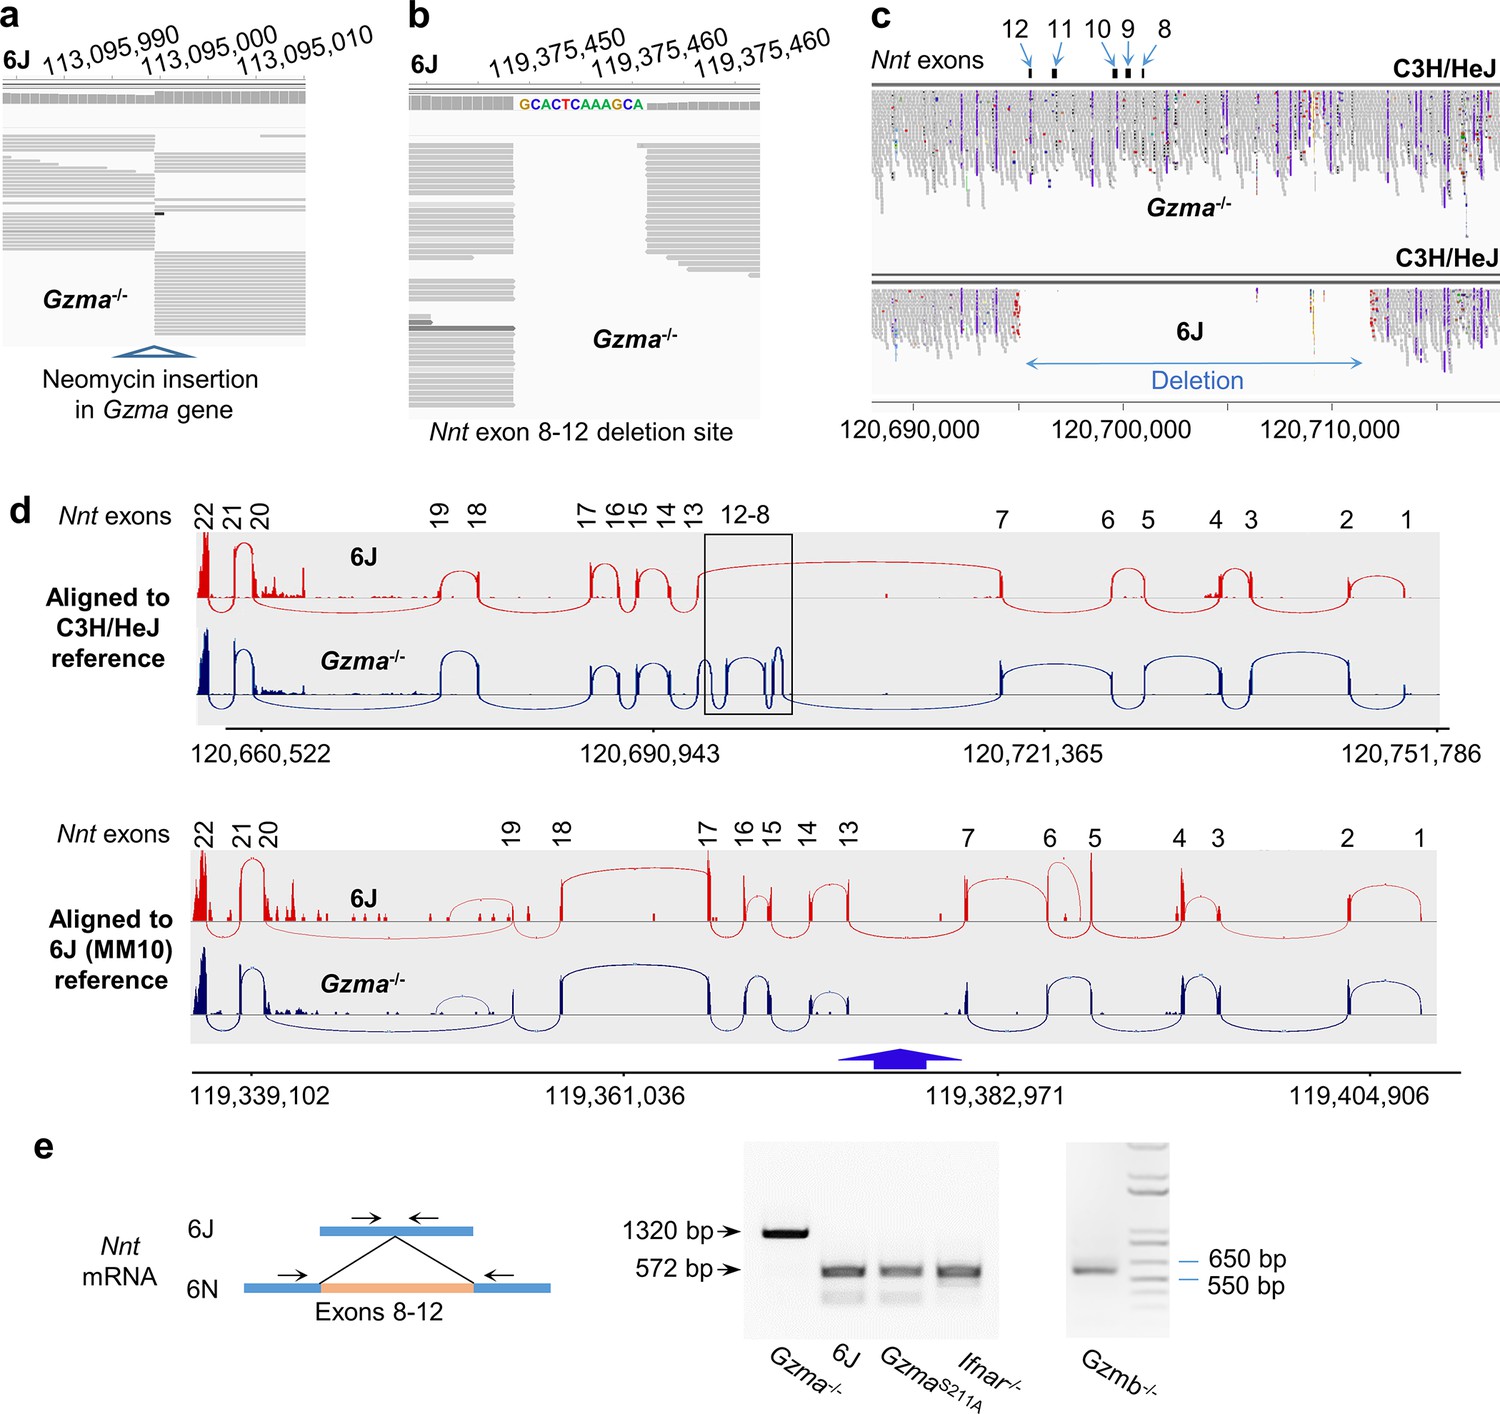
Nnt deletion in 6J but not Gzma-/- mice.
(a) Whole-genome sequencing (WGS) of Gzma-/- mice aligned to the 6J (MM10) reference genome build, illustrating the insertion site of the neomycin cassette into the Gzma gene to create the knockout. (b) As for (a) but showing the site of the Nnt deletion, with the additional 12 nucleotides present in the 6J genome. (c) WGS of Gzma-/- and 6J mice aligned to the C3H/HeJ reference genome, illustrating that the Nnt deletion present in 6J mice is absent in Gzma-/- mice. The deletion is in chromosome 13; position 120,695,141–120,711,874 (C3H/HeJ numbering). (d) Reads from RNA-Seq of chikungunya virus (CHIKV)-infected 6J and Gzma-/- mice aligned to the C3H/HeJ and 6J (MM10) reference genomes showing the Sashimi plot (Integrative Genomics Viewer) for the Nnt gene. (e) RT-PCR of testes using primers either side of exons 8–12 in the Nnt mRNA.
Figure 3—figure supplement 1
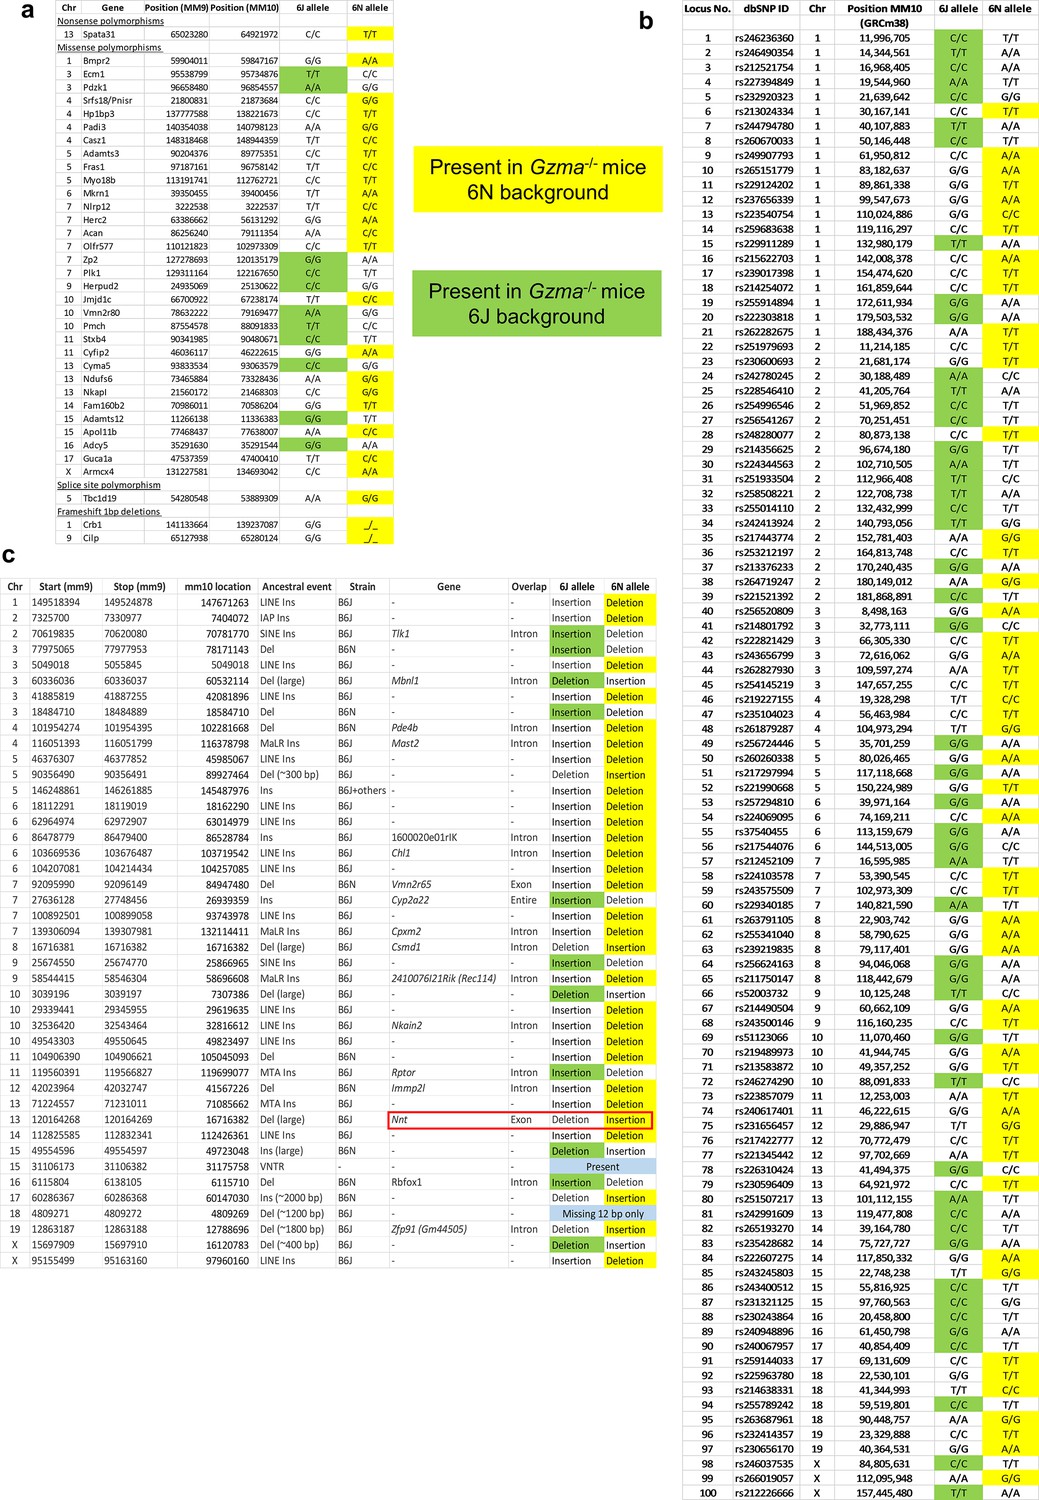
Gzma-/- mice have a mixed 6N (yellow)/6J (green) background.
(a) Single-nucleotide polymorphisms (Simon, 2013). (b) Single-nucleotide polymorphisms (Mekada et al., 2015). (c) Insertions/deletions (Simon, 2013). Whole-genome sequencing (WGS) data for Gzma-/- mice provided in PRJNA664888. Nnt highlighted in red box.
Figure 3—figure supplement 2
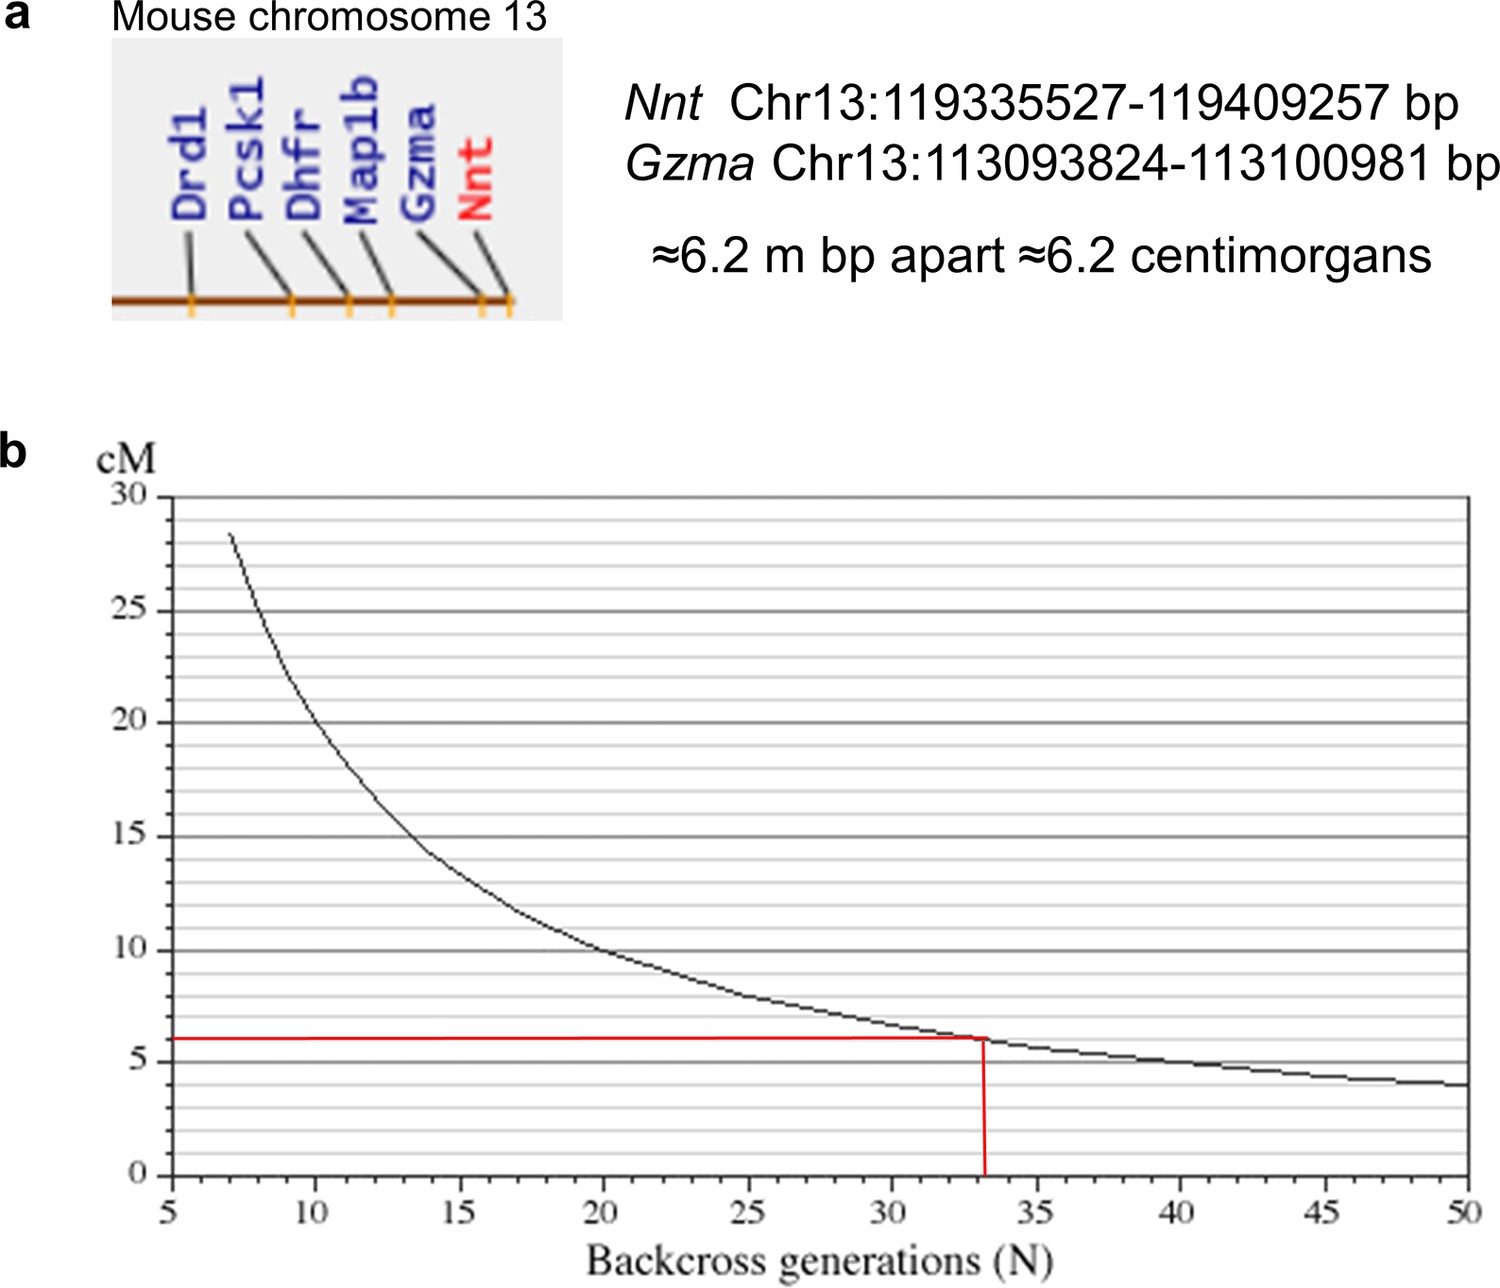
Nnt and Gzma gene locations and backcrossing requirements.
(a) Both Gzma and Nnt genes are located on mouse chromosome 13 and are separated by about 6.2 million bp. (b) Over 30 backcrosses would be needed to separate the Gzma locus from the Nnt locus (graph taken from http://www.informatics.jax.org/silver/index.shtml).
Figure 3—figure supplement 3
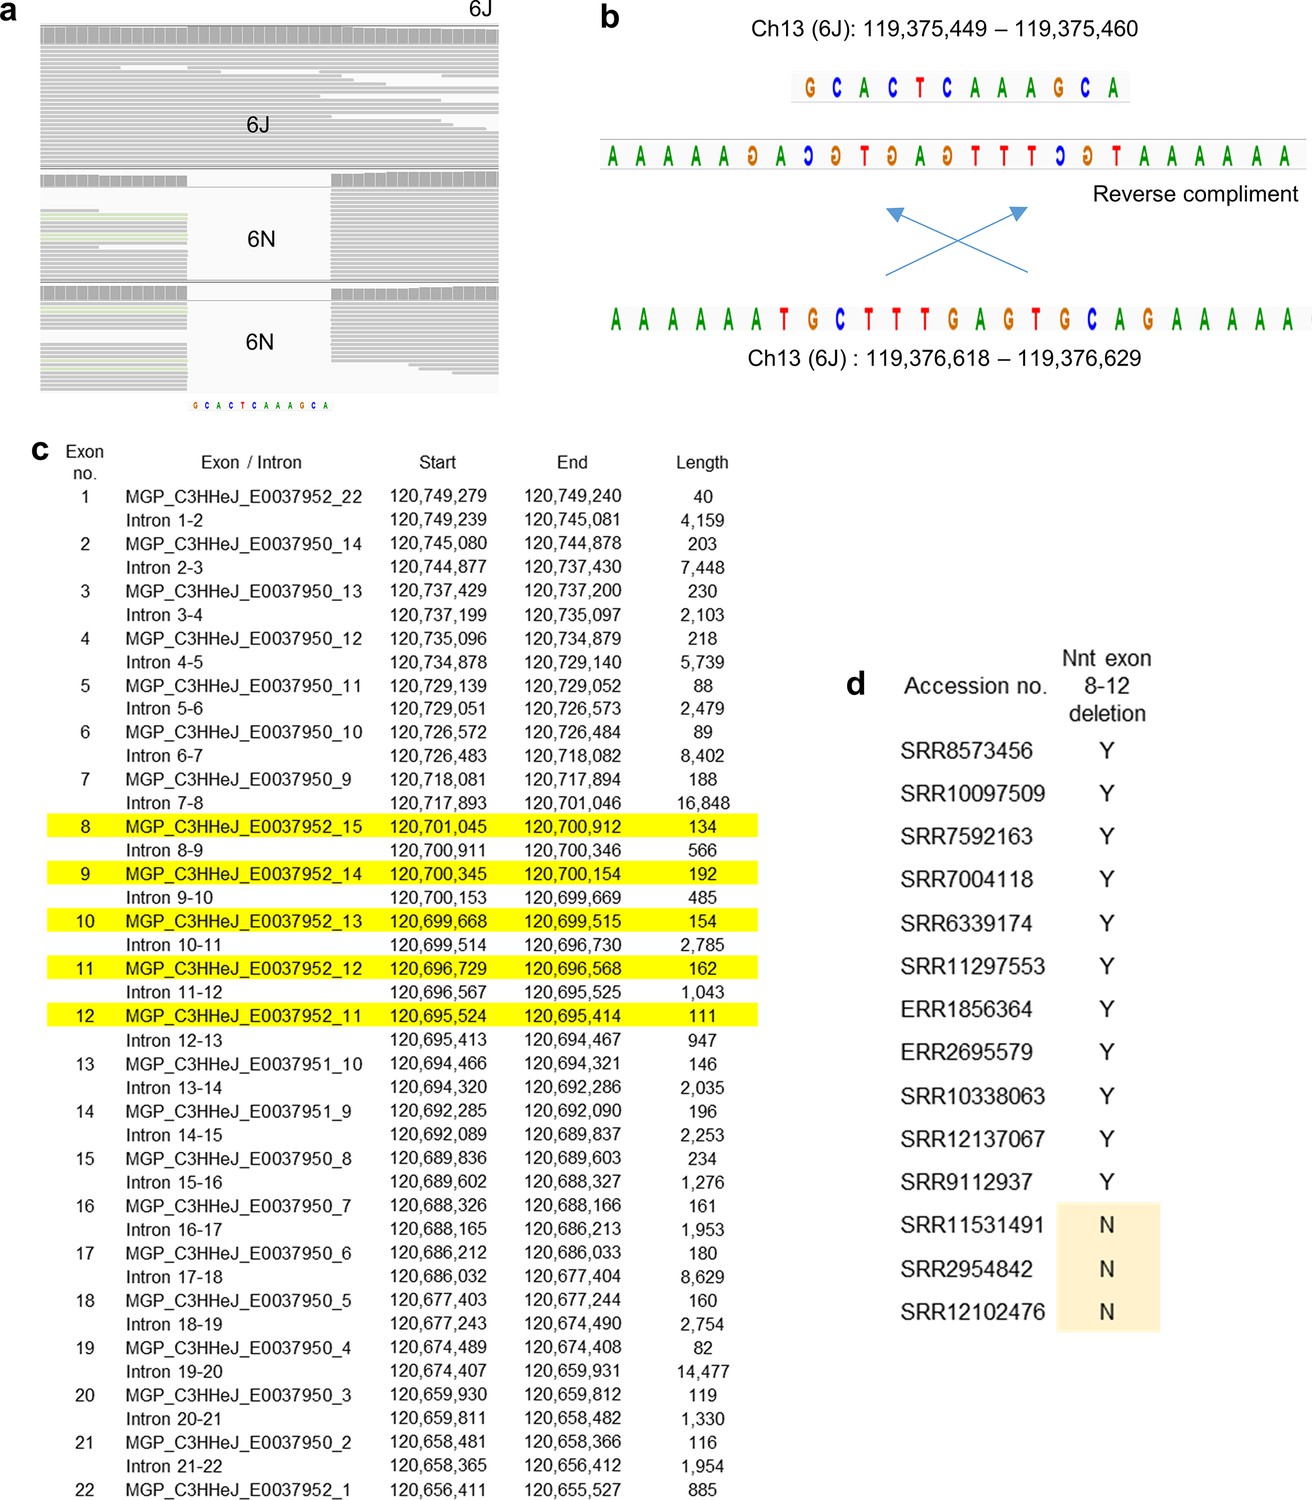
Nnt locus inserts and alignments.
(a) 6J whole-genome sequencing (WGS) reads (SRR8573456) aligned to 6J reference compared with 6N WGS reads (SRR7592164, ERR2814681) aligned to 6J reference, across the 12 nucleotide insert. (b) Proposed source of the 12 nucleotide insertion shown in (a) and Figure 3b. The insertion sequence matches the reverse complement of a sequence ≈1 kb downstream of the Nnt deletion site. The insertion is present in 6J genomes. (c) Location of Nnt exons in the C3H/HeJ mouse genome build (GenBank assembly accession: GCA_001632575.1). Exons highlighted in yellow are missing in 6J mice. (d) A series of WGS with 6J listed as the mouse strain were analyzed as described in Figure 3c and the absence of exon 8–12 confirmed (Y). WGS from CBA/J F1 hybrids (Korablev et al., 2020), mice with an NMRI background (Tumiati et al., 2015), and a WGS with no mouse strain provided, all contained full-length Nnt genes (N).
Figure 4 with 2 supplements
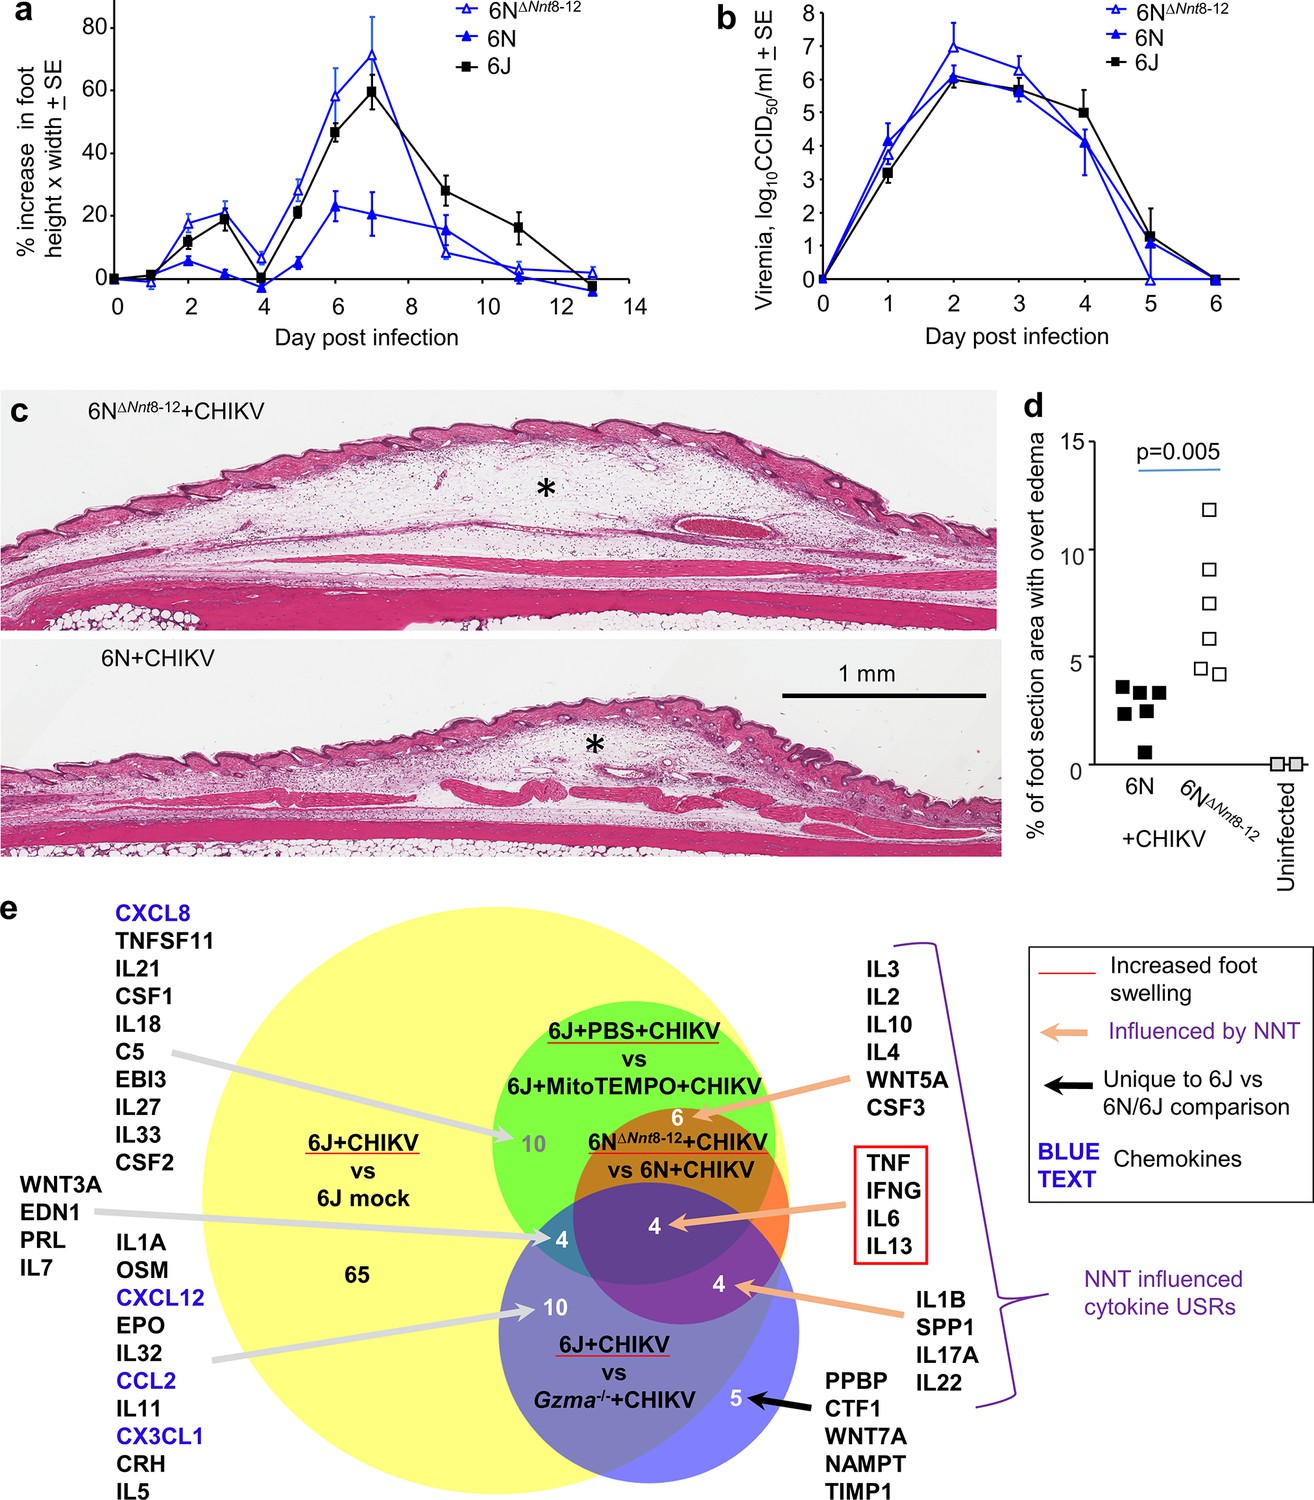
6N∆Nnt8-12 mice.
(a) 6N∆Nnt8-12 mice have the same Nnt exon deletion as 6J mice. Age-matched female 6N∆Nnt8-12, 6N, and 6J mice were infected with chikungunya virus (CHIKV) and foot swelling measured over time (n = 5 mice and 10 feet per group). Foot swelling was significantly higher in 6N∆Nnt8-12 mice when compared with 6N mice on days 2–7 (day 2 p=0.0026, day 7 p=0.0027, t-tests, parametric data distributions; days 3–6 p=0.003, Kolmogorov–Smirnov tests, nonparametric data distributions). Foot swelling was significantly lower in 6N mice when compared with 6J mice (day 2 p=0.042, day 6 p=0.001, day 7 p=0.0005, t-tests, parametric data distributions; days 3 and 5, p=0.002, Kolmogorov–Smirnov tests, nonparametric data distributions). (b) Viremia for the same mice as in (a). (c) H&E staining of feet from 6N∆Nnt8-12 and 6N mice day 6 post infection showing subcutaneous edema (*). (d) Percentage of foot section area showing overt subcutaneous edema (statistics by Kolmogorov–Smirnov test). (e) RNA-Seq data for four comparisons was analyzed by Ingenuity Pathway Analysis (IPA) and cytokine upstream regulator (USR) overlaps shown. Only cytokine USRs with positive z-scores associated with increased foot swelling are shown.
Figure 4—figure supplement 1
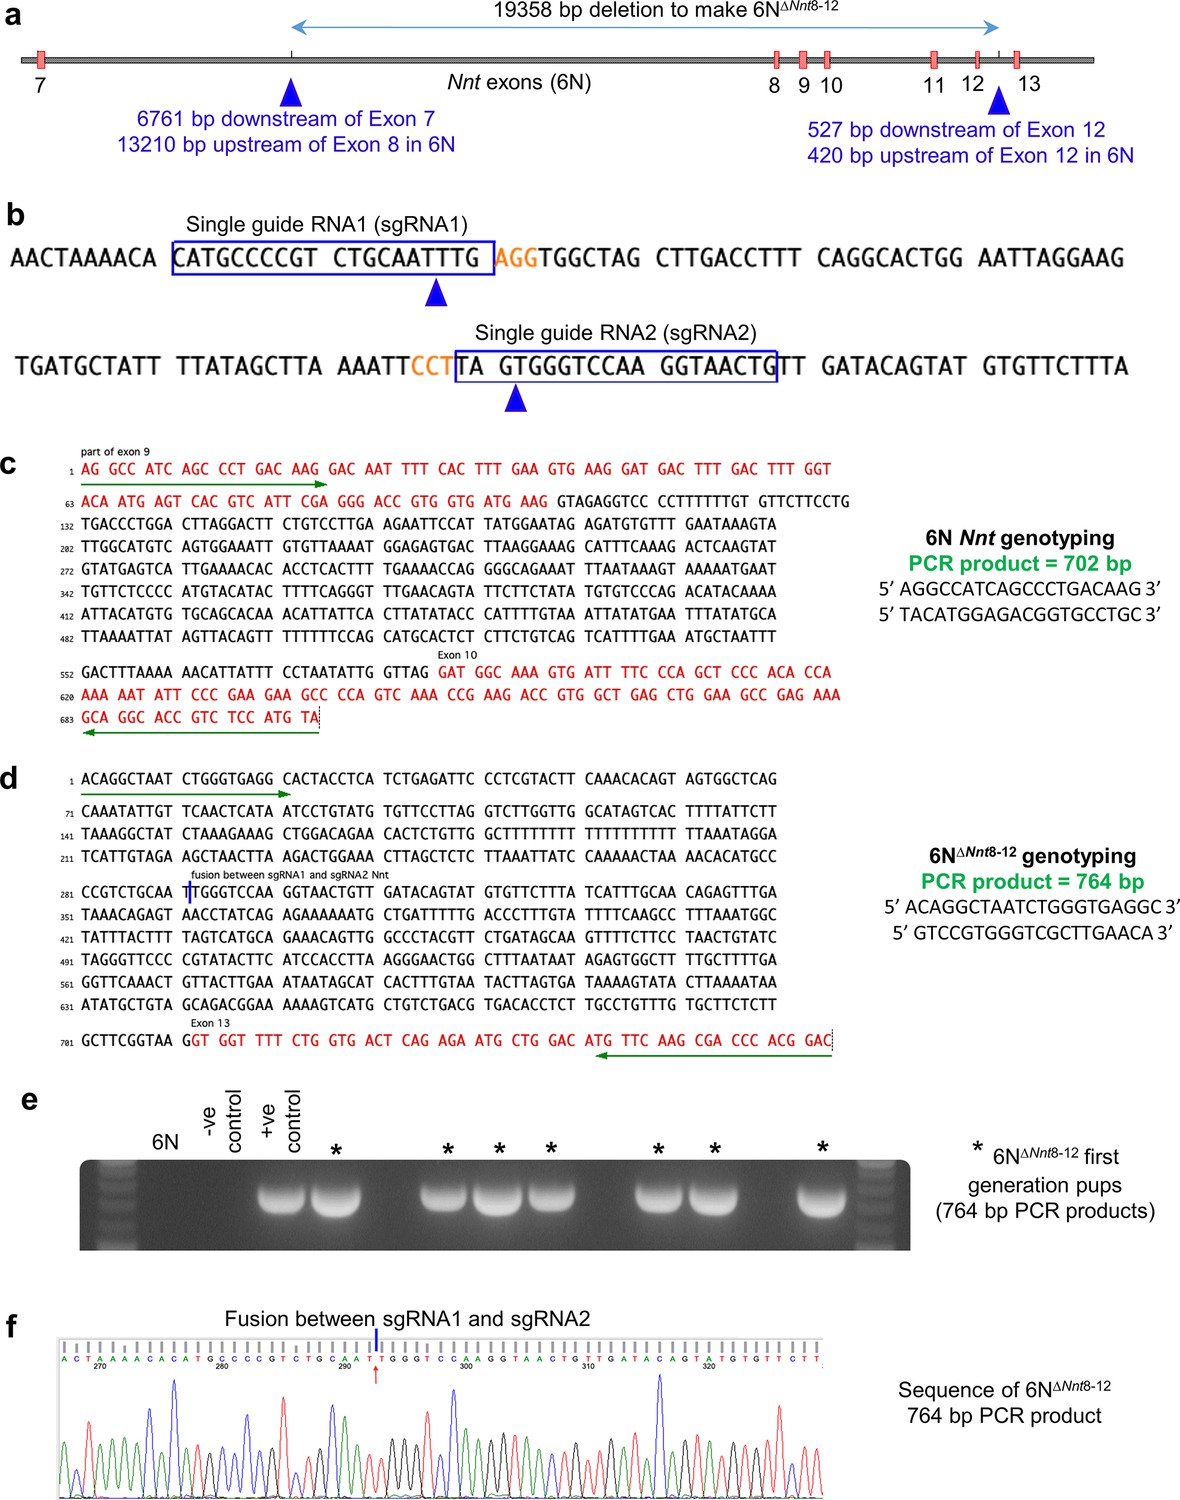
Generation of 6N∆Nnt8-12 mice.
(a) Deletion of exons 8–12 from the 6N Nnt gene. (b) sgRNAs and location of cuts (blue arrowheads). (c) Primers for genotyping 6N Nnt allele. (d) Primers for genotyping 6N∆Nnt8-12 allele. (e) Example of 764 bp PCR products for first-generation 6N∆Nnt8-12 pups. (f) Example of sequencing 764 bp PCR product. Mice were bred to homozygosity to produce 6N∆Nnt8-12 mice.
Figure 4—figure supplement 2
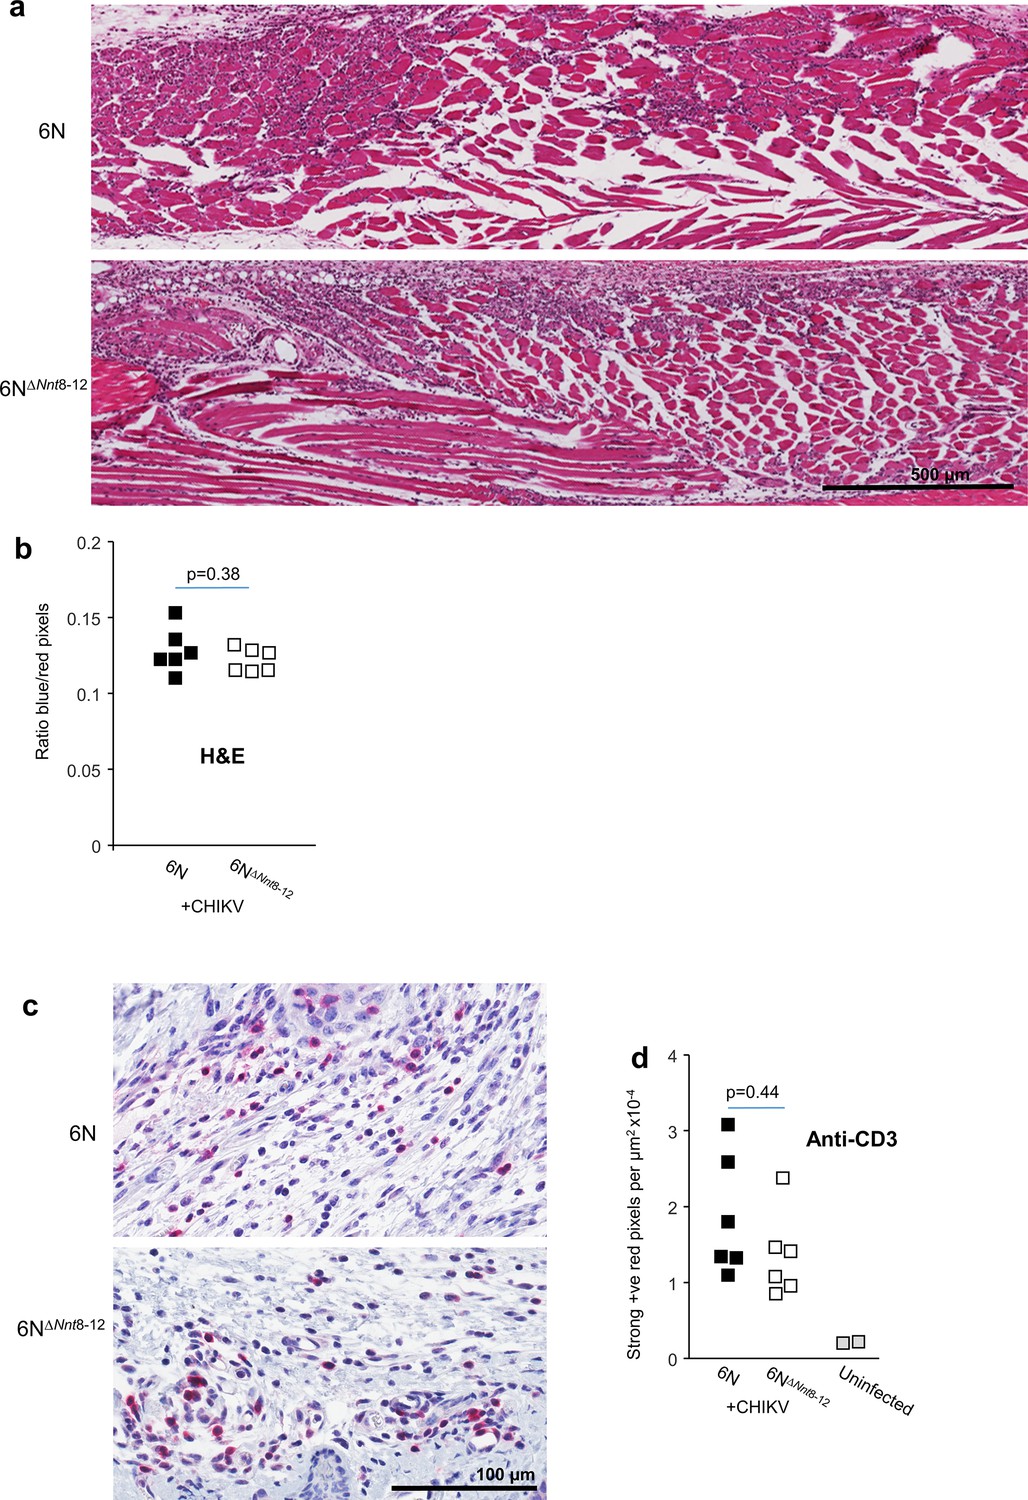
Histological analyses for 6N∆Nnt8-12 mice feet.
(a) Examples of H&E staining of feet showing the prominently mononuclear cellular infiltrates (purple) in muscle tissues. (b) Quantitation of H&E staining of feet using blue (nuclei) over red (cytoplasm) pixel count ratios determined by Aperio pixel count. Six sections total from two independent H&E staining rounds were averaged to produce one value per mouse (n = 6 mice per group). Statistics by t-test. (c) Examples of anti-CD3 immunohistochemistry staining in foot sections (Warp red with toluidine blue counterstain). (d) Quantitation of anti-CD3 staining by Aperio pixel count. Three sections were averaged to produce one value per mouse (n = 6 mice per group). Area (denominator) was normalized (mean factor of 1.18) to account for the increased area associated with edema in the 6N∆Nnt8-12 group. Statistics by Kolmogorov–Smirnov test (nonparametric–high kurtosis). Remains nonsignificant even without normalization.
Figure 5 with 1 supplement
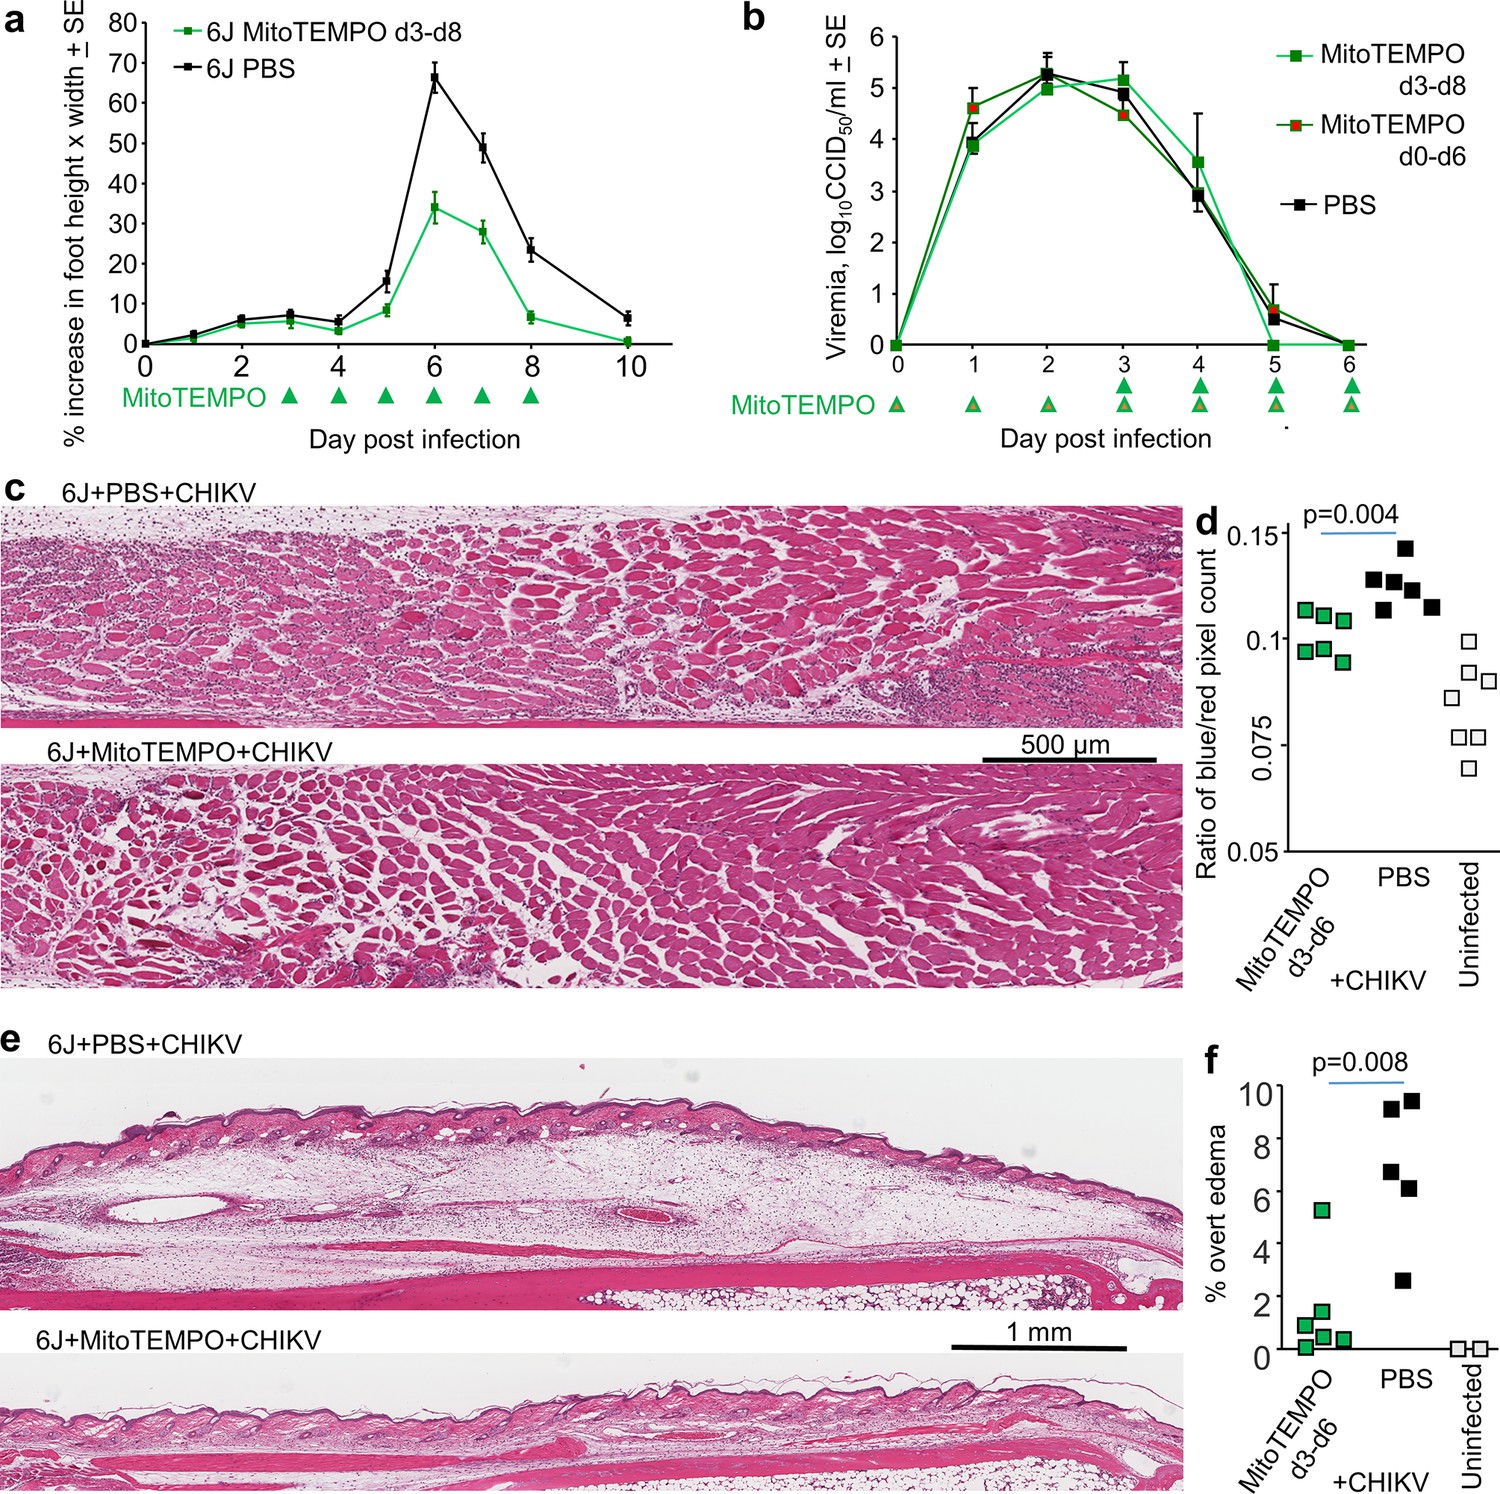
MitoTEMPO treatment.
(a) 6J mice were infected with chikungunya virus (CHIKV) and then treated with MitoTEMPO or PBS i.v. daily on days 3–8 post infection and foot swelling measured (n = 5/6 mice and 10/12 feet per group). Statistics by t-tests, days 6, 7, and 8, p < 0.001. (b) Viremia for the mice in (a), with an additional group of six mice treated daily with MitoTEMPO from day 0 till day 6. (c) H&E staining of muscle tissues in feet of mice day 6 post CHIKV infection for mice treated with PBS or MitoTEMPO from day 3 to day 6. Clusters of small blue spots in and around the muscle bundles illustrate nuclei of infiltrating leukocytes. (d) Aperio pixel count of blue (nuclear) over red (cytoplasmic) pixels; a measure of leukocyte infiltration (statistics by t-test). (e) H&E staining of feet as in (c) but showing overt subcutaneous edema. (f) Percentage of foot section areas showing overt subcutaneous edema (statistics by t-test).
Figure 5—figure supplement 1
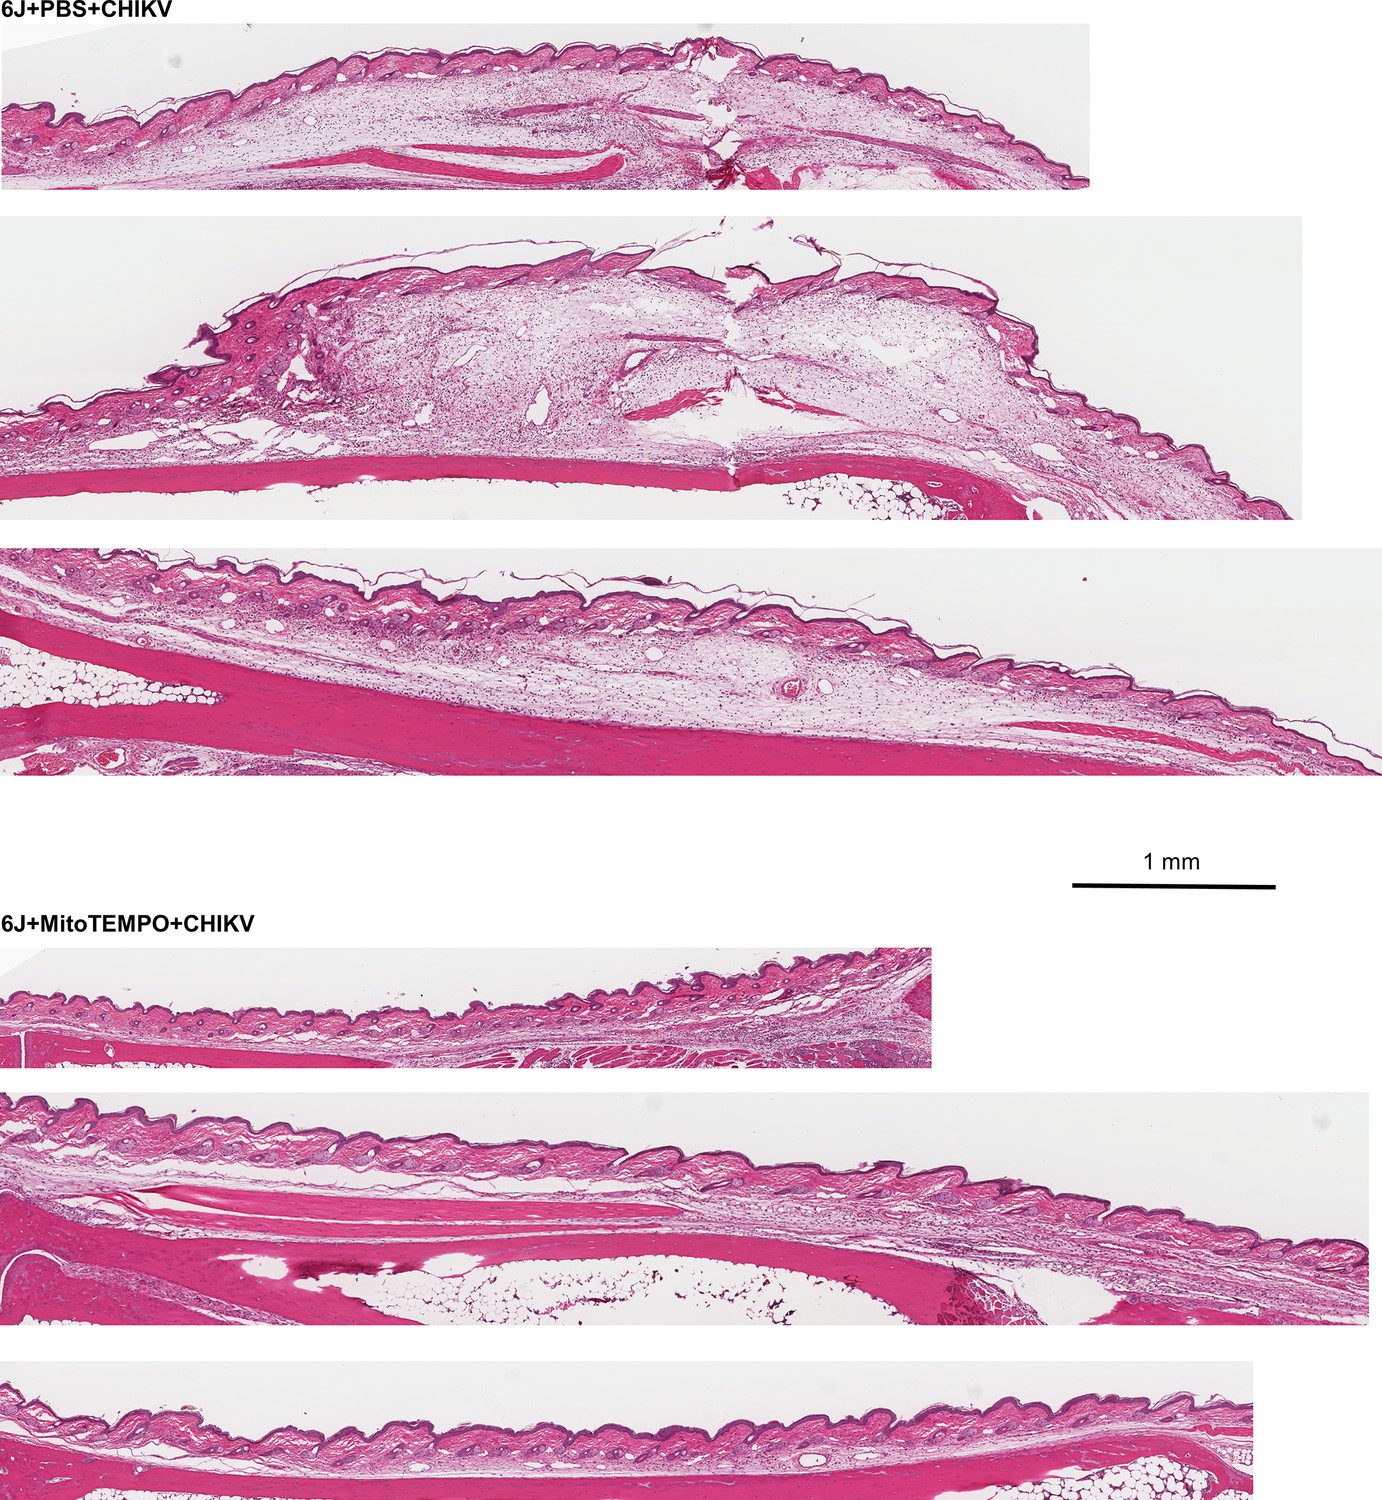
Additional H&E images of feet subcutaneous edema (as in Figure 5e).
Figure 6 with 4 supplements
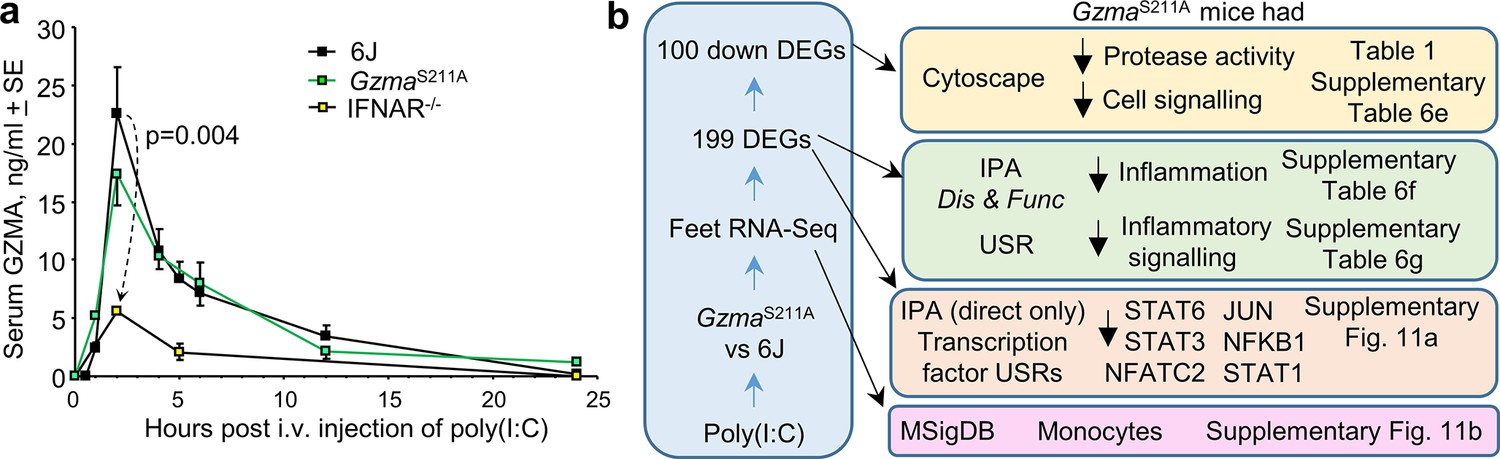
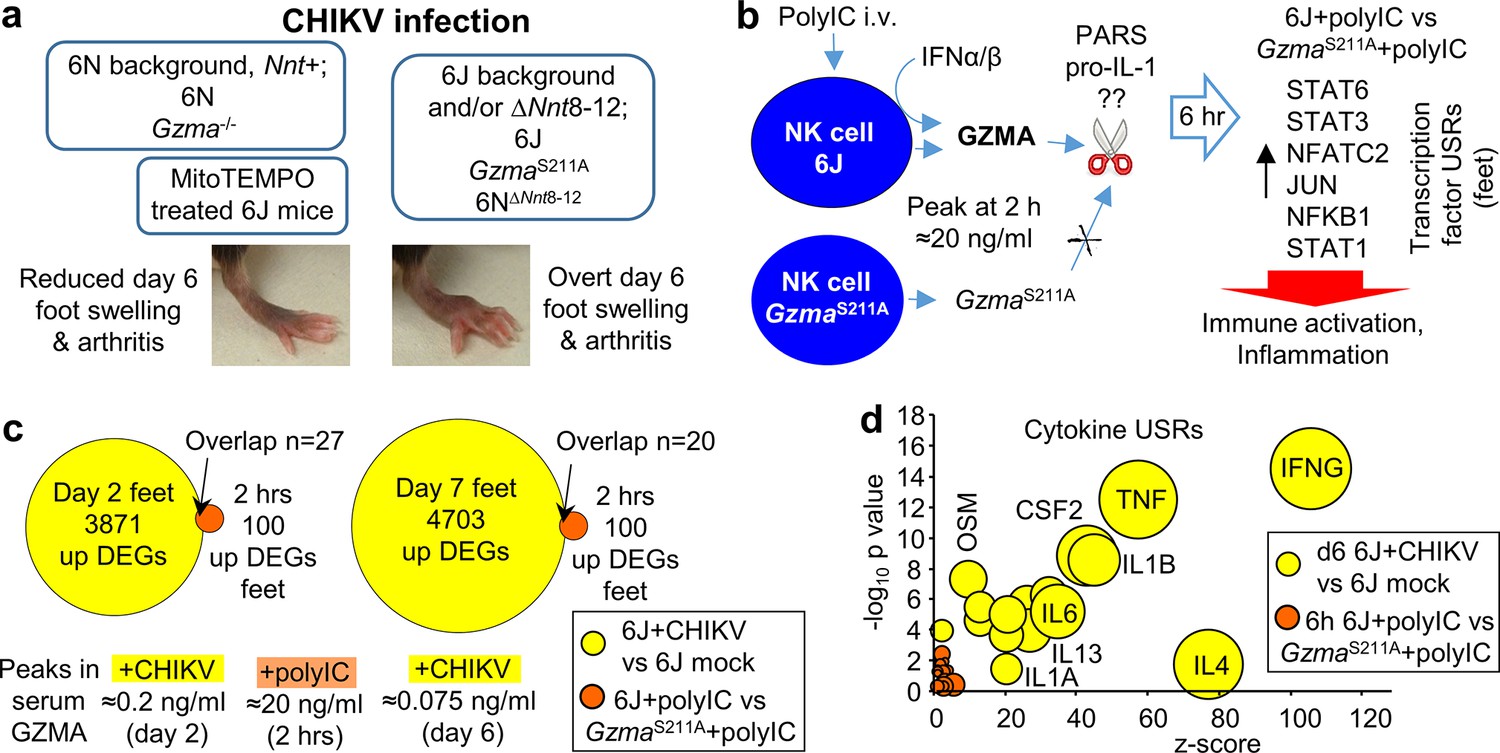
Polyinosinic:polycytidylic acid (poly(I:C)) injection into GzmaS211A, 6J mice, and Ifnar-/-.
(a) GzmaS211A, 6J, and Ifnar-/- mice were injected i.v. with 250 µg of poly(I:C) in 150 µl of PBS, and serum samples were taken at the indicated times and assayed for GZMA concentration using a capture ELISA kit (6J n = 5–8, Ifnar-/- n = 5–6 and GzmaS211A n = 3 mice per time point). (b) GzmaS211A and 6J mice were injected i.v. with 250 µg of poly(I:C) and feet removed 6 hr later and analyzed by RNA-Seq. The differentially expressed genes (DEGs) (Supplementary file 6b) were analyzed by Cytoscape and Ingenuity Pathway Analysis (IPA). The full gene list (Supplementary file 6a) was analyzed using the Molecular Signature Database (MSigDB).
Figure 6—figure supplement 1
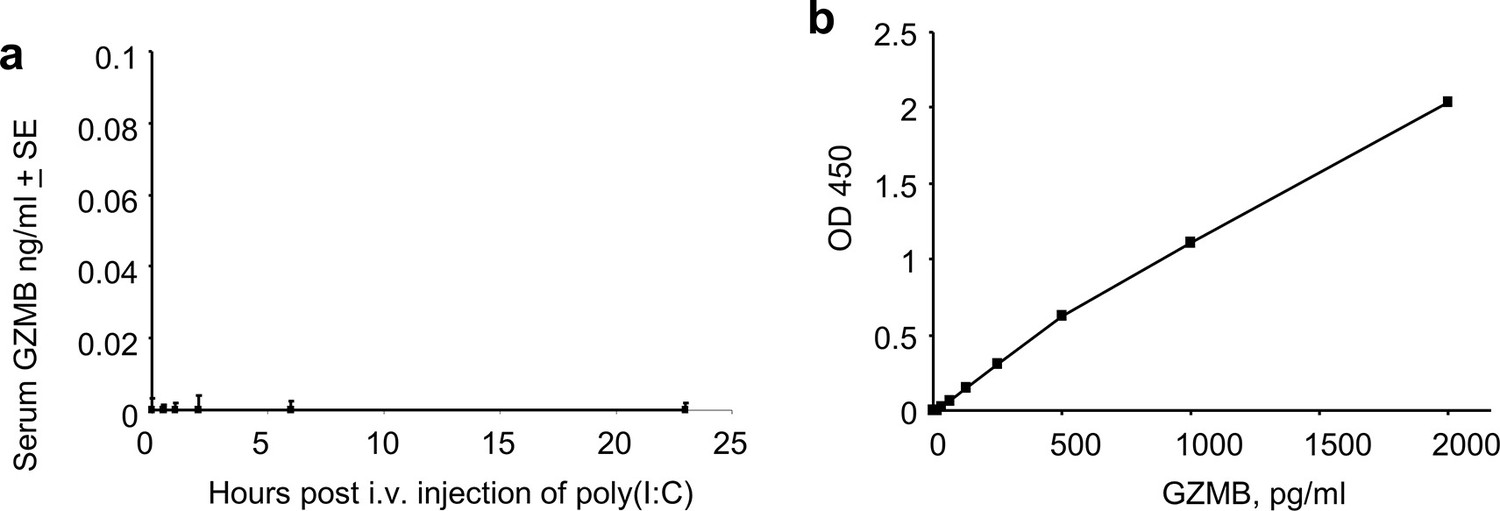
Serum granzyme B (GZMB) levels after i.v. injection of polyinosinic:polycytidylic acid (poly(I:C)).
(a) 6J mice were injected i.v. with 250 µg of poly(I:C) and serum samples taken at the indicated times and assayed for GZMB concentrations by capture ELISA (MyBioSource, San Diego, CA; MBS453704) (n = 5 mice per time point). (b) Standard curve.
Figure 6—figure supplement 2
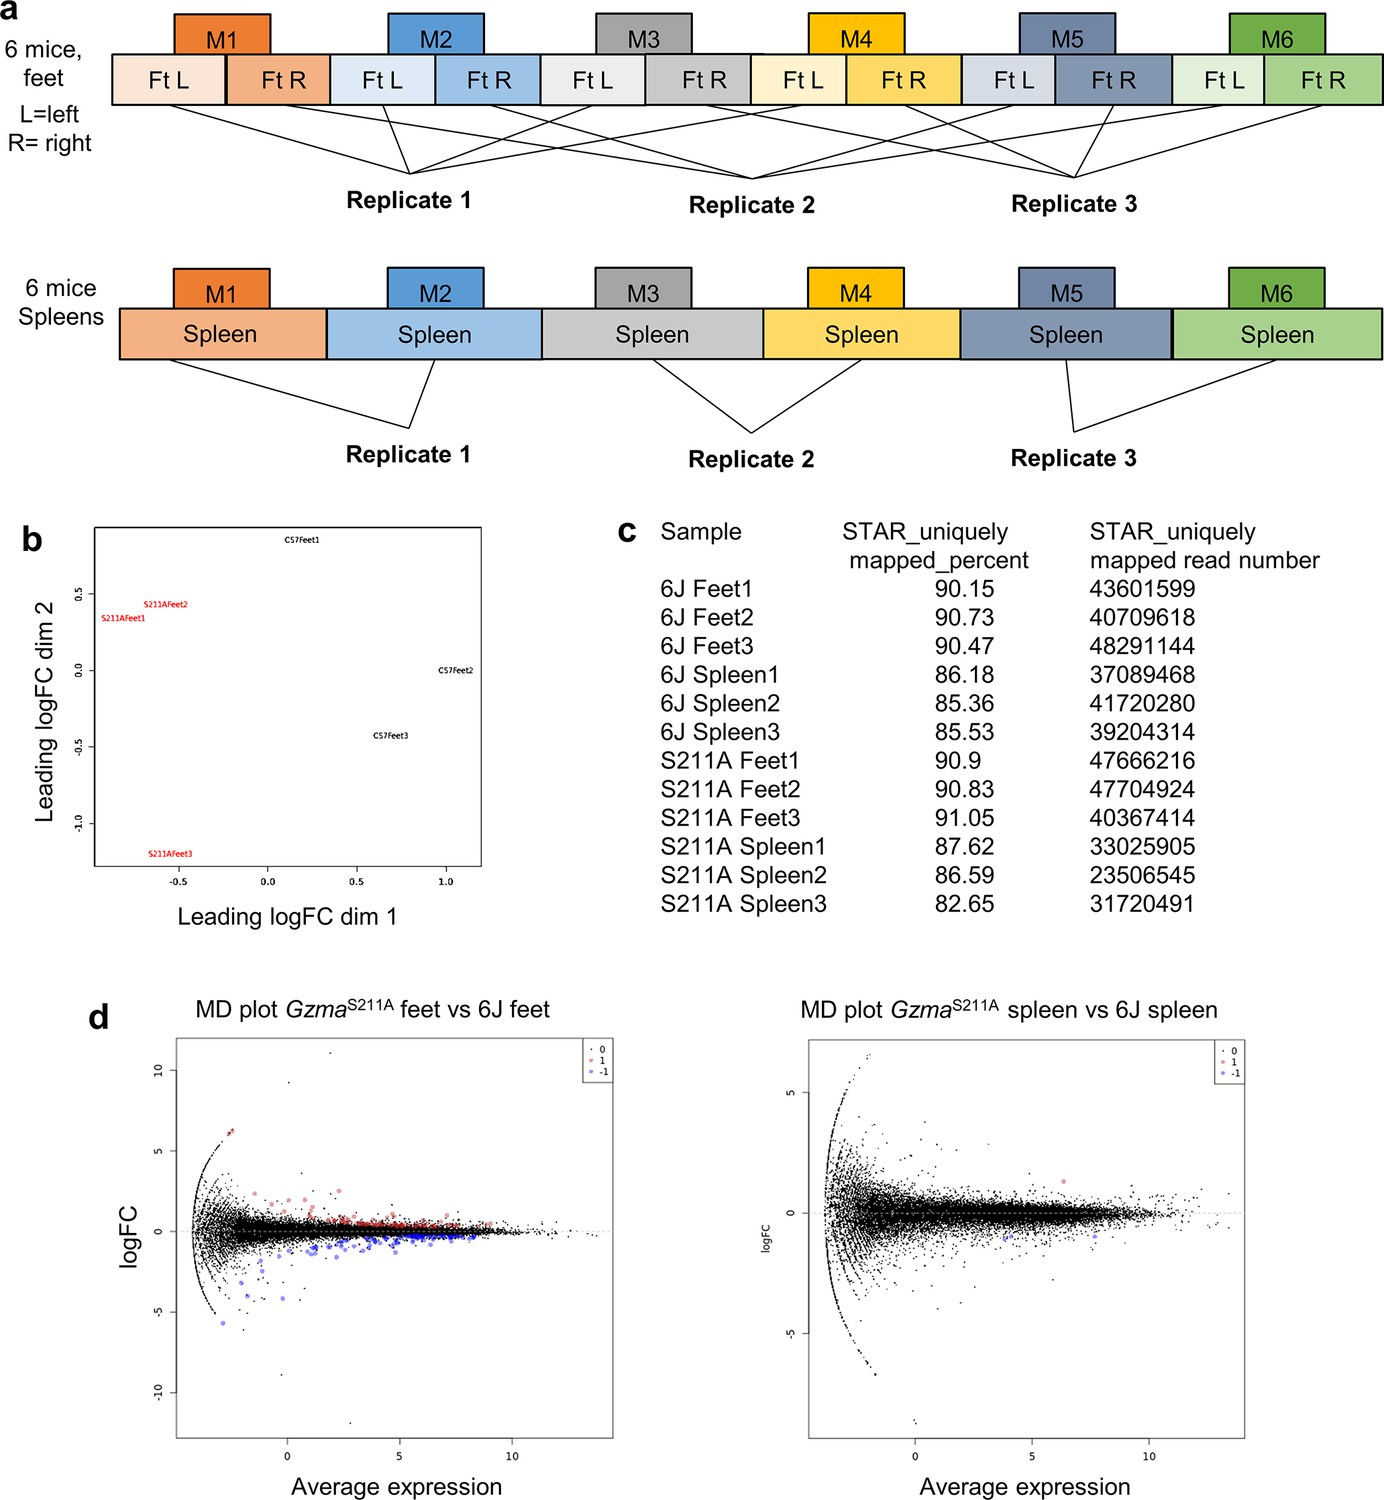
RNA-Seq for polyinosinic:polycytidylic acid (poly(I:C)) injection into GzmaS211A vs. 6J mice.
(a) Pooling strategy for RNA derived from six mice 6 hr after i.v. poly(I:C) injection. (b) Multi-dimensional scaling (MDS) plot for RNA-Seq data for GzmaS211A vs. 6J feet, illustrating clear segregation of the three replicates for each mouse strain. (c) STAR read mapping data showing high percentage and number of unique mapping reads. (d) Mean-difference (MD) plots. Red, upregulated differentially expressed genes (DEGs); blue, downregulated DEGs.
Figure 6—figure supplement 3
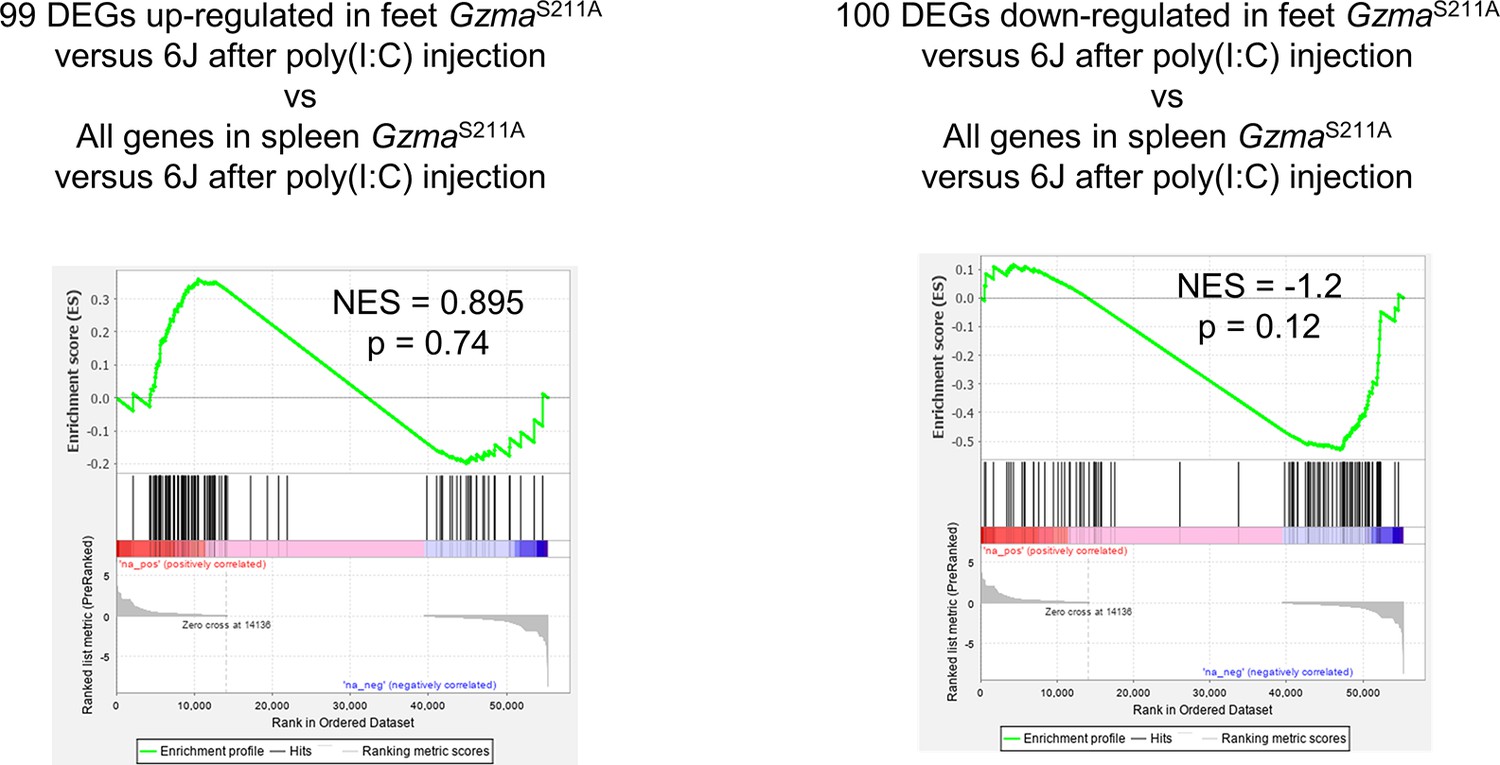
The gene expression signatures in feet seen 6 hr after injection of polyinosinic:polycytidylic acid (poly(I:C)) in GzmaS211A vs. 6J mice are not significantly recapitulated in spleen.
Genes were preranked by fold change.
Figure 6—figure supplement 4
Ingenuity Pathway Analysis (IPA) and Gene Set Enrichment Analysis (GSEA) for polyinosinic:polycytidylic acid (poly(I:C)) injection into GzmaS211A vs. 6J mice.
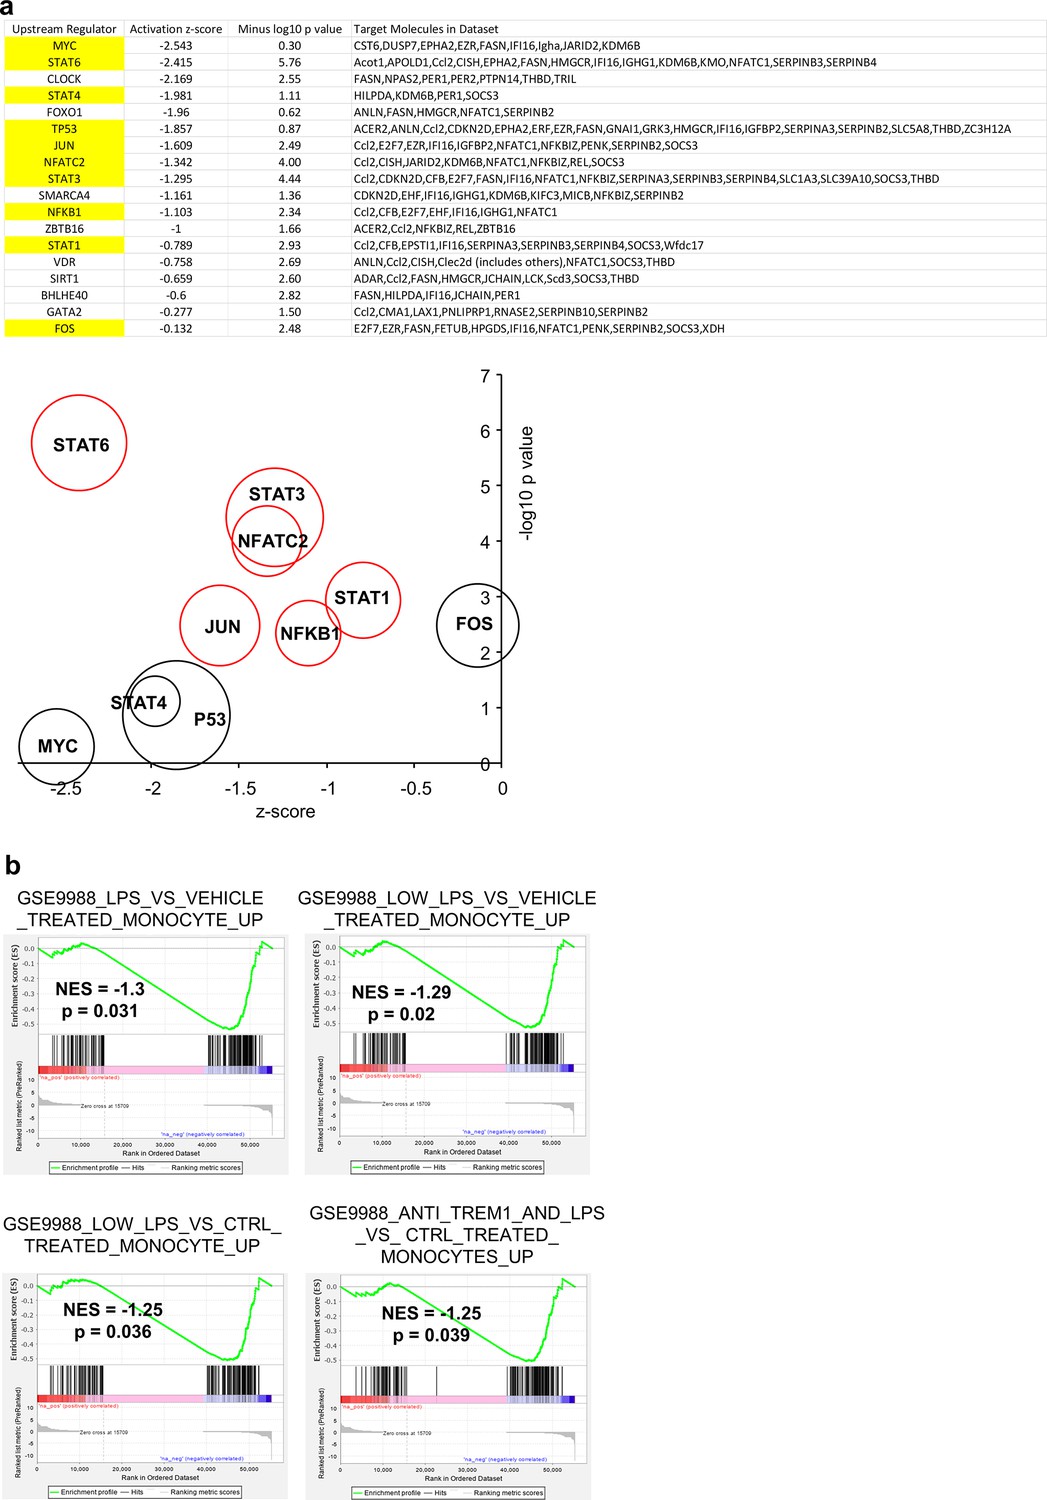
(a) IPA upstream regulator (USR) analysis (direct only) for 199 feet differentially expressed genes (DEGs) from Supplementary file 6b (for GzmaS211A vs. 6J). This analysis largely restricts the output to transcription factors. The transcription factors with well-known inflammation and immune functions are highlighted in yellow and are plotted on the bubble graph. Red circles indicate transcription factors where the -log10 p-value > 2 and z-score < -0.75. The USRs are downregulated in GzmaS211A mice (negative z-score) and are thus upregulated by proteolytically active granzyme A (GZMA) in 6J mice. (b) Interrogation of the Molecular Signature Database (http://www.gsea-msigdb.org/gsea/msigdb/index.jsp) identified DEGs listed for GSE19888 as showing significant enrichment in the downregulated genes in GzmaS211A feet (Supplementary file 6h; preranked by fold change). Thus, DEGs upregulated in activated monocytes were significantly enriched in the genes upregulated in 6J mice by GZMA.
Figure 7
Summary of chikungunya virus (CHIKV) foot swelling and granzyme A (GZMA) bioactivity, and the poor concordance between the two.
(a) Summary of foot swelling results. 6N and Gzma-/- mice have a 6N or mixed 6J/6N background and have an intact Nnt gene and show reduced CHIKV-induced foot swelling. MitoTEMPO treatment also reduced foot swelling. 6J, GzmaS211A, and 6N∆Nnt8-12 mice are all missing exons 8–12 of Nnt and show increased foot swelling. (b) Summary of GZMA bioactivity. Using polyinosinic:polycytidylic acid (poly(I:C)) to induce high levels of GZMA secretion from NK cells, studies in GzmaS211A mice illustrated that proteolytically active circulating GZMA promotes certain immune-stimulating/pro-inflammatory responses (dominant transcription factor upstream regulators (USRs) are shown; Figure S11a). No clear consensus has emerged regarding the molecular target(s) of GZMA (??); two potential extracellular candidate targets are shown; protease activated receptors and pro-IL-1. (c) Low overlap between CHIKV and GZMA induced differentially expressed genes (DEGs). DEGs upregulated in feet by CHIKV infection of 6J mice on days 2 and 7 (a low stringency filter of q < 0.05 was applied to the all gene lists in Supplementary file 2f to provide these DEGs) were compared with the DEGs upregulated in feet by active GZMA in 6J mice 6 hr after poly(I:C) treatment (i.e., downregulated in GzmaS211A mice; Supplementary file 6b). Overlapping genes (n = 27 and 20) are listed in Supplementary file 6i. The mean peak levels of serum GZMA for each group are shown below the Venn diagrams. (d) Cytokine USRs for GZMA vs. CHIKV. A series of cytokine USRs were induced by proteolytically active GZMA (i.e., upregulated for 6J + polyIC vs. GzmaS211A + polyIC; Supplementary file 6g, column R). The same USRs were significantly more upregulated by CHIKV infection (Supplementary file 2i). Data for GZMA (orange) and CHIKV (yellow) are plotted with bubble size representing number of molecules in dataset.
Figure 8 with 2 supplements
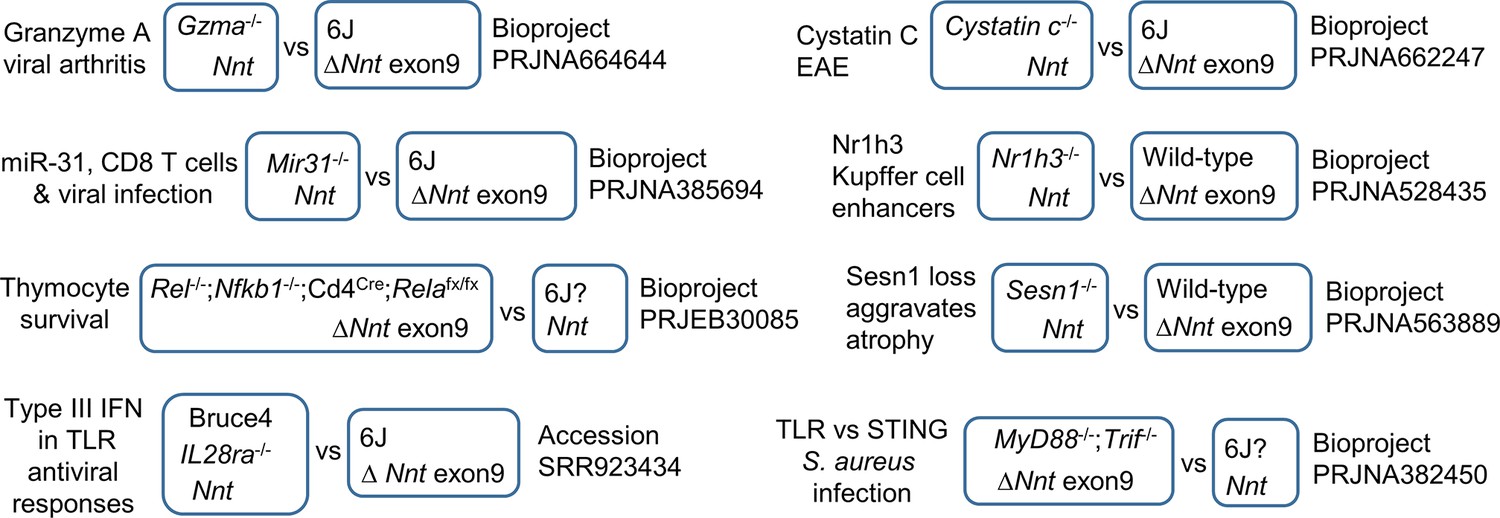
k-mer mining of BioProjects where Nnt+ mice were compared with Nnt- mice.
The NCBI Sequence Read Archive (SRA) database was interrogated by k-mer mining for BioProjects where (i) some Run Accessions (listing 6J as the mouse strain) had reads compatible with a 6J background (reads for Nnt exon 2, but not exon 9) and (ii) other Run Accessions in that BioProject (listing 6J as the mouse strain) had reads not compatible with a 6J background (reads for Nnt exons 2 and 9). The methodology is described in Figure 8—figure supplement 1a, validated by BLAST alignments (Figure 8—figure supplement 1b), with raw data in Supplementary file 7d and e.
Figure 8—figure supplement 1
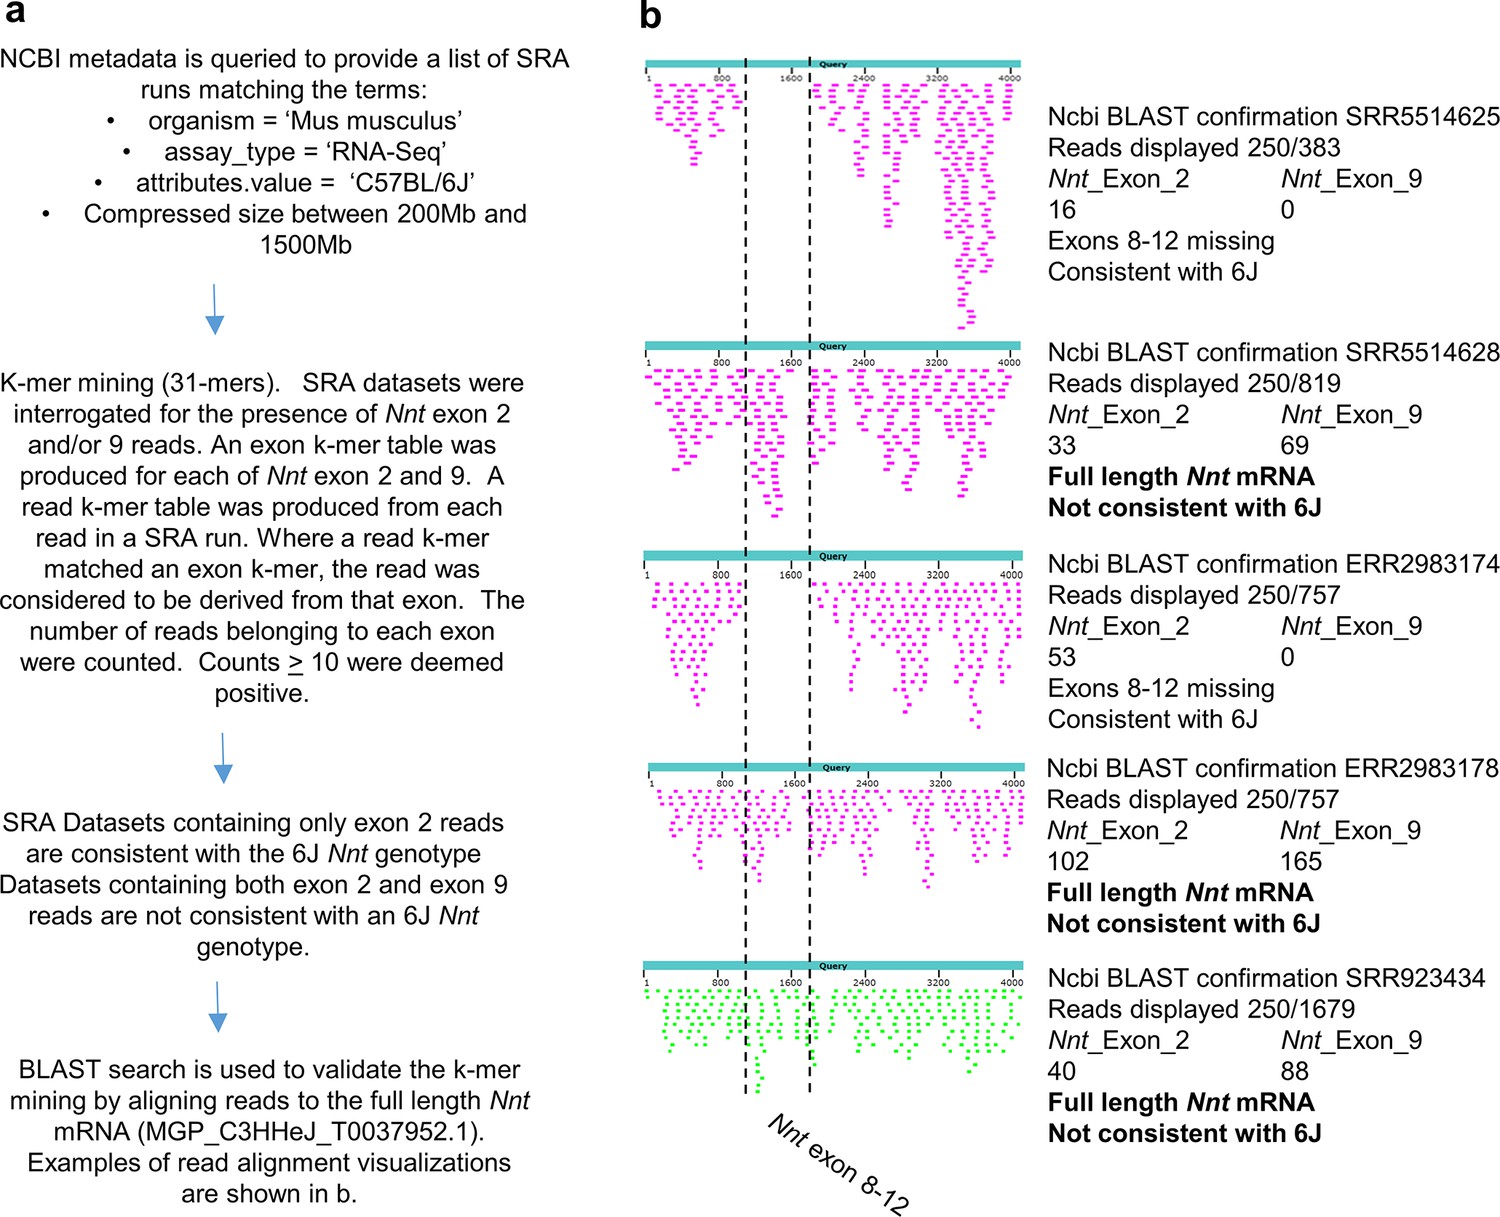
k-mer mining methodology and validation.
(a) Outline of bioinformatics approach. See Materials and methods for details. (b) Reads aligned to Nnt mRNA for selected accessions from Supplementary file 7. The results illustrate that where k-mer mining showed the presence of reads for exons 2 and 9, those Run Accessions had full-length Nnt mRNA (not consistent with 6J). k-mer mining showing the presence of reads for exon 2, but not 9, represent runs where exons 8–12 are missing (consistent with 6J).
Figure 8—figure supplement 2
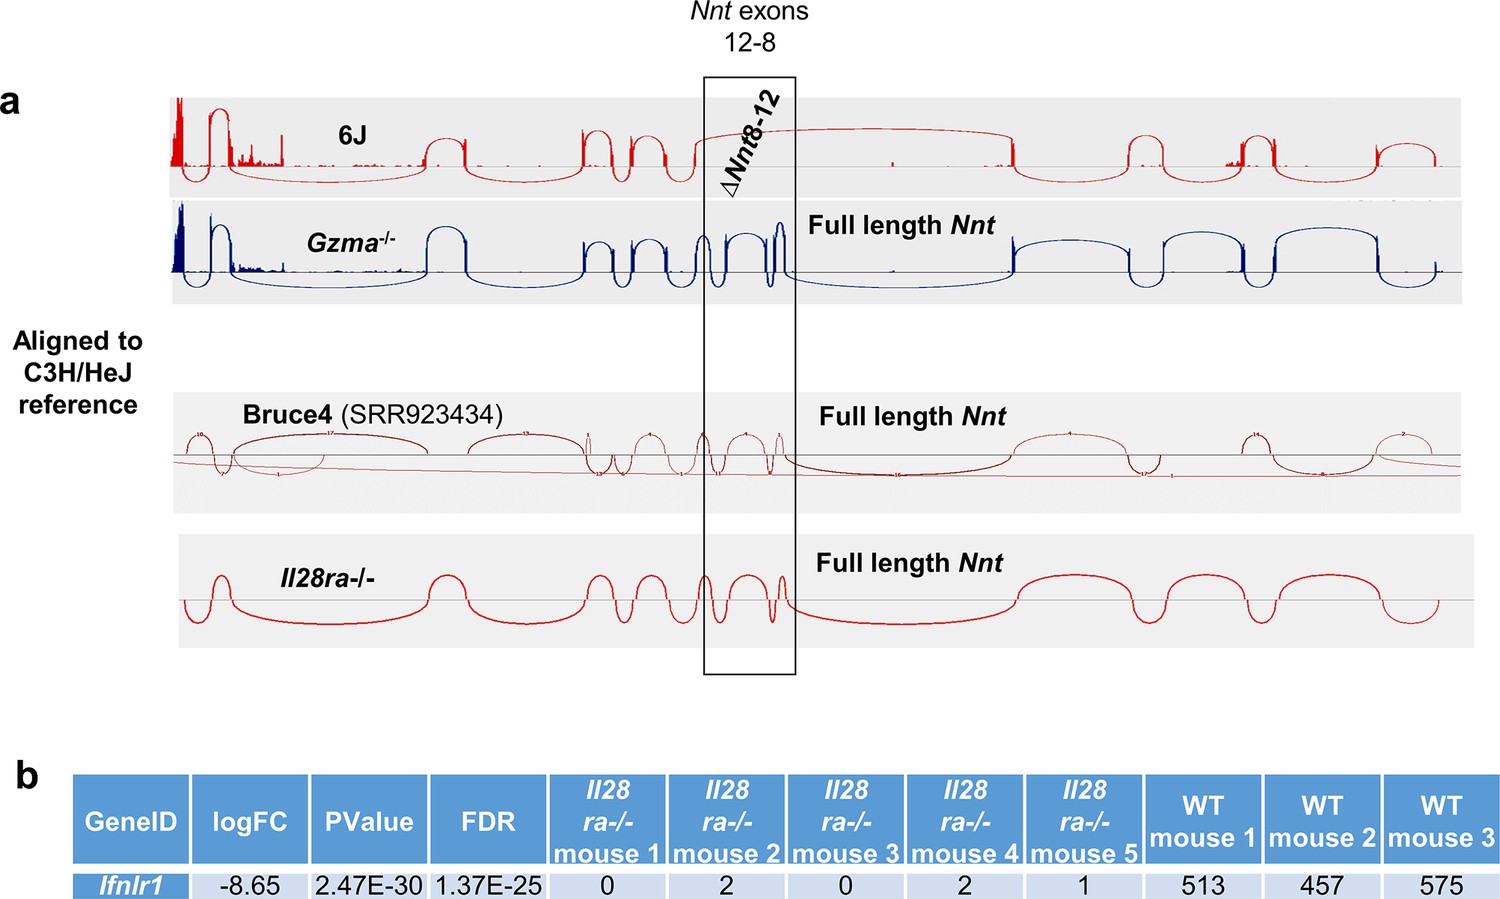
Bruce4 ES cell line and IL28RA-/- mouse Nnt genotypes.
(a) Integrative Genomics Viewer (IGV) Sashimi plots of RNA-Seq alignments to the Nnt gene using the C3H/HeJ reference genome. Undertaken as described for Figure 3d. Il28ra-/- mice were available in-house and were subjected to RNA-Seq analysis. Bruce4 RNA-Seq data was obtained from SRR923434. (b) RNA-Seq analysis showed that, as expected, Il28ra (Ifnlr1) mRNA expression is lost in Il28ra-/- mice.
Tables
Table 1
Cytoscape analysis of downregulated differentially expressed genes (DEGs) in GzmaS211A mice.
RNA-Seq of feet taken from GzmaS211A vs. 6J mice 6 hr after polyinosinic:polycytidylic acid (poly(I:C)) injection provided 199 differentially expressed genes (DEGs), of which 100 were downregulated in GzmaS211A mice (Supplementary file 6b). When analyzed by Cytoscape, the top annotations were associated with negative regulation (underlined) of protease activities (bold) or negative regulation of protein metabolism (which includes anabolism and catabolism). Also significant were a series of annotations associated with negative regulation of cell signaling (italics). The complete list is shown in Supplementary file 6e; top annotations are shown here with duplicates removed.
| Category | Description | FDR value |
|---|---|---|
| GO Process | Negative regulation of cellular protein metabolic process | 1.91E-06 |
| UniProt Keywords | Protease inhibitor | 9.20E-06 |
| SMART Domains | SERine Proteinase INhibitors | 2.60E-05 |
| GO Process | Negative regulation of catalytic activity | 6.73E-05 |
| GO Process | Negative regulation of nitrogen compound metabolic process | 7.86E-05 |
| GO Process | Negative regulation of cellular metabolic process | 7.86E-05 |
| InterPro Domains | Serpin superfamily | 1.10E-04 |
| GO Process | Negative regulation of molecular function | 1.30E-04 |
| GO Function | Enzyme inhibitor activity | 1.50E-04 |
| UniProt Keywords | Serine protease inhibitor | 1.50E-04 |
| GO Process | Negative regulation of macromolecule metabolic process | 1.90E-04 |
| GO Process | Negative regulation of protein modification process | 2.60E-04 |
| GO Process | Negative regulation of hydrolase activity | 2.80E-04 |
| GO Function | Serine-type endopeptidase inhibitor activity | 6.60E-04 |
| GO Process | Negative regulation of phosphate metabolic process | 7.40E-04 |
| GO Function | Endopeptidase inhibitor activity | 8.50E-04 |
| GO Process | Negative regulation of endopeptidase activity | 0.001 |
| GO Process | Negative regulation of intracellular signal transduction | 0.0014 |
| GO Process | Negative regulation of protein phosphorylation | 0.0014 |
| GO Process | Regulation of protein metabolic process | 0.0015 |
| GO Process | Negative regulation of MAPK cascade | 0.0061 |
| GO Process | Negative regulation of cellular process | 0.0063 |
| GO Process | Negative regulation of biological process | 0.0071 |
Key resources table
| Reagent type (species) or resource | Designation | Source or reference | Identifiers | Additional information |
|---|---|---|---|---|
| Strain, strain background (chikungunya virus) | CHIKV | Dr. P. Roques (CEA, Fontenay-aux-Roses, France) | KT449801.1 | Isolate LR2006-OPY1 |
| Chemical compound, drug | TRIzol | Sigma-Aldrich | Cat# 15596026 | |
| Chemical compound, drug | MitoTEMPO | Sigma-Aldrich | Cat#1334850-99-5 | |
| Commercial assay, kit | TruSeq RNA Sample Prep Kit (v2) | Illumina | SCR_010233 | |
| Commercial assay, kit | TruSeq Stranded mRNA library preparation kit | Illumina | SCR_010233 | |
| Commercial assay, kit | QIAamp DNA Micro Kit | QIAGEN | Cat# 56304 | |
| Commercial assay, kit | iScript cDNA Synthesis Kit | Bio-Rad | Cat# 1708890 | |
| Commercial assay, kit | Q5 Hot Start High-Fidelity DNA Polymerase | NEB | Cat# M0493S | Enzyme |
| Other | Illumina HiSeq 2000 Sequencer | Illumina | RRID:SCR_010233 | Sequencing platform |
| Other | NextSeq 550 | Illumina | RRID:SCR_016381 | Sequencing platform |
| Other | NovaSeq 6000 | Illumina | RRID:SCR_016387 | Sequencing platform |
| Software, algorithm | k-mer_mining_SRA | GitHub | https://github.com/CameronBishop/k-mer_mining_SRA | |
| Cell line (Cercopithecus aethiops) | Vero cells | ATCC | RRID:CVCL_0059 | |
| Cell line (Aedes albopictus) | C6/36 cells | ATCC | RRID:CVCL_Z230 | |
| Strain, strain background (Mus musculus) | C57BL/6J | Animal Resources Centre (Canning Vale, WA, Australia) | IMSR_JAX:000664 | |
| Strain, strain background (M. musculus) | C57BL/6N | The Jackson Laboratory | Stock no. 005304 | |
| Strain, strain background (M. musculus) | C57BL/6-Gzma-/- | Peter MacCallum Cancer Centre, Melbourne, Victoria, Australia | Knockout mouse | |
| Strain, strain background (M. musculus) | C57BL/6J-Gzmb-/- | Peter MacCallum Cancer Centre, Melbourne, Victoria, Australia | Knockout mouse | |
| Strain, strain background (M. musculus) | C57BL/6J-GzmaS211A | The Australian Phenomics Network, Monash University, Melbourne, Australia (this paper) | Mutant mouse | |
| Strain, strain background (M. musculus) | C57BL/6N∆Nnt8-12 | The Australian Phenomics Network, Monash University, Melbourne, Australia (this paper) | Knockout mouse | |
| Strain, strain background (M. musculus) | C57BL/6J-Ifnar-/- | Dr P. Hertzog (Monash University, Melbourne, Australia) | Knockout mouse | |
| Strain, strain background (M. musculus) | C57BL/6-Il28ra-/- | Bristol-Myers Squibb (PMID:25901316) | Knockout mouse | |
| Sequence-based reagent | Nnt_RTPCR_F1 | This paper | PCR primers | AACAGTGCAAGGAGGTGGAC |
| Sequence-based reagent | Nnt_RTPCR_R1 | This paper | PCR primers | GTGCCAAGGTAAGCCACAAT |
| Software, algorithm | FastQC | Babraham Institute | RRID:SCR_014583 | |
| Software, algorithm | MultiQC | PMID:27312411 | RRID:SCR_014982 | |
| Software, algorithm | Cutadapt | DOI: https://doi.org/10.14806/ej.17.1.200 | RRID:SCR_011841 | |
| Software, algorithm | STAR | PMID:23104886 | RRID:SCR_004463 | |
| Software, algorithm | RSEM | PMID:21816040 | RRID:SCR_013027 | |
| Software, algorithm | EdgeR | PMID:27280887 | RRID:SCR_012802 | |
| Software, algorithm | ‘Ingenuity Pathway Analysis’ (IPA) | QIAGEN | RRID:SCR_008653 | |
| Software, algorithm | Cytoscape | PMID:14597658 | RRID:SCR_003032 | |
| Software, algorithm | STRING | PMID:30476243 | RRID:SCR_005223 | |
| Software, algorithm | ‘Gene Set Enrichment Analysis’ (GSEA) | PMID:16199517 | RRID:SCR_003199 | |
| Software, algorithm | ‘Integrative Genomics Viewer‘ (IGV) | PMID:21221095 | RRID:SCR_011793 | |
| Software, algorithm | minimap2 | PMID:29750242 | RRID:SCR_018550 | |
| Software, algorithm | BigQuery | Google Cloud Platform | RRID:SCR_001011 | |
| Software, algorithm | fasterq-dump | SRA tool kit | sra-tools v 2.9.1 |
Additional files
-
Supplementary file 1
Summary of studies using Gzma-/- mice.
Compilation of studies employing Gzma-/- or Gzma-/- Gzmb-/- double KO mice that reveal a phenotype or do not show a phenotype.
- https://cdn.elifesciences.org/articles/70207/elife-70207-supp1-v1.docx
-
Supplementary file 2
RNA-Seq of Gzma-/-+ chikungunya virus (CHIKV) vs. 6J + CHIKV and 6J + CHIKV vs. 6J mock infection.
Datasets for RNA-Seq and Ingenuity Pathway Analysis (IPA) of mice feet day 6 post infection from CHIKV-infected Gzma-/- mice vs. CHIKV-infected 6J mice and of mice feet day 7 post infection from 6J + CHIKV vs. 6J mock infection.
- https://cdn.elifesciences.org/articles/70207/elife-70207-supp2-v1.xlsx
-
Supplementary file 3
Genetic differences between Gzma-/- and C57BL/6J.
Genetic differences potentially involved in inflammation or arthritis are indicated. Nnt not included. Differences in introns not included.
- https://cdn.elifesciences.org/articles/70207/elife-70207-supp3-v1.docx
-
Supplementary file 4
RNA-Seq for 6NNnt∆8-12+ chikungunya virus (CHIKV) vs. 6N + CHIKV.
Datasets for RNA-Seq and Ingenuity Pathway Analysis (IPA) of mice feet day 6 post infection; 6NNnt∆8-12+ CHIKV vs. 6N + CHIKV.
- https://cdn.elifesciences.org/articles/70207/elife-70207-supp4-v1.xlsx
-
Supplementary file 5
RNA-Seq of chikungunya virus (CHIKV)-infected mice treated with MitoTEMPO.
Datasets for RNA-Seq and Ingenuity Pathway Analysis (IPA) of mice feet day 6 post infection; 6J + MitoTEMPO + CHIKV vs. 6J + PBS + CHIKV.
- https://cdn.elifesciences.org/articles/70207/elife-70207-supp5-v1.xlsx
-
Supplementary file 6
RNA-Seq of GzmaS211A vs. 6J mice injected with polyinosinic:polycytidylic acid (poly(I:C)).
Datasets for RNA-Seq, Ingenuity Pathway Analysis (IPA), and Cytoscape analyses of mice feet and spleen taken 6 hr after injection with poly(I:C); GzmaS211A vs. 6J.
- https://cdn.elifesciences.org/articles/70207/elife-70207-supp6-v1.xlsx
-
Supplementary file 7
k-mer mining of the NCBI Sequence Read Archive (SRA).
Datasets for exact-match (31 mer) k-mer mining approach to identify full-length Nnt reads (6N background) in accessions listing C57BL/6J mice as the mouse strain.
- https://cdn.elifesciences.org/articles/70207/elife-70207-supp7-v1.xlsx
-
Supplementary file 8
No evidence for TLR9 involvement.
(a) Tlr9-/- and 6J mice were injected intraplantar into the feet with 5 µg recombinant mouse granzyme A (GZMA) in 20 µl and foot swelling measured over time as described (Schanoski et al., 2019) (n = 4 mice and four feet per group; statistics by Kolmogorov–Smirnov tests). Tlr9-/- mice were derived from 129/Ola × C57BL/6F1 progeny (http://www.myv.ne.jp/obs/index.files/tlr_eng.htm). (b) As for (a) using Tlr9M7Btlr/Mmjax and 6J mice. Tlr9M7Btlr/Mmjax mice have a Tlr9 missense point mutation and do not respond to oligonucleotides containing CpG motifs (https://www.jax.org/strain/014534). (c) Tlr9-/- mice (like 6J) do not encode the full Nnt gene. (d) Female 8–10-week-old Tlr9-/- and 6J mice (n = 6 mice and 12 feet per group) were infected with chikungunya virus (CHIKV) and feet measured over time. Statistics by Kolmogorov–Smirnov tests. (e) Female C57BL/6J-Tlr9M7Btlr/Mmjax mice (n = 6 mice and 12 feet per group) were infected as for (d). (f) Viremia for the mice in (d). After GZMA injection, Tlr9-/- mice showed increased foot swelling (a), whereas C57BL/6J-Tlr9M7Btlr/Mmjax mice showed no significant difference (b). Tlr9-/- mice also have the Nnt deletion (c); however, they are on a mixed 129/Ola and C57BL/6 background (Hemmi et al. 2000), with 129/SvJ mice showing increased inflammatory infiltrates in certain settings (Hoover-Plow et al., 2008). After CHIKV infection, foot swelling was again increased in Tlr9-/- (d), but not Tlr9M7Btlr/Mmjax mice (e). Tlr9-/- mice did not show an increased viremia (f). These data do not support a contention that TLR9 is required for GZMA’s bioactivity.
- https://cdn.elifesciences.org/articles/70207/elife-70207-supp8-v1.zip
-
Transparent reporting form
- https://cdn.elifesciences.org/articles/70207/elife-70207-transrepform1-v1.docx
-
Source data 1
Source data for DNA gel images.
Source data for DNA gel images in Figure 3e, Figure 1—figure supplement 1b,c, and Figure 4—figure supplement 1e.
- https://cdn.elifesciences.org/articles/70207/elife-70207-supp9-v1.zip
Download links
A two-part list of links to download the article, or parts of the article, in various formats.
Downloads (link to download the article as PDF)
Open citations (links to open the citations from this article in various online reference manager services)
Cite this article (links to download the citations from this article in formats compatible with various reference manager tools)
Widespread discrepancy in Nnt genotypes and genetic backgrounds complicates granzyme A and other knockout mouse studies
eLife 11:e70207.
https://doi.org/10.7554/eLife.70207


