Coronary blood vessels from distinct origins converge to equivalent states during mouse and human development
- Department of Genetics, Stanford University School of Medicine, United States
- Department of Biology, Stanford University, United States
- Division of Pediatric Cardiology, Department of Pediatrics, Stanford University School of Medicine, United States
- Stanford Cardiovascular Institute, Stanford University School of Medicine, United States
- Department of Bioengineering and Department of Applied Physics, Stanford University, United States
- Chan Zuckerberg Biohub, United States
- Institute for Stem Cell Biology and Regenerative Medicine, Stanford University School of Medicine, United States
- Department of Obstetrics and Gynecology, Stanford University School of Medicine, United States
Figures
Figure 1 with 5 supplements
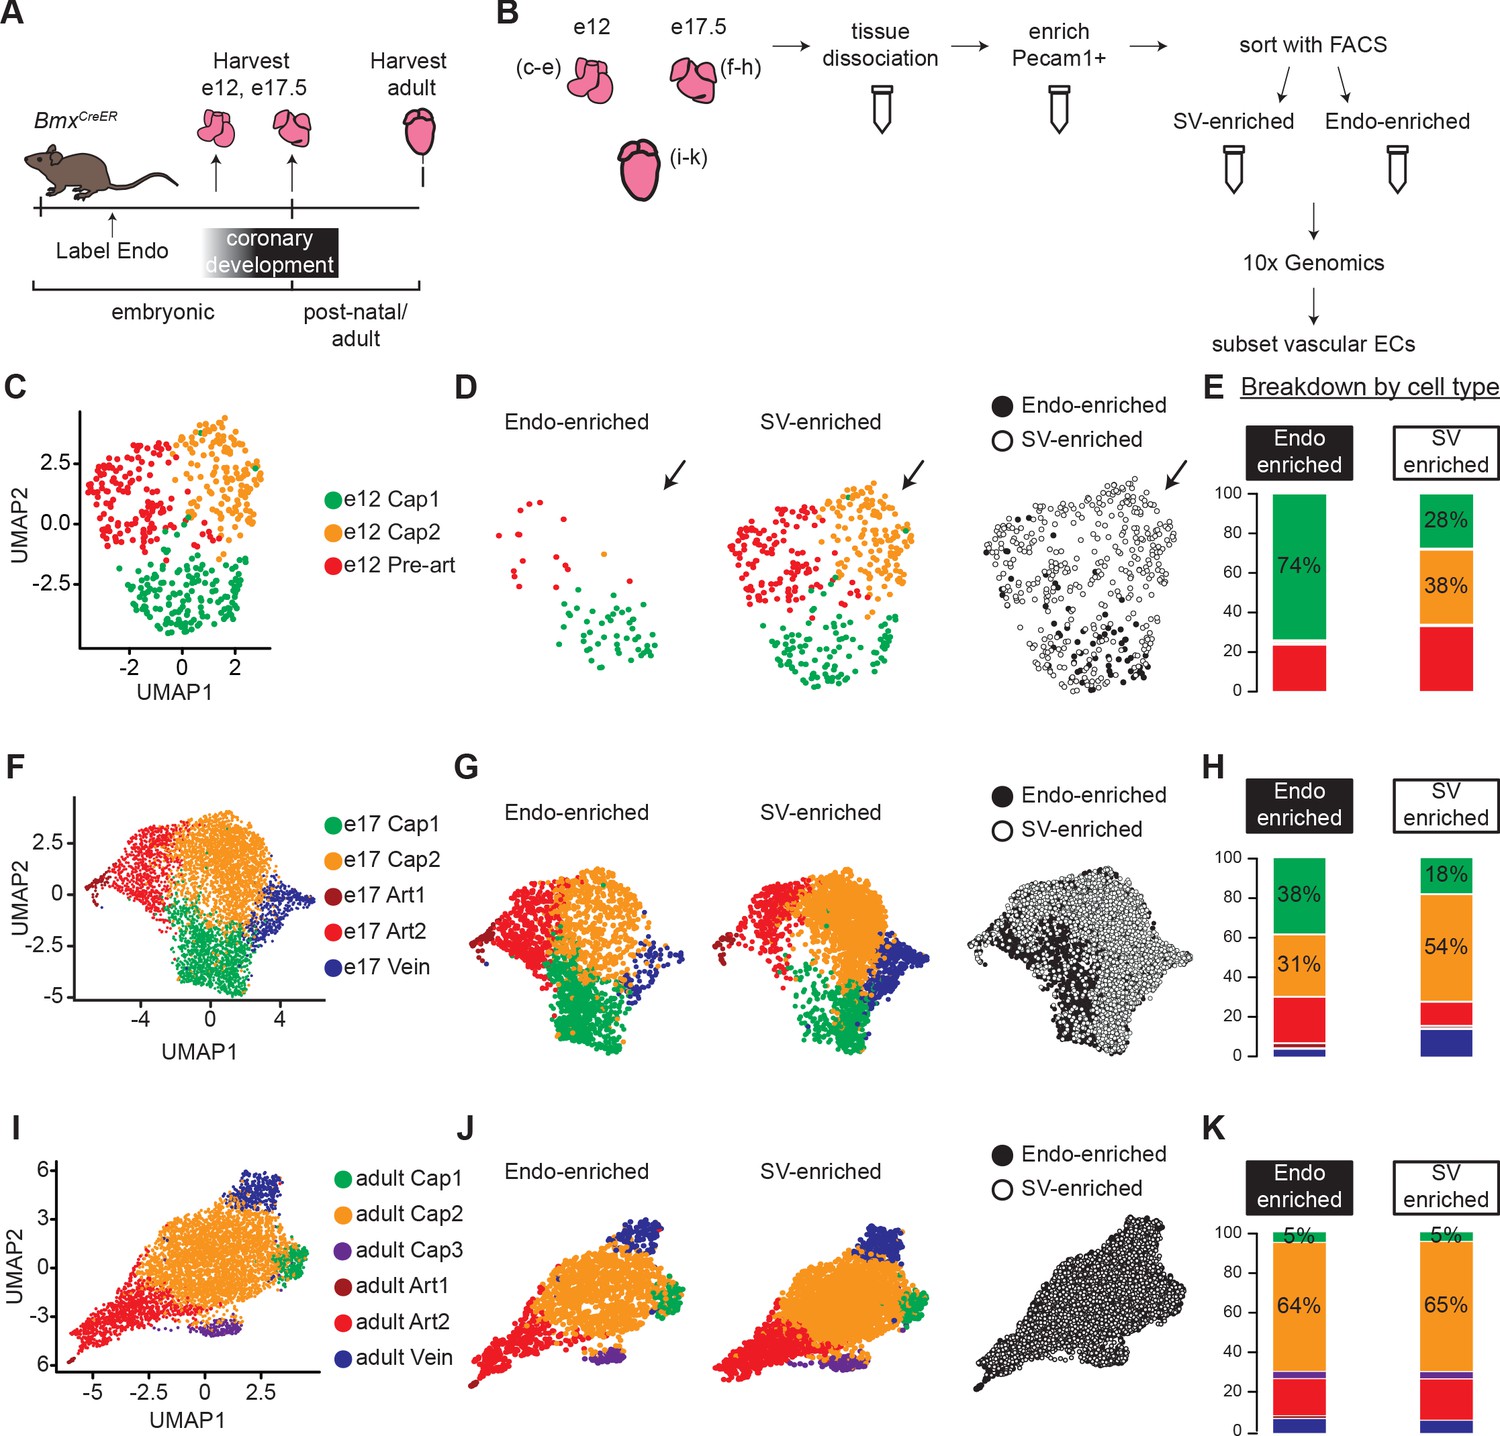
Single-cell RNA sequencing (ScRNAseq) of lineage-traced coronary endothelial cells (ECs) at three stages reveals capillary heterogeneity during embryonic development.
(A and B) Overview of lineage tracing and scRNAseq approach in embryonic and adult mice. (C–K) Unbiased clustering of embryonic coronary ECs at the indicated time points and the contribution of endocardium (Endo)-enriched (BmxCreER lineage-labeled) and sinus venosus (SV)-enriched (BmxCreER lineage negative) cells to each cluster. Uniform Manifold Approximation and Projections (UMAPs) are shown for combined data (C, F, and I) and separated by lineage (D, G, and J) and percentages enumerated (E, H, and K).
Figure 1—figure supplement 1
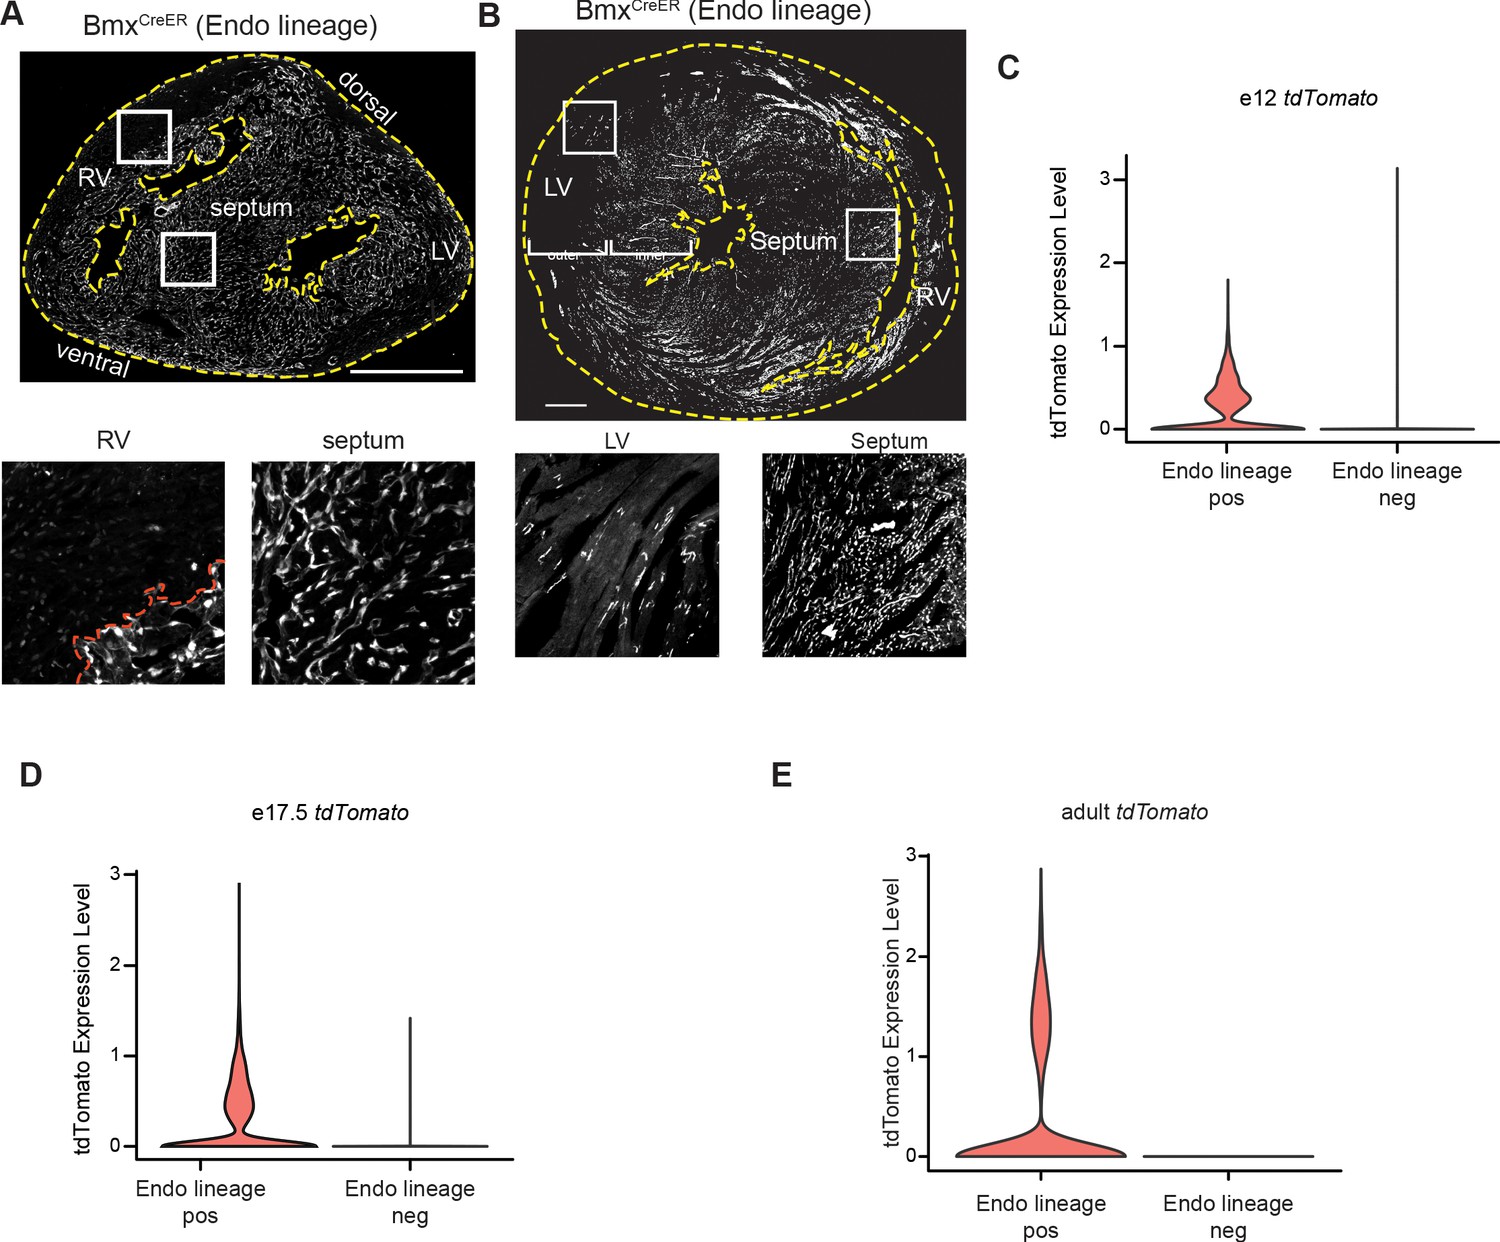
Localization and expression of recombinant markers.
(A and B) tdTomato localization in sections BmxCreER;RosatdTomato hearts at e17.5 (A) and adult (B). Dashed yellow lines indicate the borders of the tissue sections. Dashed red line indicates the CV/endocardium (Endo) border. (C–E) Expression of the tdTomato gene in the Endo-enriched (Endo-lineage-positive) and sinus venosus (SV)-enriched (Endo-lineage-negative) sorted samples at e12 (C), e17.5 (D), and adult (E) from BmxCreER;RosatdTomato hearts (as shown in Figure 1A–B). Scale bars = 500 μm.
Figure 1—figure supplement 2
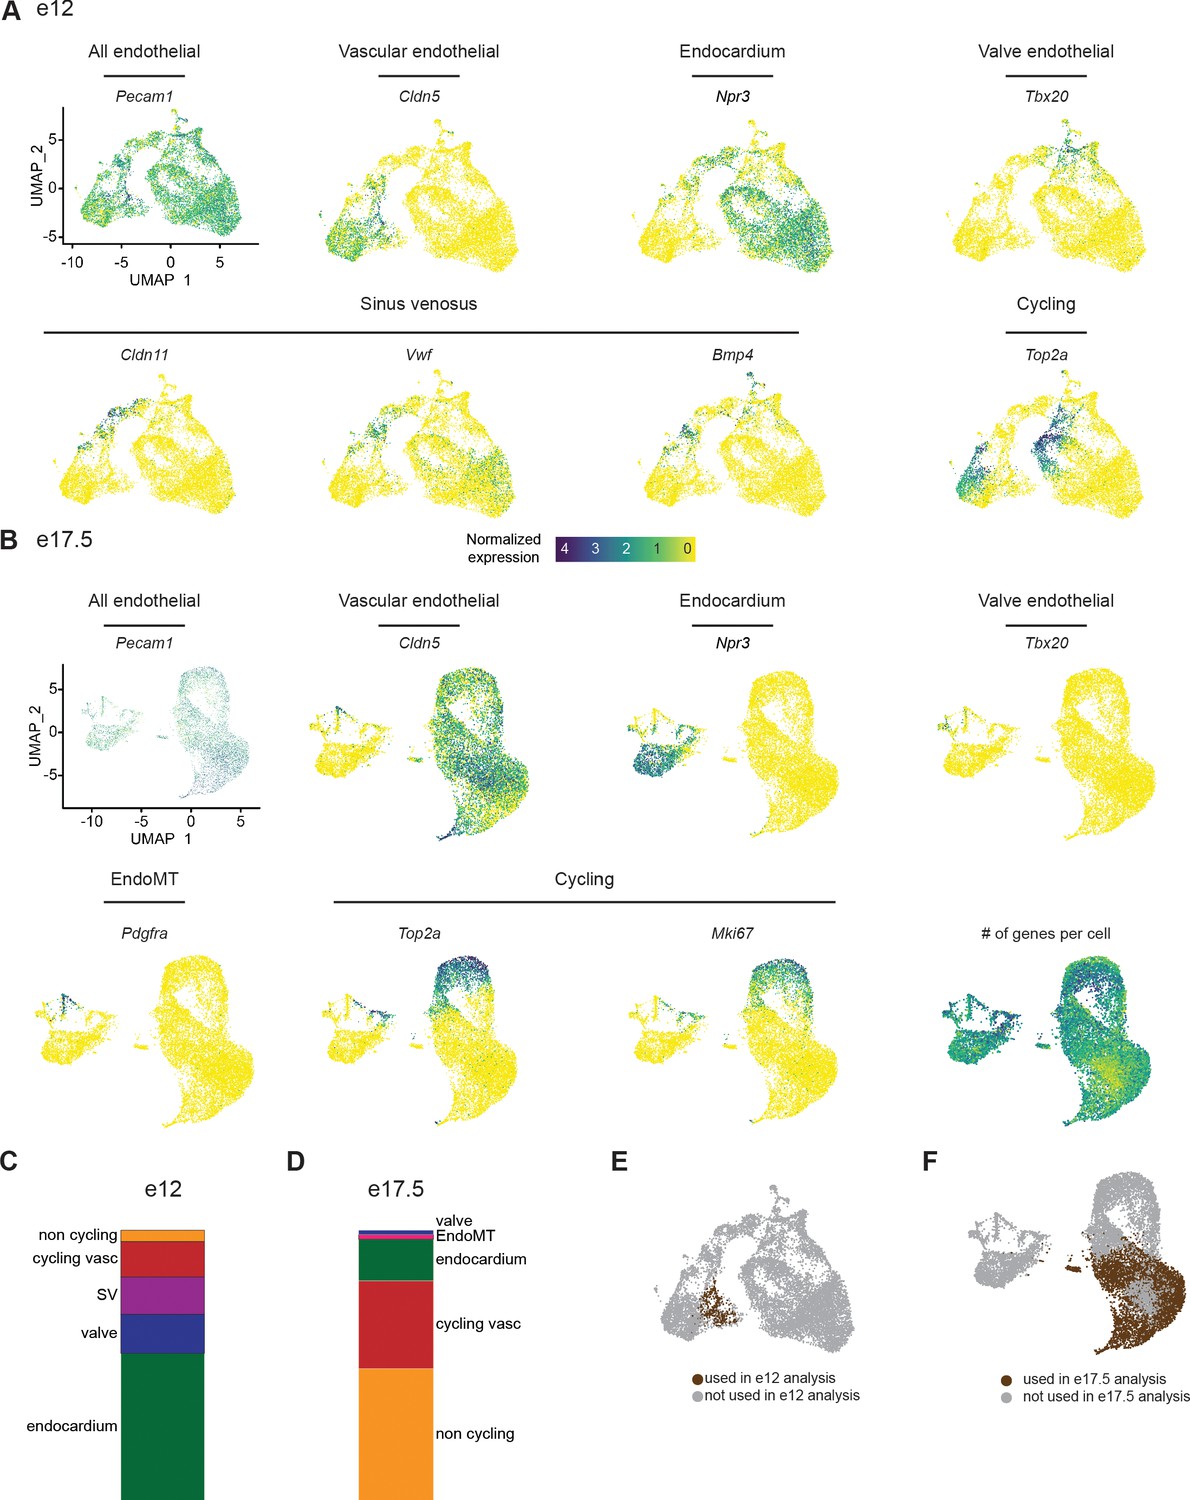
Selection of coronary vascular endothelial cells (ECs) from e12 and e17.5 datasets.
(A and B) Uniform Manifold Approximation and Projections (UMAPs) showing expression of selected EC subtype markers in e12 ECs (A) and e17.5 ECs (B). (C and D) Breakdown of cell types as percentage of total cells in e12 (C) and e17.5 (D). (E and F) UMAPs showing the cells that were used for the analysis of e12 coronary ECs in Figure 1C (E) and for the analysis of e17.5 coronary ECs in Figure 1F (F). Scale bar from (A) also applies to (B).
Figure 1—figure supplement 3
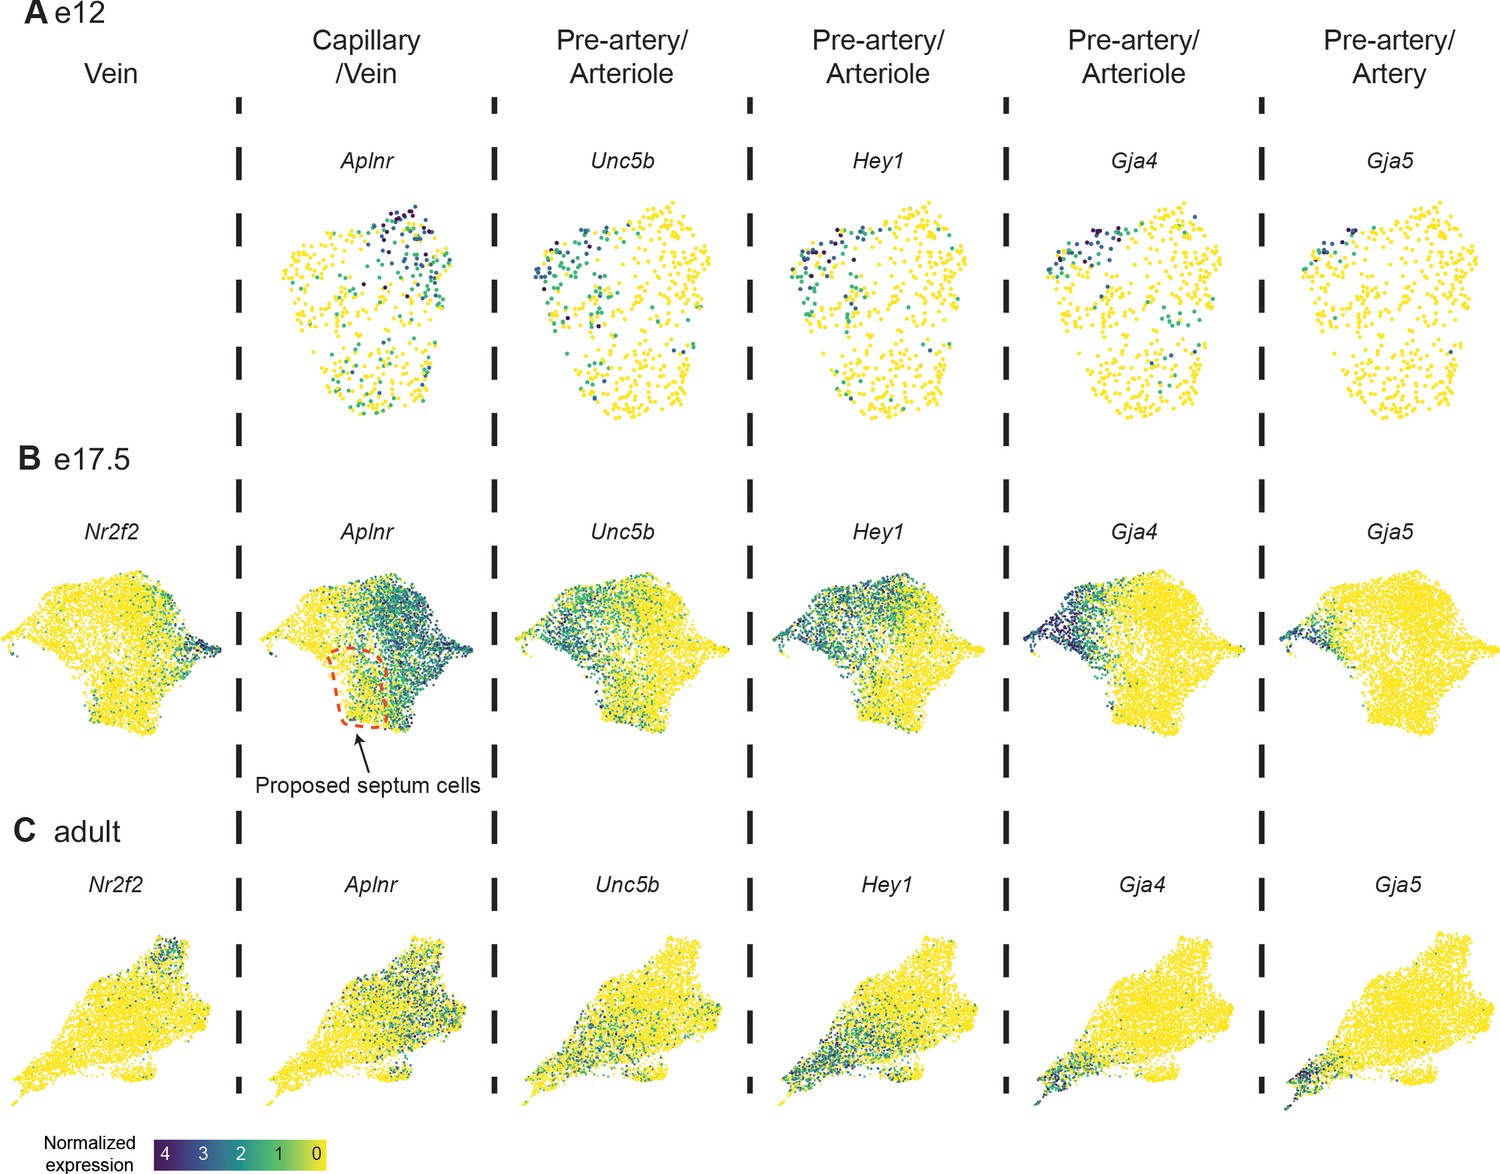
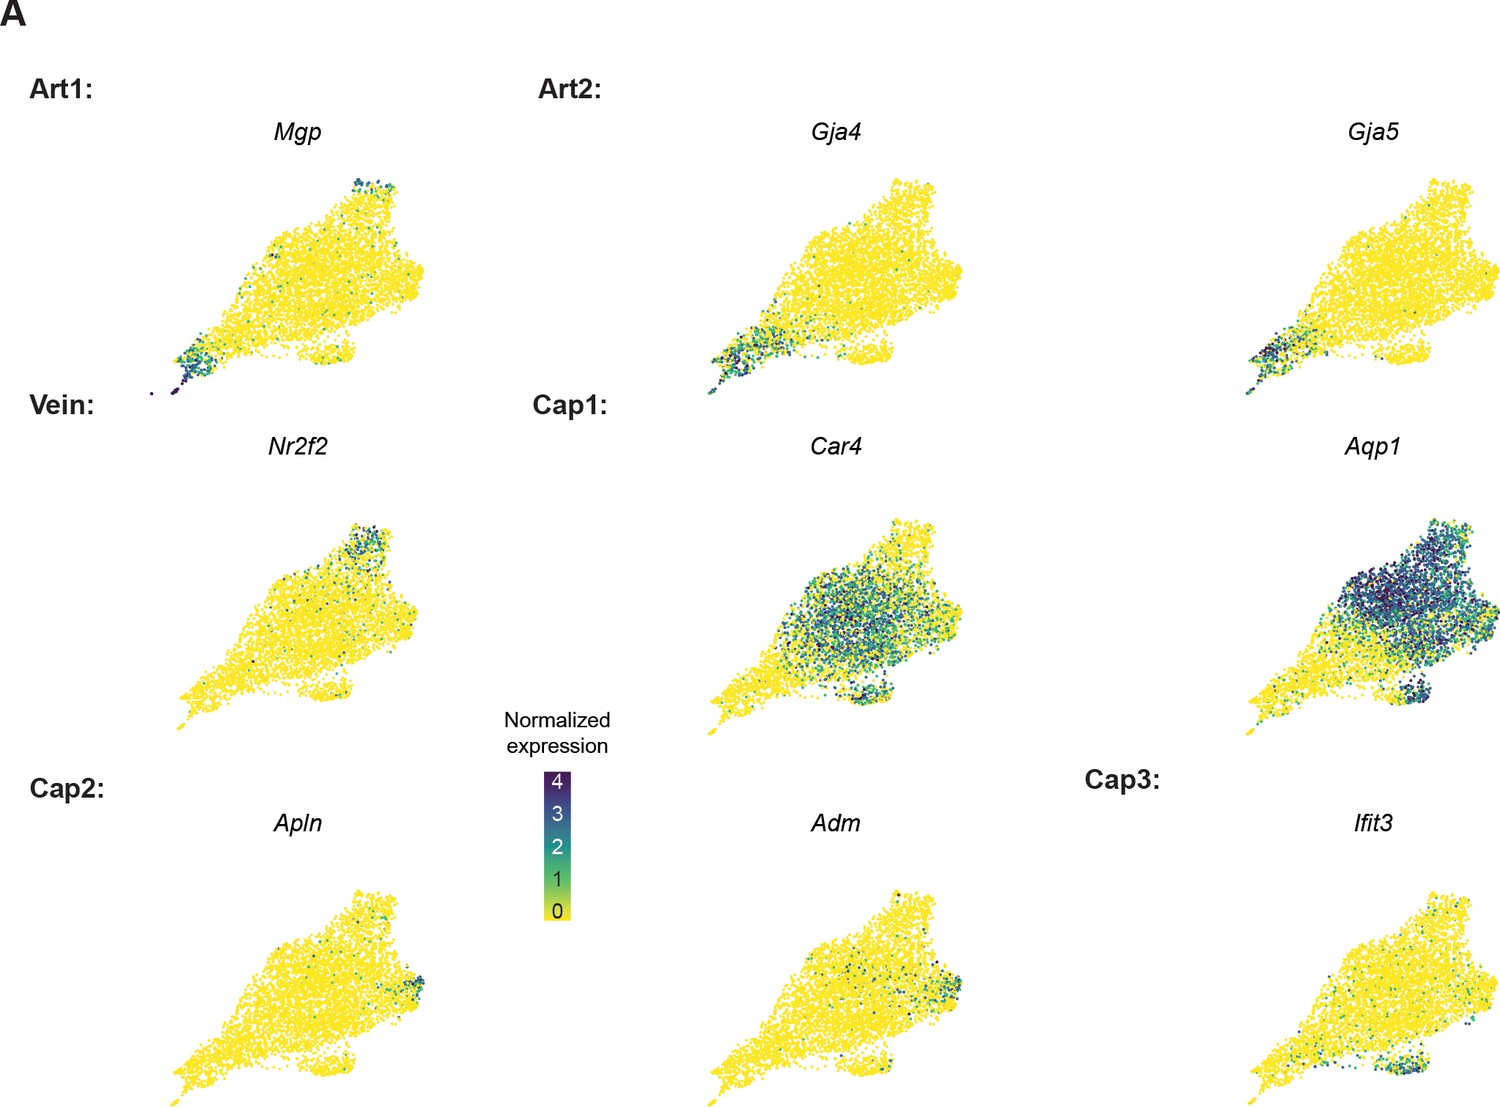
Coronary endothelial cell (EC) subtype markers.
(A, B, and C) Uniform Manifold Approximation and Projections (UMAPs) showing expression of selected coronary EC subtype markers in coronary ECs at e12 (A), e17.5 (B) and adult (C). Scale bar from (C) also applies to (A) and (B).
Figure 1—figure supplement 4
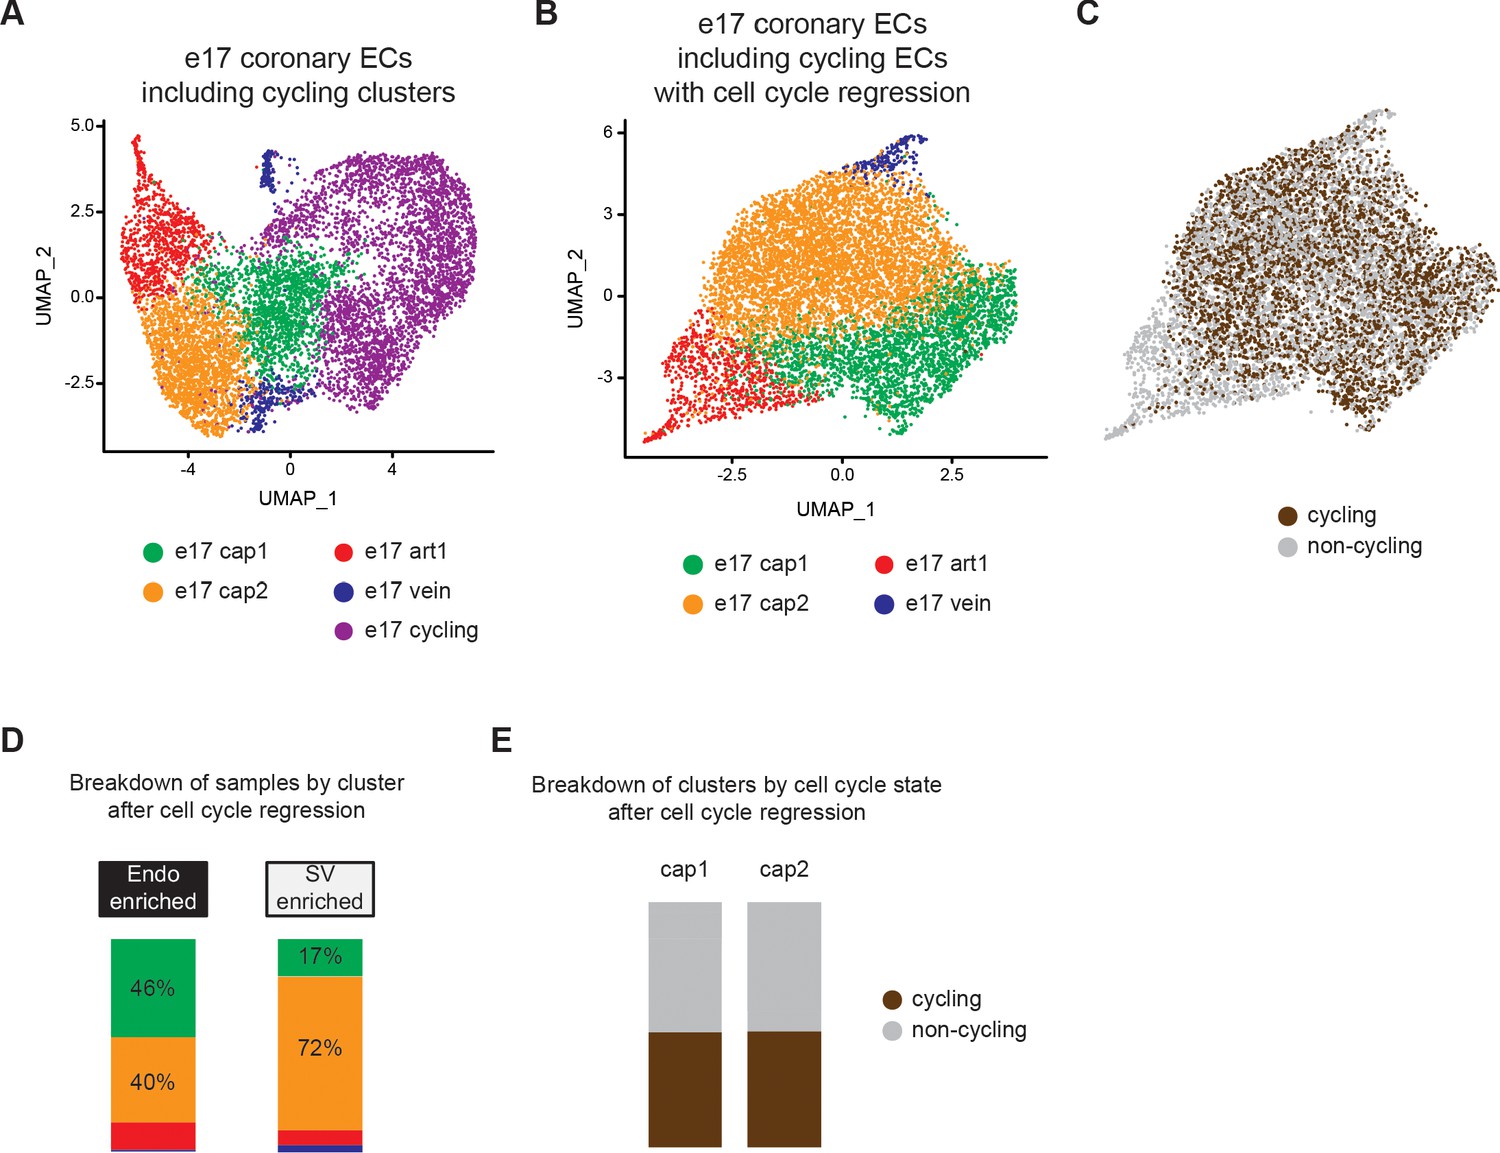
Cell cycle regression in e17.5 coronary endothelial cells (ECs).
(A) Uniform Manifold Approximation and Projection (UMAP) showing unbiased clustering of e17.5 mouse coronary ECs before the removal of cycling cells. (B) UMAP showing unbiased clustering of e17.5 mouse coronary ECs from (A) after cell cycle regression was performed. (C) Post-regression UMAP from (B) showing the cycling cells which were in the cycling cluster in (A). (D) Breakdown of endocardium (Endo)- and sinus venosus (SV)-enriched cells from (B) by cluster. (E) Breakdown of the capillary clusters in (B) into cells that are cycling or non-cycling.
Figure 1—figure supplement 5
Expression of marker genes adult mouse coronary endothelial cell (EC) dataset.
(A) Uniform Manifold Approximation and Projections (UMAPs) showing expression of selected coronary EC subtype markers in the adult coronary EC dataset from Figure 1.
Figure 2 with 2 supplements
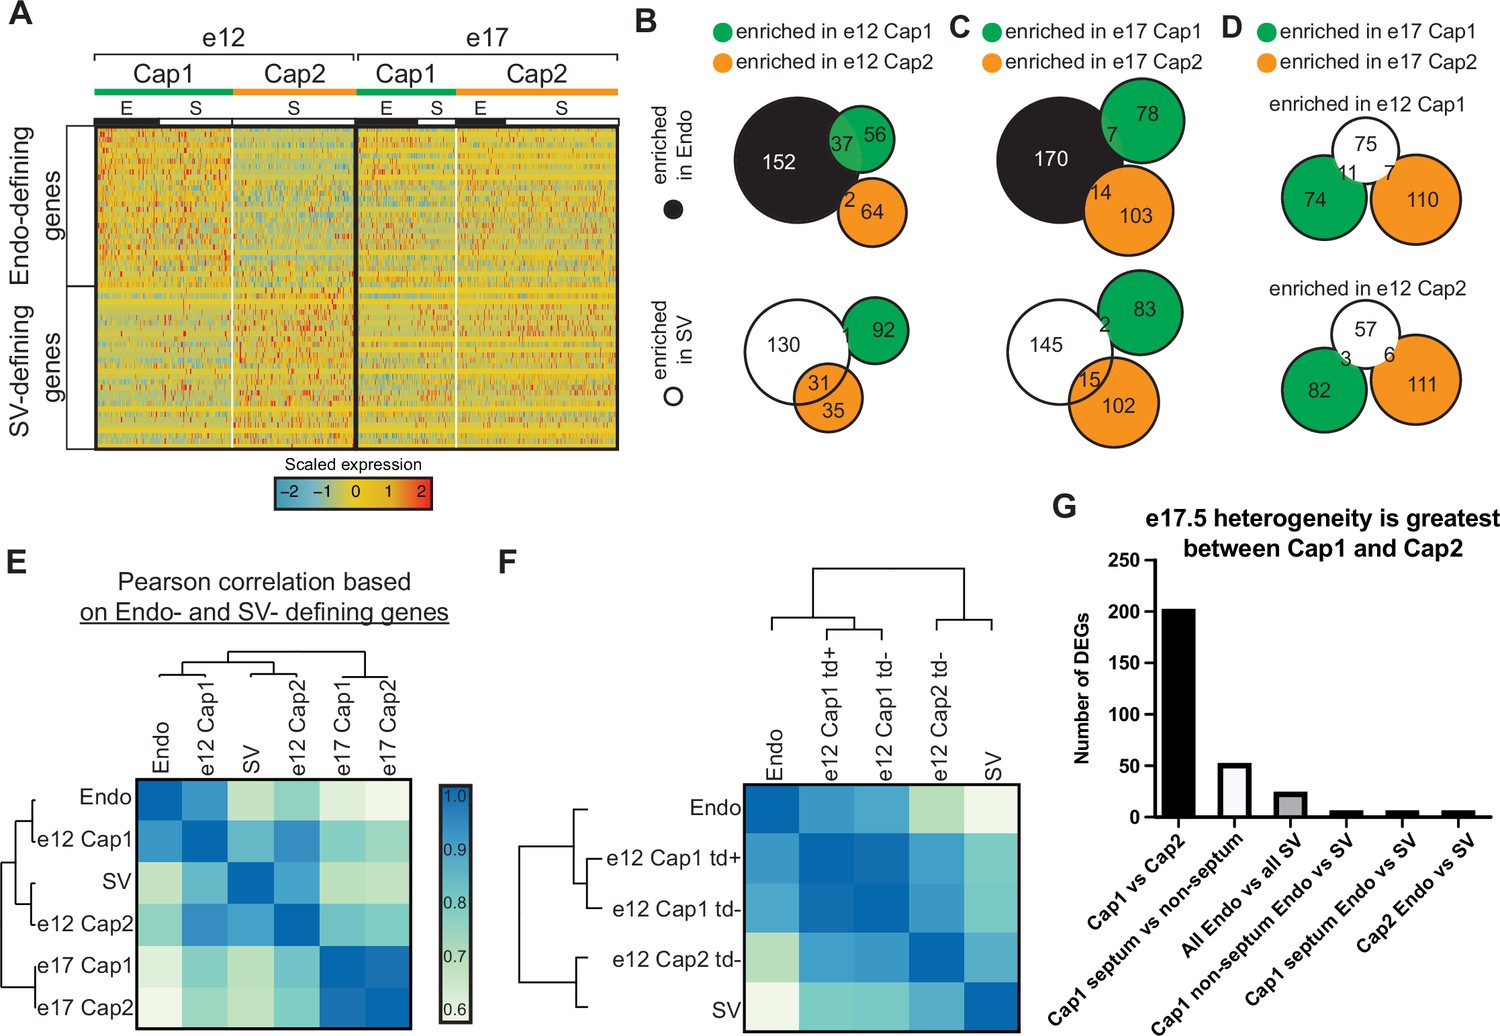
Expression of endocardium (Endo) and sinus venosus (SV) genes in coronary endothelial cells (ECs).
(A) Heatmap showing expression of the top 30 (by p-value) Endo-defining genes (enriched in the Endo compared to the SV) and the top 30 (by p-value) SV-defining genes (enriched in the SV compared to the Endo) in e12 and e17.5 capillary clusters (E = coronary cells from the Endo-enriched sample, S = coronary cells from the SV-enriched sample). (B and C) Venn diagrams showing overlap of Endo- and SV-defining genes with Cap1-enriched genes (enriched in Cap1 compared to Cap2) and e12 Cap2-enriched genes (enriched in Cap2 compared to Cap1) at e12 (B) and e17.5 (C). (D) Venn diagram showing overlap of e12 Cap1- and Cap2-enriched genes with e17.5 Cap1 and Cap2 genes. (E and F) Heatmaps of Pearson correlations based on expression of Endo- and SV-defining genes in the Endo, the SV, and capillary clusters from e12 and e17.5 in total (E) and separated by BmxCreER lineage as indicated by tdTomato (td) expression (F). (G) Bar plot showing number of differentially expressed genes (DEGs) between different subgroups of capillary cells.
Figure 2—figure supplement 1
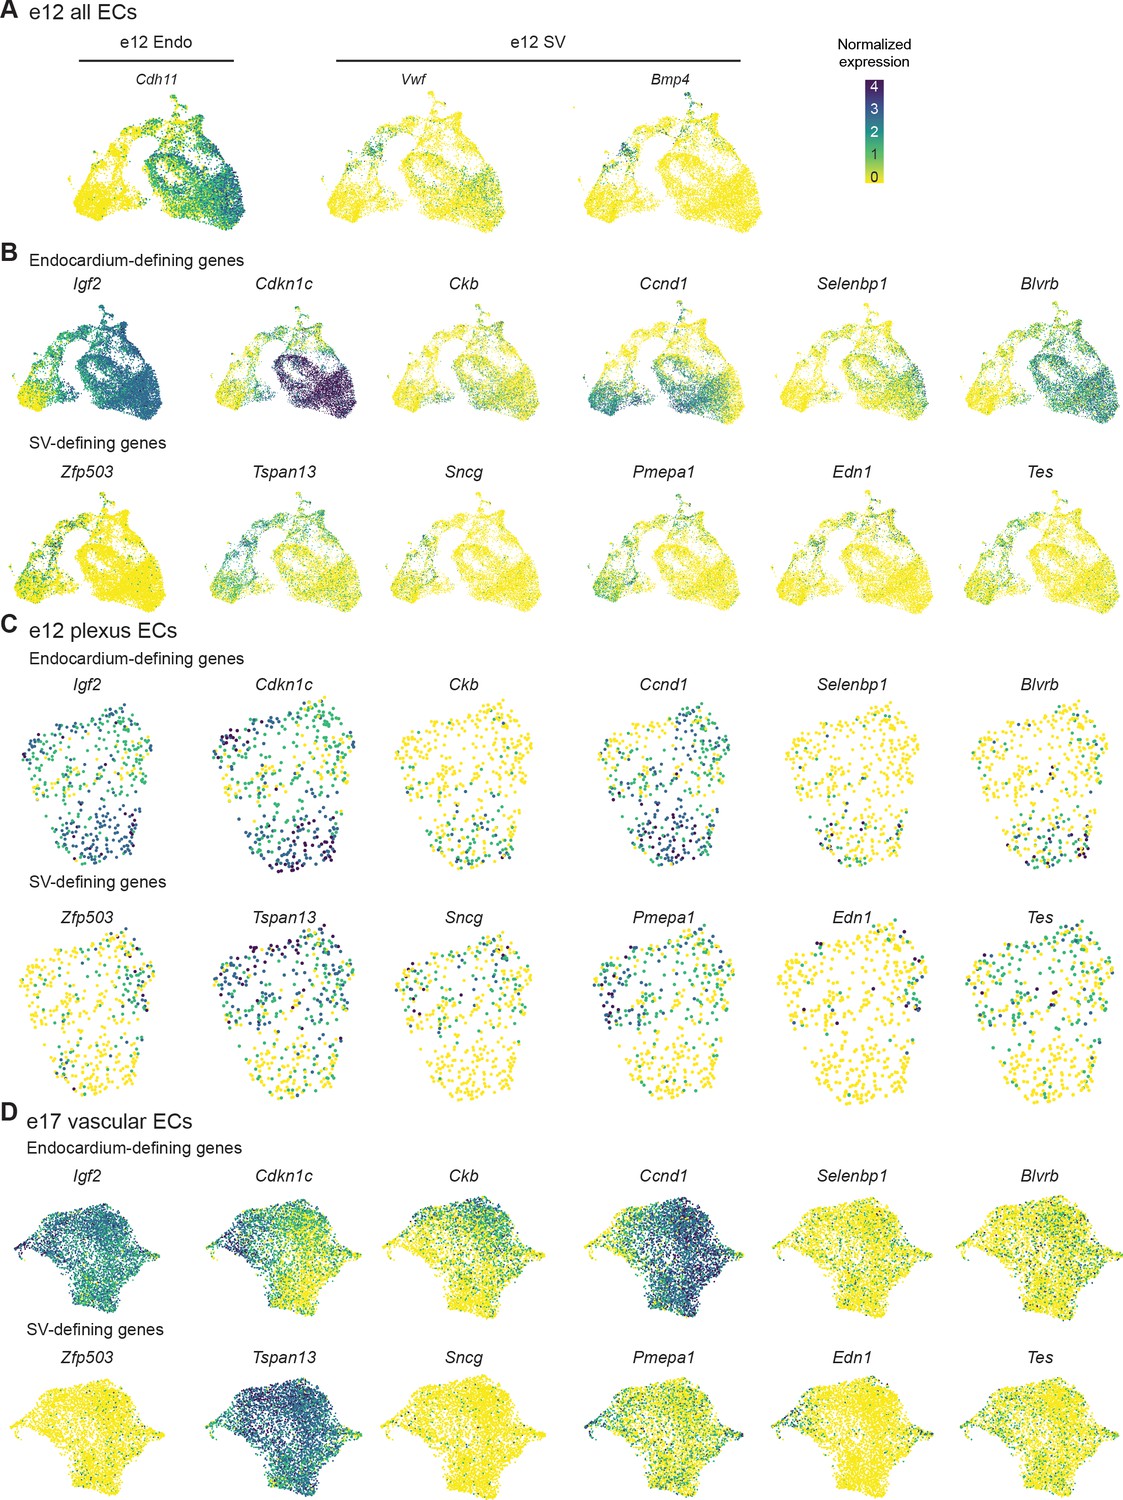
Expression of selected endocardium (Endo)- and sinus venosus (SV)-defining genes.
(A) Uniform Manifold Approximation and Projection (UMAP) showing expression of canonical Endo (Cdh11) and SV (Vwf, Bmp4) markers in heart endothelial cells (ECs) at e12. (B, C, and D) Expression of genes enriched in either the Endo (Endo-defining genes) or the SV (SV-defining genes) in all e12 ECs (B), e12 coronary plexus ECs (C), and e17.5 coronary ECs (D). Scale bar from (A) also applies to (B), (C), and (D).
Figure 2—figure supplement 2
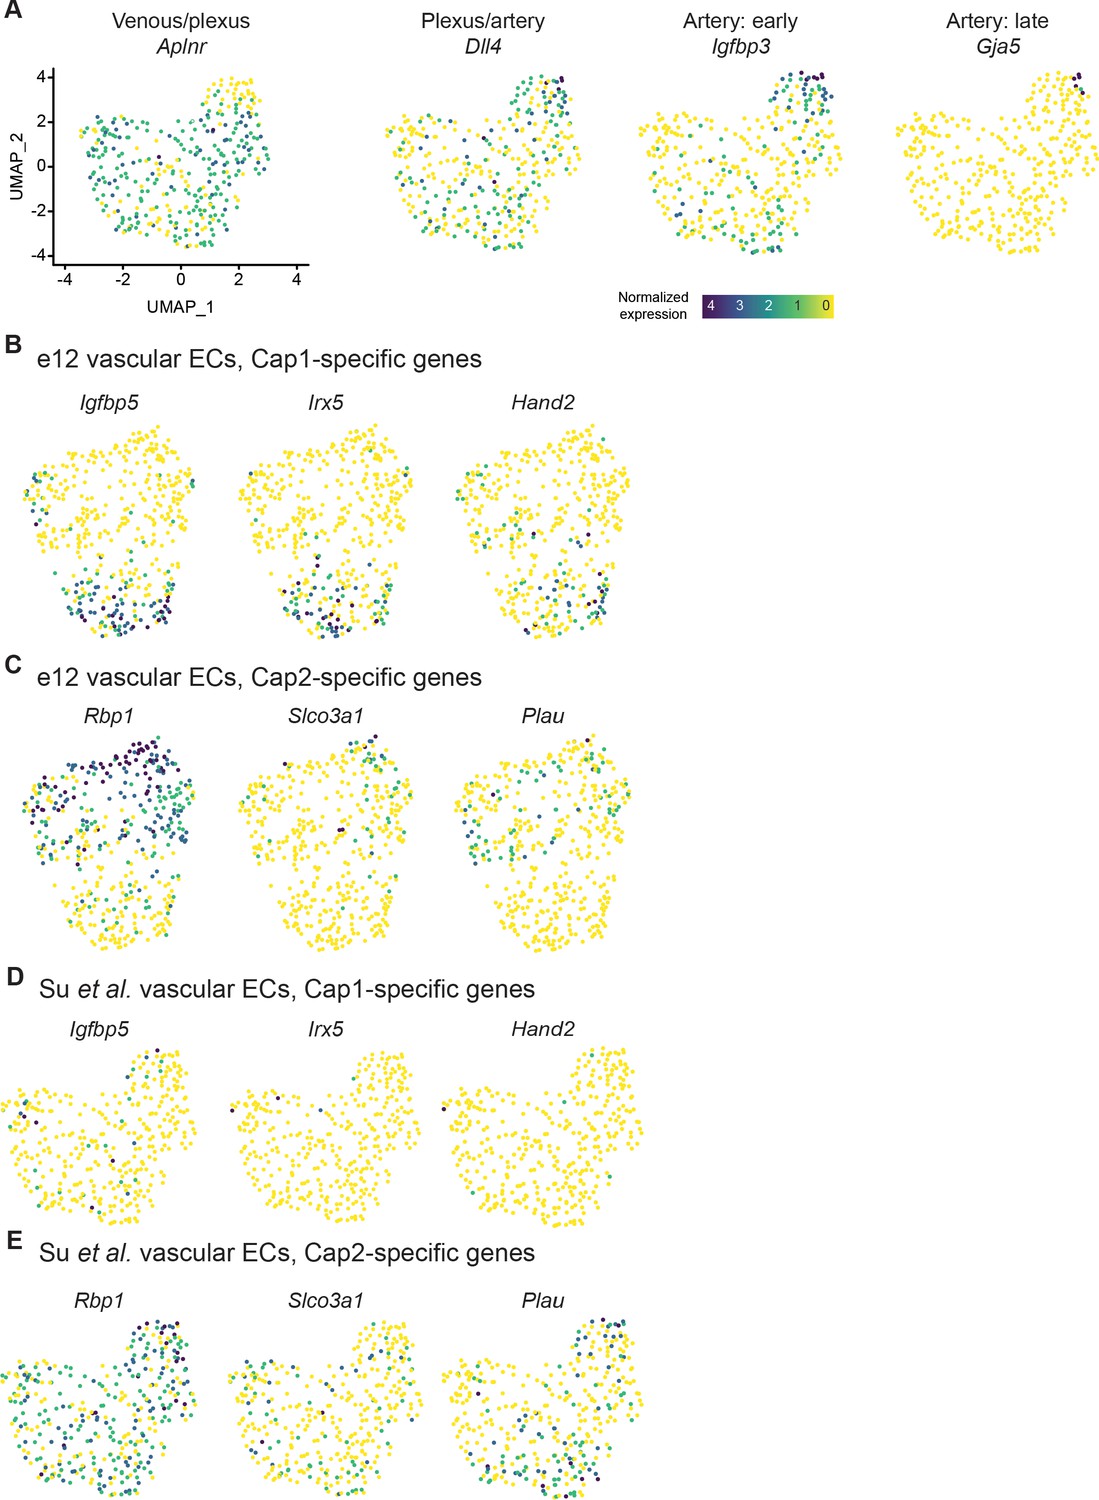
Expression of e12 Cap1- and Cap2-specific genes in a dataset of e12.5 sinus venosus (SV)-derived endothelial cells (ECs).
(A) Uniform Manifold Approximation and Projection (UMAP) showing expression of selected coronary EC subtype markers in a previously published dataset. (B and C) Expression in e12 dataset of genes enriched in e12 Cap1 (B) or Cap2 (C). (D and E) Expression in Su et al. dataset of genes enriched in e12 Cap1 (D) or Cap2 (E). Scale bar from (A) also applies to (B), (C), (D), and (E).
Figure 3 with 2 supplements
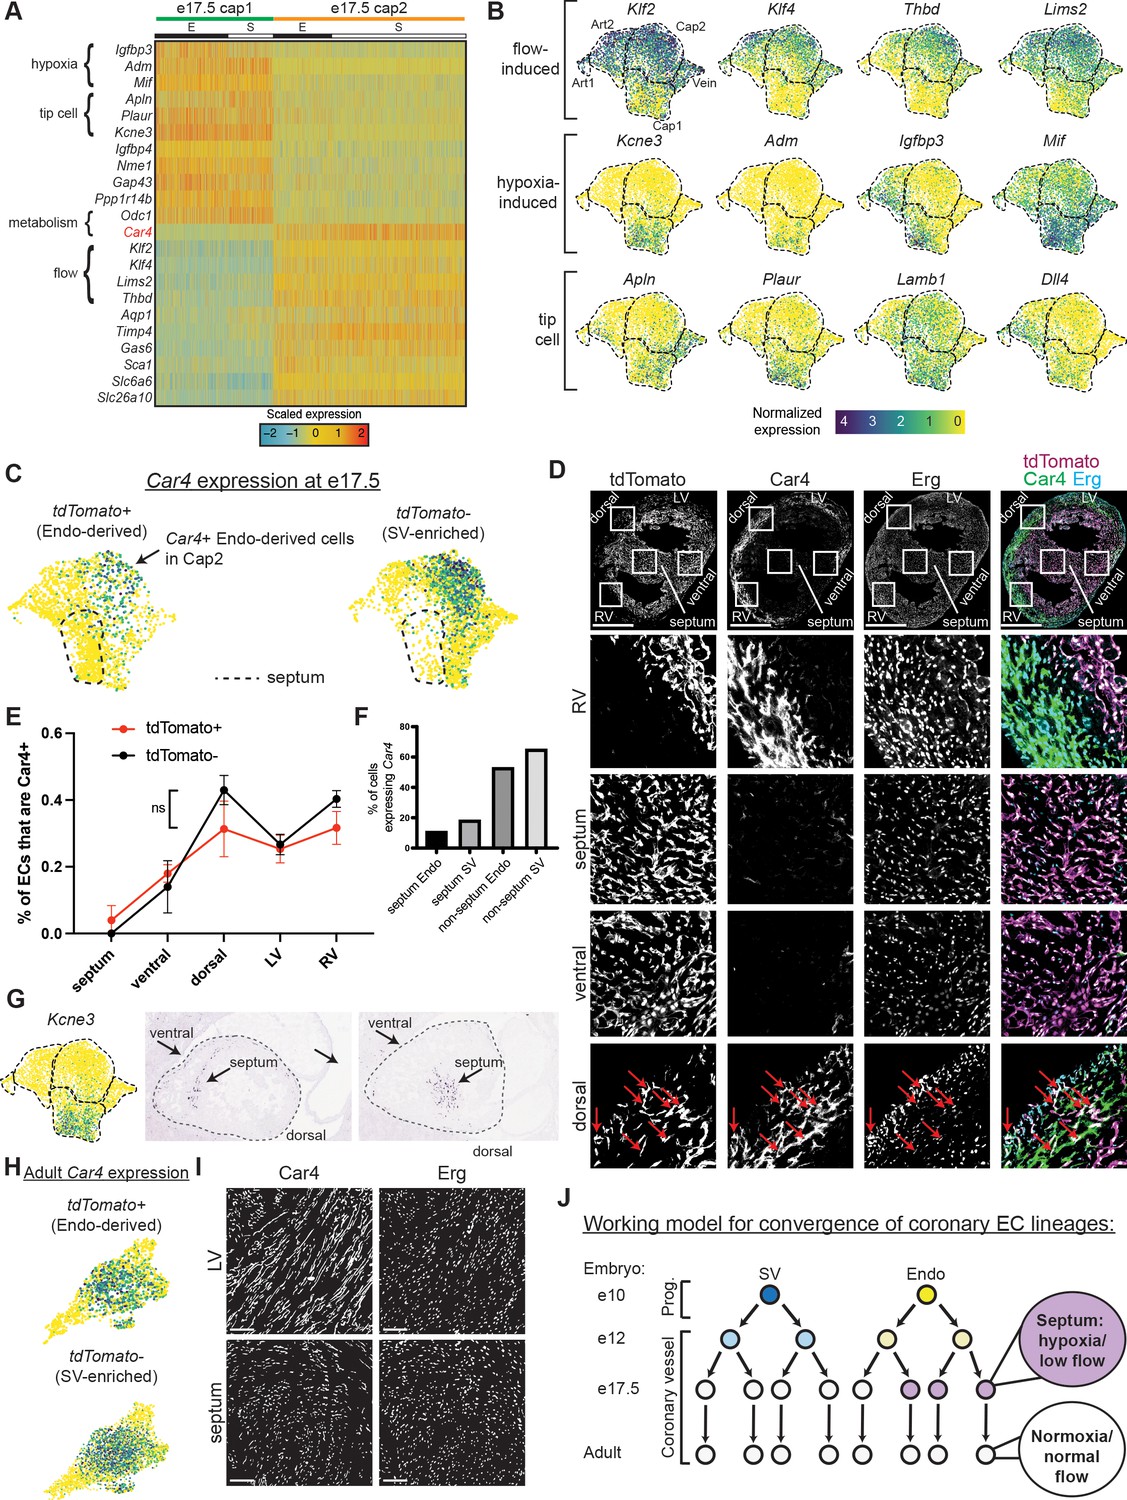
Gene expression and localization of e17.5 capillary clusters.
(A) Heatmap showing expression of selected genes enriched in either Cap1 or Cap2 at e17.5 (E = coronary cells from endocardium [Endo]-enriched sample, S = coronary cells from sinus venosus [SV]-enriched sample). (B) Uniform Manifold Approximation and Projections (UMAPs) showing expression of selected flow-induced, hypoxia-induced, and tip-cell genes. Dashed lines outline indicated clusters. (C) Car4 UMAPs separated by lineage. Dashed line shows area of UMAP enriched in Endo-enriched, Car4-negative cells predicted to be located in the septum. (D) Immunofluorescence of Car4 and Erg in a heart section from an e17.5 BmxCreER;RosatdTomato embryo (scale bar = 500 μm). Red arrows indicate Car4-positive, tdTomato-positive Endo-derived ECs in the dorsal wall. (E) Plot showing percentage of tdTomato-positive and tdTomato-negative endothelial cells (ECs) in different locations which are also Car4-positive based on quantification of Car4 staining in Erg-positive cells from three e17.5 BmxCreER;RosatdTomato embryos (error bars = range). (F) Bar plot based on e17.5 scRNAseq showing the percent of capillary cells in different categories (septum Endo-enriched, septum SV-enriched, non-septum Endo-enriched, non-septum SV-enriched) which express Car4 at any level. (G) Images showing in situ hybridization for Kcne3 in an e14.5 embryonic mouse heart, obtained and adapted from GenePaint (set ID EH3746). (H) UMAPs showing expression of Car4 in adult coronary ECs, separated by lineage. (I) Immunofluorescence of Car4 and Erg in the left ventricle (LV) and septum of an adult wild-type (WT) heart (scale bar = 100 μm). (J) Working hypothesis for convergence of Endo- and SV-derived ECs into equivalent transcriptional states. Scale bar from (B) also applies to (C), (G), and (H).
-
Figure 3—source data 1
Counts of Car4+ and Car4- endothelial cells in sections of BmxCreER hearts at e17.5.
- https://cdn.elifesciences.org/articles/70246/elife-70246-fig3-data1-v2.xlsx
Figure 3—figure supplement 1
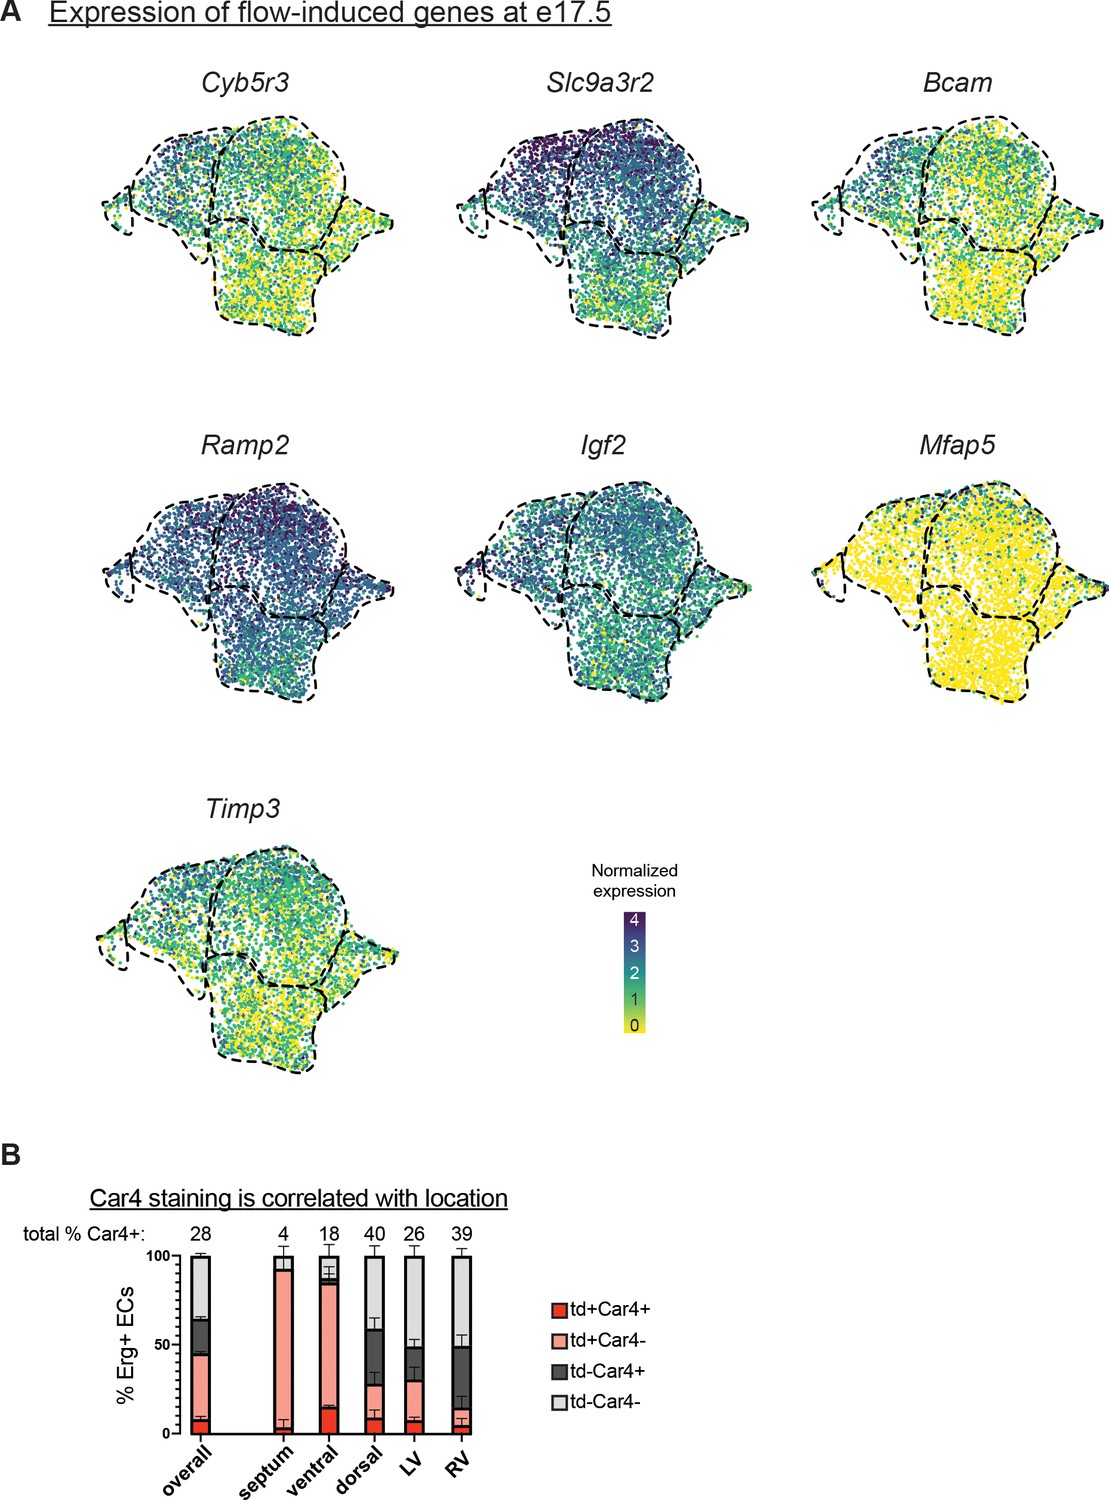
Expression of flow-induced genes.
(A) Uniform Manifold Approximation and Projections (UMAPs) showing expression of selected flow-induced genes from Kumar et al., 2014, in e17.5 coronary endothelial cells (ECs). (B) Quantification of Car4 staining in Erg-positive cells from three e17.5 BmxCreER;RosatdTomato embryos (error bars = SD). Red dashed lines outline the putative septal cells as determined in Figure 3C.
Figure 3—figure supplement 2
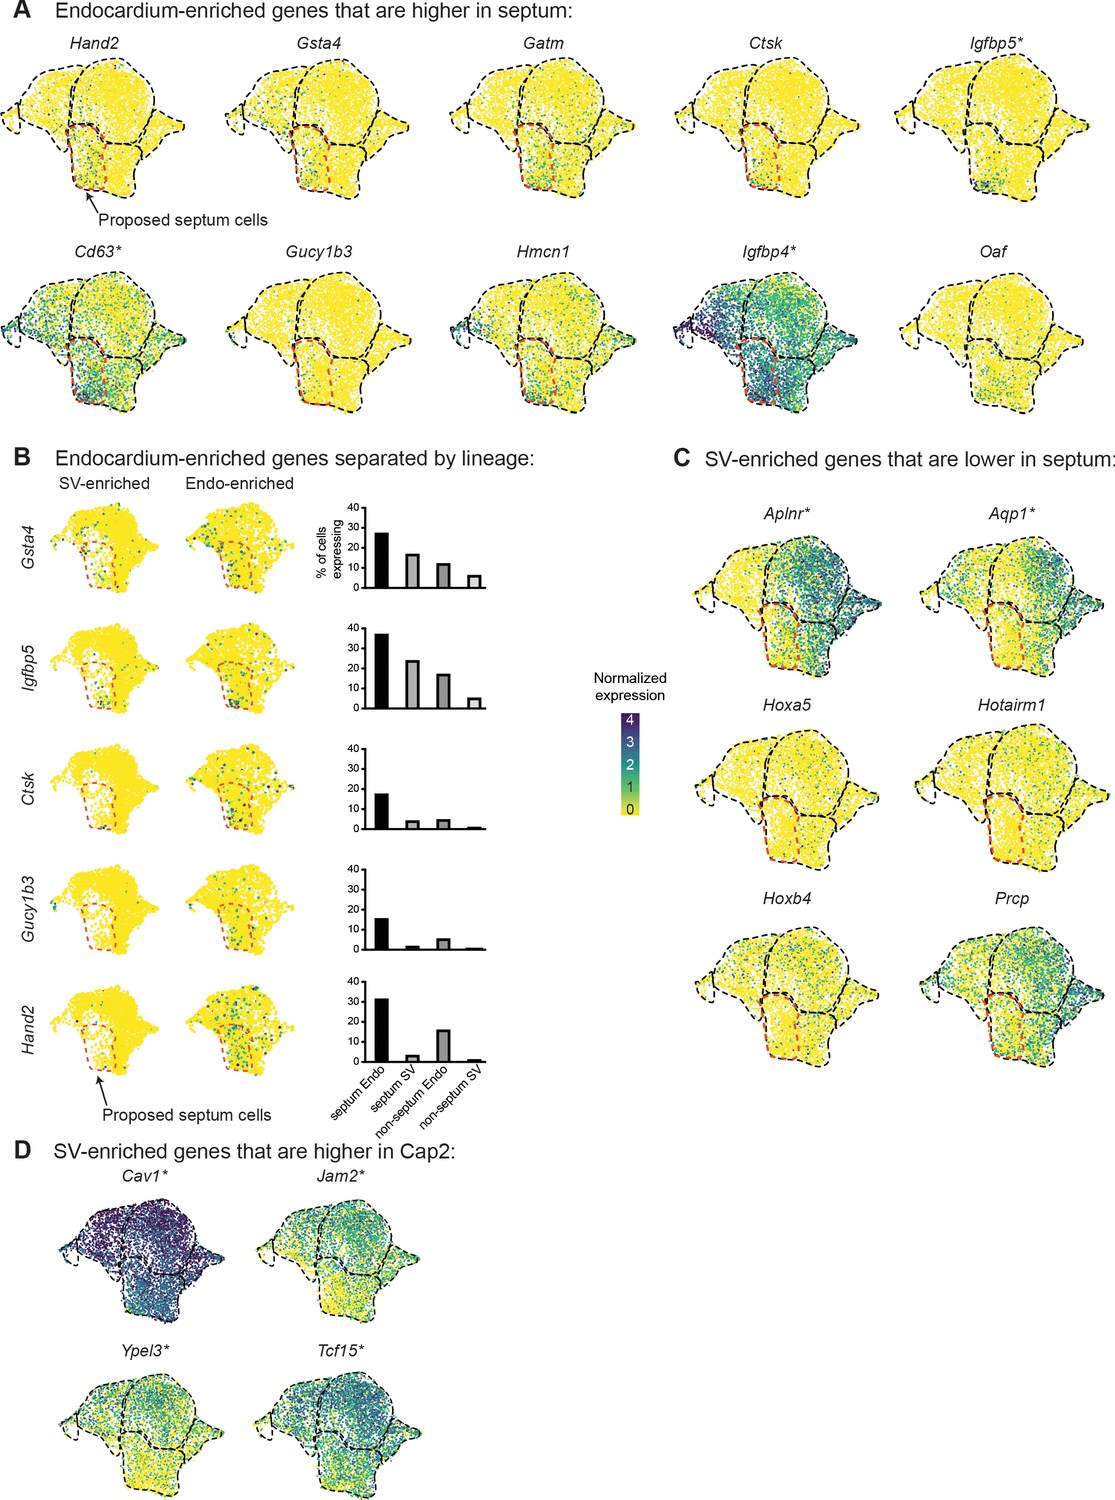
Expression of endocardium (Endo)- and sinus venosus (SV)-defining genes at e17.5.
(A) Uniform Manifold Approximation and Projections (UMAPs) showing expression of Endo-enriched genes manually determined to be expressed in a higher percentage of proposed septum cells (as shown in Figure 3C) than non-septum cells. (B) UMAPs showing expression of selected Endo-enriched genes split by lineage. Bar plots show the percent of capillary cells in different categories (septum Endo-enriched, septum SV-enriched, non-septum Endo-enriched, non-septum SV-enriched) which express each gene at any level. (C) UMAPs showing expression of SV-enriched genes manually determined to be expressed in a higher percentage of non-septum cells than septum cells. (D) UMAPs showing expression of SV-enriched genes manually determined to be expressed in a higher percentage of Cap2 cells compared to Cap1 cells. Starred genes are significantly differentially expressed between e17.5 Cap1 and Cap2, as indicated in Figure 2C. Scale bar from (B) also applies to (A), (C), and (D).
Figure 4
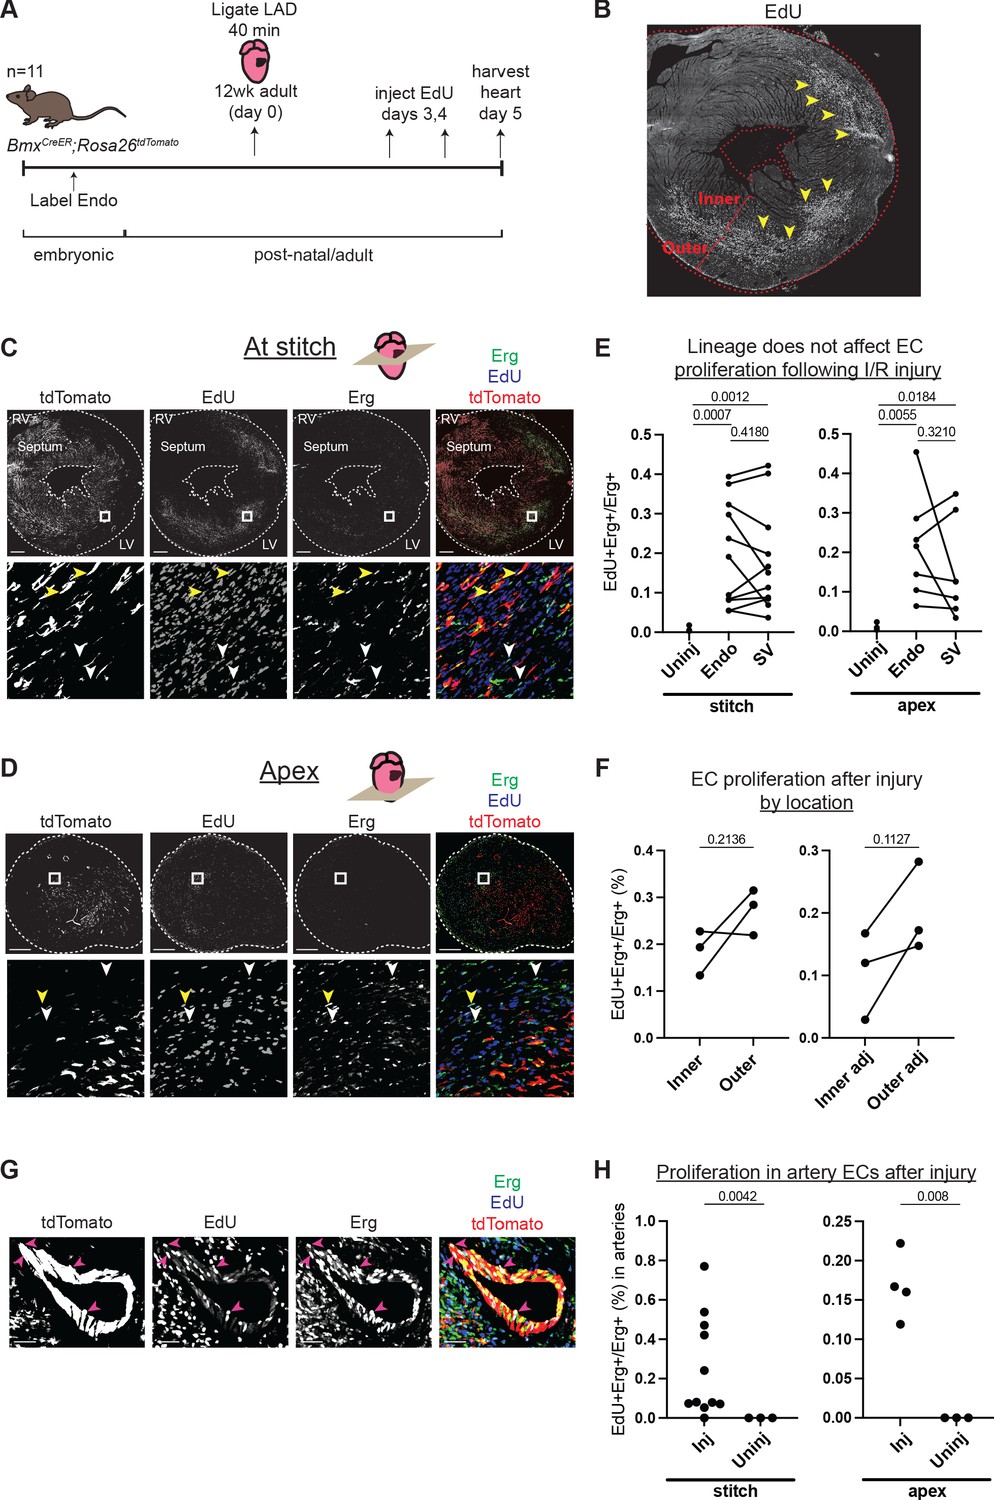
Comparison of injury responses of endocardium (Endo)- and sinus venosus (SV)-derived coronary endothelial cells (ECs).
(A) Overview of lineage tracing and ischemia-reperfusion (I/R) injury approach in adult mice. (B) Example of how EdU localization highlights mid-myocardial injury region. Yellow arrowheads indicate the injury region with dense EdU staining. (C and D) Immunofluorescence of EdU and Erg in sections of the heart from (B) just below level of the stitch (C) and in the apex (D). Yellow arrowheads show proliferating Endo-derived ECs that are positive for tdTomato, Erg, and EdU; white arrowheads show tdTomato-negative, Erg-positive ECs from the SV that are EdU positive. (E) Quantification in multiple injured hearts of EdU-positive, Erg-positive ECs from the two lineages. (F) Quantification in multiple injured hearts of EdU-positive, Erg-positive ECs from the inner and outer wall, both in the focal area of the injury, as indicated in (B), and in areas adjacent to the injury. (G) Immunofluorescence of EdU and Erg in an artery of an injured heart. Pink arrowheads show proliferating ECs that are positive for tdTomato, Erg, and EdU. (H) Quantification in multiple injured hearts of EdU-positive, Erg-positive ECs in arteries in the focal area of the injury. In (E), (F), and (H), each dot represents one heart. Scale bar = 50 μm for (G). Scale bars = 500 μm for all other images.
-
Figure 4—source data 1
Counts of proliferating and non-proliferating endothelial cells in sections of adult BmxCreER hearts after injury.
- https://cdn.elifesciences.org/articles/70246/elife-70246-fig4-data1-v2.xlsx
Figure 5 with 2 supplements
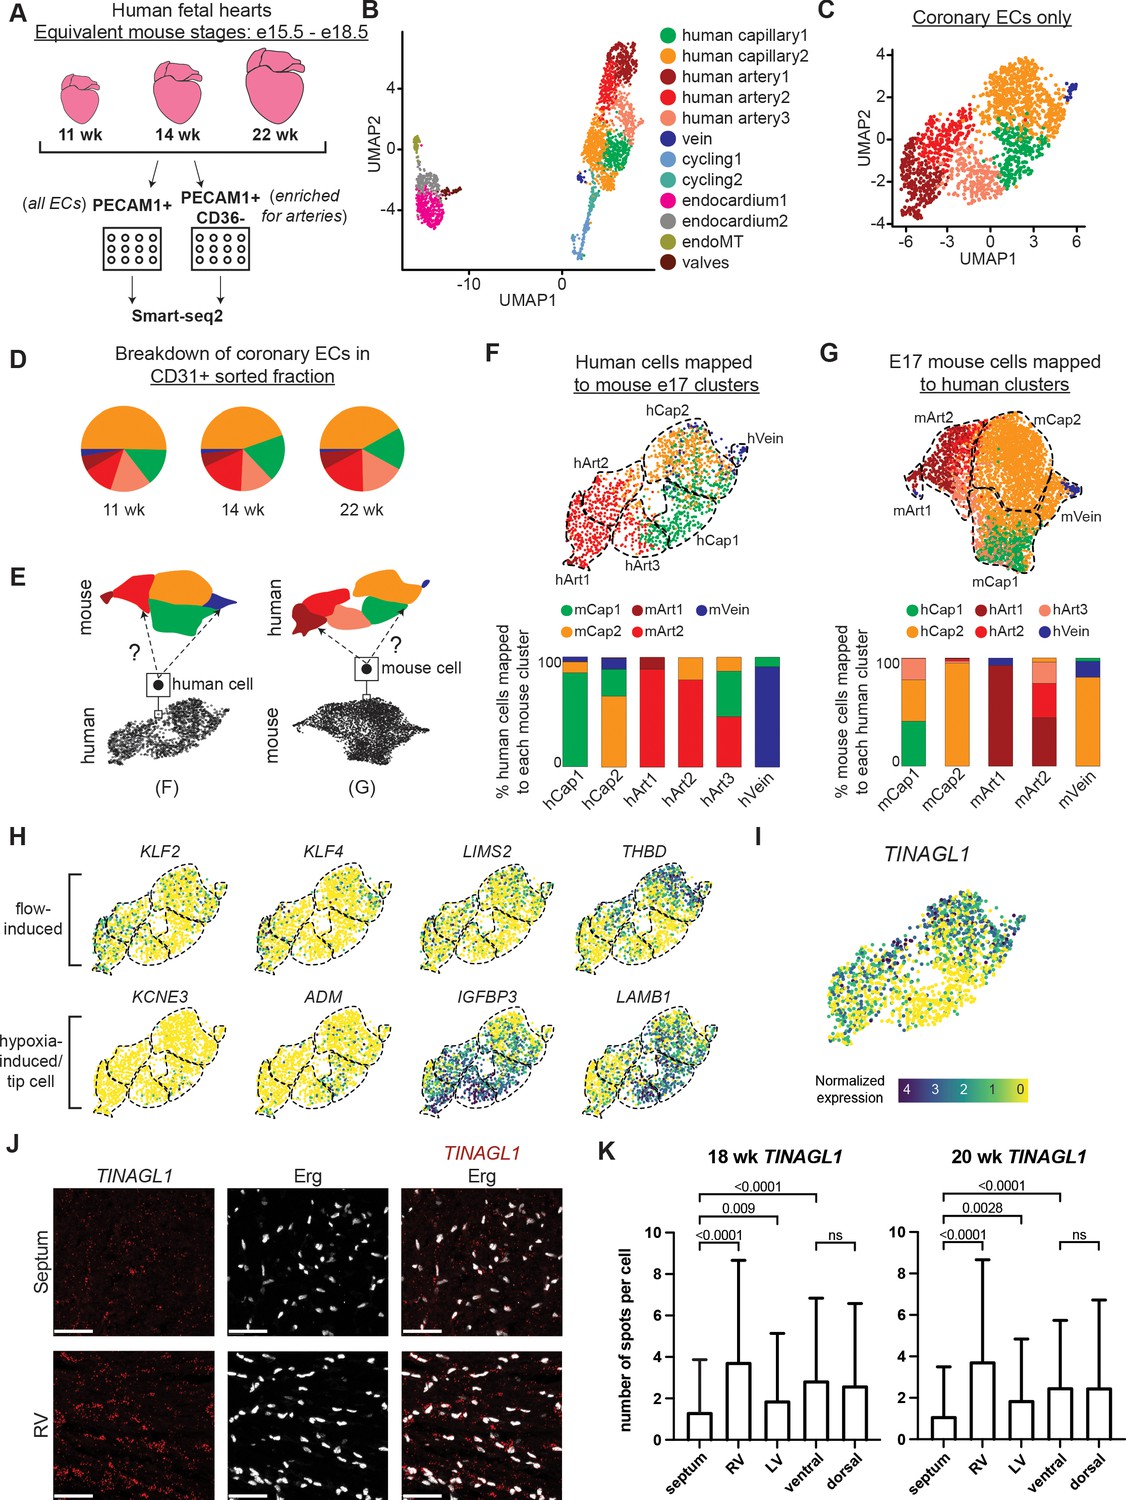
Single-cell RNA sequencing (ScRNAseq) of coronary endothelial cells (ECs) from human fetal hearts.
(A) Overview of scRNAseq approach for three human fetal hearts. (B and C) Uniform Manifold Approximation and Projections (UMAPs) of all major PECAM1+ EC subtypes collected (B) and the non-cycling coronary EC subset (C). (D) Pie charts showing the breakdown by cluster of human coronary ECs that were sorted as PECAM1+ without additional enrichment. (E) Schematic of inter-species reference mapping. Individual cells from the human or mouse e17.5 datasets were assigned to the most similar mouse or human cluster, respectively. (F and G) Results from inter-species reference mapping based on shared gene expression, showing the mouse cluster that each human EC mapped to and the percentage breakdown of the mapping from each human cluster (F) and the converse comparison (G). Dashed lines show the borders of the previously defined human and mouse e17.5 coronary clusters. (H) UMAPs showing expression of selected flow-induced, hypoxia-induced and tip-cell genes in human coronary ECs. (I) UMAP showing expression of TINAGL1 in human coronary ECs. Scale bar from (I) also applies to (H). (J) Section from 18-week human fetal heart showing in situ hybridization for TINAGL1 with immunofluorescence for Erg. Scale bar = 50 μm. (K) Bar plot showing the mean number of TINAGL1 RNA spots per cell detected in different regions of 18- and 20-week human fetal hearts. Error bars represent standard deviation.
Figure 5—figure supplement 1
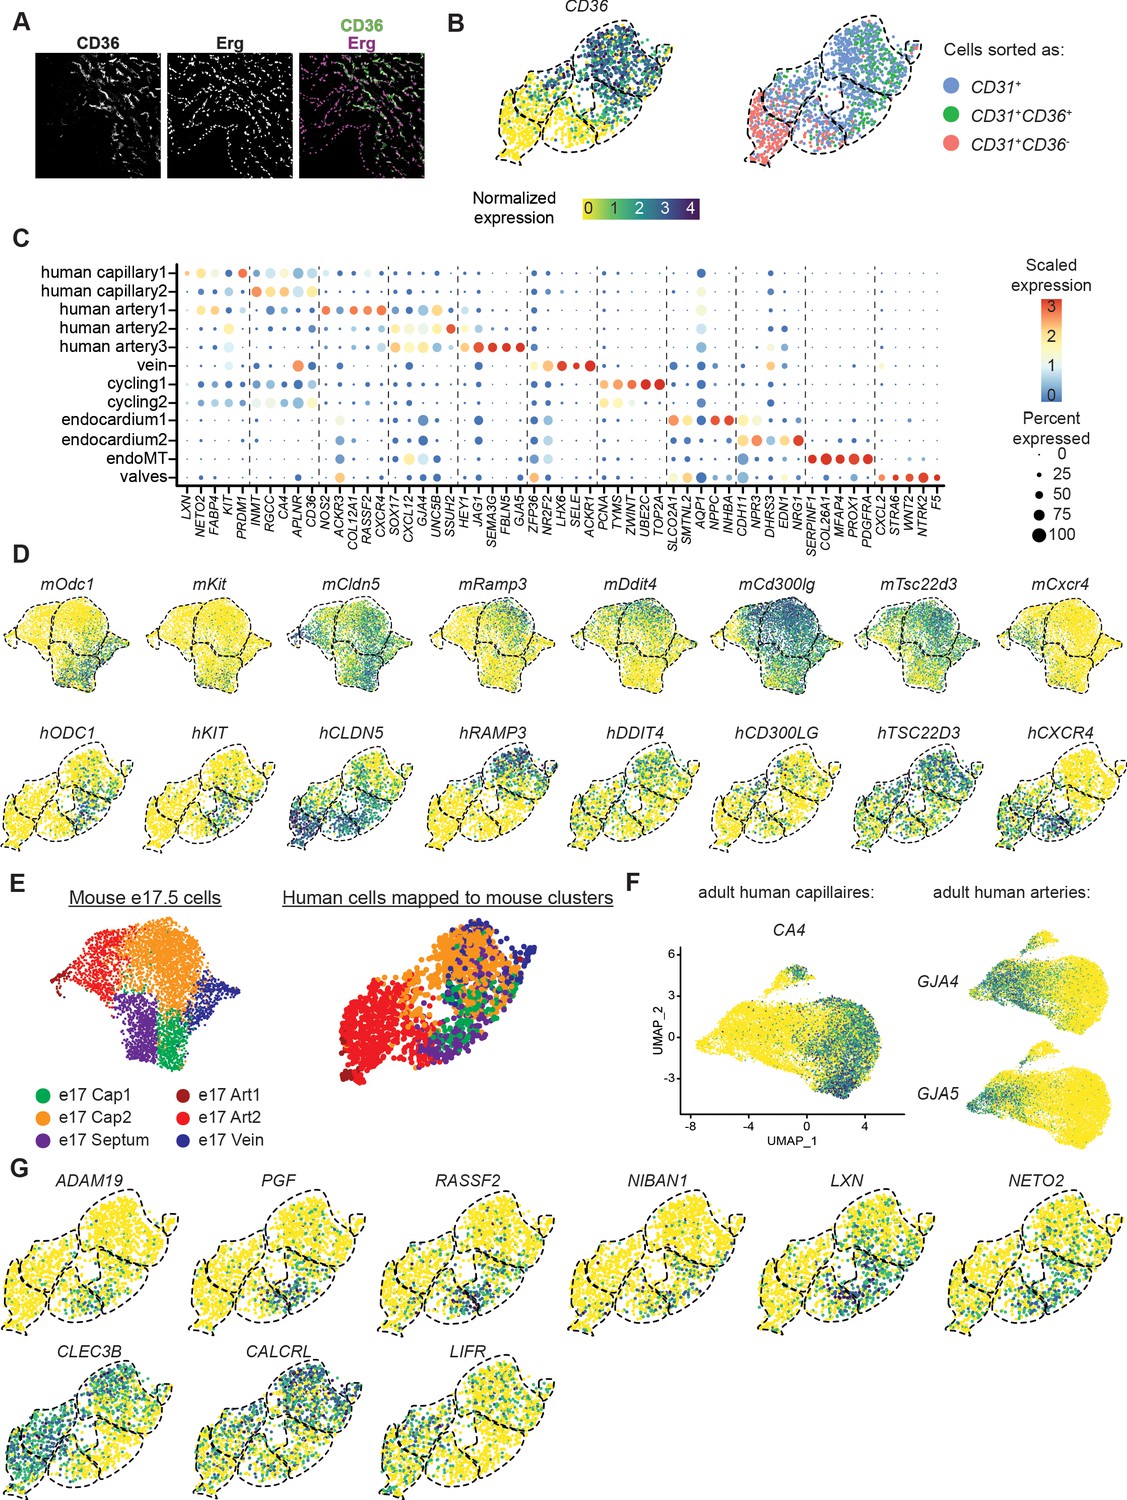
Additional analysis of developing human coronary endothelial cells (ECs).
(A) Immunofluorescence for CD36 and Erg in a section from a 14-week human fetal heart. (B) Uniform Manifold Approximation and Projections (UMAPs) showing expression of CD36 in human coronary ECs as well as cells colored according to fluorescence-activated cell sorting (FACS) sample, that is, PECAM1+ only, PECAM1+ CD36+, PECAM1+ CD36-, as indicated in Figure 5A. Dashed lines show the borders of the previously defined human coronary clusters. (C) Dot plot showing the expression of selected gene markers for each human EC cluster from Figure 5B. (D) UMAPs showing expression of selected genes with shared expression patterns between mouse e17.5 and human fetal capillary ECs. (E) UMAPs showing mouse e17.5 coronary EC clusters including a manually defined septum cluster as shown in Figure 3C, and the fetal human coronary ECs which map to each of these clusters. (F) UMAPs showing expression of selected capillary and artery genes in adult human coronary ECs from a previously published dataset (Litviňuková et al., 2020). (G) UMAPs showing expression of selected genes shared between human Cap1 and Art3 or between human Cap2 and Art2. Scale bar from (B) also applies to (D), (F), and (G).
Figure 5—figure supplement 2
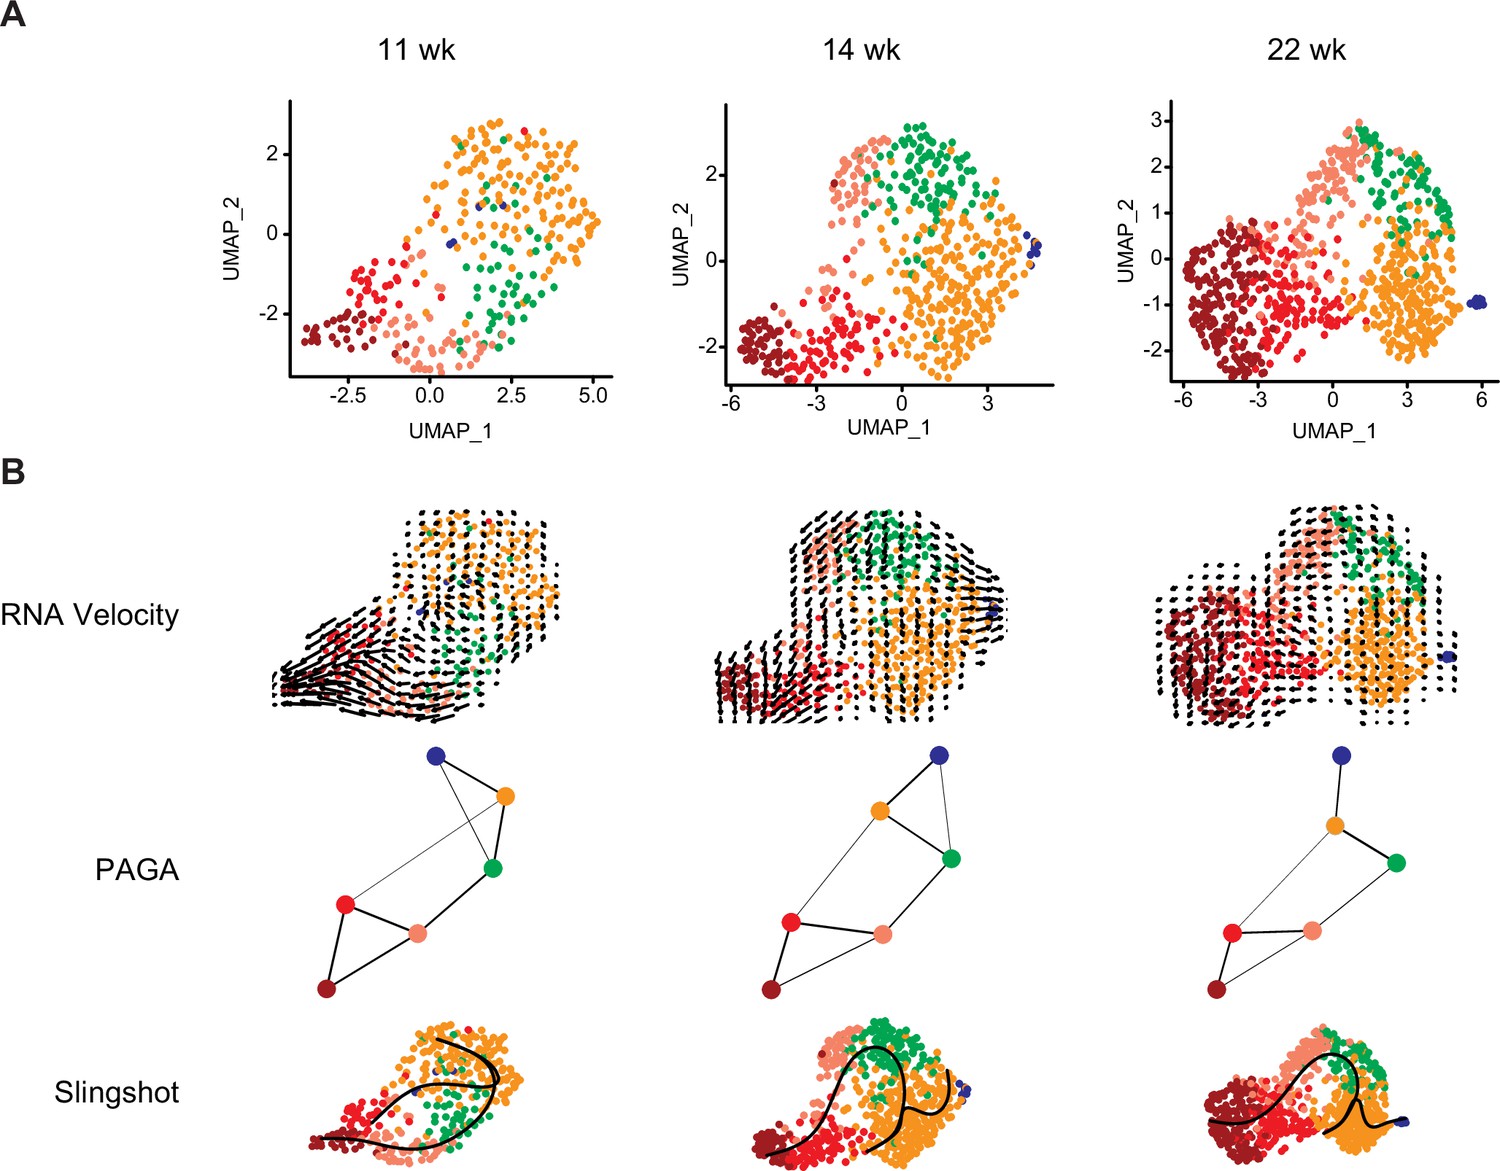
Analysis of developing human coronary endothelial cells (ECs) separated by stage.
(A) Uniform Manifold Approximation and Projections (UMAPs) showing unbiased clustering of cells isolated from each individual human fetal heart. (B) Trajectory analysis of human coronary EC at each individual stage using RNA velocity, partition-based graph abstraction (PAGA), Slingshot, and Monocle.
Figure 6
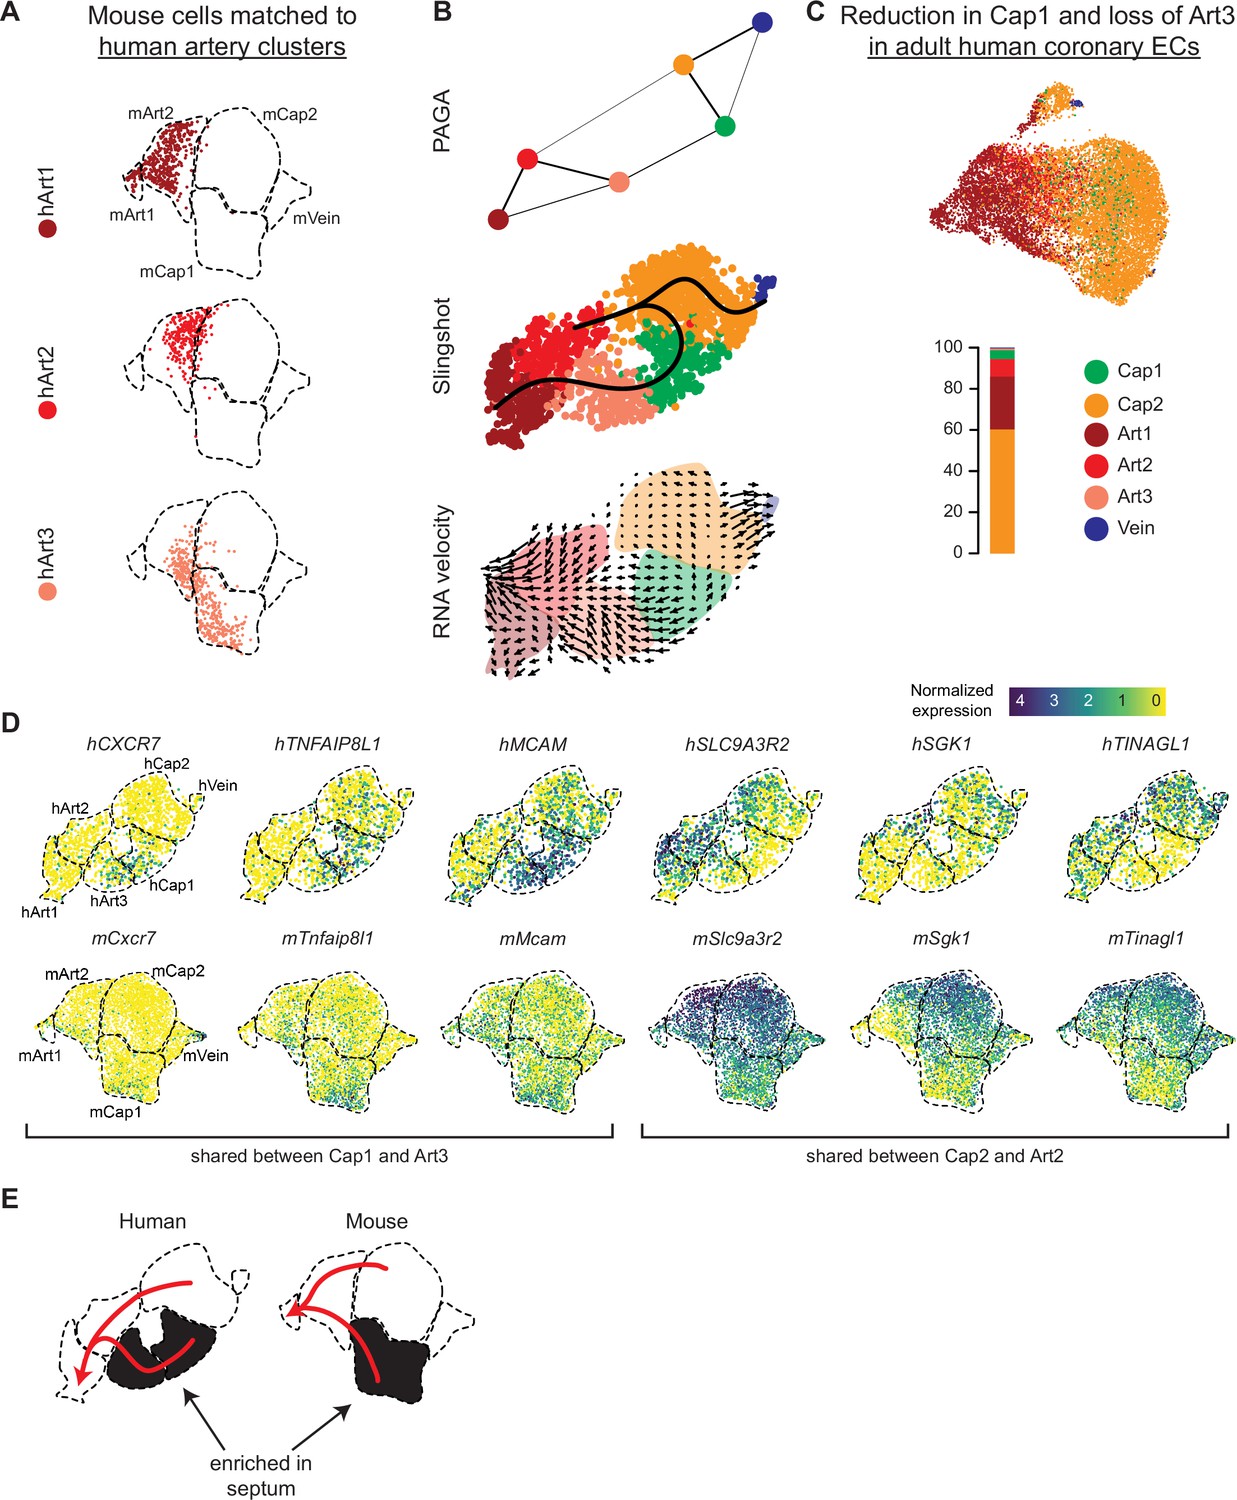
Trajectory analysis of developing human coronary arteries.
(A) Reference mapping showed that e17.5 mouse endothelial cells (ECs) from Figure 5g were assigned to all three human artery subsets. (B) Trajectory analysis of human coronary ECs using partition-based graph abstraction (PAGA), Slingshot, and RNA velocity suggested that artery ECs are formed by capillary EC differentiation, as in mice. (C) Reference mapping adult human coronary ECs from a publicly available dataset to human fetal ECs showed that most mature cells match to Art1, Art2, or Cap2. (D) Uniform Manifold Approximation and Projections (UMAPs) showing expression of selected genes shared between hCap1 and hArt3 and hCap2 and hArt2, in both human and mouse. Previously defined clusters are outlined. (E) Schematic illustrating enrichment of septum ECs in mouse Cap1 and human Cap1 and Art3, as well as trajectories from capillary to artery in both human and mouse.
Figure 7
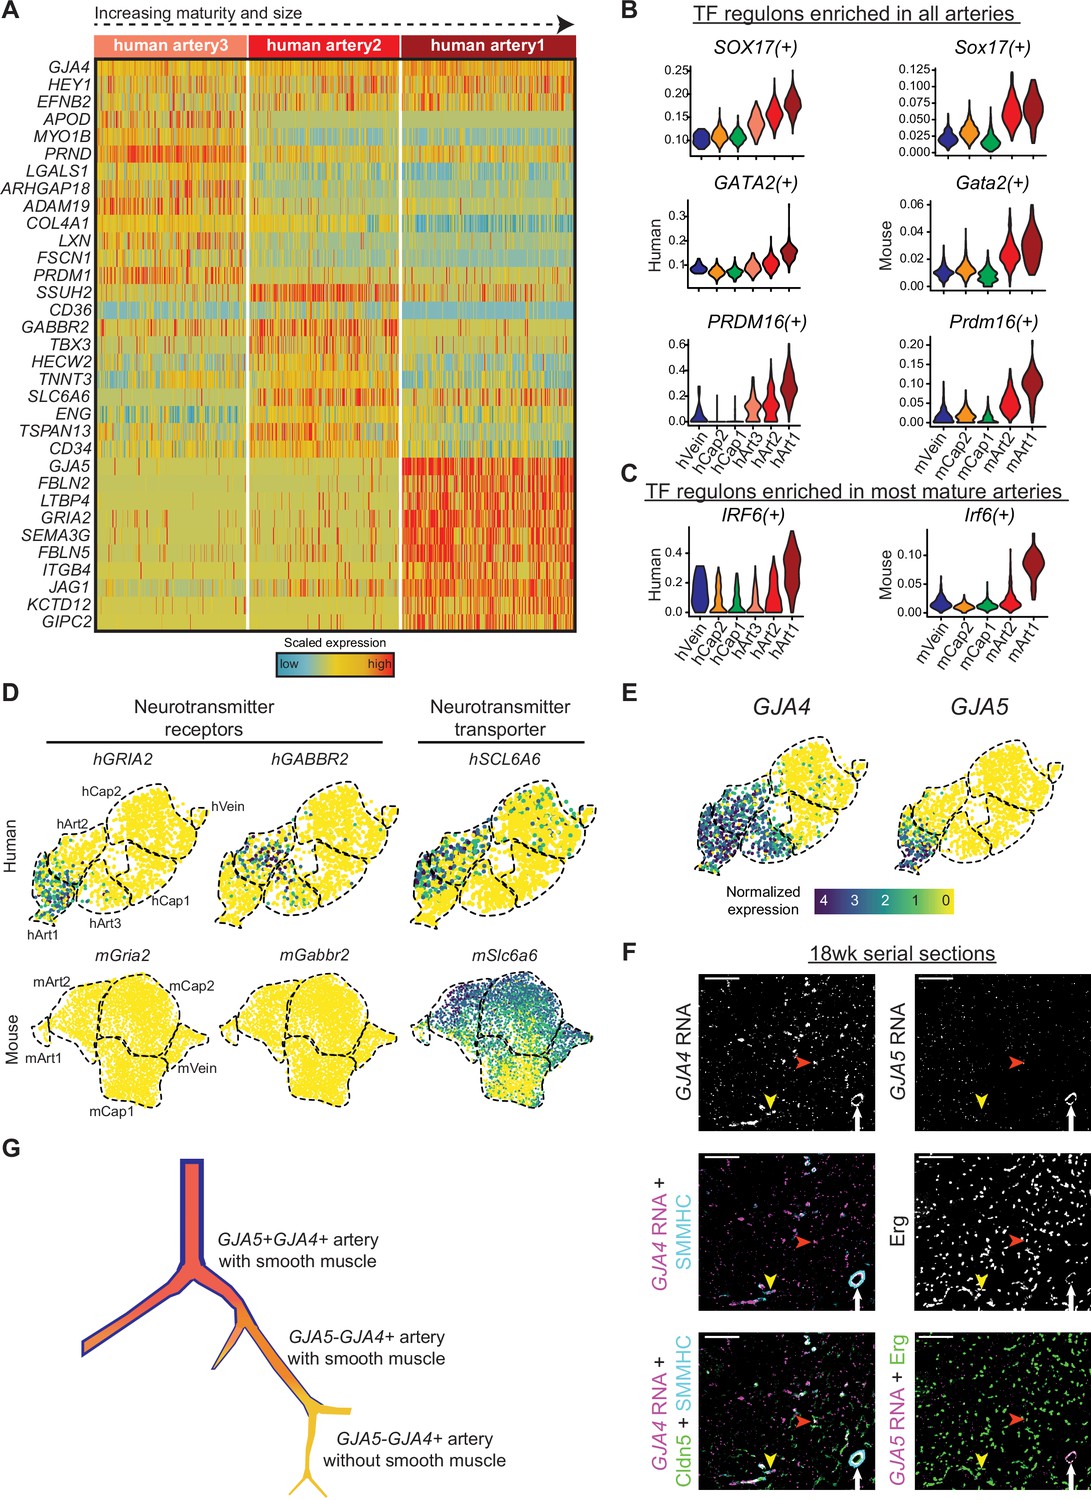
Gene expression in developing human coronary arteries.
(A) Heatmap showing expression of selected genes enriched in human artery clusters. (B and C) Regulon scores from SCENIC analysis for TFs enriched in all human and mouse artery clusters (B) and for TFs enriched in human and mouse Art1 (C). (D) Human, but not mouse, developing coronary arteries expressed neurotransmitter receptors and their transporter. (E) GJA4 and GJA5 expression in human coronary endothelial cells (ECs). (F) Serial sections from 18-week human fetal heart showing in situ hybridization for the indicated mRNAs with immunofluorescence for the indicated proteins.
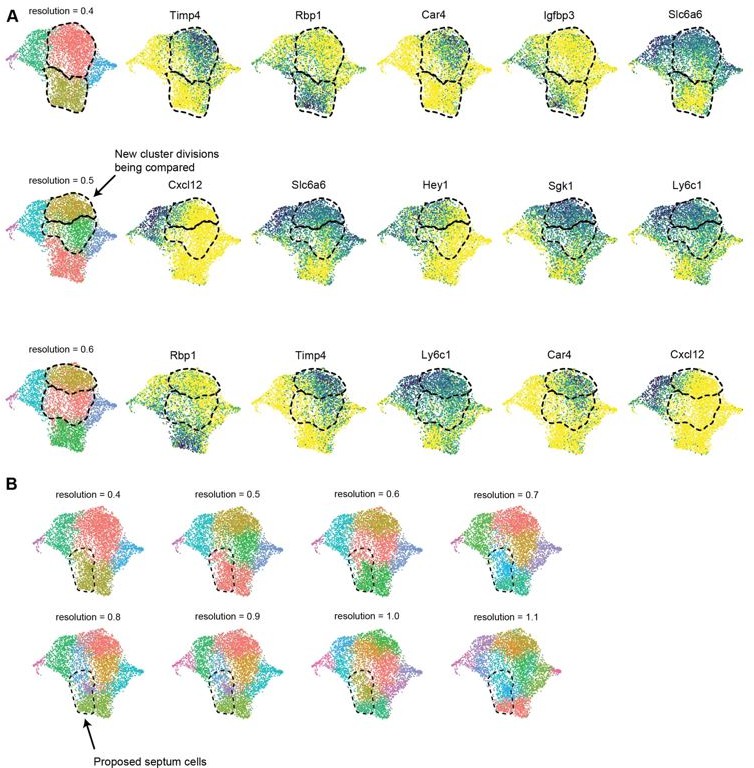
Author response image 1
.
(A) UMAP plots showing clustering of e17.5 dataset at multiple resolutions up to 0.6 as well as expression of the top 5 DEGs (by average log-fold change) between newly divided clusters. The clusters being compared for each resolution are indicated with a dashed line. (B) UMAP plots showing clustering of e17.5 dataset at multiple resolutions up to 1.1. The dashed line indicates the region of proposed septal cells based on lineage, protein staining and gene expression.
Author response image 2

Tables
Table 1
Differentially expressed genes between endocardium (Endo) and sinus venosus (SV) (from heatmap in Figure 2A).
| Endo-specific genes | SV-specific genes |
|---|---|
| Cdkn1c | Cldn11 |
| Tmem108 | Aplnr |
| Nrk | Agr2 |
| Fabp5 | Bmp4 |
| Cdh11 | Hoxa5 |
| Cd81 | Gm13889 |
| Irx5 | Zfp503 |
| H19 | Hotairm1 |
| Hand2 | Rassf9 |
| Adgrg6 | Mmrn1 |
| Maged2 | Pcdh17 |
| Ccnd2 | Tox |
| Plvap | Slco3a1 |
| Igf2 | Tspan13 |
| Dok | Nr2f2 |
| Col13a1 | Fst |
| Tm4sf1 | Cd36 |
| Igf2r | Cldn5 |
| Gm1673 | Aqp1 |
| Blvrb | Hoxb4 |
| Gsta4 | Khdrbs3 |
| Rap2a | Kitl |
| Gatm | Wnt16 |
| Olfml3 | Limch1 |
| Sdpr | Ahr |
| Ece1 | Edn1 |
| Plagl1 | Lamp5 |
| Prr15 | Cav1 |
| Igfbp4 | Ddah1 |
| Ccnd3 | Tbx5 |
-
Table 1—source data 1
List of all differentially expressed genes between e12 endocardium (Endo) and sinus venosus (SV) sorted by Wilcoxon rank sum test.
- https://cdn.elifesciences.org/articles/70246/elife-70246-table1-data1-v2.xlsx
Table 2
Differentially expressed genes between all endocardium (Endo)-enriched and all sinus venosus (SV)-enriched capillaries.
Bolded genes are also differentially expressed between Cap1 and Cap2.
| Raw p-value | Average log-fold change | % Endo cells expressing | % SV cells expressing | Adjusted p-value | Higher fold change in Cap1 versus Cap2 comparison? | |
|---|---|---|---|---|---|---|
| tdTomato | 1.91E-238 | 0.39378511 | 0.452 | 0 | 5.35E-234 | |
| Gt(ROSA)26Sor | 2.43E-153 | –0.634801942 | 0.568 | 0.837 | 6.81E-149 | |
| Anxa1 | 4.24E-109 | 0.553933954 | 0.804 | 0.53 | 1.19E-104 | |
| Igf2 | 6.74E-93 | –0.357191579 | 0.99 | 0.999 | 1.89E-88 | |
| Timp4 | 1.28E-88 | –0.632710228 | 0.447 | 0.766 | 3.58E-84 | Yes |
| Fmo1 | 8.34E-70 | –0.351754806 | 0.231 | 0.511 | 2.34E-65 | Yes |
| Txnip | 2.09E-67 | –0.37131915 | 0.851 | 0.933 | 5.85E-63 | Yes |
| Aplnr | 5.42E-67 | –0.40125981 | 0.677 | 0.863 | 1.52E-62 | Yes |
| Car4 | 1.68E-65 | –0.595662824 | 0.347 | 0.62 | 4.70E-61 | Yes |
| Aqp7 | 3.33E-62 | –0.368823615 | 0.345 | 0.63 | 9.31E-58 | Yes |
| Apoe | 1.19E-60 | 0.302862096 | 0.307 | 0.09 | 3.34E-56 | |
| Cd36 | 8.58E-59 | –0.308565577 | 0.97 | 0.997 | 2.40E-54 | Yes |
| Igfbp5 | 1.84E-57 | 0.4602195 | 0.258 | 0.064 | 5.15E-53 | |
| Fabp5 | 6.53E-54 | 0.30861622 | 0.999 | 1 | 1.83E-49 | Yes |
| 1810011O10Rik | 1.08E-52 | –0.340249285 | 0.907 | 0.963 | 3.04E-48 | Yes |
| Aqp1 | 9.79E-47 | –0.471913791 | 0.54 | 0.729 | 2.74E-42 | Yes |
| Gap43 | 7.23E-38 | 0.34418651 | 0.523 | 0.331 | 2.02E-33 | Yes |
| Sat1 | 1.99E-37 | 0.394143816 | 0.753 | 0.63 | 5.59E-33 | Yes |
| Cd63 | 3.81E-36 | 0.33008301 | 0.758 | 0.611 | 1.07E-31 | Yes |
| Igfbp3 | 3.45E-34 | 0.640208849 | 0.634 | 0.468 | 9.66E-30 | Yes |
| Tm4sf1 | 1.38E-32 | 0.302207793 | 0.982 | 0.94 | 3.87E-28 | |
| Maged2 | 4.03E-32 | 0.323885527 | 0.845 | 0.757 | 1.13E-27 | |
| Ly6c1 | 1.32E-31 | –0.301696479 | 0.845 | 0.93 | 3.70E-27 | Yes |
| Rbp1 | 1.26E-15 | 0.432393695 | 0.757 | 0.69 | 3.52E-11 | Yes |
Table 3
Ratio of Erg+ Car4+/Erg+ cells in adult mouse hearts.
| LV | Septum | |
|---|---|---|
| heart1 | 0.874 | 0.853 |
| heart2 | 0.864 | 0.819 |
Table 4
Genes unique to human coronary endothelial cells (ECs).
| SLC14A1 |
| GABBR2 |
| NRN1 |
| EPHA3 |
| ADMTSL1 |
| A2M |
| PRND |
| GRIA2 |
| KCNN3 |
| SERPINE2 |
| LPCAT2 |
| LGALS3 |
| APOA1 |
| SYNJ2 |
| OCIAD2 |
| PRICKLE2 |
| CTNND1 |
| IFITM2 |
Key resources table
| Reagent type (species) or resource | Designation | Source or reference | Identifiers | Additional information |
|---|---|---|---|---|
| Strain, strain background (Mus musculus) | BmxCreER | Mouse Genome Informatics | MGI: 5513853; RRID: IMSR_TAC:14081 | |
| Strain, strain background (Mus musculus) | RosatdTomato | The Jackson Laboratory | Stock No: 007909; RRID: IMSR_JAX:007909 | |
| Strain, strain background (Mus musculus) | CD1 | Charles River Laboratories | Strain code: 022; RRID: IMSR_CRL:022 | |
| Biological sample (Homo sapiens) | Primary fetal heart tissue | Collected at Stanford from elective terminations | ||
| Antibody | Rat anti- APC/Cy7 Cd45 (rat monoclonal) | Biolegend | Cat #: 103116; RRID: AB_312981 | (1:50) |
| Antibody | Rat anti- APC Pecam1 (rat monoclonal) | Biolegend | Cat #: 102410; RRID: AB_312905 | (1:50) |
| Antibody | Rat anti- APC-Cy7 Ter119 (rat monoclonal) | Biolegend | Cat #: 116223; RRID: AB_2137788 | (1:50) |
| Antibody | Mouse anti- Pacific Blue CD235a (mouse monoclonal) | Biolegend | Cat #: 349107; RRID: AB_11219199 | (1:50) |
| Antibody | Mouse anti- FITC CD36 (mouse monoclonal) | Biolegend | Cat #: 336204; RRID: AB_1575025 | (1:50) |
| Antibody | Mouse anti- APC-Cy7 PECAM1 (mouse monoclonal) | Biolegend | Cat #: 303119; RRID: AB_10643590 | (1:50) |
| Antibody | Mouse anti- Pacific Blue CD45 (mouse monoclonal) | Biolegend | Cat #: 304021; RRID: AB_493654 | (1:50) |
| Antibody | Mouse anti- PerCP-Cy5.5 CD235a (mouse monoclonal) | Biolegend | Cat #: 349110; RRID: AB_2562706 | (1:50) |
| Antibody | Mouse anti-PerCP-Cy5.5 CD45 (mouse monoclonal) | Biolegend | Cat #: 304028; RRID: AB_893338 | (1:50) |
| Antibody | Rabbit anti-Erg (rabbit monoclonal) | Abcam | Cat #: ab92513; RRID: AB_2630401 | (1:200) |
| Antibody | Goat anti-Car4 (goat polyclonal) | R&D | Cat #: AF2414; RRID: AB_2070332 | (1:200) |
| Antibody | Rabbit anti-Smmhc (rabbit polyclonal) | Proteintech | Cat #: 21404–1-AP; RRID: AB_10732819 | (1:100) |
| Antibody | Mouse anti-Cldn5 (mouse monoclonal) | Invitrogen | Cat #: 35–2500; RRID: AB_2533200 | (1:200) |
| Peptide, recombinant protein | Collagenase IV | Worthington | Cat #: LS004186 | |
| Peptide, recombinant protein | Dispase | Worthington | Cat #: LS02100 | |
| Peptide, recombinant protein | DNase I | Worthington | Cat #: LS002007 | |
| Commercial assay or kit | RNEasy Mini Kit | Qiagen | Cat #: 74,104 | |
| Commercial assay or kit | iScript Reverse Transcription Supermix | Bio-Rad | Cat #: 1708840 | |
| Commercial assay or kit | Roche DIG RNA Labeling kit | Millipore Sigma | Cat #: 11175025910 | |
| Commercial assay or kit | RNAscope Multiplex Fluorescent V2 assay kit | Advanced Cell Diagnostics | Cat #: 323,100 | |
| Commercial assay or kit | Click-iT EdU Imaging kit | Thermo Fisher Scientific | Cat #: C10086 | |
| Chemical compound, drug | Tamoxifen | Sigma-Aldrich | Cat #: T5648 | |
| Chemical compound, drug | 4-OH Tamoxifen | Sigma-Aldrich | Cat #: H6278 | |
| Software, algorithm | Seurat v3 | https://doi.org/10.1016/j.cell.2019.05.031 | RRID: SCR_007322 | |
| Software, algorithm | bcl2fastq | illumina | RRID: SCR_015058 | |
| Software, algorithm | cutadapt 2.7 | https://doi.org/10.14806/ej.17.1.200 | RRID: SCR_011841 | |
| Software, algorithm | Cell Ranger v3.1.0 | 10× Genomics | RRID: SCR_017344 | |
| Software, algorithm | STAR v2.7.1a | https://doi.org/10.1093/bioinformatics/bts635 | RRID: SCR_004463 | |
| Software, algorithm | Subread v1.6.0 | https://doi.org/10.1093/nar/gkt214 | RRID: SCR_009803 | |
| Software, algorithm | heatmaply | http://dx.doi.org/10.1093/bioinformatics/btx657 | https://github.com/talgalili/heatmaply (Galili, 2021) | |
| Software, algorithm | biomaRt | 10.18129/B9.bioc.biomaRt | RRID: SCR_019214 | |
| Software, algorithm | PAGA | https://doi.org/10.1186/s13059-019-1663-x | https://github.com/theislab/paga (Thesis Lab, 2019) | |
| Software, algorithm | RNA velocity | 10.1038/s41586-018-0414-6 | RRID: SCR_018168; RRID: SCR_018167 | |
| Software, algorithm | Slingshot | https://doi.org/10.1186/s12864-018-4772-0 | RRID: SCR_017012 | |
| Software, algorithm | SCENIC | 10.1038/nmeth.4463 | RRID: SCR_017247 | |
| Software, algorithm | FIJI | doi:10.1038/nmeth.2019 | RRID: SCR_002285 | |
| Software, algorithm | QuPath | https://doi.org/10.1038/s41598-017-17204-5 | RRID: SCR_018257 | |
| Software, algorithm | Prism 8 | GraphPad Software | RRID: SCR_002798 | |
| Other | TINAGL1 RNA probe | Advanced Cell Diagnostics | Cat #: 857221-C2 |
Additional files
Download links
A two-part list of links to download the article, or parts of the article, in various formats.
Downloads (link to download the article as PDF)
Open citations (links to open the citations from this article in various online reference manager services)
Cite this article (links to download the citations from this article in formats compatible with various reference manager tools)
Coronary blood vessels from distinct origins converge to equivalent states during mouse and human development
eLife 10:e70246.
https://doi.org/10.7554/eLife.70246


