Gastrointestinal helminths increase Bordetella bronchiseptica shedding and host variation in supershedding
- Center for Infectious Disease Dynamics, The Pennsylvania State University, United States
- Department of Biology, The Pennsylvania State University, United States
- Department of Infectious Diseases, University of Georgia, United States
Figures
Figure 1
Observed levels of B. bronchiseptica shedding by contact of infected rabbits with a Bordet-Gengou agar petri dish.
Rabbits (infected shedders and non-shedders) from the four types of infection are reported, B. bronchiseptica (B), B. bronchiseptica-G. strigosum (BG), B. bronchiseptica-T. retortaeformis (BT) and B. bronchiseptica-T. retortaeformis-G. strigosum (BTG) (top-down). Each infection is presented following the experimental design where rabbits are ordered by their time of sacrifice (early/left, late/right) during the infection (week 4th to 21st, dotted vertical red lines). For every rabbit the following are reported: observed shedding events (black points), 25th and 75th percentiles (top and bottom hinges), median values (thick horizontal lines) and values within the 1.5 inter-quartile range (IQR, whiskers extending up to 1.5*IQR). To facilitate the visualization, B infection is reported on a smaller y-axis. The level of shedding is quantified as number of Colony Forming Units per second (CFU/s).
Figure 2
Observed level of B.bronchiseptica shedding by days post infection (Dpi) and type of infection.
Shedding events (points), host individual trajectories (thin lines) and median population trend (smoothed thick lines) with 95% CI (blue shadows) are reported. The trajectories of few individuals are highlighted with different colors to facilitate visualization. The abrupt interruption of individual trends is caused by the removal of rabbits at fixed time points. To reduce overcrowding, host trajectories with at least four shedding points larger than zero are included. Note the much lower shedding values, and different y-axis, for the B group. Further details in Figure 1.
Figure 3
Frequency of observed B.bronchiseptica shedding events for the four types of infection.
Events have been grouped by shedding level using 0.5 CFU/s unit intervals, the first interval represents events with zero shedding. Red lines indicate the 95th and 99th percentile thresholds, respectively, estimated using the entire experimental dataset; cases above the threshold value represent supershedding events. A Negative Binomial distribution is fitted to each co-infection group (blue line), while it was not possible for the B group due to the few bins.
Figure 4
B. bronchiseptica shedding on BG-blood agar petri dishes.
Examples of A: supershedding event and B: average shedding event.
Figure 5

Estimated immune responses in the blood by time and type of infection.
Empirical longitudinal data (points) with estimated trajectories (black lines) for every individual rabbit, and group means (blue lines) with 95% CIs (blue shadows) are reported. The abrupt interruption of individual data is caused by the removal of rabbits at fixed time points. For the B rabbits we only report the trend at the group level.
Figure 6

Estimated rates of infection in the whole respiratory tract and immune response in the blood by time and type of infection.
Means (continuous lines) and 95% CIs (shaded areas) are reported for neutrophils (black), IgA (blue), IgG (red), and B. bronchiseptica infection (green). Individual trends (dotted lines) have been included for the neutralization rates of the co-infected groups but not for the other rates, as CIs are very narrow and individual trends are difficult to disentangle. The abrupt interruption of individual trends are caused by the removal of rabbits at fixed time points. Full details on the estimated rates, along with their credible intervals, are available in Table 2.
Figure 7
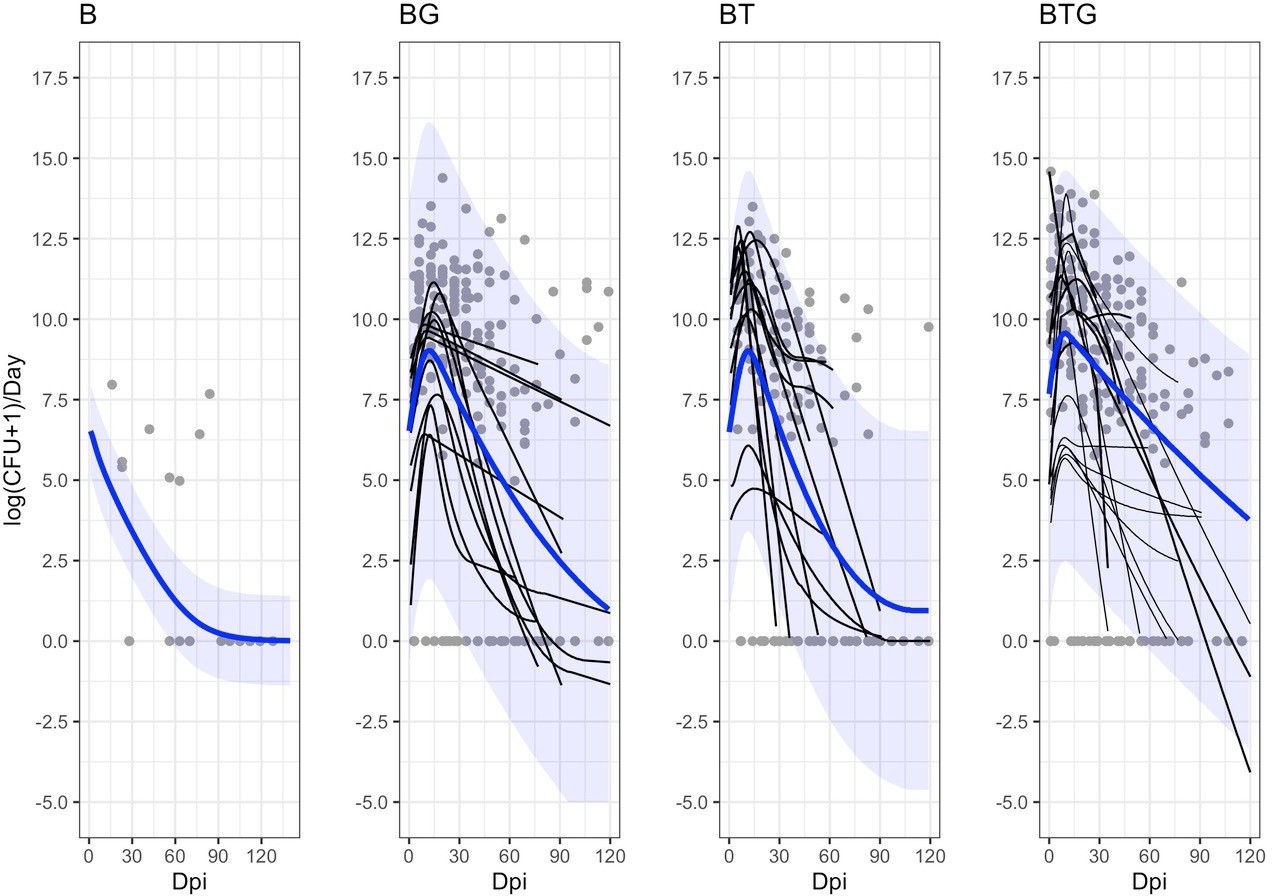
Estimated dynamics of B. bronchiseptica shedding by time and type of infection.
The empirical shedding events (gray points), the estimated individual trajectories (smoothed thin black lines) and the estimated median group trends (blue lines), with the related 95%CIs (blue shadows), are reported. Level of shedding is presented as total daily event to scale up with model dynamics performed at one-day time step. For the B alone rabbits, we only report the group trend. Here, model prediction places the peak at the start of the trial (0 dpi), however, there were no shedding data to train the model during the first ten days and this result warns prudence.
Appendix 1—figure 1
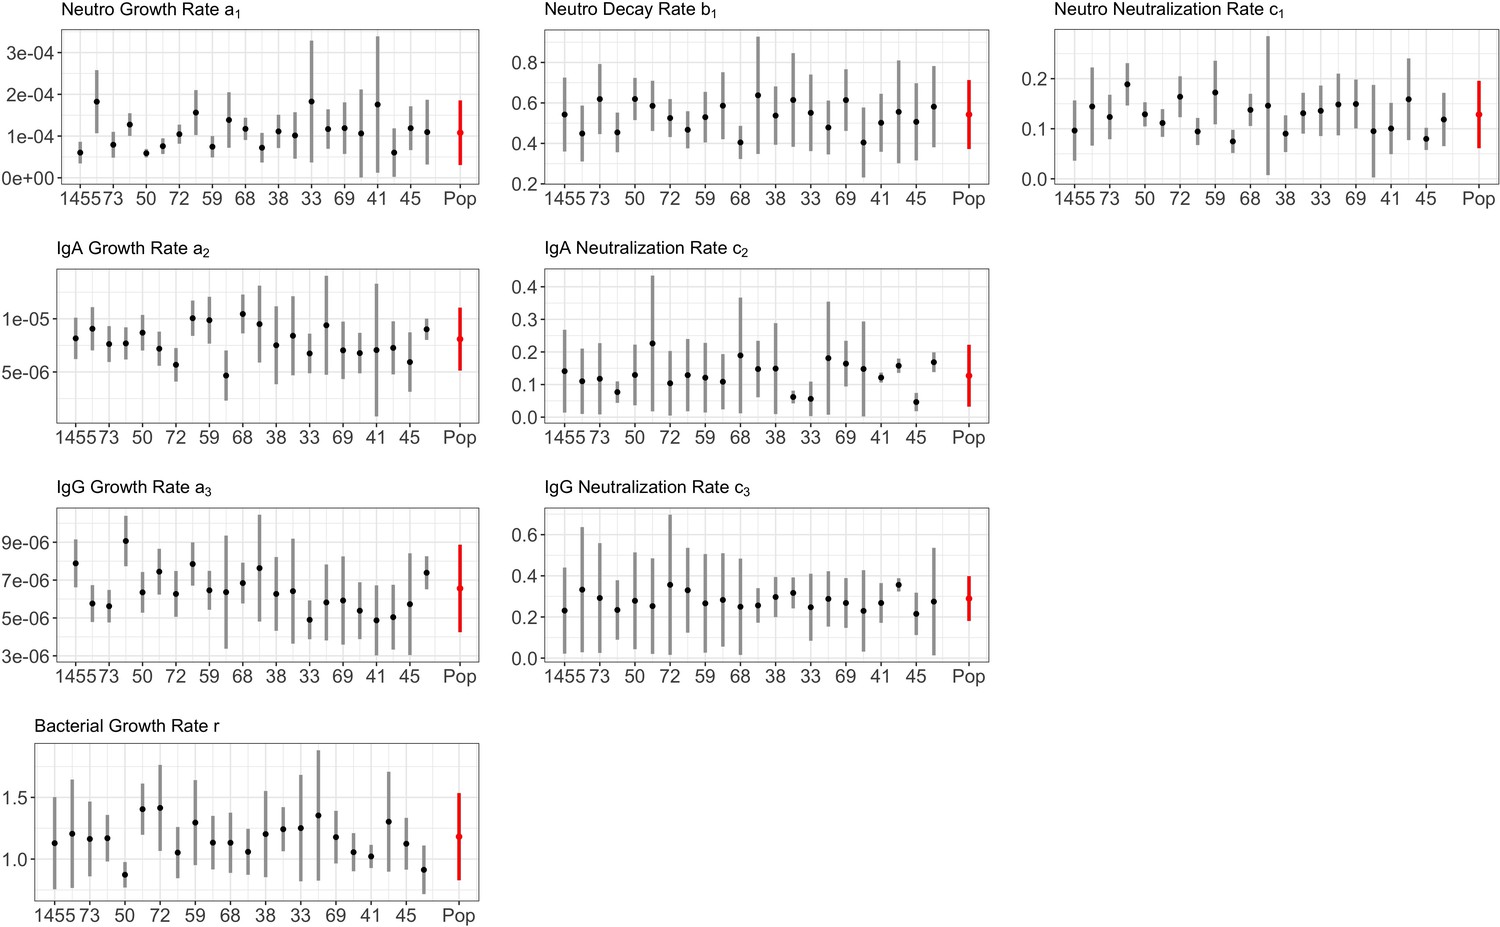
Parameter estimates from posterior distribution for BG.
Individual average (black points) with 95% CIs (black segments), and group average (named ’Pop’, red points) with 95% CIs (red segments), are reported. X-axis lists the rabbit’s ID every 5 animals using the same left-to-right ID order, and host sampling scheme, as detailed in Figure 1 of the main text.
Appendix 1—figure 2
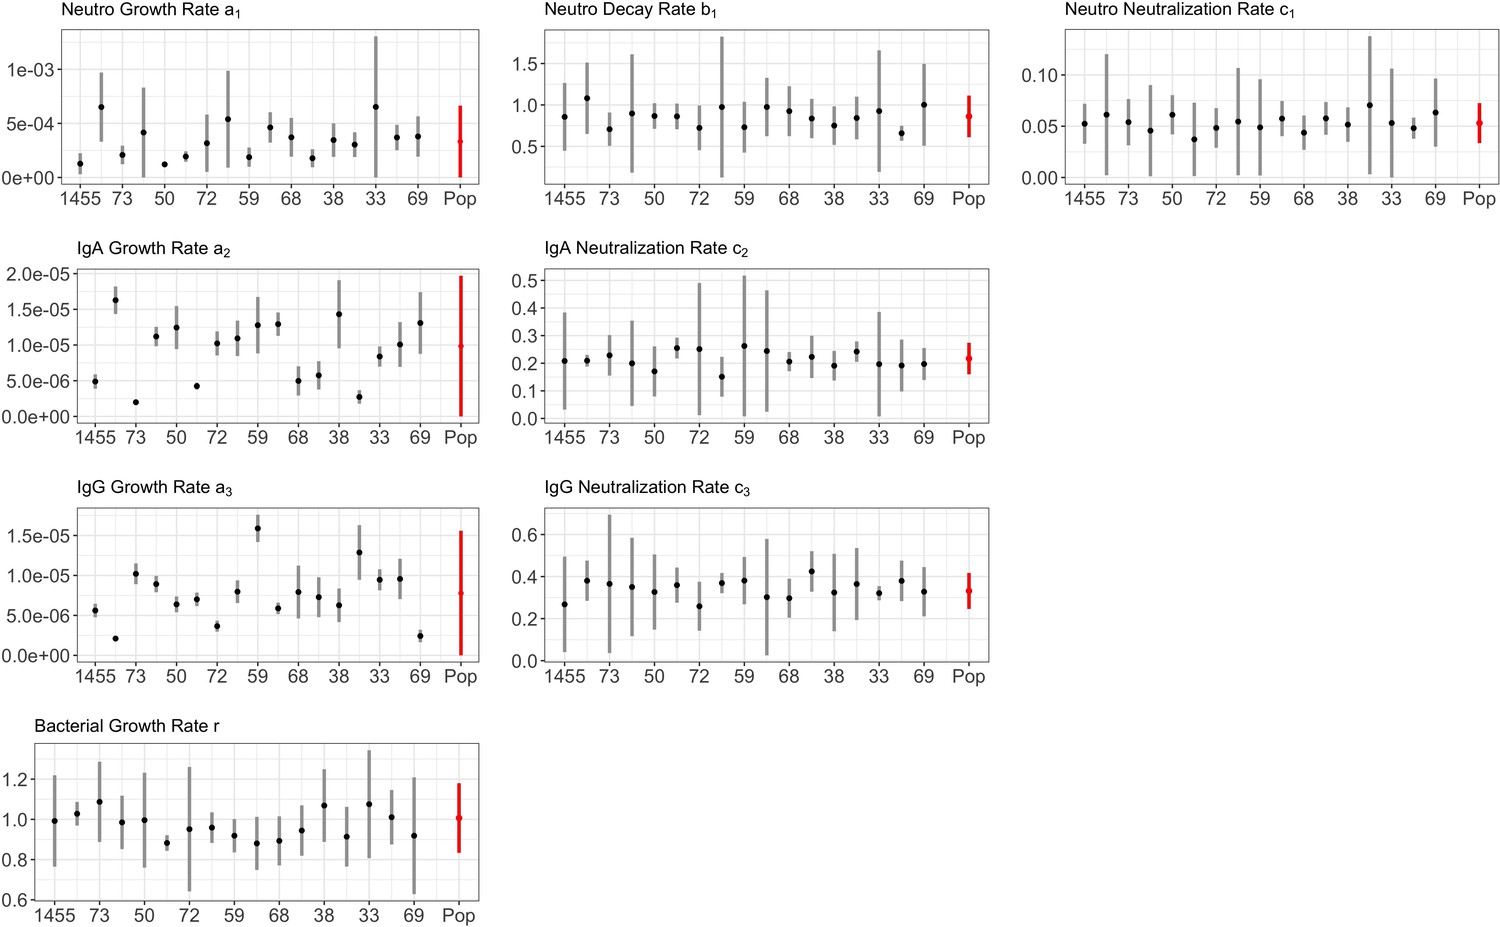
Parameter estimates from posterior distribution for BT.
Full details in Appendix 1—figure 1.
Appendix 1—figure 3
Parameter estimates from posterior distribution for BTG.
Full details in Appendix 1—figure 1.
Appendix 2—figure 1
Relationship between B.bronchiseptica peak of shedding and percentile changes in neutrophils, IgA, and IgG.
The growth a, and neutralizing c, rates of neutrophils (subscript 1), IgA (subscript 2) and IgG (subscript 3), including bacterial growth rate r, are reported by group. Mean estimates with 95% CIs are presented.
Appendix 2—figure 2

Relationship between B.bronchiseptica time to peak of shedding and percentile changes in neutrophils, IgA, and IgG.
Full details in Appendix 2—figure 1.
Appendix 3—figure 1
MCMC trace plot for B.
Different colors represent the four chains.
Appendix 3—figure 2
MCMC trace plot for BG.
Different colors represent the four chains.
Appendix 3—figure 3
MCMC trace plot for BT.
Different colors represent the four chains.
Appendix 3—figure 4
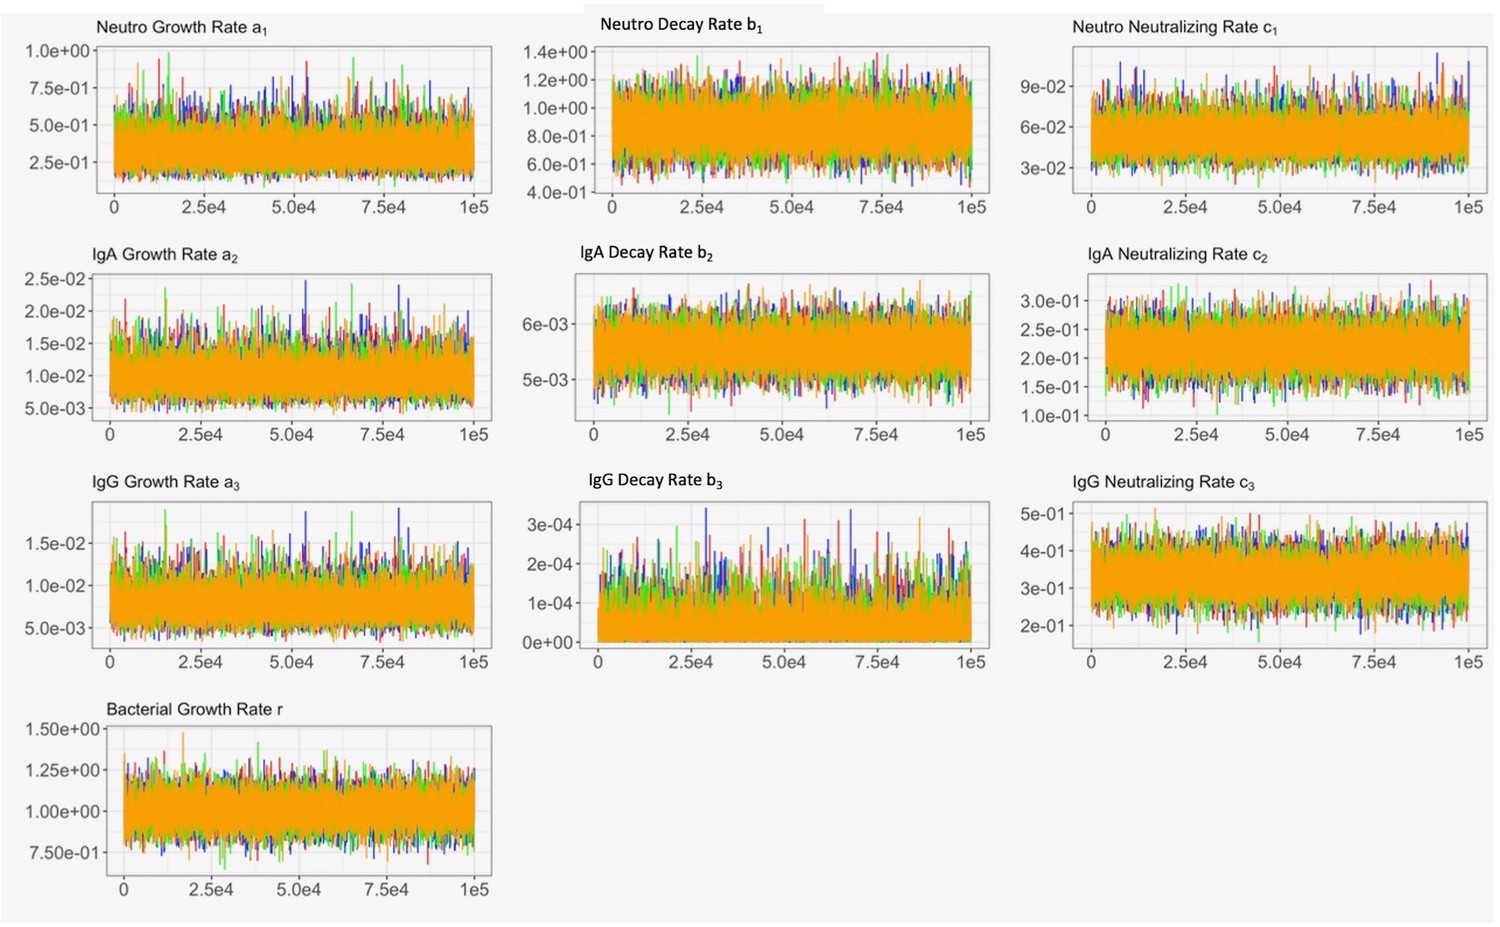
MCMC trace plot for BTG.
Different colors represent the four chains.
Appendix 3—figure 5
MCMC posteriors from B.
Histograms (diagonal), pair-wise scatterplots (upper right) and related correlations (lower left) from the parameter posteriors.
Appendix 3—figure 6
MCMC posteriors from BG.
Histograms (diagonal), pair-wise scatterplots (upper right) and related correlations (lower left) from the parameter posteriors.
Appendix 3—figure 7
MCMC posteriors from BT.
Histograms (diagonal), pair-wise scatterplots (upper right) and related correlations (lower left) from the parameter posteriors.
Appendix 3—figure 8

MCMC posteriors from BTG.
Histograms (diagonal), pair-wise scatterplots (upper right) and related correlations (lower left) from the parameter posteriors.
Appendix 4—figure 1
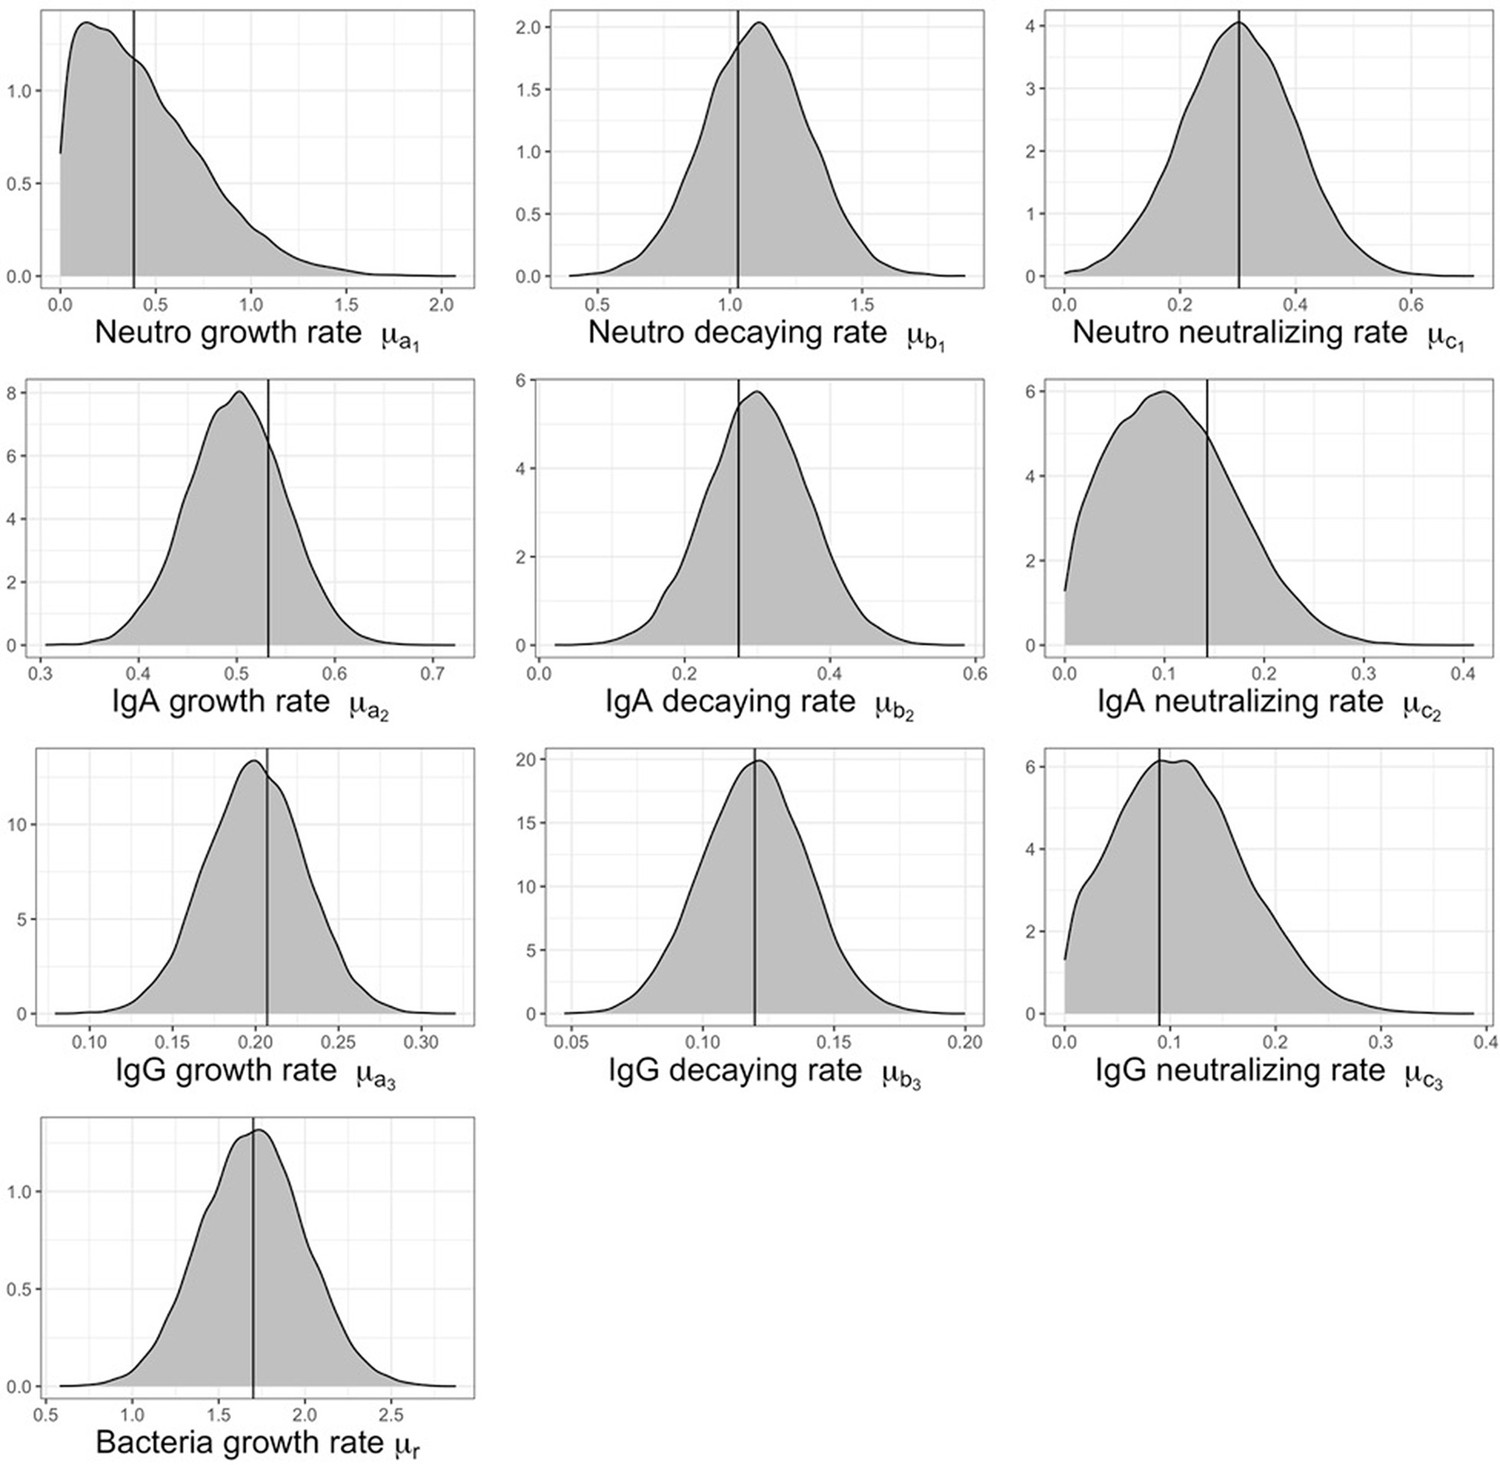
Model validation using group-level parameters.
The vertical lines represent the true parameters that were used to simulate the datasets.
Tables
Table 1
Description and unit of parameters and variables used in the dynamical and observed models.
| Parameters/ | Descriptions | Unit | Value |
|---|---|---|---|
| Variables | |||
| Rabbit ith specific parameters | |||
| Growth, decay and B. bronchiseptica neutralization rates of neutrophils | day-1 | Estimated | |
| Growth, decay and B. bronchiseptica neutralization rates of IgA | day-1 | Estimated | |
| Growth, decay and B. bronchiseptica neutralization rates of IgG | day-1 | Estimated | |
| ri | Per capita B. bronchiseptica replication rate | day-1 | Estimated |
| Time-dependent neutrophil response | cells/ml | Calculated | |
| Time-dependent IgA response | O.D. index | Calculated | |
| Time-dependent IgG response | O.D. index | Calculated | |
| Time-dependent B. bronchiseptica infection intensity | CFU/g count | Calculated | |
| Group parameters | |||
| Mean of neutrophil growth, decay and neutralization rates | day-1 | Estimated | |
| Standard deviation (S.D.) of neutrophil growth, decay and neutralization rates | day-1 | Estimated | |
| Mean of IgA growth, and neutralization rates | day-1 | Estimated | |
| Standard deviation (S.D.) of IgA growth, and neutralization rates | day-1 | Estimated | |
| Mean of IgG growth, and neutralization rates | day-1 | Estimated | |
| Standard deviation (S.D.) of IgG growth, and neutralization rates | day-1 | Estimated | |
| Mean and S.D. of B. bronchiseptica replication rates | day-1 | Estimated | |
| Neutrophils level at equilibrium | cells/ml | Observed | |
| B. bronchiseptica infection intensity at time t=0 | CFU/g count | Estimated | |
Table 2
Model prior and posterior parameters for the immune response and B. bronchiseptica infection.
We report: mean and S.D. of priors, and mean, 95% CI and S.D. from posterior distributions for each group. The complete description of the parameters is provided in Table 1.
| Parameters | Priors | Posteriors B | Posteriors BG | Posteriors BT | Posteriors BTG |
|---|---|---|---|---|---|
| 0.10 (0.05) | 2.89 (1.17–4.61) | 1.08 (0.31–1.85) | 3.32 (1.73–4.90) | 0.93 (0.35–1.50) | |
| 1.10 (0.20) | 2.00 (1.65–2.35) | 0.81 (0.51–1.11) | 0.99 (0.61–1.36) | 1.36 (0.91–1.81) | |
| 0.30 (0.10) | 1.51 (1.27–1.75) | 0.66 (0.43–0.89) | 0.78 (0.49–1.36) | 0.86 (0.59–1.81) | |
| 0.50 (0.10) | 1.20 (0.83–1.57) | 0.54 (0.37–0.71) | 0.86 (0.61–1.11) | 0.58 (0.40–0.77) | |
| 0.30 (0.10) | 7.07 (5.55–8.59) | 3.10 (2.4–3.80) | 5.57 (4.97–6.16) | 7.43 (6.50–8.36) | |
| 0.10 (0.07) | 0.93 (0.03–1.83) | 0.66 (0.02–1.30) | 0.39 (0.01–0.77) | 0.49 (0.01–0.97) | |
| 0.20 (0.05) | 0.11 (0.06–0.16) | 0.13 (0.06–0.20) | 0.05 (0.03–0.07) | 0.30 (0.19–0.42) | |
| 0.12 (0.02) | 0.044 (0.003–0.085) | 0.13 (0.03–0.22) | 0.22 (0.16–0.27) | 0.01 (.0004–0.02) | |
| 0.10 (0.07) | 0.042 (0.002–0.083) | 0.29 (0.18–0.40) | 0.33 (0.25–0.42) | 0.32 (0.23–0.42) | |
| 1.70 (0.30) | 0.06 (0.01–0.12) | 1.18 (0.83–1.54) | 1.01 (0.83–1.18) | 1.47 (1.10–1.83) | |
| 0.68 (0.68–0.68) | 0.71 (0.35–1.07) | 0.68 (0.36–1.01) | 0.82 (0.46–1.18) | ||
| 0.05 | 1.89 | 1.93 | 2.75 | ||
| 0.45 | 0.38 | 0.53 | 0.70 | ||
| 0.22 | 0.40 | 0.33 | 0.22 | ||
| 0.08 | 0.10 | 0.15 | 0.15 | ||
| 1.00 | 6.02 | 4.50 | 4.01 |
Appendix 3—table 1
Scale reduction factors for each parameter of the four types of infection.
| Parameters | B | BG | BT | BTG |
|---|---|---|---|---|
| 1.000234 | 1.000103 | 1.000252 | 1.000047 | |
| 1.000166 | 1.000205 | 1.000122 | 1.000073 | |
| 1.000053 | 1.000047 | 0.999977 | 1.000423 | |
| 1.000120 | 1.000174 | 1.000285 | 0.999986 | |
| 1.000043 | 1.000049 | 1.000051 | 1.000128 | |
| 1.000060 | 0.999973 | 1.000240 | 1.000316 | |
| 1.000068 | 1.000166 | 1.000027 | 1.000059 | |
| 1.000013 | 0.999927 | 0.999919 | 1.000089 | |
| 0.999967 | 1.000016 | 1.000224 | 1.000204 | |
| 0.999972 | 0.999961 | 1.000139 | 1.000517 | |
| log(LLH) | 1.000650 | 1.000406 | 1.000521 | 1.000401 |
Appendix 5—table 1
Bayesian Information Criterion (BIC) and level of model complexity (N), including pair-wise Δ BIC with the best fitted model.
| Models | BIC-ΔBIC | B | BG | BT | BTG | N |
|---|---|---|---|---|---|---|
| Neutrophils+IgA+IgG | BIC | -652.9 | -351.2 | 594.8 | -610.5 | 12 |
| Neutrophils+IgA | BIC | -251.3 | -302.2 | -570.9 | -507.7 | 9 |
| Neutrophils+IgA | ΔBIC | 401.5 | 48.9 | 23.9 | 102.8 | |
| Neutrophils+IgG | BIC | -314.8 | -105.6 | -442.0 | -423.9 | 9 |
| Neutrophils+IgG | ΔBIC | 338.1 | 245.6 | 152.7 | 186.5 |
Additional files
Download links
A two-part list of links to download the article, or parts of the article, in various formats.
Downloads (link to download the article as PDF)
Open citations (links to open the citations from this article in various online reference manager services)
Cite this article (links to download the citations from this article in formats compatible with various reference manager tools)
Gastrointestinal helminths increase Bordetella bronchiseptica shedding and host variation in supershedding
eLife 11:e70347.
https://doi.org/10.7554/eLife.70347


