Schema representations in distinct brain networks support narrative memory during encoding and retrieval
- Princeton Neuroscience Institute, United States
- Department of Psychology, Princeton University, United States
- Department of Psychology, Columbia University, United States
Figures
Figure 1
Methods.
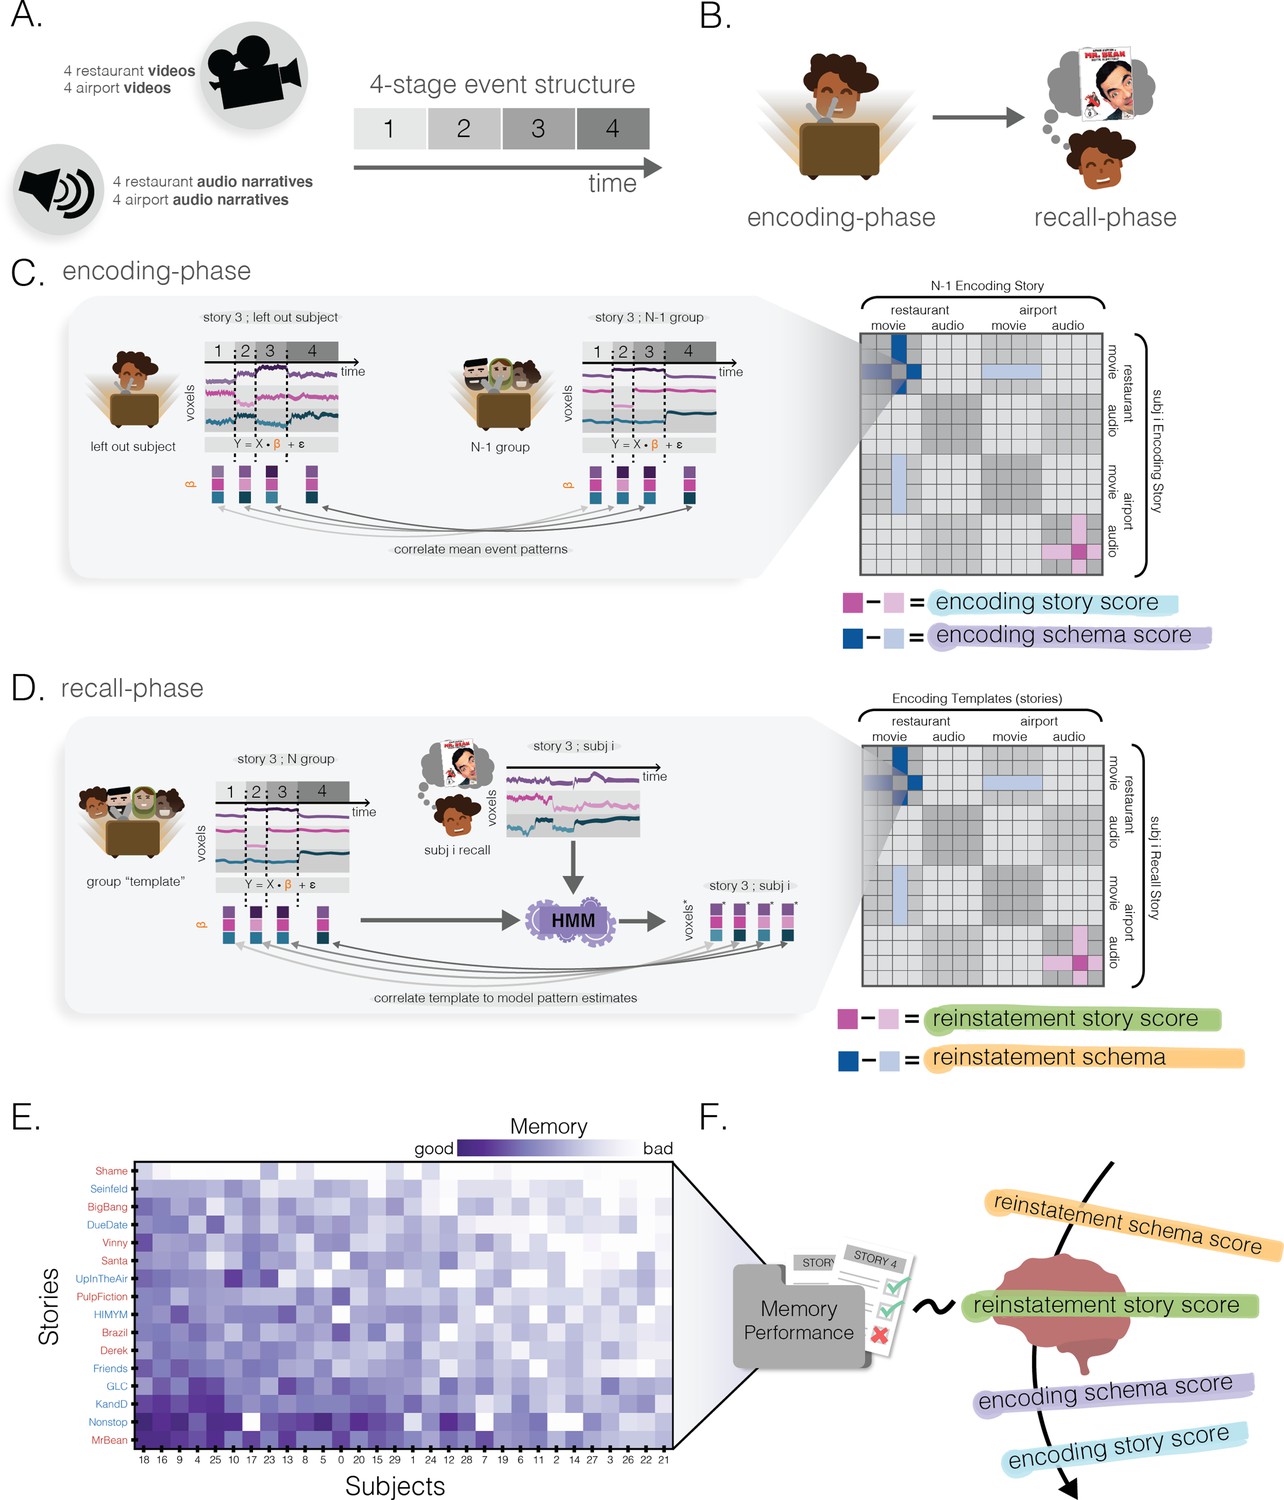
(A) Stimuli. There were a total of 16 narratives (audiovisual clips or spoken narration): eight restaurant narratives and eight airport narratives. Each narrative followed a four-event temporal structure specific to its schema (see text). (B) Experimental protocol. After participants encoded each of the narratives, they were then asked to freely recall each of them with a title cue only. (C) Encoding story and schema score. For each story in each participant, a spatial activity pattern was extracted for each of the four events in that story. We then computed, for each participant, the 16 × 16 neural similarity matrix correlating the neural representations of each of the 16 stories in that participant and the neural representations of each of the 16 stories, averaged across the other participants (see text for details). For each story in each participant, we computed an encoding story score contrasting across-subject neural similarity to the same story (dark pink) vs. different stories from the same schema (light pink); we also computed an encoding schema score contrasting across-subject neural similarity to different stories from the same schema (dark blue) vs. different stories from the other schema (light blue). (D) Reinstatement story and schema score. We used hidden Markov models (HMMs) to measure the degree to which each of the 16 stories from the encoding phase was neurally reinstated during recall of a given story (see text for details). This process yielded a 16 story × 16 story neural reinstatement matrix for each participant. Analogously to (C), for each recall we computed a reinstatement story score (contrasting how well the same story’s encoding pattern was reinstated vs. other stories from the same schema) and a reinstatement schema score (contrasting how well other stories from the same schema were reinstated vs. other stories from the other schema). (E) Behavioral memory performance. Every participant’s free recall was scored using a rubric to measure the number of story-specific details the participant provided. This matrix has been sorted such that the most accurate recalls are in the bottom-left. Red and blue story labels indicate restaurant vs. airport narratives, respectively. (F) Predicting behavioral memory performance. We used the 4 scores derived from (C) and (D) (encoding story/schema and reinstatement story/schema) in four separate regression models to predict behavioral memory performance in (E).
Figure 2 with 2 supplements
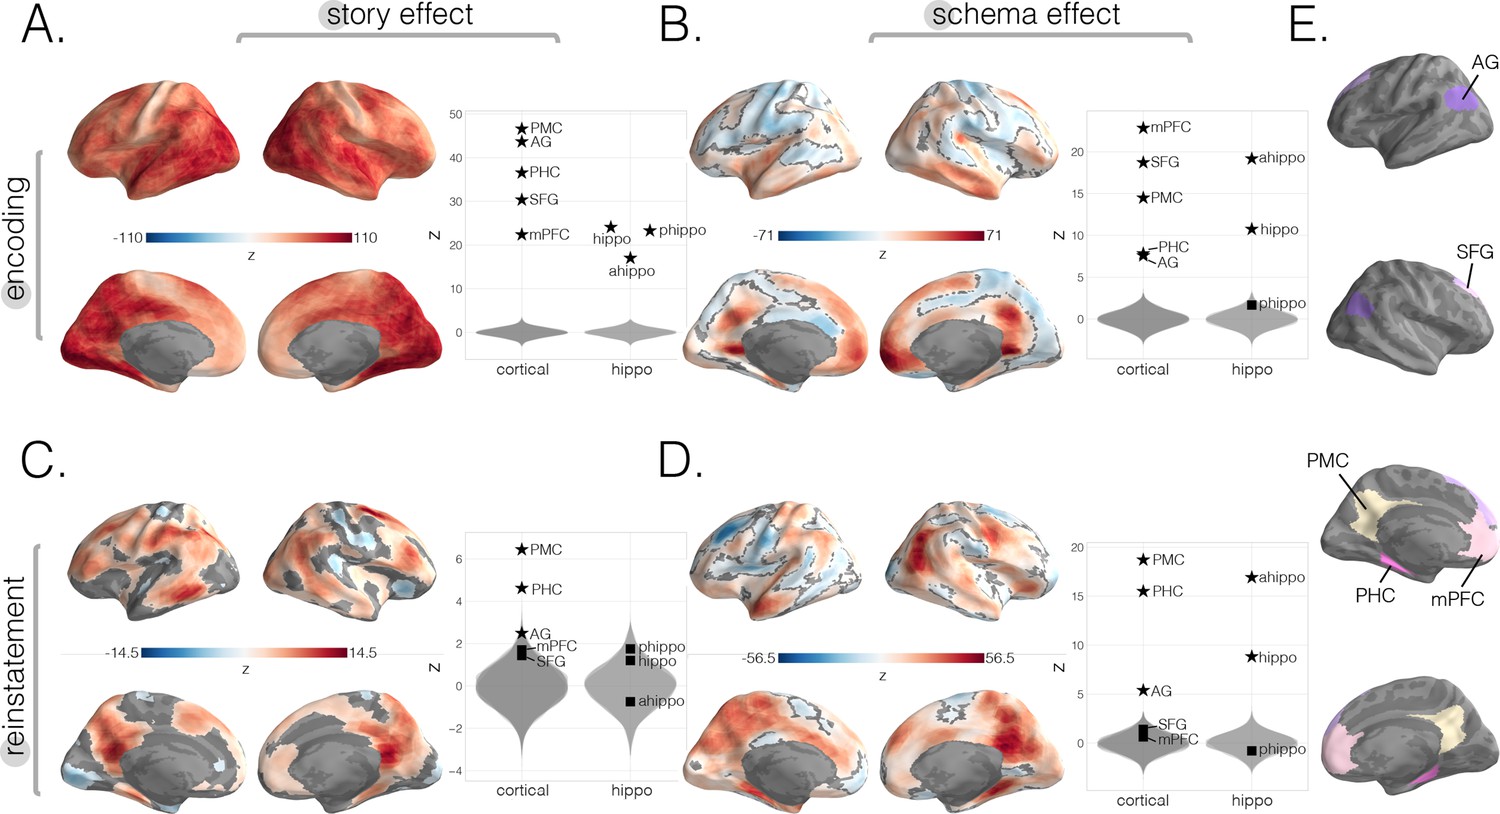
Neural story and schema strength during encoding and retrieval in whole-brain and specific cortical and hippocampal ROIs.
(A) Encoding story scores. (B) Encoding schema scores. (C) Reinstatement story scores. (D) Reinstatement schema scores. All surface maps (A–D) were colorized with z-scores relative to the null distribution but thresholded via false discovery rate (FDR) correction for q < 0.05 after extracting p-values from a nonparametric permutation test. Plots depict effect sizes in ROIs, z-scored relative to the null distribution (gray). Starred points indicate significant differences after Bonferroni correction for multiple comparisons. (E) Locations of our cortical ROIs.
Figure 2—figure supplement 1
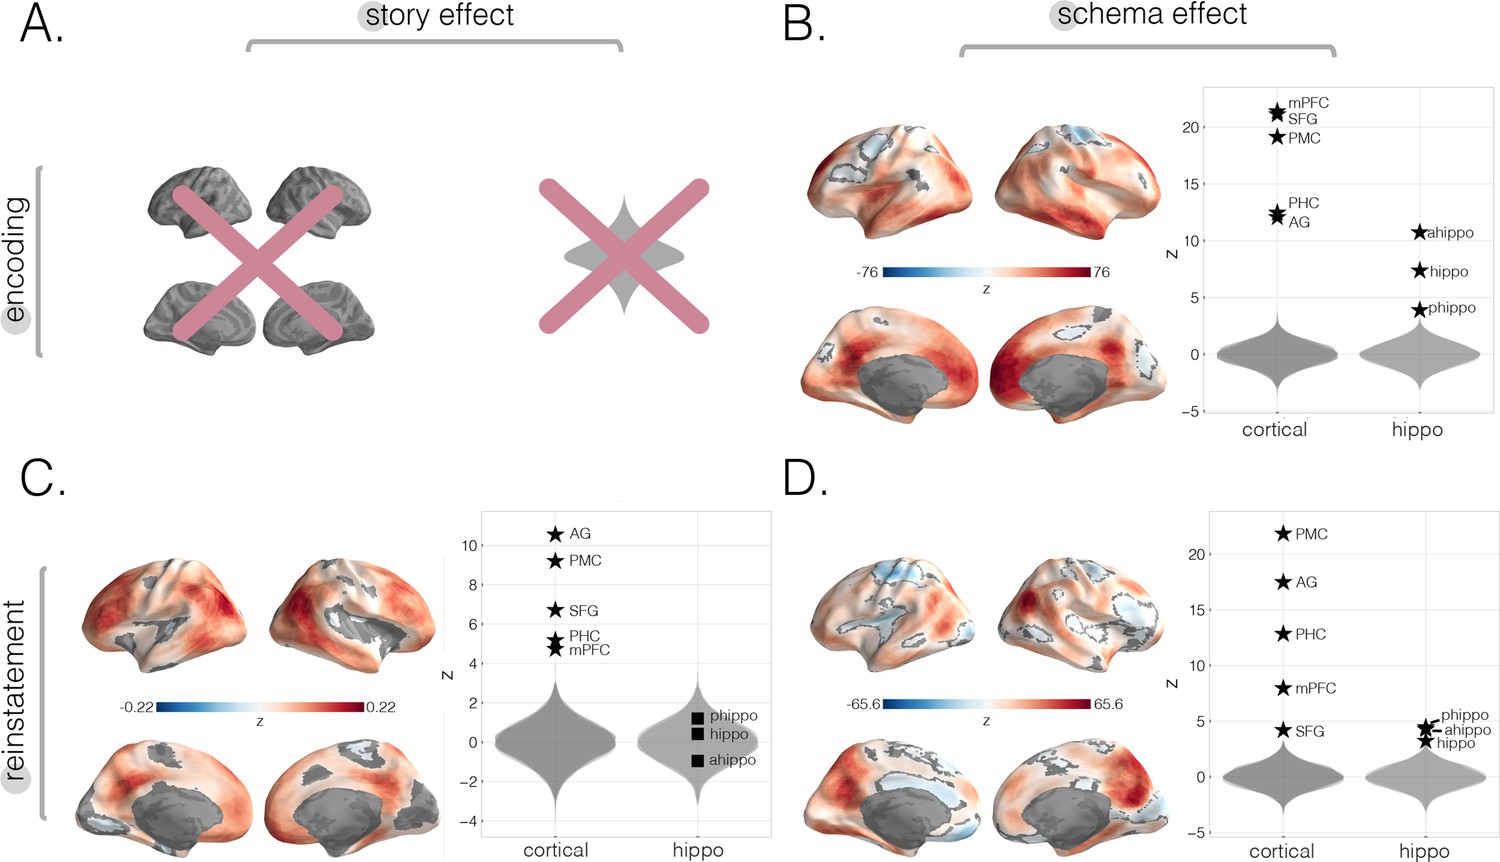
Neural story and schema strength during encoding and retrieval in whole-brain and specific cortical and hippocampal ROIs, computed within-subjects.
In this within-subjects analysis, rather than averaging across participants to get one neural four-event pattern template per story, we used each participant’s individual encoding data to create a participant-specific four-event template per story and reran each of our main analyses (i.e., encoding schema score, reinstatement story score, and reinstatement schema scores; see Materials and methods). (A) Encoding story scores cannot be calculated within-subjects (see Materials and methods). (B) Encoding schema scores within-subjects. Effects were observed in all of our a priori ROIs, as well as prostriata and the anterior temporal lobe. (C) Reinstatement story scores within-subjects. The strongest effects were observed in parietal and posterior superior temporal cortex as well as superior frontal gyrus (SFG), frontal gyrus, and superior parietal lobule (SPL). No significant effects were found in hippocampal ROIs. (D) Reinstatement schema scores within-subjects. Effects were present in all a priori ROIs, especially posterior medial cortex (PMC) and angular gyrus (AG). All surface maps (B–D) were colorized with z-scores relative to the null distribution but thresholded via FDR correction for q < 0.05 after extracting p-values from a nonparametric permutation test. Plots depict effect sizes in ROIs, z-scored relative to the null distribution (gray). Starred points indicate significant differences after Bonferroni correction for multiple comparisons.
Figure 2—figure supplement 2
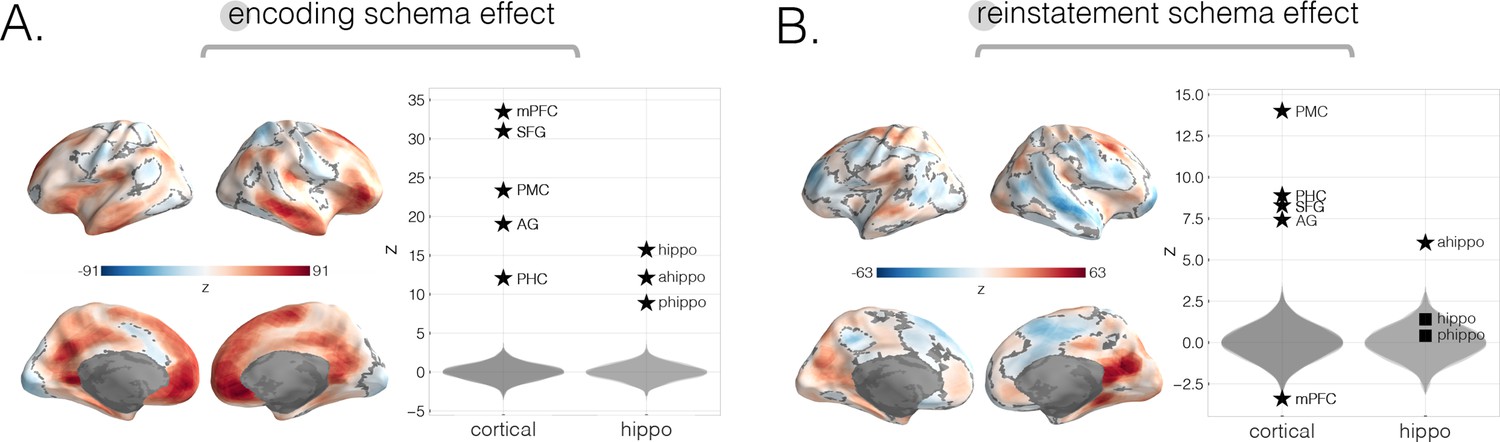
Neural schema strength during encoding and retrieval in whole-brain and specific cortical and hippocampal ROIs, computed across-modality.
To reveal how well schema effects persist across-modality, we reran the same main analyses (i.e., encoding schema score and reinstatement schema score; see Materials and methods), this time contrasting stories across-modality rather than within-modality. (A) Across-modality encoding schema score. The strongest effects were found in medial prefrontal cortex (mPFC), superior frontal gyrus (SFG), posterior medial cortex (PMC), right temporal pole, prostriata, and frontal gyrus. (B) Across-modality reinstatement schema score. The strongest effects in both searchlight and a priori ROIs were found in PMC, parahippocampal cortex (PHC), angular gyrus (AG), and anterior hippocampus. Subregions within mPFC showed differential effects such that searchlight results revealed a positive effect while ROI results revealed a negative effect. All surface maps were colorized with z-scores relative to the null distribution but thresholded via FDR correction for q < 0.05 after extracting p-values from a nonparametric permutation test. Plots depict effect sizes in ROIs, z-scored relative to the null distribution (gray). Starred points indicate significant differences after Bonferroni correction for multiple comparisons.
Figure 3 with 4 supplements
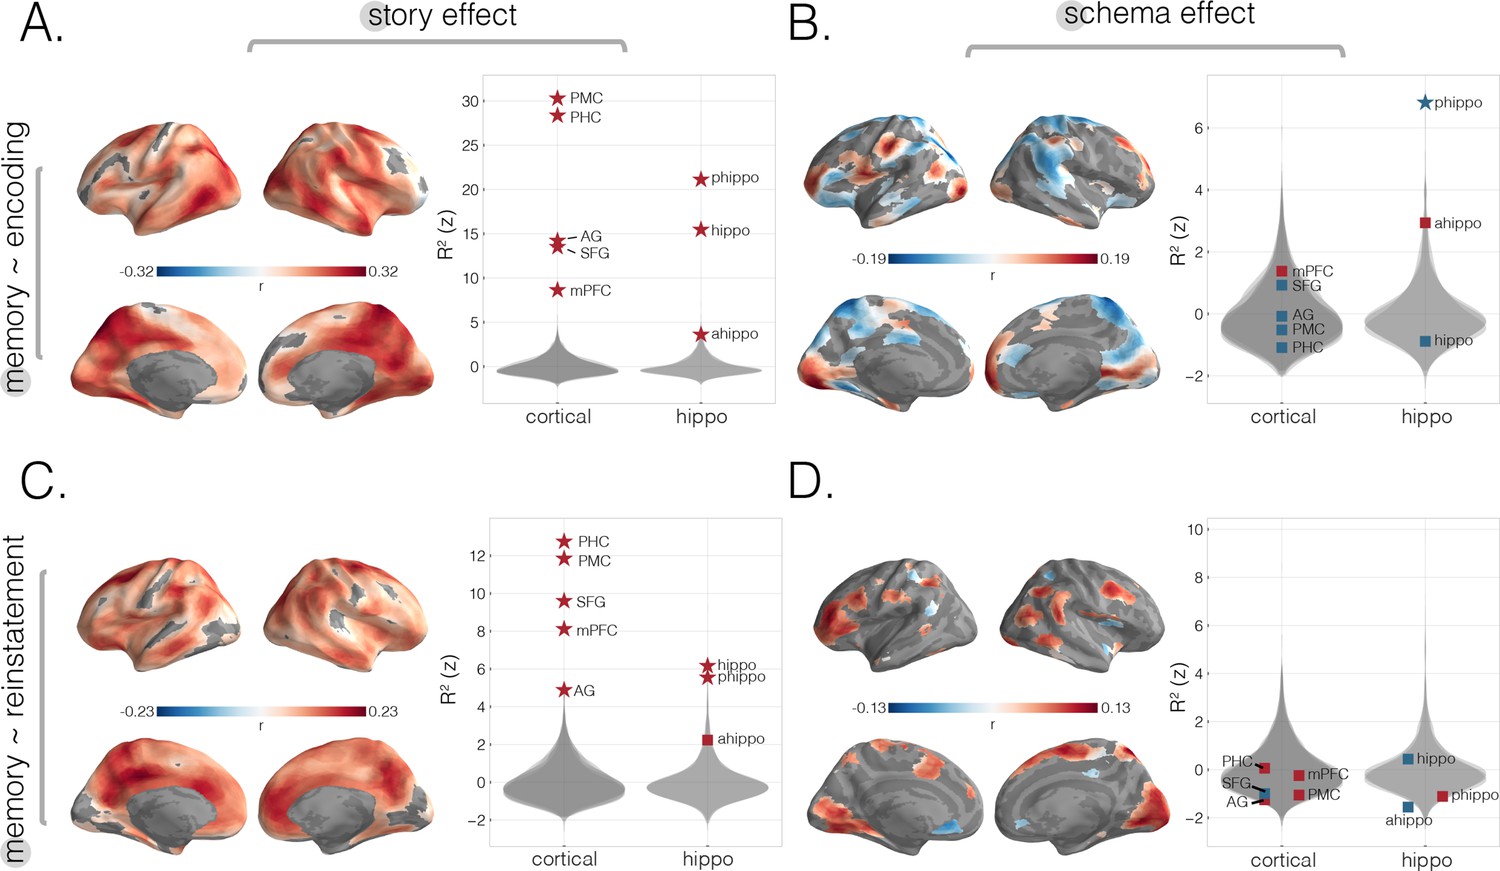
Predicting behavioral memory for story details with neural measures from encoding and recall.
We predicted behavioral memory performance on held-out subjects based on each of our four neural scores (from Figure 2), across the neocortex and in specific ROIs. (A) Predicting memory scores using encoding story scores. (B) Predicting memory scores using encoding schema scores. (C) Predicting memory scores using reinstatement story scores. (D) Predicting memory scores using reinstatement schema scores. All surface maps were statistically thresholded by comparing model performance on held-out data to a null distribution and then FDR-correcting for q < 0.05. Surface maps are colored based on the correlation values between neural scores and behavioral memory performance. All violin plots show values describing model performance z-scored relative to the null distribution. Starred points indicate significant differences after Bonferroni correction for multiple comparisons. Point colors indicate directionality of prediction with red and blue for positive and negative associations, respectively.
Figure 3—figure supplement 1
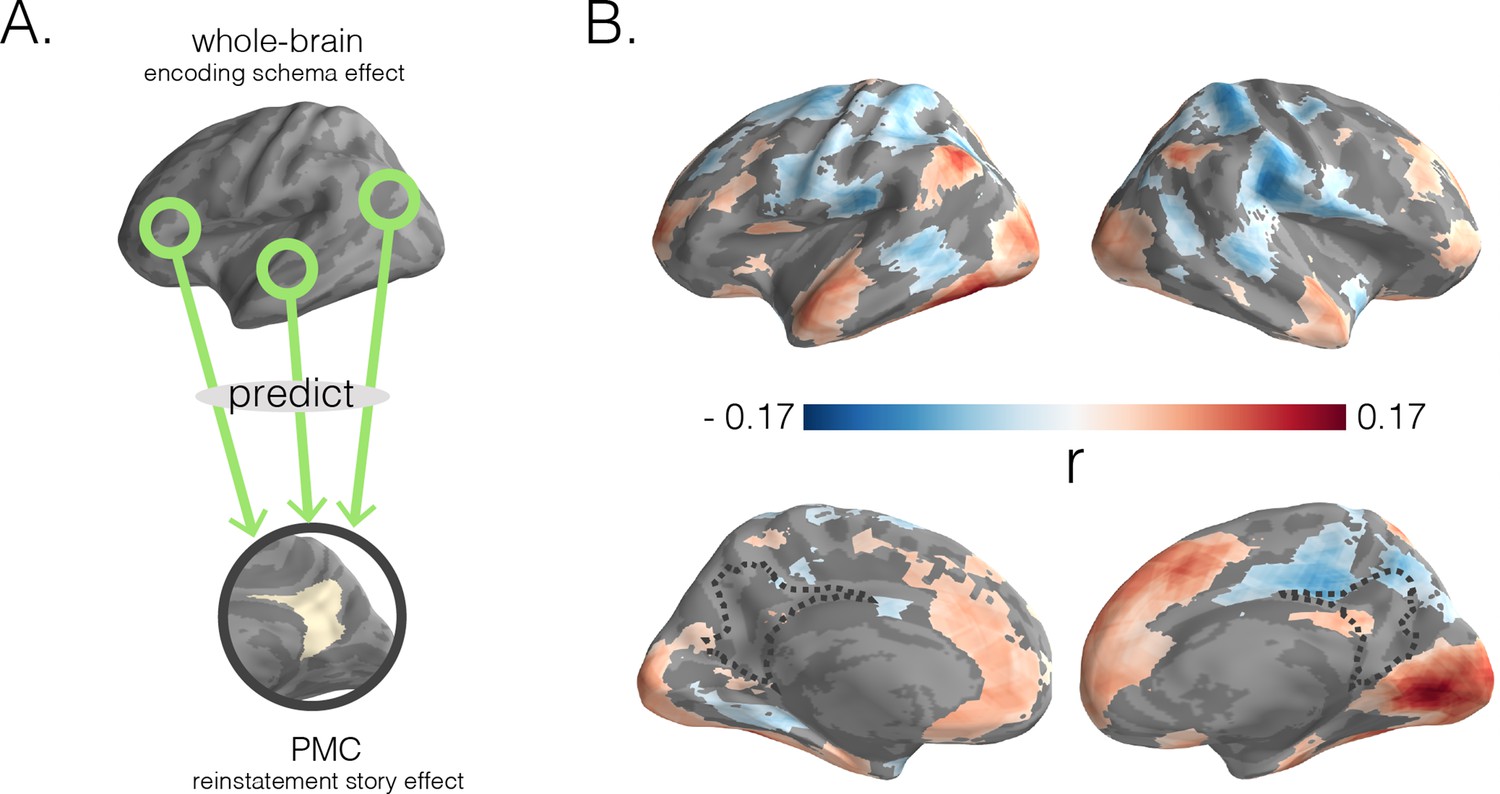
Predicting posterior medial cortex (PMC) reinstatement story scores with encoding schema scores across cortex.
(A) In a searchlight analysis, we used encoding schema scores across the brain to predict reinstatement story scores in PMC. (B) Dark blue to dark red gradients represent negative to positive strength of associations between encoding schema scores (for the colored region) and PMC reinstatement story scores. Surface maps were statistically thresholded by comparing model performance on held-out data to a null distribution and then FDR-correcting for q < 0.05.
Figure 3—figure supplement 2
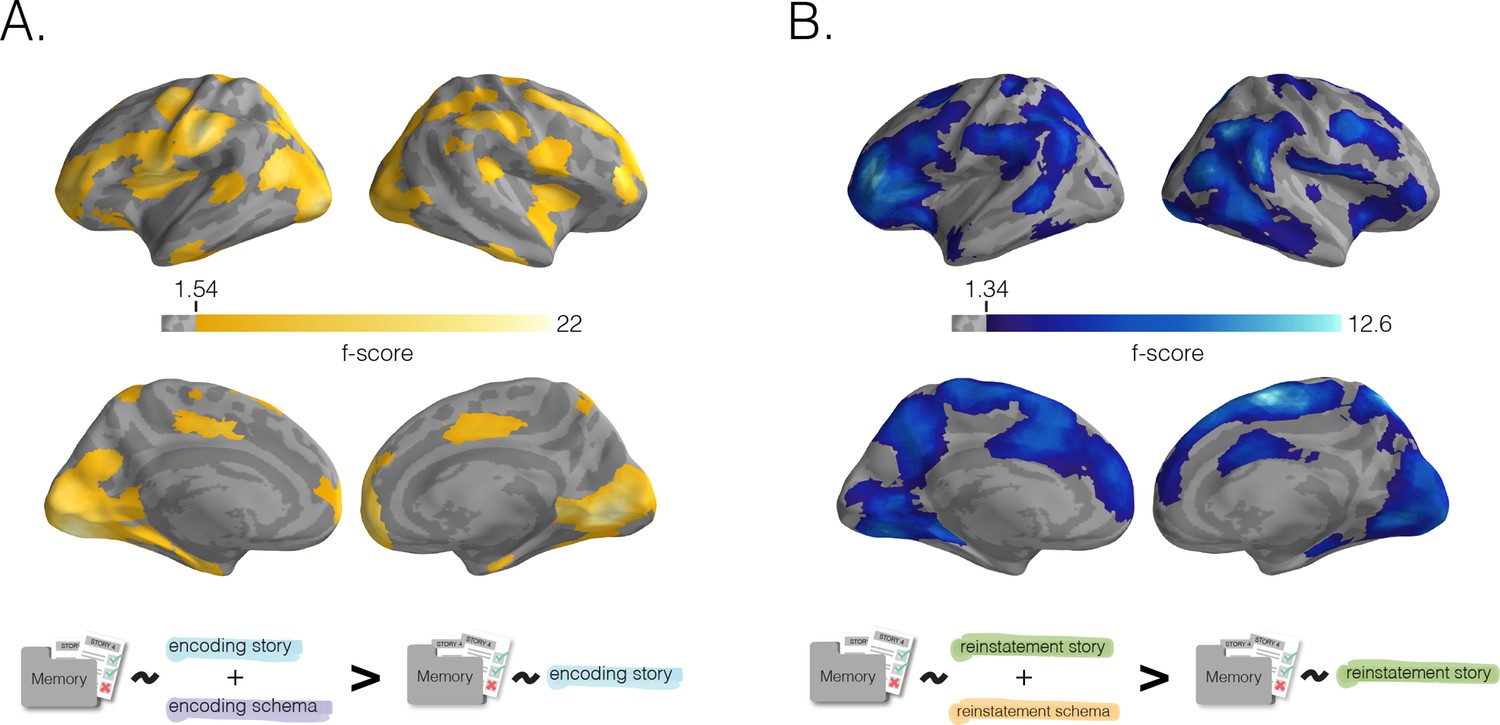
Benefit of schema representation for detail memory.
Neural schema scores improve prediction of recall for story-specific details, beyond what can be predicted based on neural story scores alone. In a searchlight analysis, we determined the added benefit (for later story-specific memory) of having schema information during encoding (A) or recall (B) through a nested model comparison analysis (see Materials and methods). (A) Added benefit of schema scores at encoding. Regions where encoding schema scores provided an added predictive benefit (over encoding story scores alone) largely overlapped with the regions shown in Figure 3B. (B) Benefit of schema scores to memory at recall. Similarly, regions where reinstatement schema scores provided an added predictive benefit (over reinstatement story scores alone) largely overlapped with the regions shown in Figure 3D. Surface maps were statistically thresholded by model comparison results against a null distribution and then FDR-corrected for q < 0.01.
Figure 3—figure supplement 3

Predicting behavioral memory for story details with neural measures from encoding and recall within-subjects.
For comparison purposes, we reran our analyses as visualized in Figure 3 using a within-subjects approach. (A) The relationship between encoding story scores and behavior cannot be calculated within-subjects (see Materials and methods). (B) Predicting memory scores using encoding schema scores within-subjects. Strong negative schema effects were found in right postcentral and subcentral gyrus as well as right superior parietal lobule (SPL) and a portion of right angular gyrus (AG). Positive encoding schema effects were found in right precuneus, bilateral anterior temporal pole, left entorhinal cortex, and left prostriata. (C) Predicting memory scores using reinstatement story scores within-subjects. Searchlight analyses revealed effects throughout cortex including strong effects in parietal, posterior medial, and medial prefrontal regions. All a priori cortical and subcortical ROIs showed a reinstatement story effect except parahippocampal cortex (PHC), anterior, and full hippocampus. (D) Predicting memory scores using reinstatement schema scores within-subjects. Strong effects were found in regions including bilateral parietal cortex, superior frontal gyrus (SFG), right frontal gyrus, right dorsal medial prefrontal cortex (mPFC), and bilateral visual cortex. All surface maps were statistically thresholded by comparing model performance on held-out data to a null distribution and then FDR-correcting for q < 0.05. Surface maps are colored based on the correlation values between neural scores and behavioral memory performance. All violin plots show values describing model performance z-scored relative to the null distribution. Starred points indicate significant differences after Bonferroni correction for multiple comparisons. Point colors indicate directionality of prediction with red and blue for positive and negative associations, respectively.
Figure 3—figure supplement 4

Predicting behavioral memory for story details with across-modality neural schema measures from encoding and recall.
We predicted behavioral memory performance on held-out subjects based on each of our two across-modality schema scores (from Figure 2—figure supplement 2), across the neocortex and in specific ROIs. (A) Predicting memory scores using across-modality encoding schema scores. Searchlight results revealed strong effects in parahippocampal gyrus, right parietal cortex, left precuneus, right frontal cortex, left medial prefrontal cortex (mPFC), and right anterior mPFC, as well as across bilateral temporal sulcus. (B) Predicting memory scores using across-modality reinstatement schema scores. Searchlight results revealed strong effects in left medial and lateral superior frontal gyrus (SFG), as well as negative effects in bilateral posterior medial regions including right precuneus. A strong positive reinstatement schema effect on memory was found in anterior hippocampus. Surface maps are colored based on the correlation values between neural scores and behavioral memory performance. All violin plots show values describing model performance z-scored relative to the null distribution. Starred points indicate significant differences after Bonferroni correction for multiple comparisons. Point colors indicate directionality of prediction with red and blue for positive and negative associations, respectively.
Figure 4
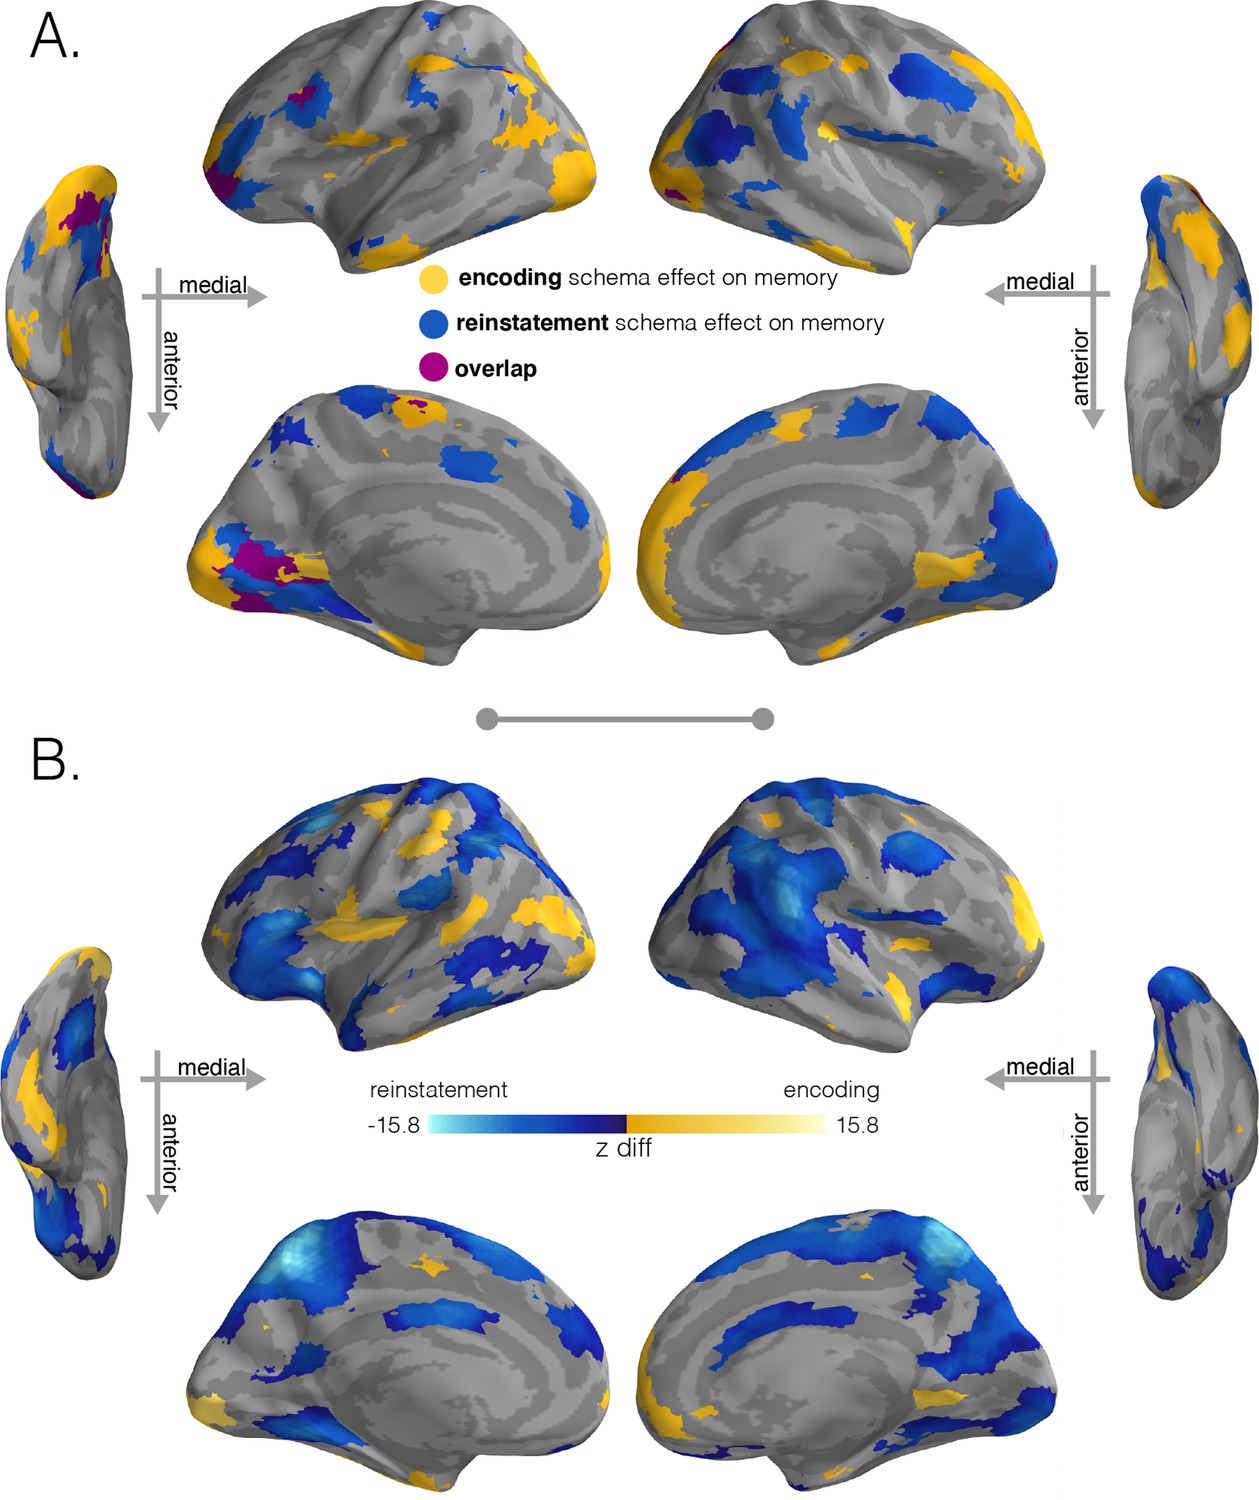
Regions with significant schema effects and positive associations with subsequent memory.
(A) To combine the schema and regression effect at encoding, we intersected the regions showing a positive encoding schema effect (Figure 2B, q < 0.001) with the regions showing a positive relationship between the encoding schema effect and memory behavior (Figure 3B, q < 0.05); intersection shown in yellow. To combine the schema and regression effect at recall, we intersected the regions showing a positive reinstatement schema effect (Figure 2D, q < 0.001) with the regions showing a positive relationship between the reinstatement schema effect and memory behavior (Figure 3D, q < 0.05); intersection shown in light blue. Regions in purple indicate overlap between encoding and retrieval schema networks. (B) Model coefficient comparisons between schema effects on subsequent memory at encoding and recall. To further explore the regional specialization identified in (A), we ran a direct comparison between the model coefficients that predicted behavior (encoding schema coefficients - reinstatement schema coefficients). Stronger relationships between encoding schema scores and behavioral memory performance are shown in yellow, while stronger relationships between reinstatement schema scores and behavioral memory performance are shown in blue. Surface maps in (B) are colored based on the z-scored difference values (encoding – reinstatement) relative to a null distribution of differences. Significance was determined through nonparametric testing against a null distribution of differences after which p-values were converted to q-values with AFNI’s FDR correction (q < 0.05).
Figure 5
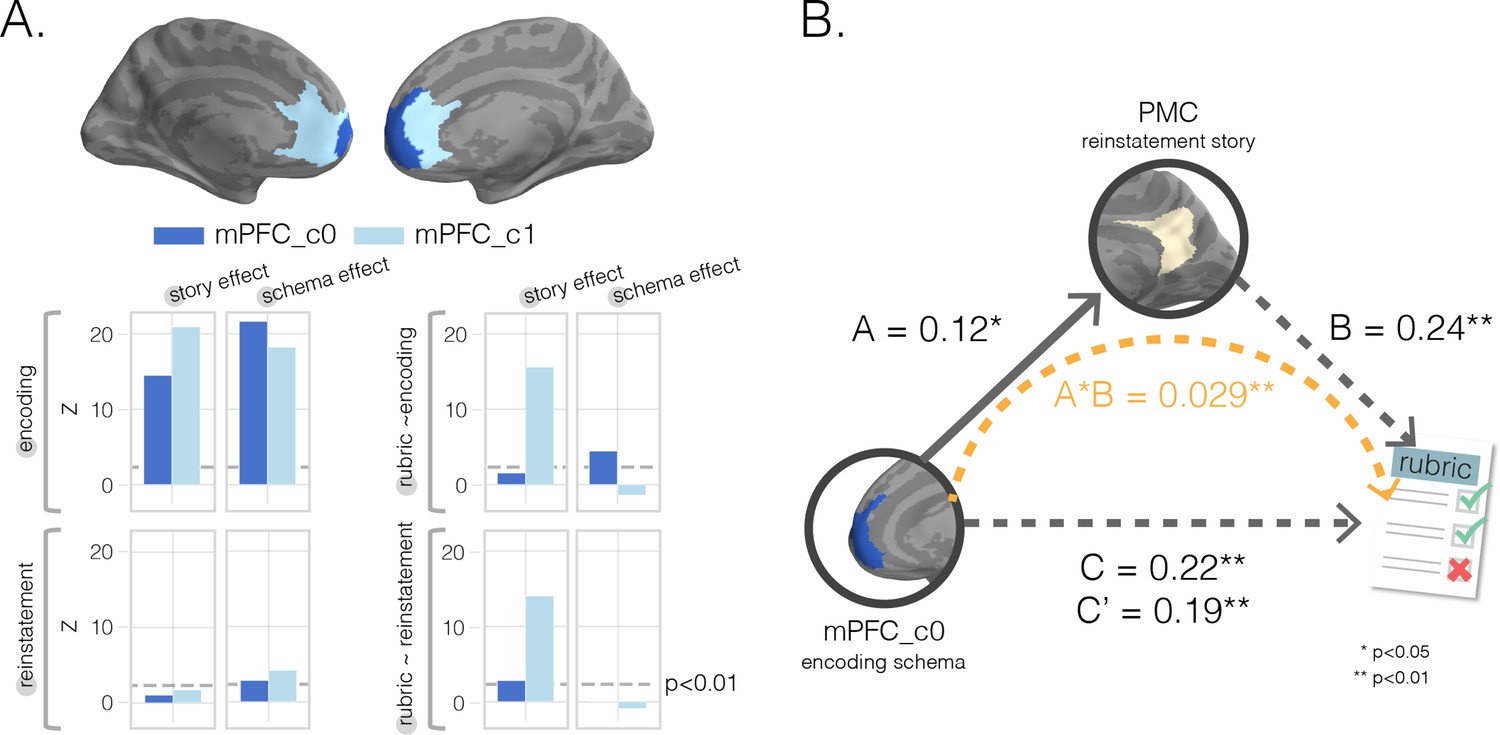
Mediation analysis with medial prefrontal cortex (mPFC) subclusters.
(A) k-Means clustering results. We performed post-hoc k-means (k = 2) clustering within a bilateral mPFC ROI to identify subregions showing different profiles of results across our eight searchlight analyses; that is, each searchlight was assigned an eight-dimensional vector reflecting the scores assigned to that region in the eight searchlight analyses, and clustering was done on these eight-dimensional vectors (Figures 2 and 3) as features. Resulting (post-hoc) cluster effects are pictured in dark and light blue colors for anterior and posterior clusters, respectively. Consistent with our searchlight results, we find that encoding schema scores in voxels in the anterior cluster (c0) were associated with increased memory performance (top-right graph). (B) Mediation analysis. To determine whether posterior medial cortex (PMC) story information at recall mediated mPFC’s impact on memory accuracy, we ran a single-mediator model with mPFC_c0’s encoding schema score as the causal variable, PMC’s reinstatement story score as the mediator, and rubric-derived memory scores as our outcome variable. We found that PMC reinstatement story scores were a significant partial mediator.
Additional files
Download links
A two-part list of links to download the article, or parts of the article, in various formats.
Downloads (link to download the article as PDF)
Open citations (links to open the citations from this article in various online reference manager services)
Cite this article (links to download the citations from this article in formats compatible with various reference manager tools)
Schema representations in distinct brain networks support narrative memory during encoding and retrieval
eLife 11:e70445.
https://doi.org/10.7554/eLife.70445


