New fossils of Australopithecus sediba reveal a nearly complete lower back
- Center for the Study of Human Origins, Department of Anthropology, New York University, United States
- New York Consortium in Evolutionary Primatology, United States
- Centre for the Exploration of the Deep Human Journey, University of the Witwatersrand, South Africa
- Evolutionary Studies Institute, University of the Witwatersrand, South Africa
- Department of Anthropology, Texas A&M University, United States
- Department of Anthropology, Chaffey College, United States
- Western University of Health Sciences, College of Osteopathic Medicine of the Pacific, Department of Medical Anatomical Sciences, United States
- Department of Chiropractic, Faculty of Health Sciences, University of Johannesburg, South Africa
- Centro Nacional de Investigación sobre la Evolución Humana (CENIEH), Spain
- Departamento de Biodiversidad, Ecología y Evolución, Universidad Complutense de Madrid (UCM), Spain
- Department of Anthropology, Stony Brook University, United States
- Department of Anatomy, College of Osteopathic Medicine, New York Institute of Technology, United States
- Department of Anthropology, Bryn Mawr College, United States
- Research Centre in Evolutionary Anthropology and Palaeoecology, Liverpool John Moores University, United Kingdom
- Department of Human Anatomy and Physiology, Faculty of Health Sciences, University of Johannesburg, South Africa
- Departamento de Paleobiología, Museo Nacional de Ciencias Naturales (CSIC), Spain
- Anthropological Institute and Museum, University of Zurich, Switzerland
- Department of Evolutionary Anthropology, Duke University, United States
Figures
Figure 1
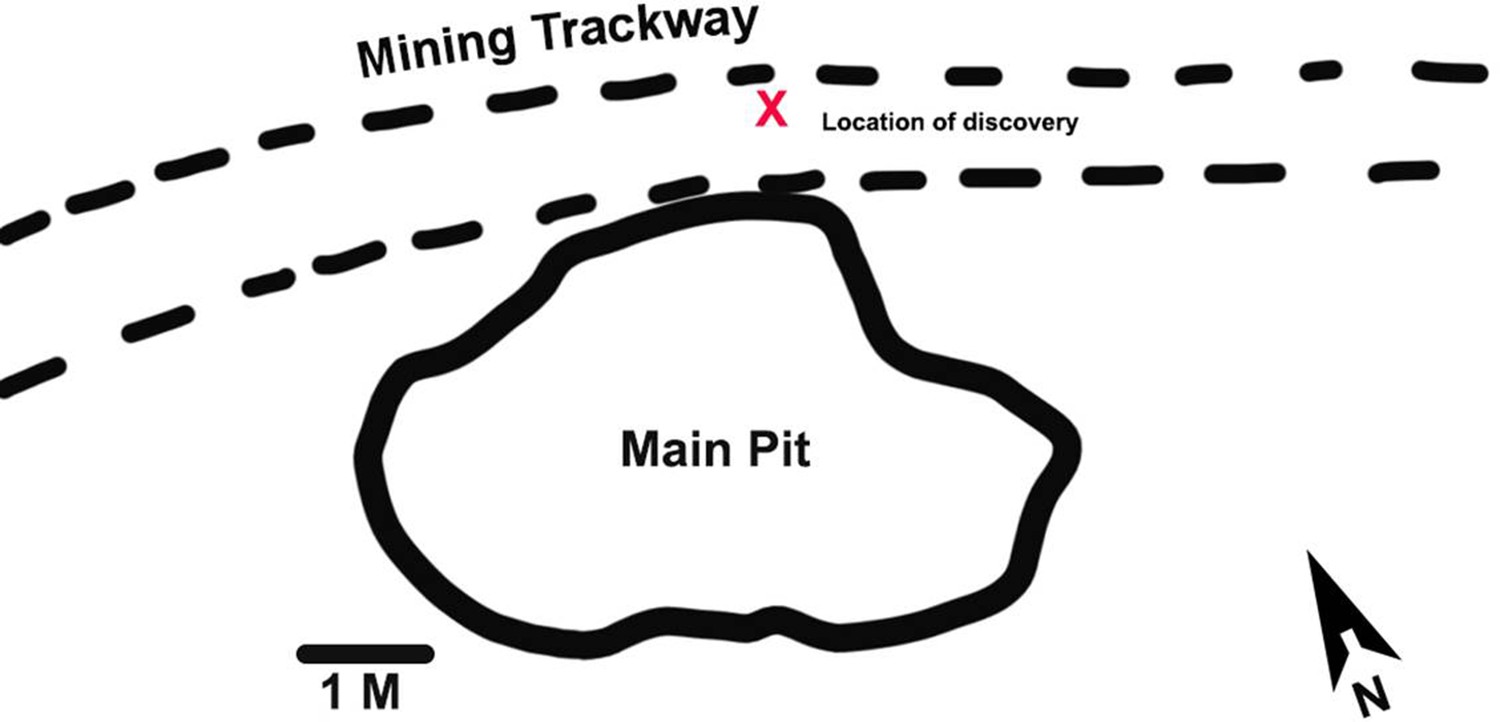
Malapa site map showing the location of the new discoveries.
The new fossils were discovered during excavations of an early 20th century mining road north of the main pit at Malapa. The location of the block containing the new fossils in the mining trackway is shown with a red X.
Figure 2 with 1 supplement

New lumbar vertebrae of Malapa Hominin 2 (MH2).
Vertebrae in (A) superior, (B) inferior, (C) ventral, (D) dorsal, (E) left lateral, and (F) right lateral views. The partial inferior articular facets of the first lumbar vertebra are embedded in matrix (see Figure 2—figure supplement 1). The second lumbar vertebra (U.W.88–232) is in the superior-most (top) position, the third lumbar vertebra (U.W.88–233) is in the middle, and portions of the upper neural arch of the fourth lumbar vertebra (U.W.88–234) are in the inferior-most (bottom) position. These fossils are curated and available for study at the University of the Witwatersrand.
Figure 2—figure supplement 1
Surface renderings of lower thoracic and lumbar vertebrae generated from micro-CT scans.
Two matrix blocks were micro-CT scanned: a lower thoracic block containing the antepenultimate (T10; U.W.88–114), penultimate (T11; U.W.88–43), last thoracic vertebra (T12; U.W.88–44), and vertebral body fragment of the first lumbar vertebra (L1; U.W.88–280), and the new lumbar block, containing the partial inferior articular facets of L1 (U.W.88–281), second lumbar vertebra (L2; U.W.88–232), third lumbar vertebra (L3; U.W.88–233), and portions of the upper neural arch of the fourth lumbar vertebra (L4; U.W.88–234). High-quality surface models of these vertebrae can be downloaded on MorphoSource.org.
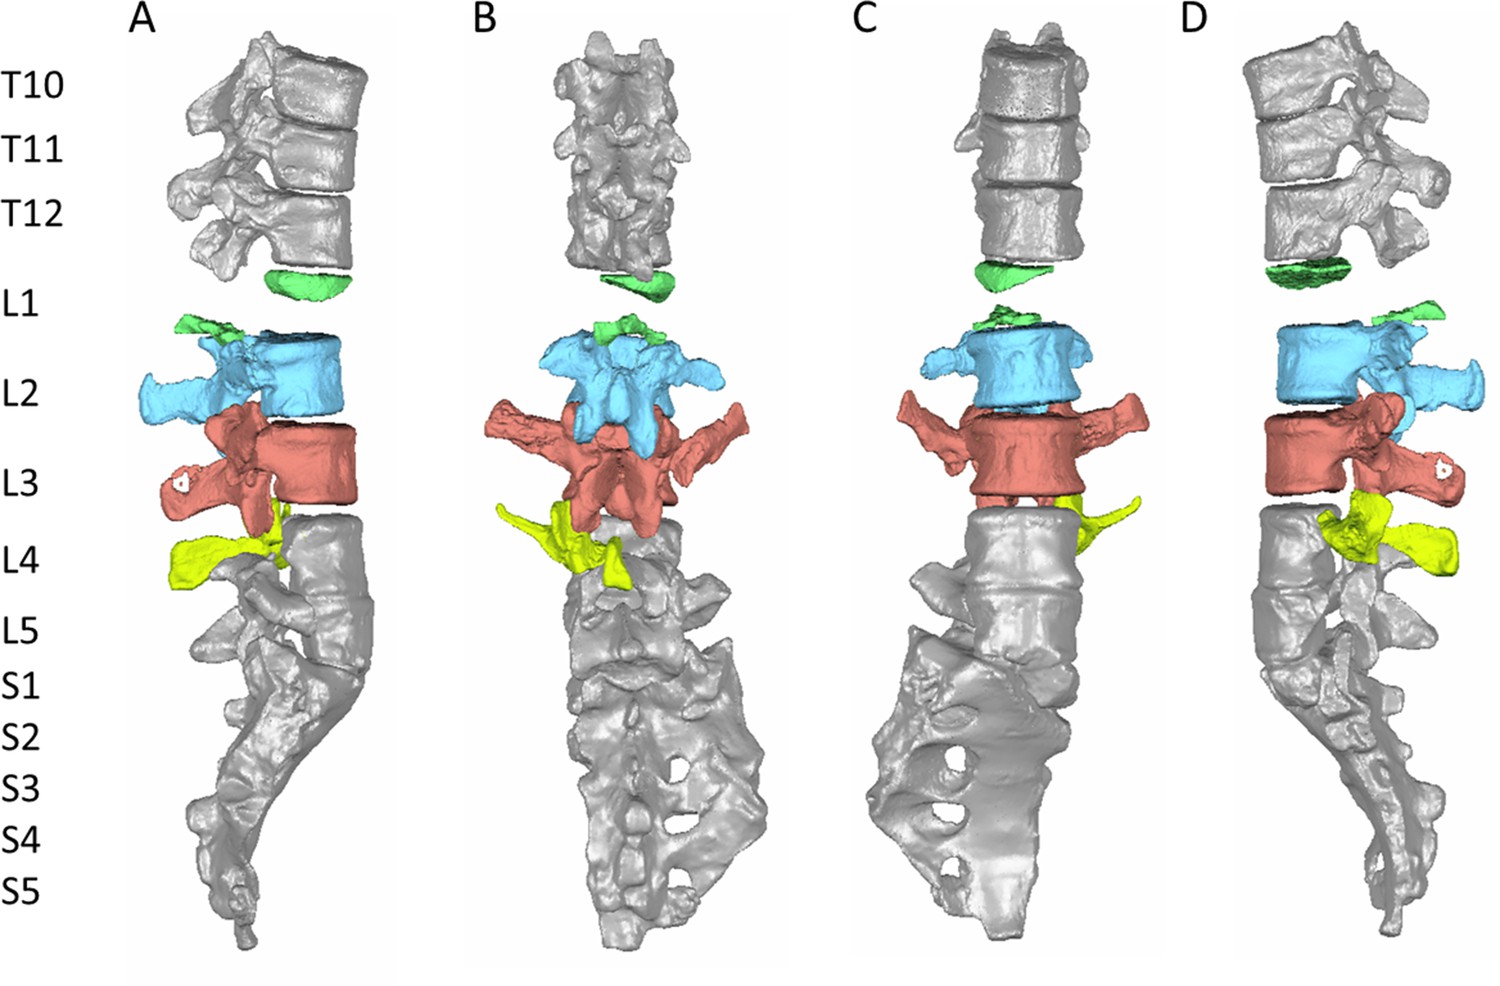
Figure 3 with 1 supplement

The lower back of Malapa Hominin 2 in ventral (left) and dorsal (right) views.
New second and third lumbar vertebrae (U.W.88–232, U.W.88–233) are positioned at the top, and U.W.88–234 contributes to the upper portion of the fourth lumbar vertebra (U.W.88–127/153/234). The fifth lumbar vertebra (U.W.88–126/138) sits atop the sacrum (U.W.88–137/125). The lower back elements are preserved together in four blocks, each containing multiple elements held together in matrix and/or in partial articulation: (1) The vertebral body fragment of L1 (U.W.88–280) is preserved within the matrix of a block containing the lower thoracic vertebrae (U.W.88–43/114 and U.W.88–44) (Figure 2—figure supplement 1, Figure 3—figure supplement 1); (2) L1 inferior neural arch (U.W.88–281; concealed in matrix), L2 (U.W.88–232), L3 (U.W.88–233), and upper neural arch of L4 (U.W.88–234); (3) the L4 (U.W.88–127) and L5 (U.W.88–126) vertebral bodies, and partial S1 body (U.W.88–125); (4) most of the sacrum (U.W.88–137), the neural arch of L5 (U.W.88–153), the inferior portion of the neural arch of L4 (U.W.88–138).
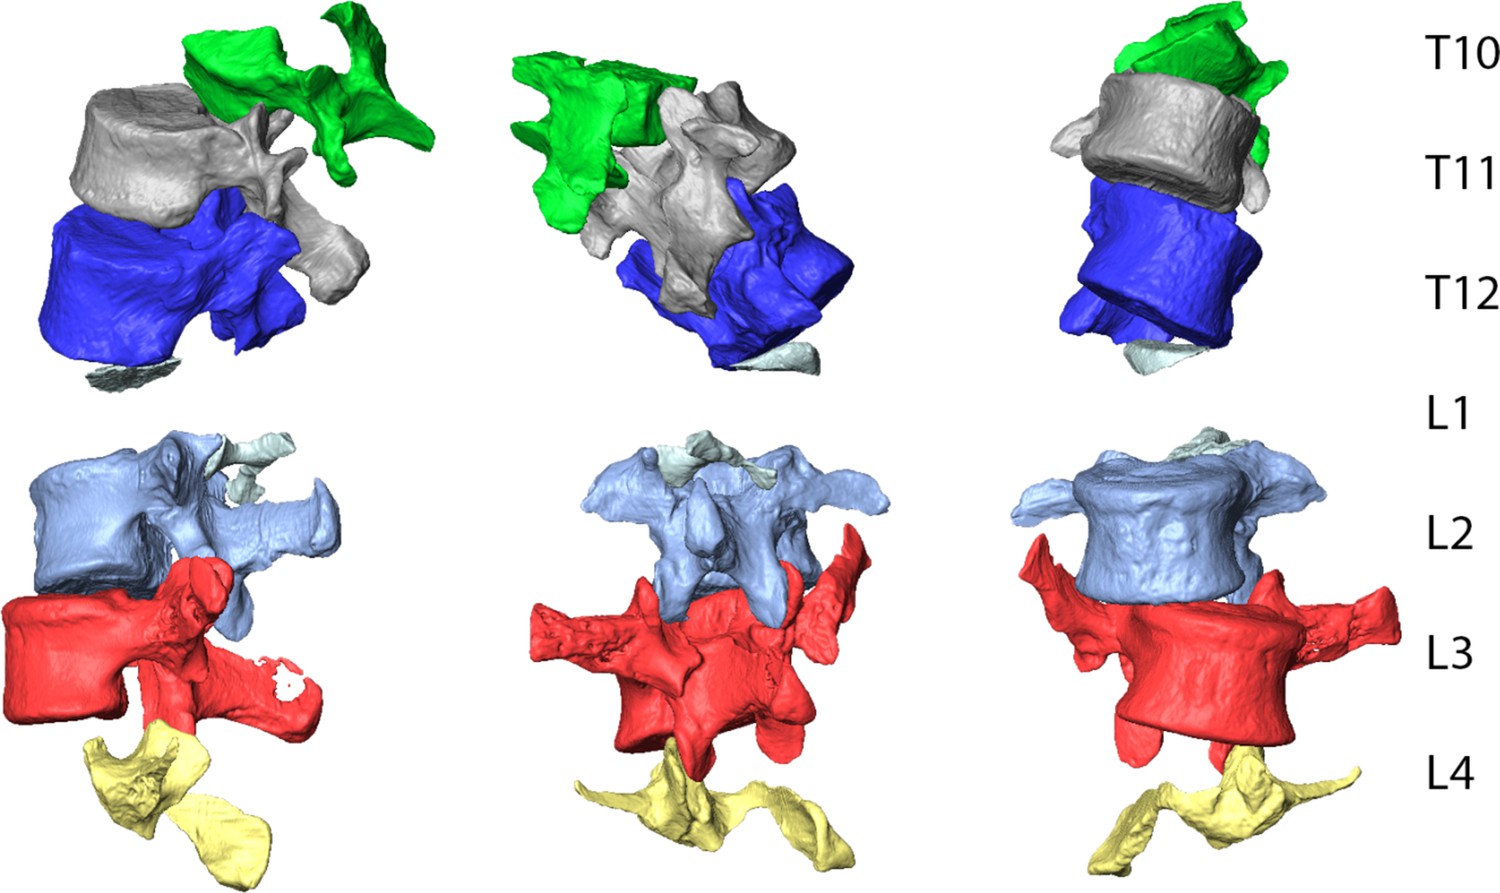
Figure 3—figure supplement 1
Surface renderings of the new lumbar vertebrae positioned between previously known vertebrae.
Components of the L1 vertebra (U.W.88–280/281) are shown in green, the L2 (U.W.88–232) is shown in blue, the L3 (U.W.88–233) is shown in red, and the new component of L4 (U.W.88–234) is shown in yellow. The previously known aspects of L4 (U.W.88–127/153), the L5 (U.W.88–126/138), sacrum (U.W.88–137/125), and lower thoracic vertebrae (T10–T12) are fully published in Williams et al., 2018b. Fossils are shown in their original condition and refitted at contact points but not reconstructed. Three-dimensional models of all these vertebrae can be downloaded on MorphoSource.org.
Figure 4 with 1 supplement
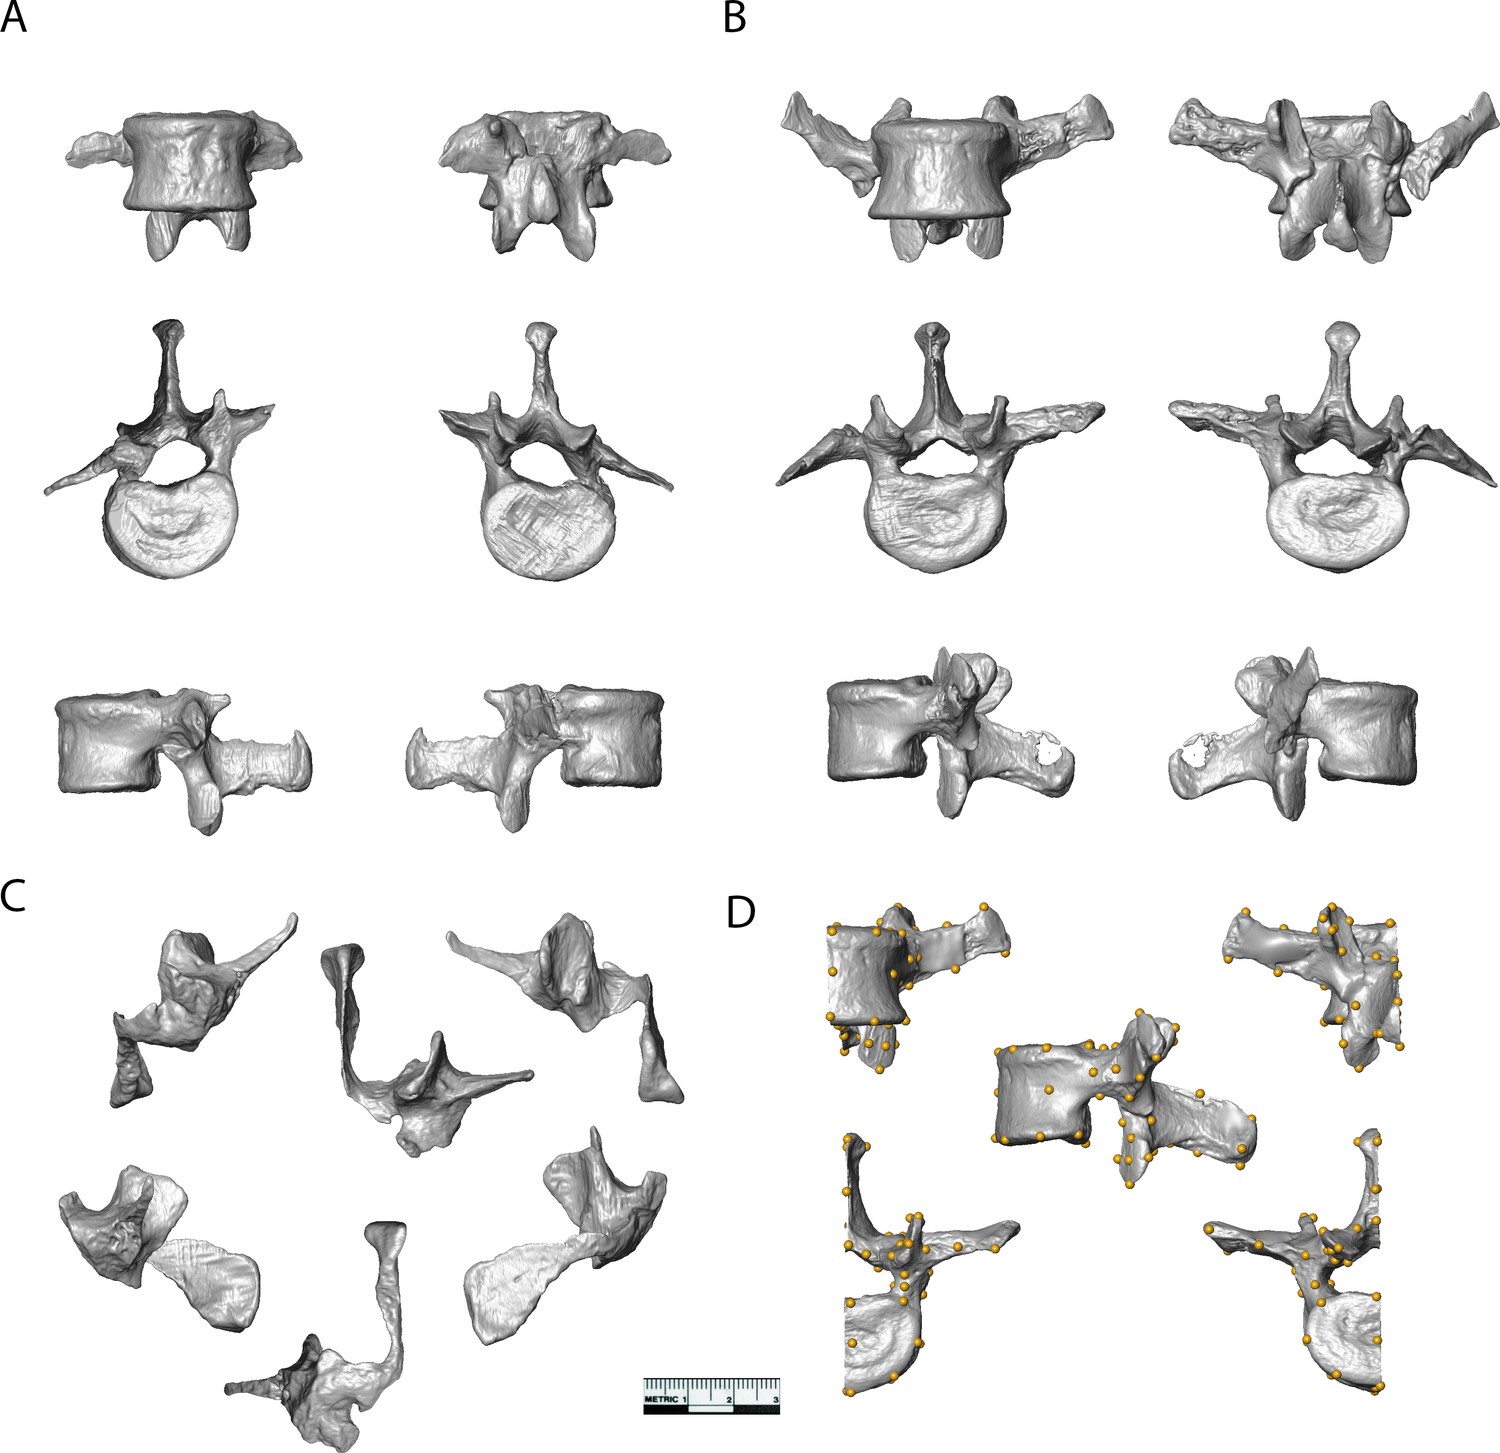
Surface models of vertebrae from the new lumbar block.
(A) U.W.88–232 (L2) and (B) U.W.88–233 (L3) shown in ventral (top left), dorsal (top right), superior (middle left), inferior (middle right), left lateral (bottom left), and right lateral (bottom right) views. (C) U.W.88–234 (L4) in ventral (top left), dorsal (top right), superior (top middle), left lateral (bottom left), right lateral (bottom right), and inferior (bottom middle) views. (D) Left half of U.W.88–233 showing the 48 landmarks used in the three-dimensional geometric morphometric (3D GM) analyses.
Figure 4—figure supplement 1
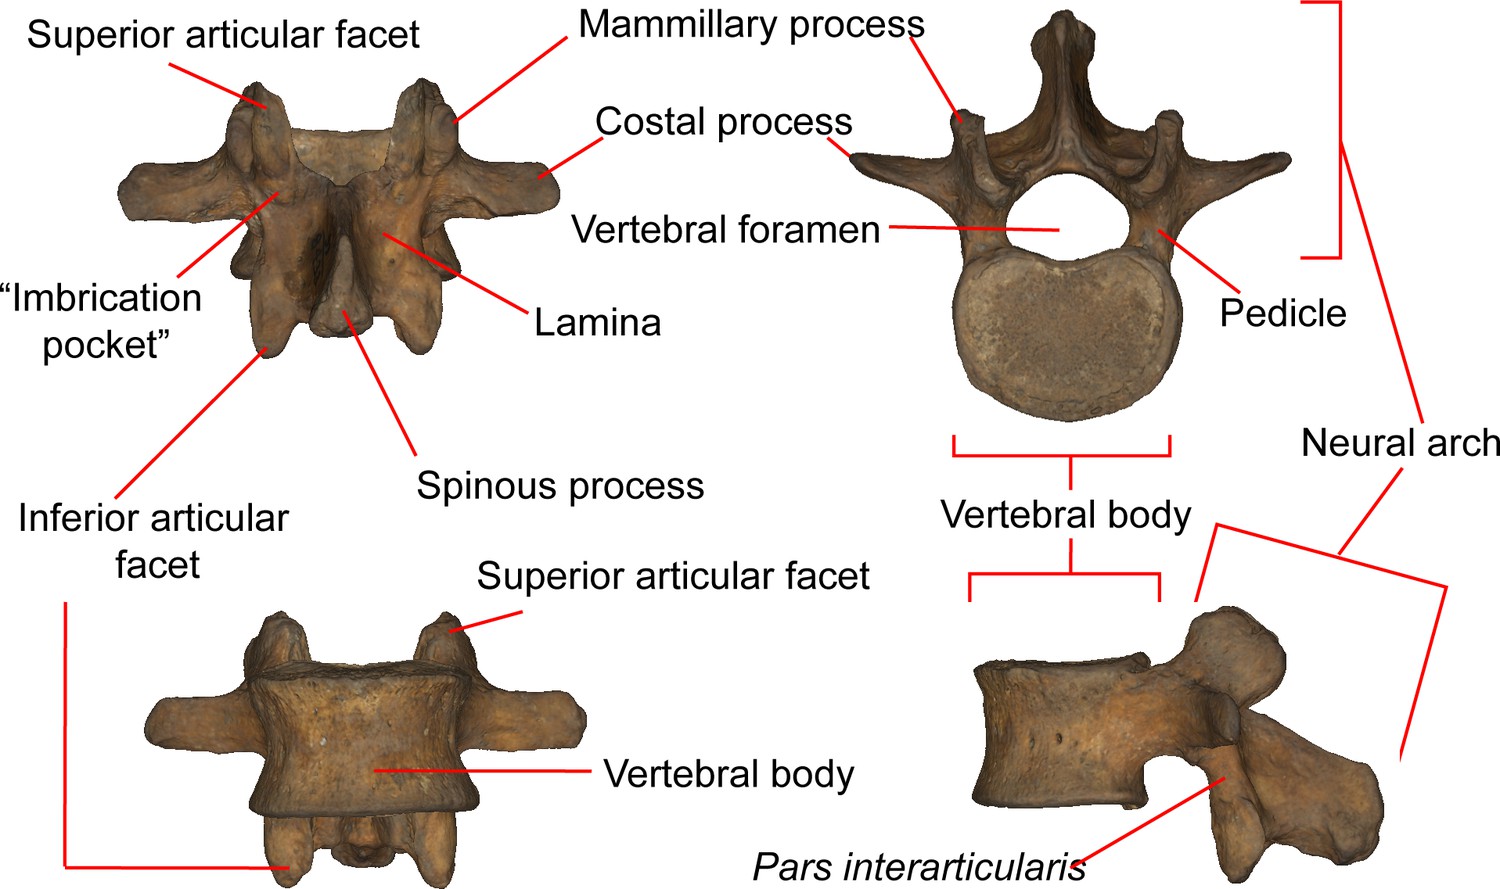
Anatomical features of lumbar vertebrae.
A human middle lumbar vertebra (L3) is shown in dorsal (upper left), cranial (upper right), ventral (lower left), and left lateral (lower right) views.
Figure 5 with 2 supplements
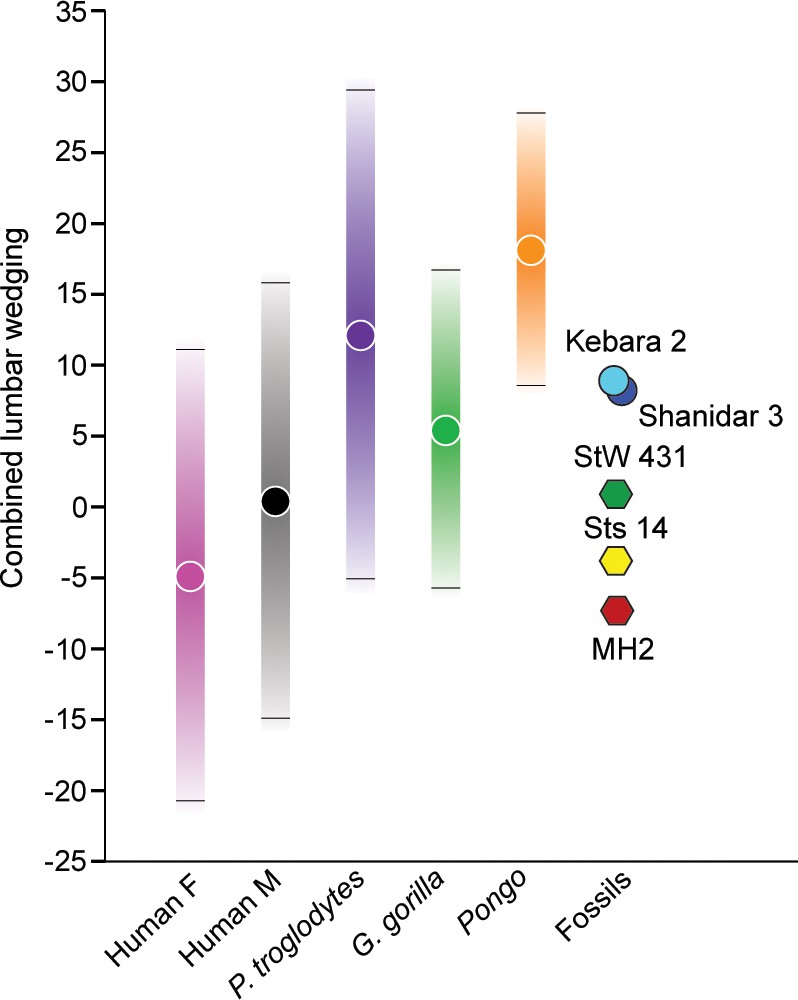
Combined L2-L5 vertebral body wedging angles.
Lumbar vertebral body wedging angles are summed from levels L2 through L5. Only fossil specimens preserving the last four lumbar vertebrae are included (Australopithecus africanus: Sts 14, StW 431; Australopithecus sediba: MH2; Neandertals: Kebara 2, Shanidar 3). For the extant taxa, 95% prediction intervals are shown with bars. Table 2 includes summary statistics, Table 3 fossil hominin data, and Figure 5—source data 1 provides the raw data.
-
Figure 5—source data 1
Lumbar wedging angles and combined wedging angles values of extant taxa (Excel file).
- https://cdn.elifesciences.org/articles/70447/elife-70447-fig5-data1-v1.xlsx
Figure 5—figure supplement 1
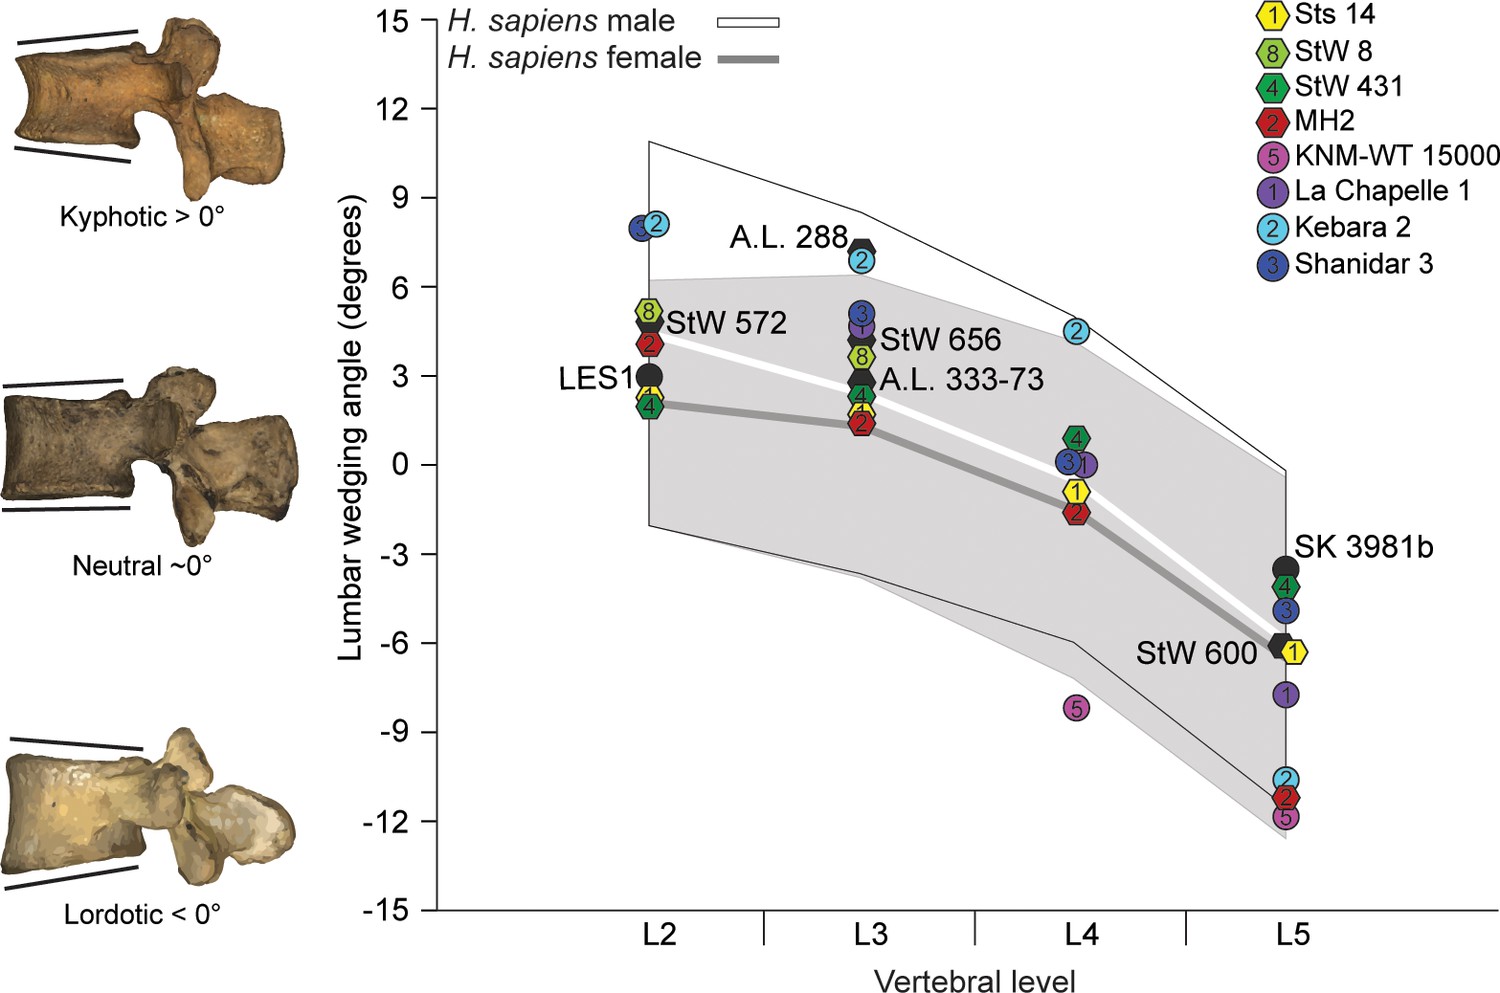
Lumbar vertebral body wedging angles in fossil hominins and modern humans.
Fossil individuals represented by one vertebra are shown in black symbols (Australopithecus = hexagons; Paranthropus/fossil Homo = circles) and labeled directly in the plot: Australopithecus afarensis: A.L. 288–1, A.L. 333–73; Australopithecus africanus: StW 8, StW 572, StW 656, StW 600 (Pickering et al., 2019); Paranthropus robustus: SK 3981b; Homo naledi: LES1 (Hawks et al., 2017), whereas those known from multiple vertebrae lending themselves to measurement are listed in the legend; 95% prediction intervals of the means of male (white) and female (gray) are shown. See Table 2 for summary statistics and Figure 5—source data 1 for the raw data.
Figure 5—figure supplement 2
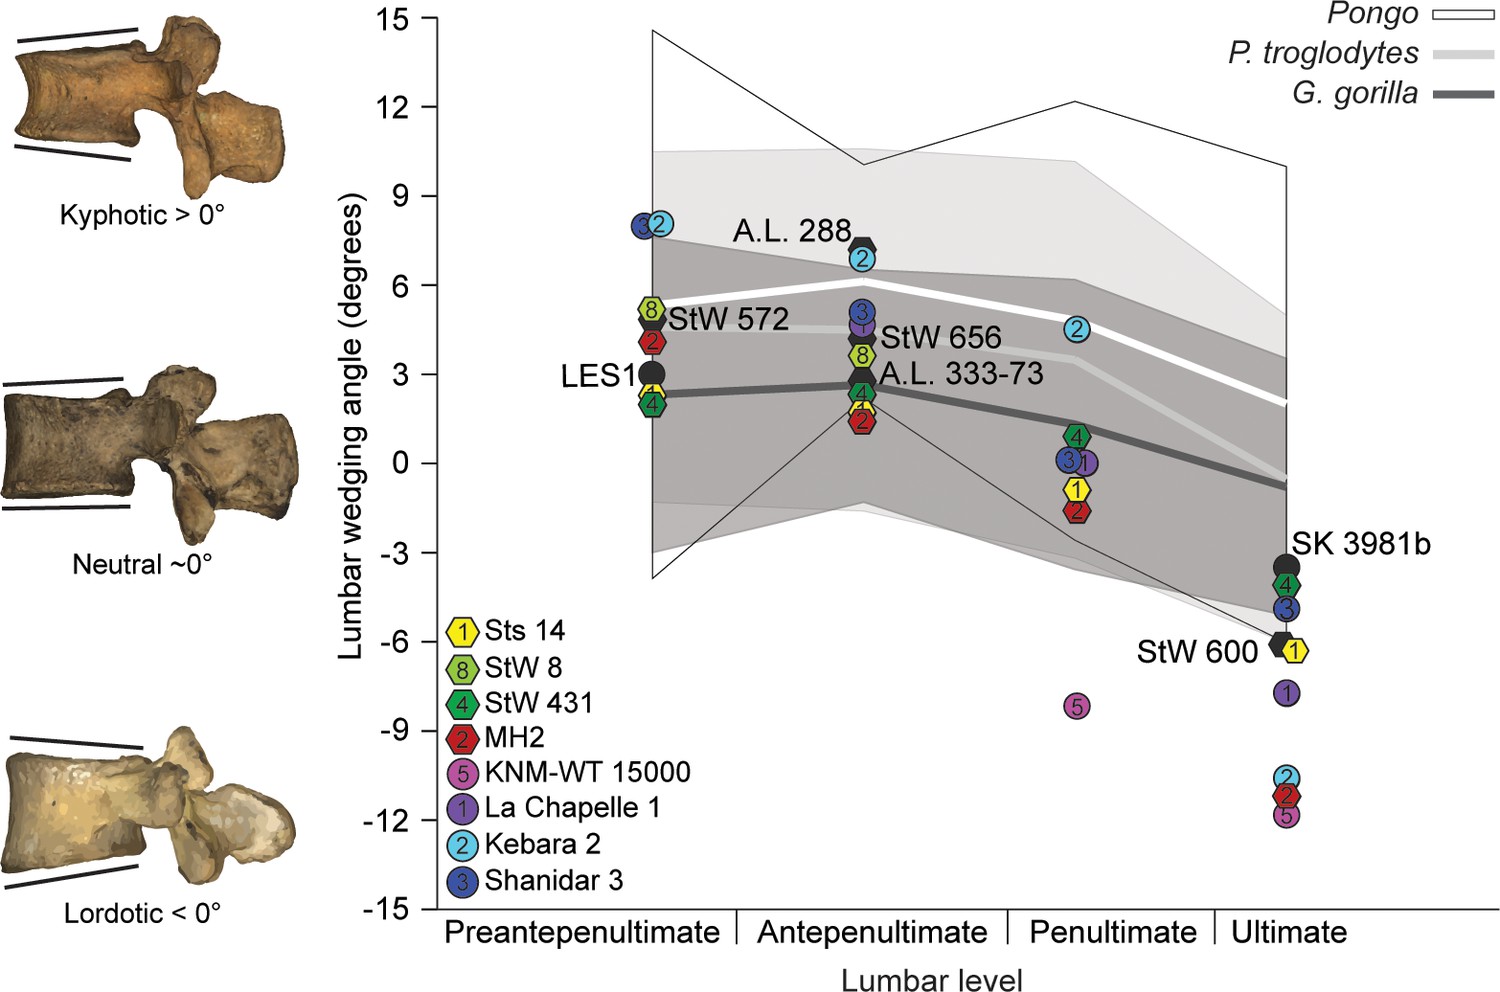
Lumbar vertebral body wedging angles in fossil hominins and extant great apes.
Fossil individuals represented by one vertebra are shown in black symbols (Australopithecus = hexagons; Paranthropus/fossil Homo = circles) and labeled directly in the plot: Australopithecus afarensis: A.L. 288–1, A.L. 333–73; Australopithecus africanus: StW 8, StW 572, StW 656, StW 600 (Pickering et al., 2019); Paranthropus robustus: SK 3981b; Homo naledi: LES1 (Hawks et al., 2017), whereas those known from multiple vertebrae lending themselves to measurement are listed in the legend. Because the great apes included possess just four lumbar vertebrae, and hominins possess five, the lumbar levels are labeled relative to the last (ultimate) lumbar vertebra (L4 in great apes, L5 in hominins). Therefore, the preantepenultimate vertebra is L1 in great apes and L2 in hominins; 95% prediction intervals of the means of orangutans (white), chimpanzees (light gray), and gorillas (dark gray) are shown. See Table 2 for summary statistics and Figure 5—source data 1 for the raw data.
Figure 6

Pyramidal configuration of articular facet spacing in hominids.
The inter-articular facets of the last lumbar/sacrum and those of lumbar vertebrae three elements higher in the column (L1-L2 in chimpanzees and gorillas with four lumbar vertebrae; L2-L3 in hominins) are included as the numerator and denominator, respectively, in a lumbar inter-articular facet index. These levels are highlighted on the left in red in both a human (top) and a chimpanzee (bottom). The gray box highlights the range of variation observed in the modern human sample. All great apes are significantly different from modern humans (<0.001). The ratio data for inter-articular facet spacing can be found in Figure 6—source data 1.
-
Figure 6—source data 1
Inter-articular facet ratios of fossil hominins and extant taxa (Excel file).
- https://cdn.elifesciences.org/articles/70447/elife-70447-fig6-data1-v1.xlsx
Figure 7 with 3 supplements

Principal components analysis (PCA) on middle lumbar vertebra three-dimensional (3D) landmark data.
(A–C) PCA on the full set of 48 landmarks, including Sts 14 (Australopithecus africanus), U.W.88–233 (Australopithecus sediba), and Shanidar 3 (Neandertal). (A–B) Hominins separate from great apes on PC1 (wireframes in lateral view), African apes and hominins separate from orangutans on PC2 (wireframes in lateral view), and (C) Australopithecus species separate from other hominids on PC4 (wireframes in posterior view). Note that spinous and costal process lengths and orientations drive much of the variance in middle lumbar vertebrae. (D) PCA on a reduced landmark set (excluding spinous and costal process landmarks) to include A.L. 288–1 (Australopithecus afarensis), StW 431 (A. africanus), and Kebara 2 (Neandertal). Notice that Australopithecus specimens fall outside the modern human convex hulls, with Sts 14 and MH2 close to those of the African apes. 3D landmark data were subjected to Procrustes transformation.
Figure 7—figure supplement 1
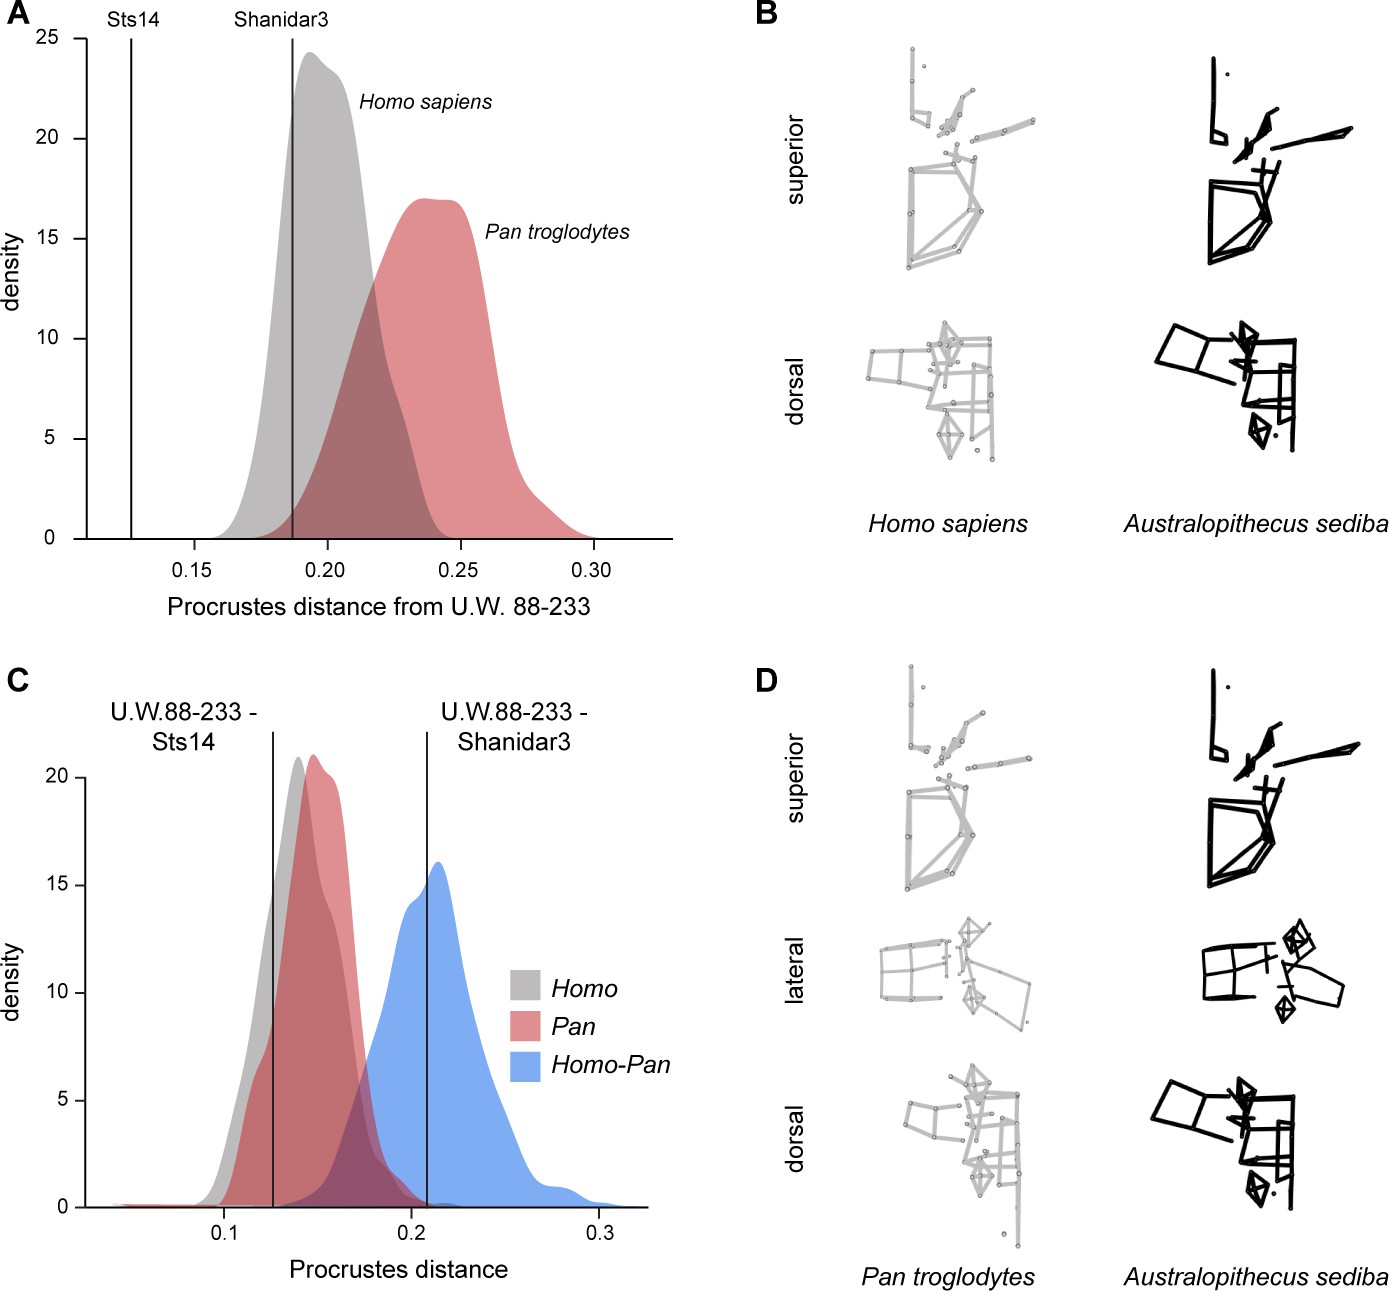
Procrustes distances and mean differences from U.W.88–233.
(A) Procrustes distances between U.W.88–233 and extant and fossil middle lumbar vertebrae. Sts14 is closest to U.W.88–233 in overall Procrustes distance. (B) Average modern human middle lumbar morphology compared to U.W.88–233. (C) Procrustes distances within (Homo, Pan) and between (Pan and Homo) extant taxa and between U.W.88–233 and other fossil hominin middle lumbar vertebrae. (D) Average Pan middle lumbar vertebra morphology compared to U.W.88–233.
Figure 7—figure supplement 2
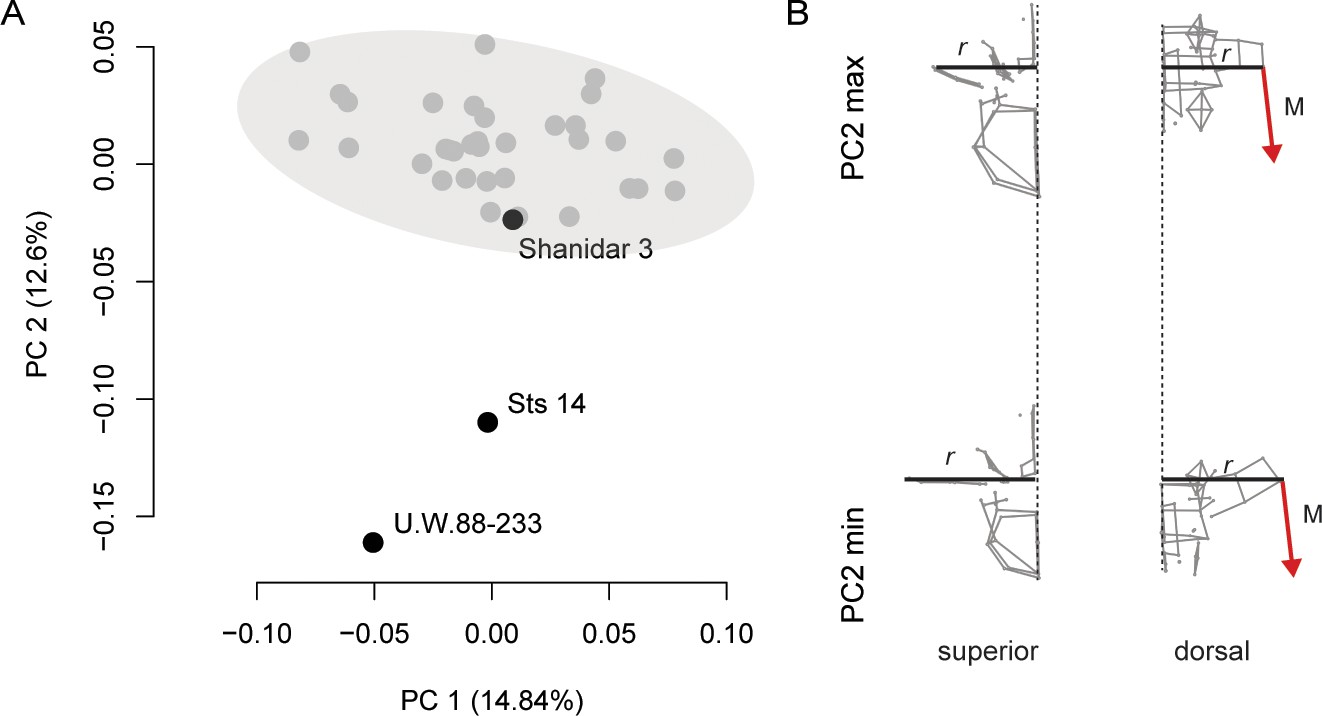
Middle lumbar morphology of Australopithecus sediba and other hominins.
(A) A hominin-only principal components analysis (PCA) demonstrates a similar position of MH2 (U.W.88–233) and Sts 14 middle lumbar vertebrae (L3) along PC2 as PC4 in the larger comparative dataset (Figure 7). A 95% confidence ellipse of the modern human data encompasses the Neandertal Shandiar 3 but not MH2 and Sts 14. (B) Wireframes representing PC2 extremes in superior (left) and posterior (right) views. A hypothetical muscle force vector for psoas major and quadratus lumborum (M) whose length, magnitude, and orientation are unknown is depicted here for illustrative purposes only; and r represents a hypothetical moment arm of the muscle force vector. The elongated, and more cranially and ventrally oriented costal processes of U.W.88–233 and, to a slightly lesser extent, Sts 14 increase the length of the muscle force vector’s moment arm relative to modern humans (and Shanidar 3).
Figure 7—figure supplement 3
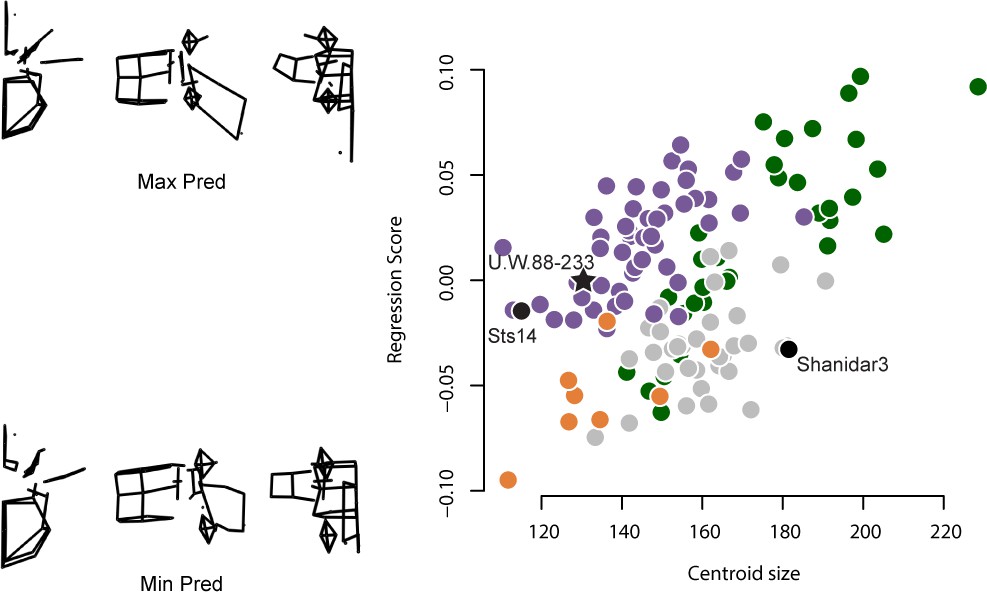
The effect of middle lumbar centroid size on shape.
Wireframes represent the maximum and minimum shape predictions derived from a multivariate regression of shape coordinates on centroid size. Larger centroid sizes are associated with longer, more projecting spinous and costal processes. The elongated and cranially oriented costal processes of U.W.88–233 (Australopithecus sediba) and Sts 14c (Australopithecus africanus) are not explained by centroid size. Homo = gray circles, Pan = purple circles, Gorilla = green circles, Pongo = orange circles.
Tables
Table 1
Measurements on lumbar vertebrae in mm for linear data and degrees for angles (measurement definitions are included in the supplementary material).
| U.W.88–232(L2) | U.W.88–233(L3) | U.W.88-127/ 153/234(L4) | U.W.88-126/138(L5) | |
|---|---|---|---|---|
| 1. Body sup. transv. width | 29.5 | 30.1 | 31.4 | 32.8 |
| 2. Body sup. dorsoven. dia. | 20.8 | 21.4 | 22.2 | 21.4 |
| 3. Body inf. transv. width | 29.0 | 31.4 | 32.4 | 28.8 |
| 4. Body inf. dorsoven. dia. | 21.1 | 21.0 | 21.2 | 19.8 |
| 5. Body ventral height | 21.0 | 21.75 | 22.1 | 21.0 |
| 6. Body dorsal height | 22.5 | 22.25 | 21.5 | 17.0 |
| 7. Body wedging angle (calculated) | 4.1° | 1.3° | –1.6° | –10.7° |
| 8. Vertebral foramen dorsoven. dia. | 10.5 | 8.85 | – | 23.0 |
| 9. Vertebral foramen transv. dia. | 17.6 | 17.3 | – | 16.3 |
| 10. Sup.-inf. inter-AF height | – | 37.0 | 32.6 | 31.5 |
| 11. Max. inter-SAF dist. | – | 24.0 | – | 28.5 |
| 12. Min. inter-SAF dist. | – | 14.5 | – | – |
| 13. Max. inter-IAF dist. | 23.0 | 25.0 | (28.0)* | (33.0) |
| 14. Min. inter-IAF dist. | 11.0 | 9.5 | 11.6 | 15.6 |
| 15. SAF sup.-inf. dia. | – | 12.8 | – | 13.4 |
| 16. SAF transv. dia. | – | 11.5 | – | 10.8 |
| 17. IAF sup.-inf. dia. | 11.5 | 11.5 | 14.7 | 14.4 |
| 18. IAF transv. dia. | 8.1 | 8.9 | 9.2 | 11.7 |
| 19. Spinous process angle | 176° | 160° | 163° | 166° |
| 20. Spinous process length | 27.0 | 28.0 | 28.0 | 23.6 |
| 21. Spinous process terminal trans. width | 6.9 | 7.4 | 8.1 | 6.85 |
| 22. Spinous process terminal sup.-inf. height | 13.8 | 11.75 | 12.7 | 7.15 |
| 23. Costal process base sup.-inf. height | 11.5 | 12.2 | – | 13.9 |
| 24. Costal process angle | 78° | 82° | – | 50° |
| 25. Costal process length | – | 31.0 | – | – |
| 26. SAF orientation (in degrees) | – | 31° | 33° | 26° |
| 27. Pedicle sup.-inf. height | 10.9 | 10.6 | – | 11.2 |
| 28. Pedicle transv. width | 5.9 | 7.1 | 9.0 | 10.9 |
| 29. Pedicle dorsoven. length | 5.0 | 5.6 | 6.5 | 7.0 |
| 30. Lamina sup.-inf. height | 16.1 | 15.4 | – | 14.0 |
| 31. Lamina transv. width | 20.0 | 22.0 | – | 30.5 |
-
*
Parentheses indicate that the structure is incomplete and its measurement if estimated.
Table 2
Summary statistics for lumbar wedging angles of the extant comparative sample.
| Level | Group/fossil | Human ♂ (48) | Human ♀ (31) | Pan (43) | Gorilla (31) | Pongo (10) |
|---|---|---|---|---|---|---|
| L2 | Mean (stdev) | 4.4 (3.3) | 2.1 (2.1) | 4.6 (3.0) | 2.3 (2.7) | 5.3 (4.7) |
| 95% PI | –2.1, 10.9 | –2.0, 6.2 | –1.3,10.5 | –3.0, 7.6 | –3.9, 14.5 | |
| Min, max | –3.4, 12.8 | –2.1, 6.0 | –1.1, 12.4 | –4.0, 8.3 | –0.4, 14.4 | |
| L3 | Mean (stdev) | 2.4 (3.1) | 1.3 (2.6) | 4.5 (3.1) | 2.6 (2.0) | 6.1 (2.0) |
| 95% PI | –3.7, 8.5 | –3.8, 6.4 | –1.6, 10.6 | –1.3, 6.5 | 2.2, 10.0 | |
| Min, max | –4.8, 11.2 | –3.4, 6.6 | –2.4, 10.9 | –2.2, 7.5 | 3.2, 8.6 | |
| L4 | Mean (stdev) | –0.5 (2.8) | –1.5 (2.9) | 3.5 (3.4) | 1.3 (2.5) | 4.8 (3.8) |
| 95% PI | –6.0, 5.0 | –7.2, 4.2 | –3.2, 10.2 | –3.6, 6.2 | –2.6, 12.2 | |
| Min, max | –8.3, 4.8 | –7.9, 4.6 | –3.6, 10.9 | –3.9, 7.1 | –1.0, 11.3 | |
| L5 | Mean (stdev) | –5.9 (2.9) | –6.5 (3.1) | –0.5 (2.8) | –0.8 (2.2) | 2.0 (4.1) |
| 95% PI | −11.6,–0.2 | −12.6,–0.4 | –6.0, 5.0 | –5.1, 3.5 | –6.0, 10.0 | |
| Min,max | –11.6, 1.8 | –12.3, 2.2 | –5.9, 7.0 | –6.2, 3.5 | –5.2, 8.0 | |
| Sum | Mean (stdev) | 0.4 (7.8) | –4.9 (8.1) | 12.1 (8.8) | 5.4 (5.7) | 18.1 (9.5) |
| 95% PI | –15.0, 15.7 | –20.8, 11.0 | –5.1, 29.3 | –5.8, 16.6 | 8.6, 27.6 | |
| Min, max | –15.6, 15.5 | –18.2, 11.2 | –5.2, 31.7 | –8.1, 15.7 | 0.04, 36.0 |
Table 3
Lumbar wedging angles and combined wedging of fossil hominin specimens.
| L2 | L3 | L4 | L5 | Combined | |
|---|---|---|---|---|---|
| Kebara 2 | 8.1 | 6.9 | 4.5 | –10.6 | 8.9 |
| Shanidar 3 | 8.0 | 5.1 | 0.1 | –4.9 | 8.3 |
| La Chapelle-aux-Saints 1 | – | 4.7 | 0.0 | –7.8 | – |
| KNM-WT 15000 | – | – | –8.3 | –11.8 | – |
| LES1 | 3.0 | – | – | – | – |
| SK 3981b | – | – | – | –3.5 | – |
| MH2 | 4.1 | 1.4 | –1.6 | –11.2 | –7.3 |
| Sts 14 | 2.3 | 1.7 | –0.9 | –6.9 | –3.8 |
| StW 431 | 2.0 | 2.3 | 0.9 | –4.2 | 1.1 |
| StW 8 | 5.2 | 3.6 | – | – | – |
| StW 572 | 4.8 | – | – | – | – |
| StW 656/600 | – | 4.2 | – | –6.2 | – |
| A.L. 288–1 | – | 7.2 | – | – | – |
| A.L. 333–73 | – | 2.8 | – | – | – |
Table 4
Procrustes analysis of variance (ANOVA) results of centroid size and middle lumbar vertebra shape.
| Df | SS | MS | R2 | F | Z | Pr (>F) | |
|---|---|---|---|---|---|---|---|
| Centroid size | 1 | 0.11917 | 0.11917 | 0.0452 | 9.8252 | 5.5237 | <0.0001 |
| Genus | 3 | 1.00793 | 0.33598 | 0.38234 | 27.7009 | 12.0794 | <0.0001 |
| Centroid size:genus | 3 | 0.0537 | 0.0179 | 0.02037 | 1.4759 | 2.2858 | 0.0109 |
| Residuals | 120 | 1.45545 | 0.01213 | 0.55209 | |||
| Total | 127 | 2.63626 |
Additional files
Download links
A two-part list of links to download the article, or parts of the article, in various formats.
Downloads (link to download the article as PDF)
Open citations (links to open the citations from this article in various online reference manager services)
Cite this article (links to download the citations from this article in formats compatible with various reference manager tools)
New fossils of Australopithecus sediba reveal a nearly complete lower back
eLife 10:e70447.
https://doi.org/10.7554/eLife.70447


