aCPSF1 cooperates with terminator U-tract to dictate archaeal transcription termination efficacy
- State Key Laboratory of Microbial Resources, Institute of Microbiology, Chinese Academy of Sciences, China
- University of Chinese Academy of Sciences, China
- Beijing Institutes of Life Science, Chinese Academy of Sciences, China
Figures
Figure 1 with 4 supplements
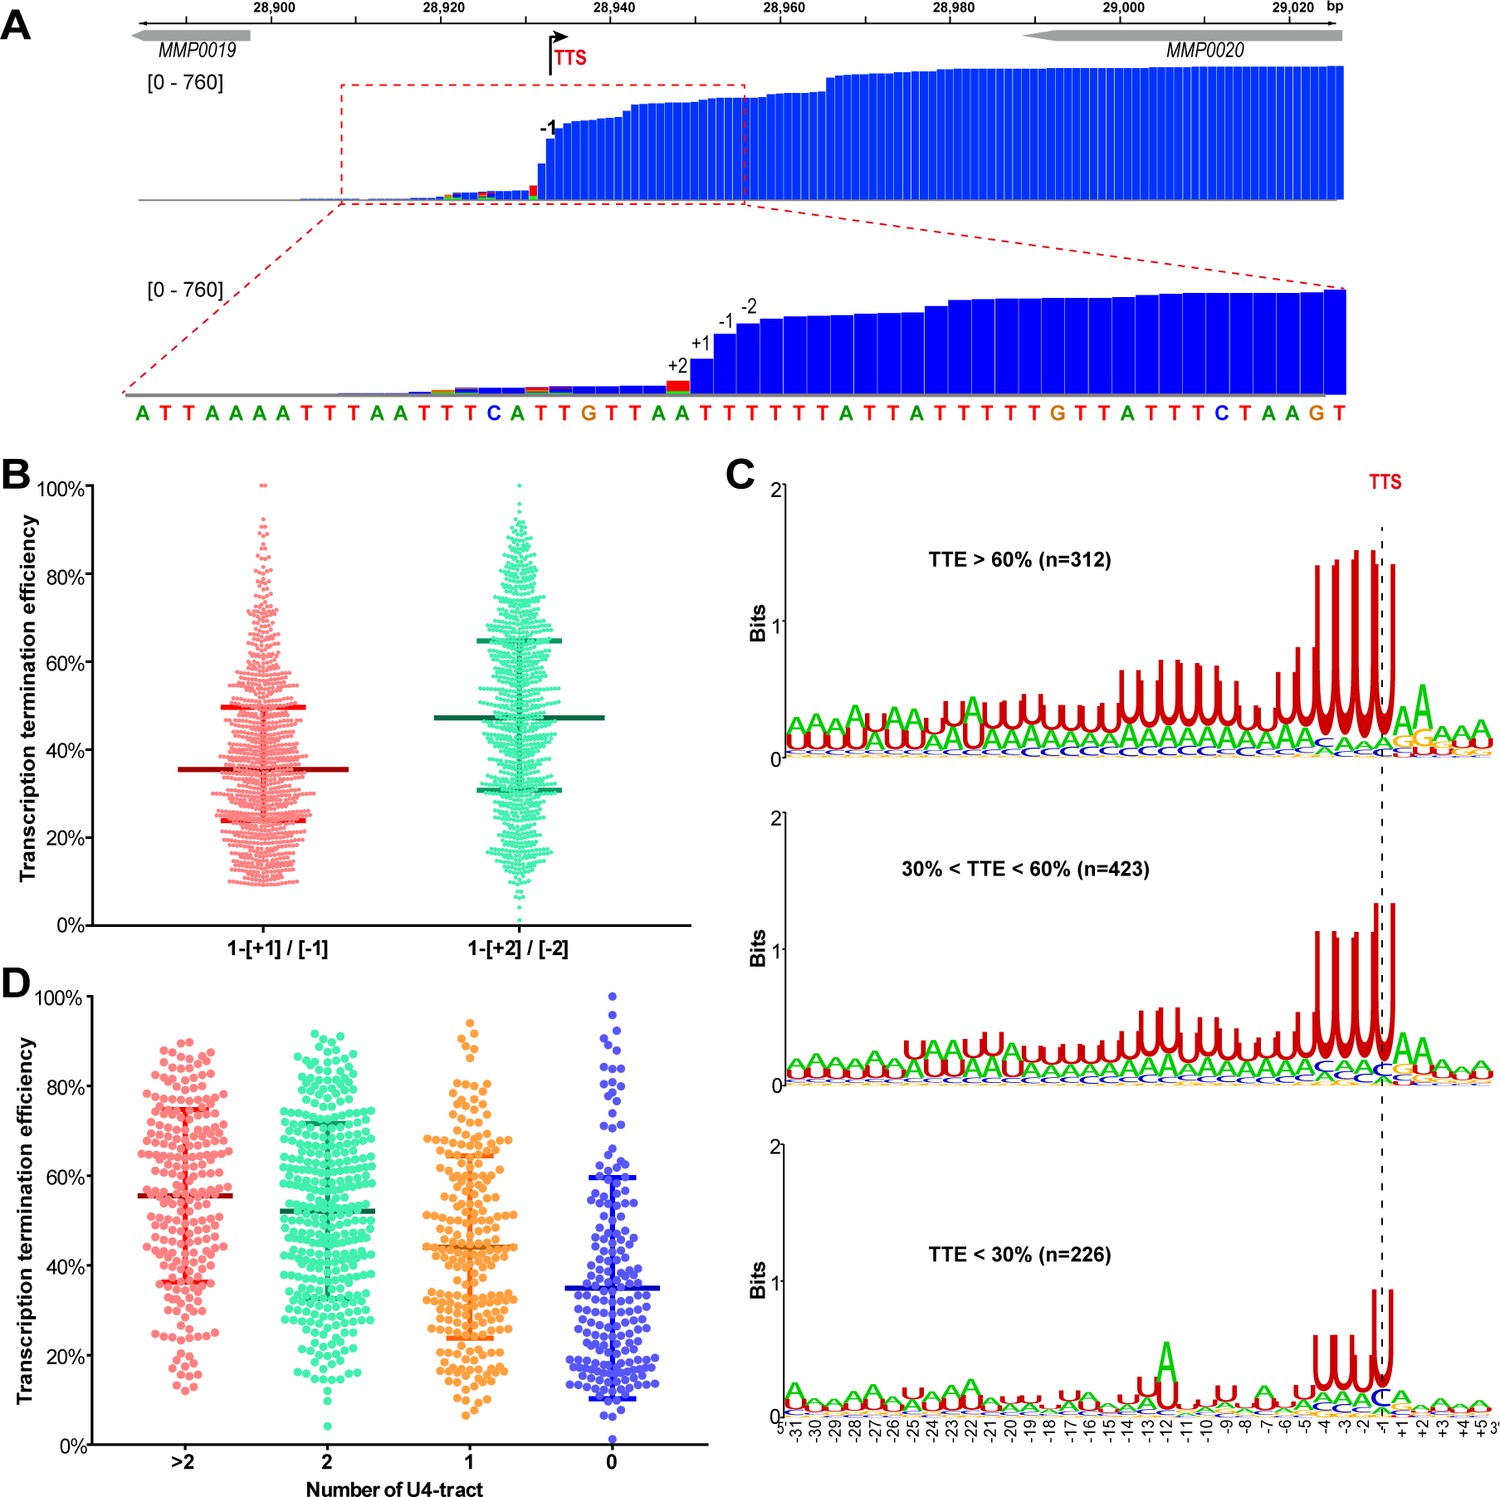
A positive correlation is observed between the terminator U4-tract numbers and the TTEs among the TUs of M.maripaludis.
(A) A representative Term-seq map of MMP0020 showing a dramatical decreasing pattern of sequencing reads at four nucleotides that flank the identified transcription termination site (TTS, -1 site indicated by bent arrow). The magnified mapping region (dotted red frame) shows reads dramatically decreasing from −2 (two nts upstream) to +2 (two nts downstream) of the TTS. The chromosome locations of the genes are indicated at the top, and the Term-seq read heights are shown in brackets. (B) Box-plot diagrams showing the TTE statistics of the 998 transcripts, which were calculated based on the reads ratio of nts +1 to −1 ([+1]/[−1]), and that of nts +2 to −2 ([+2]/[−2]) respectively up- and down-stream of the primary TTSs. Between the upper and lower lines are TTEs of 50% of transcripts, and the middle line represents the TTE median. (C) Logo representations of the terminator motif signatures in three groups of transcripts with different TTEs ( > 60%, > 30% and < 60%, < 30%). The transcript numbers of each group are indicated inside parentheses. The correlation of TTEs with the terminator U4-tract numbers was analyzed using Wilcox test, and the P values between Groups I and II, I and III, II and III were 3.4e-12, 2.22e-16 and 2.1e-5, respectively. (D) Box-plot diagrams showing the statistics of TTE values among the four groups of terminators that carry various numbers of U-tracts. The diagram representations are the same as those in (B). The statistical significance for the TTEs of the four groups analyzed by Wilcoxon rank sum test are shown in Supplementary file 4c.
-
Figure 1—source data 1
Includes the statistic source data of Figure 1, Figure 1—figure supplements 1 and 2.
- https://cdn.elifesciences.org/articles/70464/elife-70464-fig1-data1-v1.xlsx
Figure 1—figure supplement 1
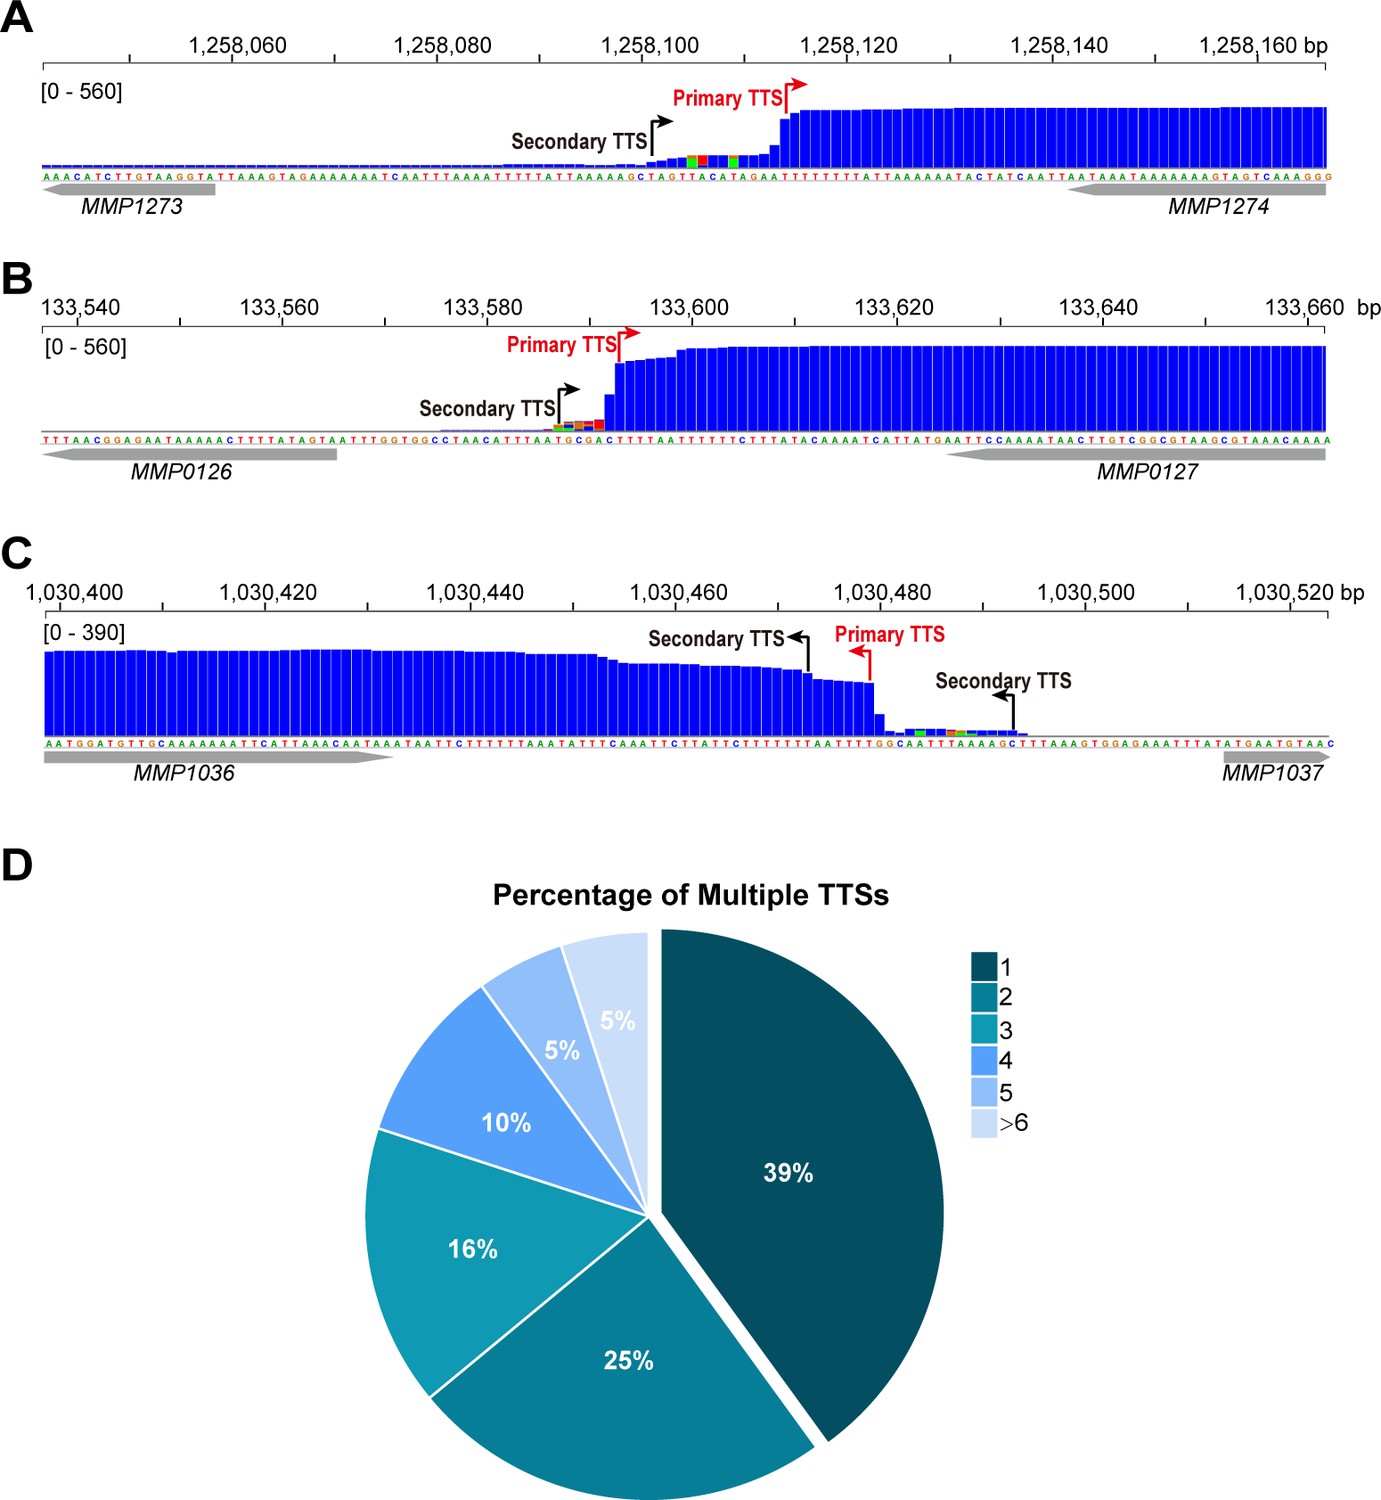
Multiple TTSs in one transcript identified by Term-seq in M. maripaludis.
(A, B, C) Representative Term-seq maps showed multiple TTSs in the MMP1274 (A), MMP0127 (B), and MMP1036 (C) transcripts. The primary and secondary TTSs are indicated by red and black arrows, respectively. (D) Pie chart shows the percentages of TUs with one to >6 multiple TTSs identified.
Figure 1—figure supplement 2
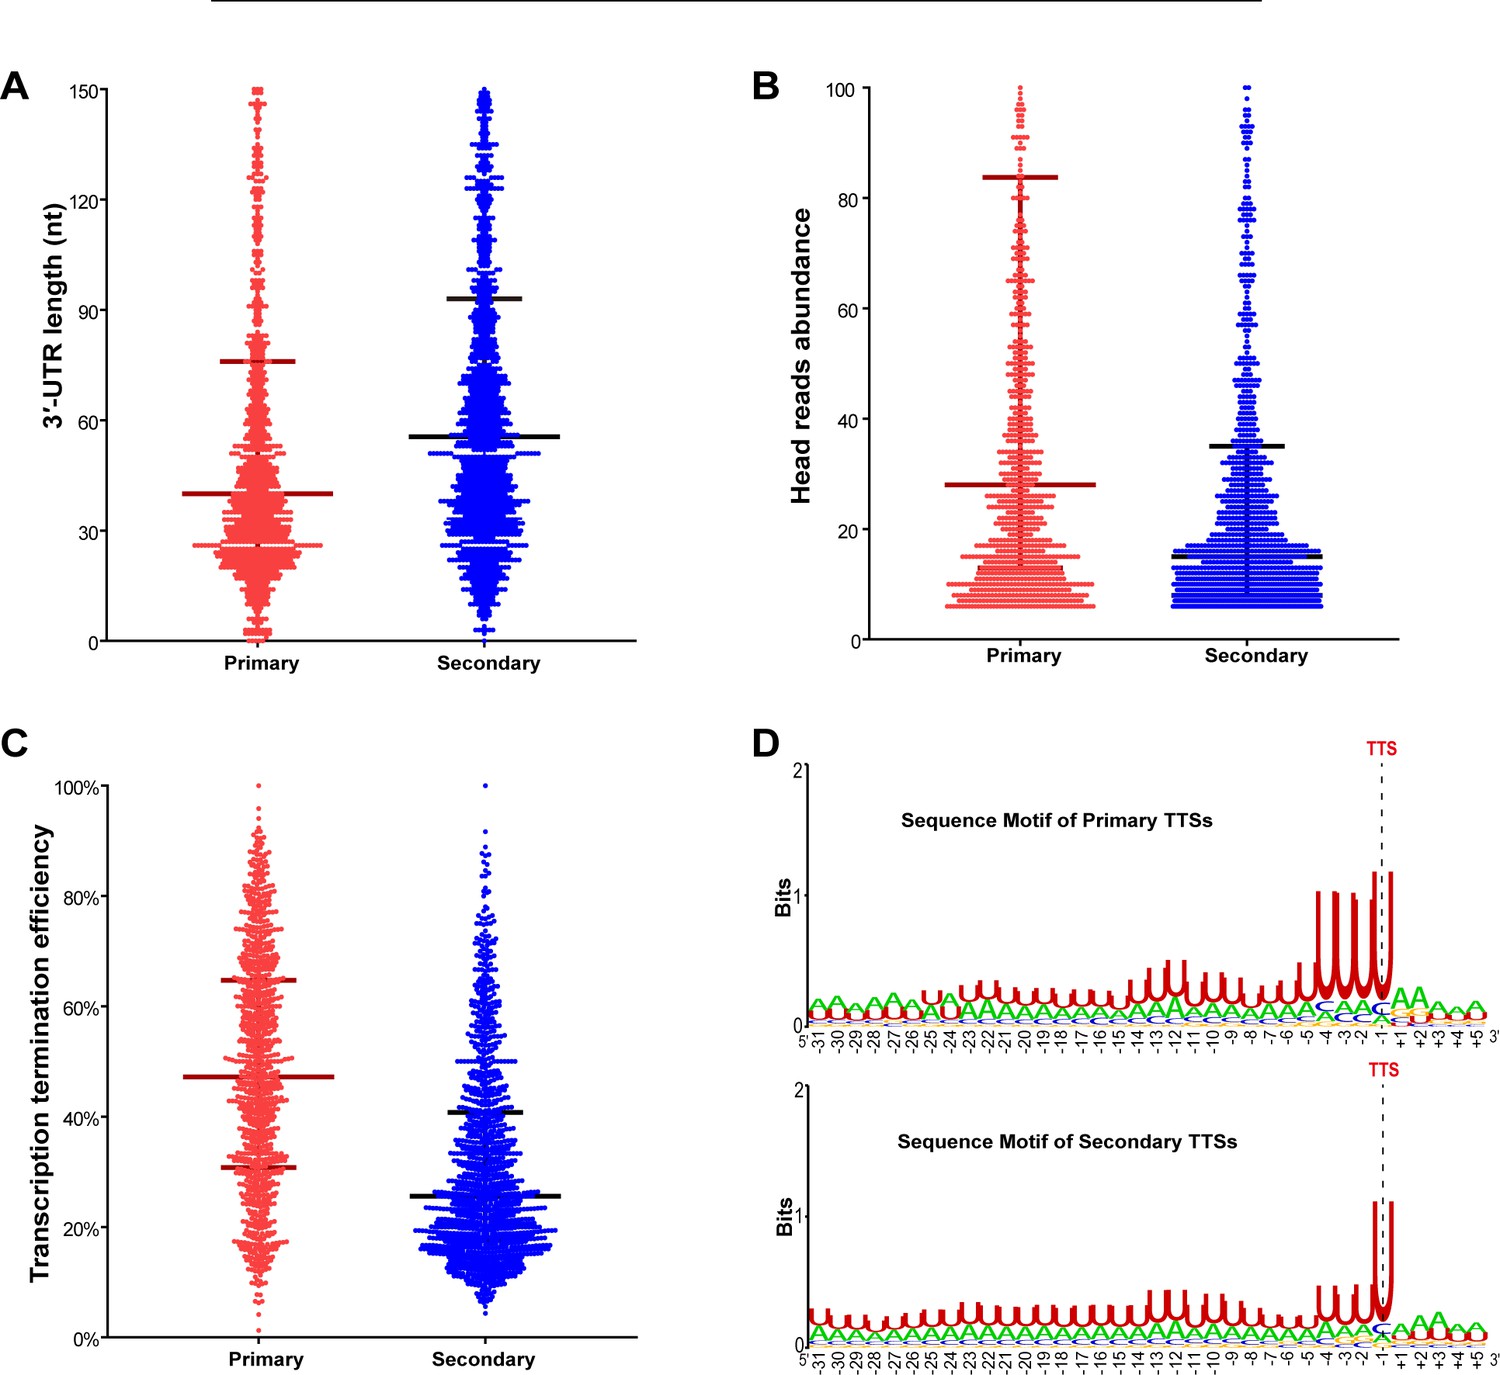
Features of the primary and secondary TTSs identified in M. maripaludis.
(A, B, C) Box-plot diagrams show the statistics of the 3′-UTR length (A), head read abundance (B), and TTEs (C) of the 998 primary and 1359 secondary TTSs, respectively. (D) Logo representations show the sequence motifs flanking the 998 primary TTSs and 1359 secondary TTSs.
Figure 1—figure supplement 3
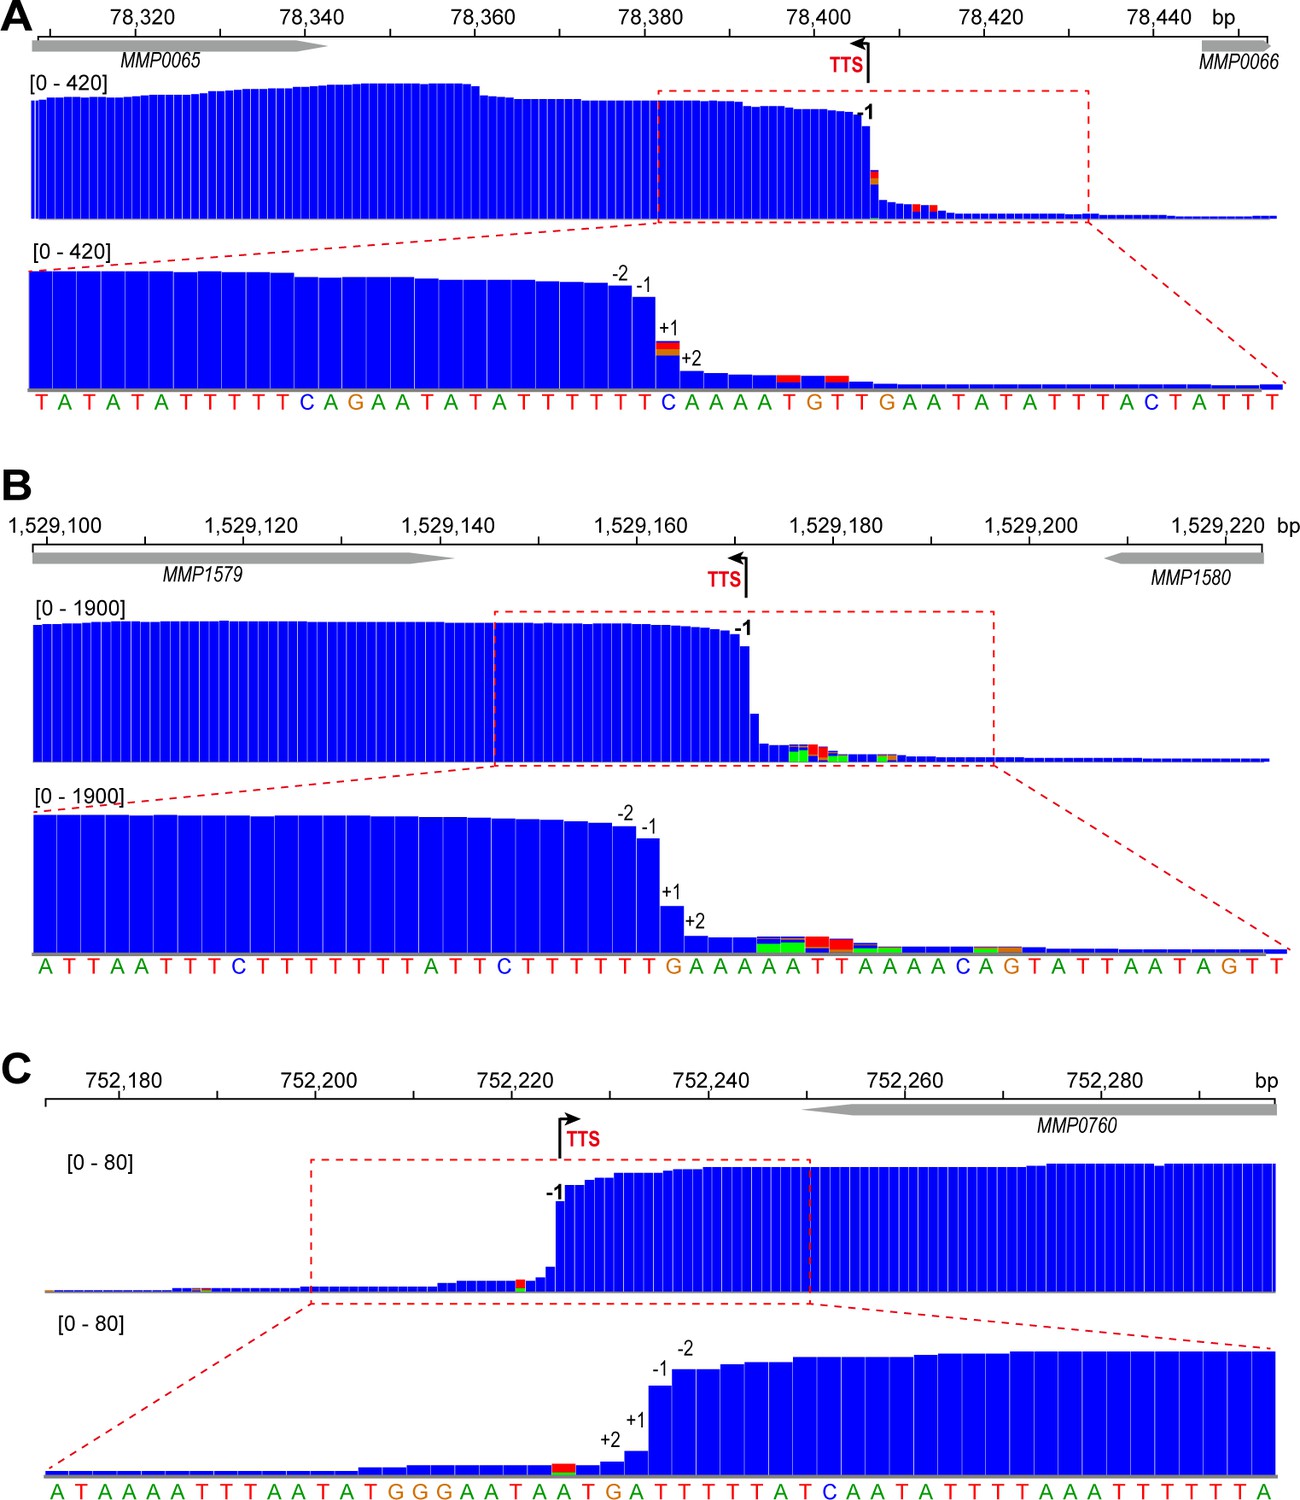
Term-seq maps of three representative genes, MMP0065 (A), MMP1579 (B), and MMP0760 (C).
Gene locations on the chromosome are indicated at the top. Black arrows indicate Term-seq identified TTS (−1 site). The magnified mapping region (dotted red line framed) shows a dramatic read decreasing pattern from −2 nt (upstream) to +2 nt (downstream) of TTS (lower panels). The Numbers inside brackets are the Term-seq reads heights.
Figure 1—figure supplement 4
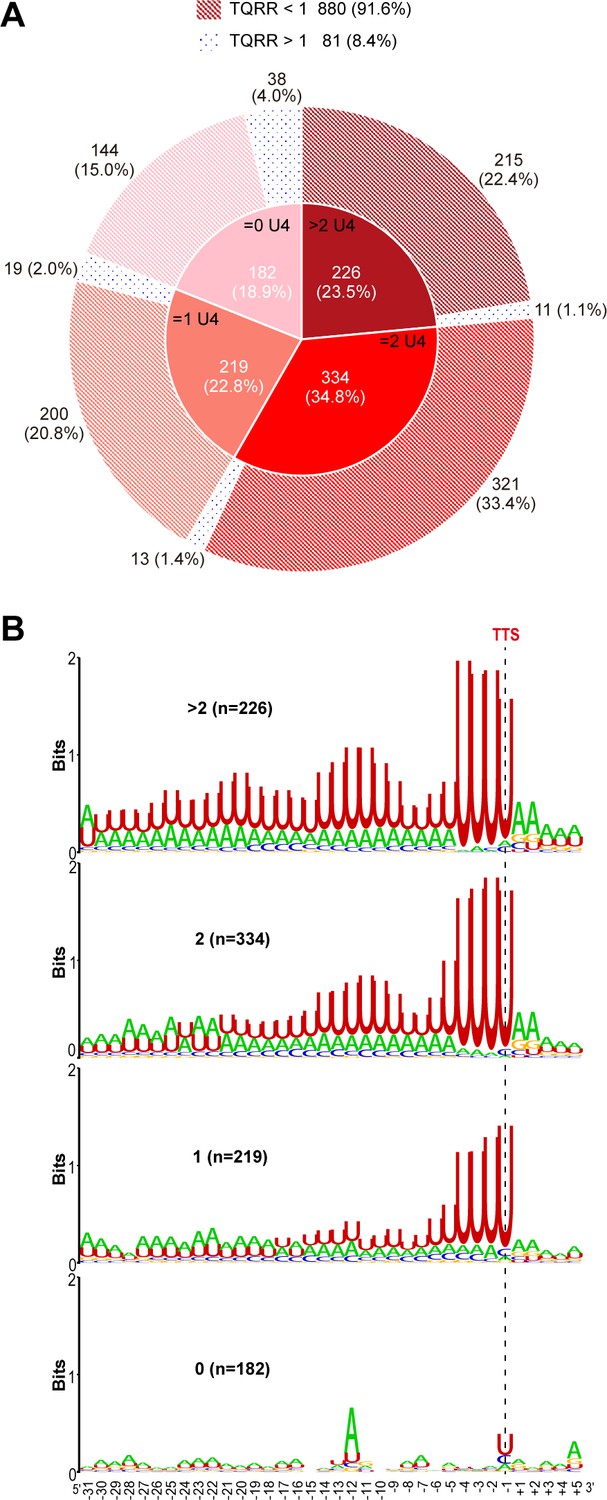
Percentages and motifs of the TU groups that have different numbers of the terminator U4-tracts.
(A) Pie chart shows the TU numbers and percentages in each group that has >2, 2, 1, and 0 terminator U4-tracts, respectively. The aCPSF1 dependency in each group determined by TQRR is displayed in the outer ring. (B) Logo representations of the terminator motif signature of each group that contain >2, 2, 1, and 0 U4-tracts, respectively. The numbers inside the parentheses are the terminator numbers that contain various U4-tracts in each group.
Figure 2 with 3 supplements
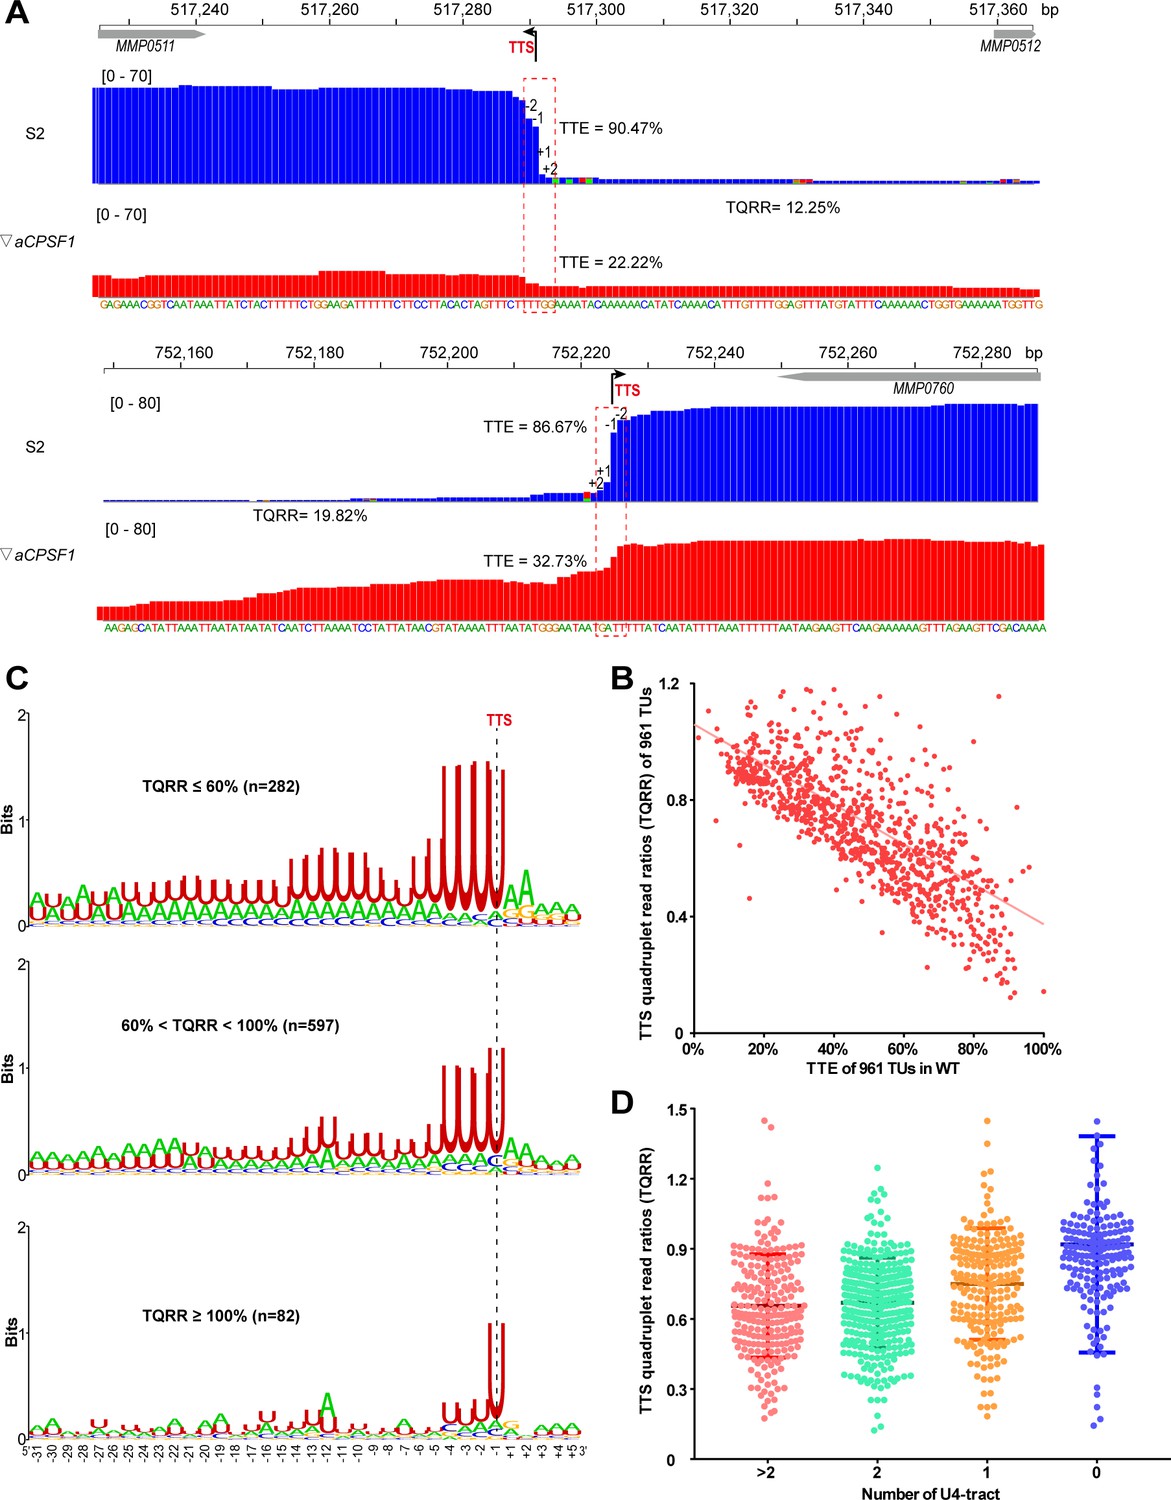
Co-occurrence of aCPSF1 and the terminator U4-tract is correlated with the genome-wide TTEs of M. maripaludis.
(A) Visualized Term-seq read maps of the representative genes, MMP0511 (top) and MMP0760 (bottom), show sharper reads decreasing between the −2 and +2 nts (dotted frame) respectively down- and up-stream of the TTSs (-1) in the wild-type (WT) strain (S2) than in the aCPSF1 depletion mutant (▽aCPSF1). The chromosome locations of the genes are indicated at the top. The bent arrow indicates the Term-seq identified TTS. TQRR represents the TTS quadruplet read ratio of a TU in WT (S2) to that in ▽aCPSF1, with the lower values representing a higher aCPSF1 dependency of a TU in transcription termination. The mapping read heights are shown inside the brackets. The TTE is calculated as above. (B) A linear correlation is observed between the TQRRs and TTEs of 961 protein coding TUs. (C) Logo representations of the terminator motif signatures are shown for highly aCPSF1-dependent (TQRR ≤60%), moderately aCPSF1-dependent (60%< TQRR < 100%) and non-dependent (TQRR ≥100%) groups. The TU numbers of each group are shown in parentheses. (D) Box-plot diagrams showing the TQRR (aCPSF1 dependency) statistics of the terminators carrying >2, 2, 1, and 0 U4-tracts. Between the upper and lower lines are TQRRs of 50% of transcripts, and the middle line represents the TQRR median. The statistical significance for the TQRRs of the four groups analyzed by Wilcoxon rank sum test are shown in Supplementary file 4d.
-
Figure 2—source data 1
Includes the statistic source data of Figure 2, Figure 2—figure supplements 1 and 2.
- https://cdn.elifesciences.org/articles/70464/elife-70464-fig2-data1-v1.xlsx
Figure 2—figure supplement 1
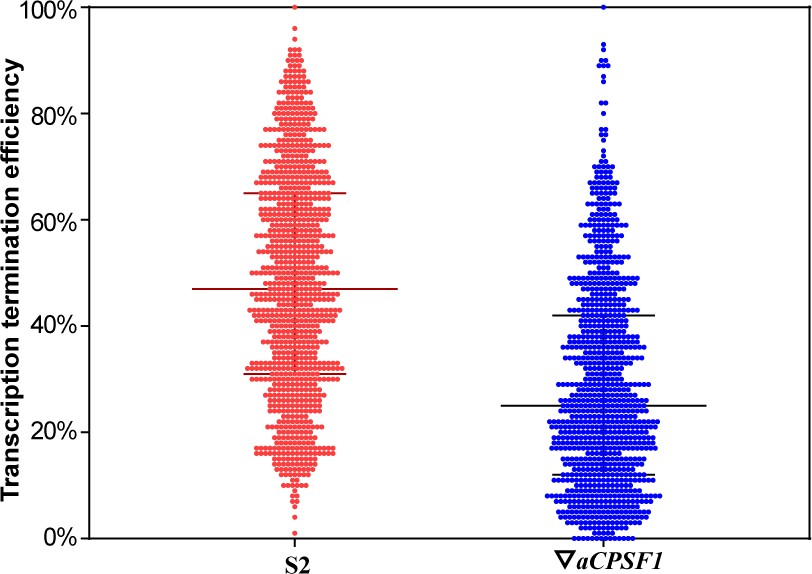
Box plot diagram showing the statistics of TTEs of the Term-seq identified primary TTSs in the WT (S2) and ▽aCPSF1 mutant.
Figure 2—figure supplement 2
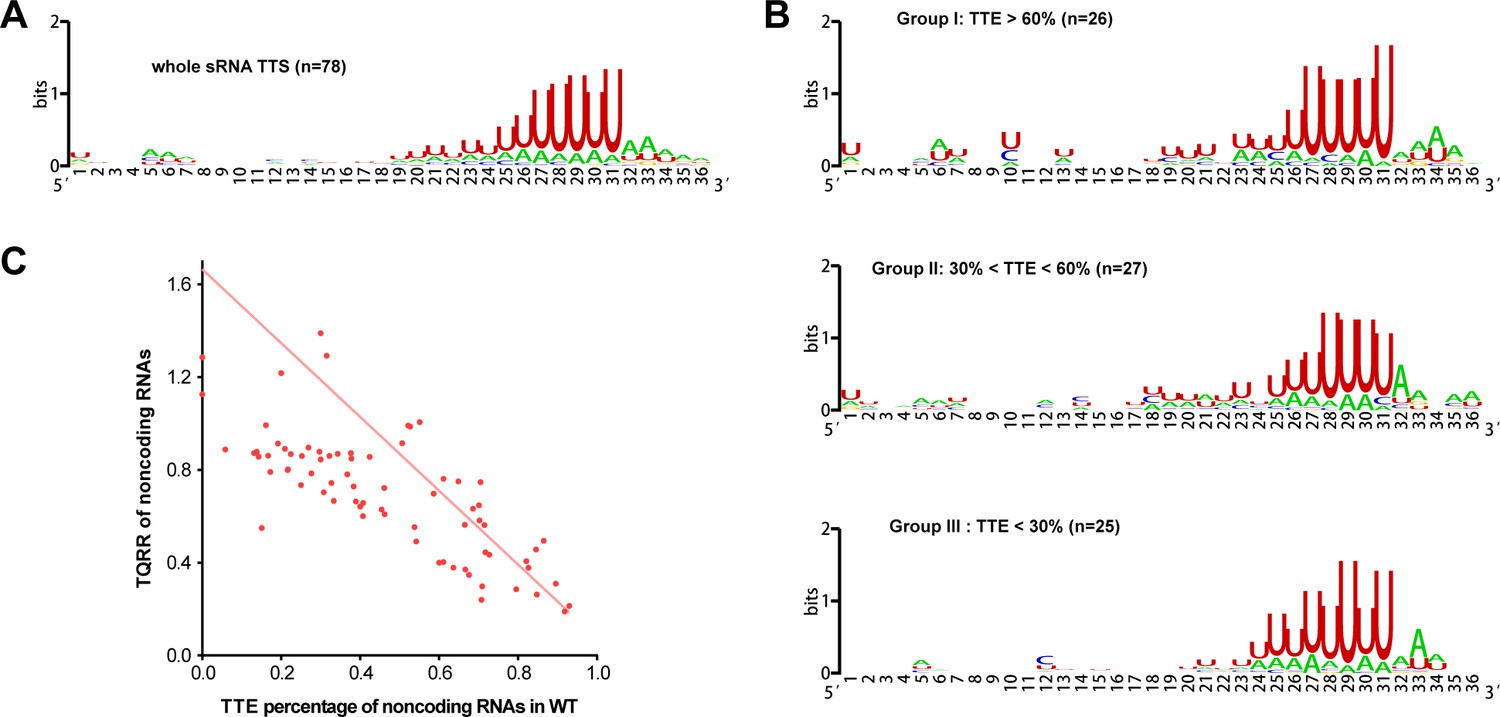
The terminator motif and the linear correlation of TTEs and TQRRs of noncoding RNAs in M. maripaludis.
(A) Sequence motif upstream of the 78 TTSs of noncoding RNAs identified by Term-seq was generated using weblogo. (B) Logo representations of the terminator motif features in the three groups of TTSs of noncoding RNAs with different TTEs ( > 60%, > 30% and < 60%, < 30%). (C) A linear correlation is observed between TQRRs and TTEs of the 78 noncoding RNA TTSs.
Figure 2—figure supplement 3
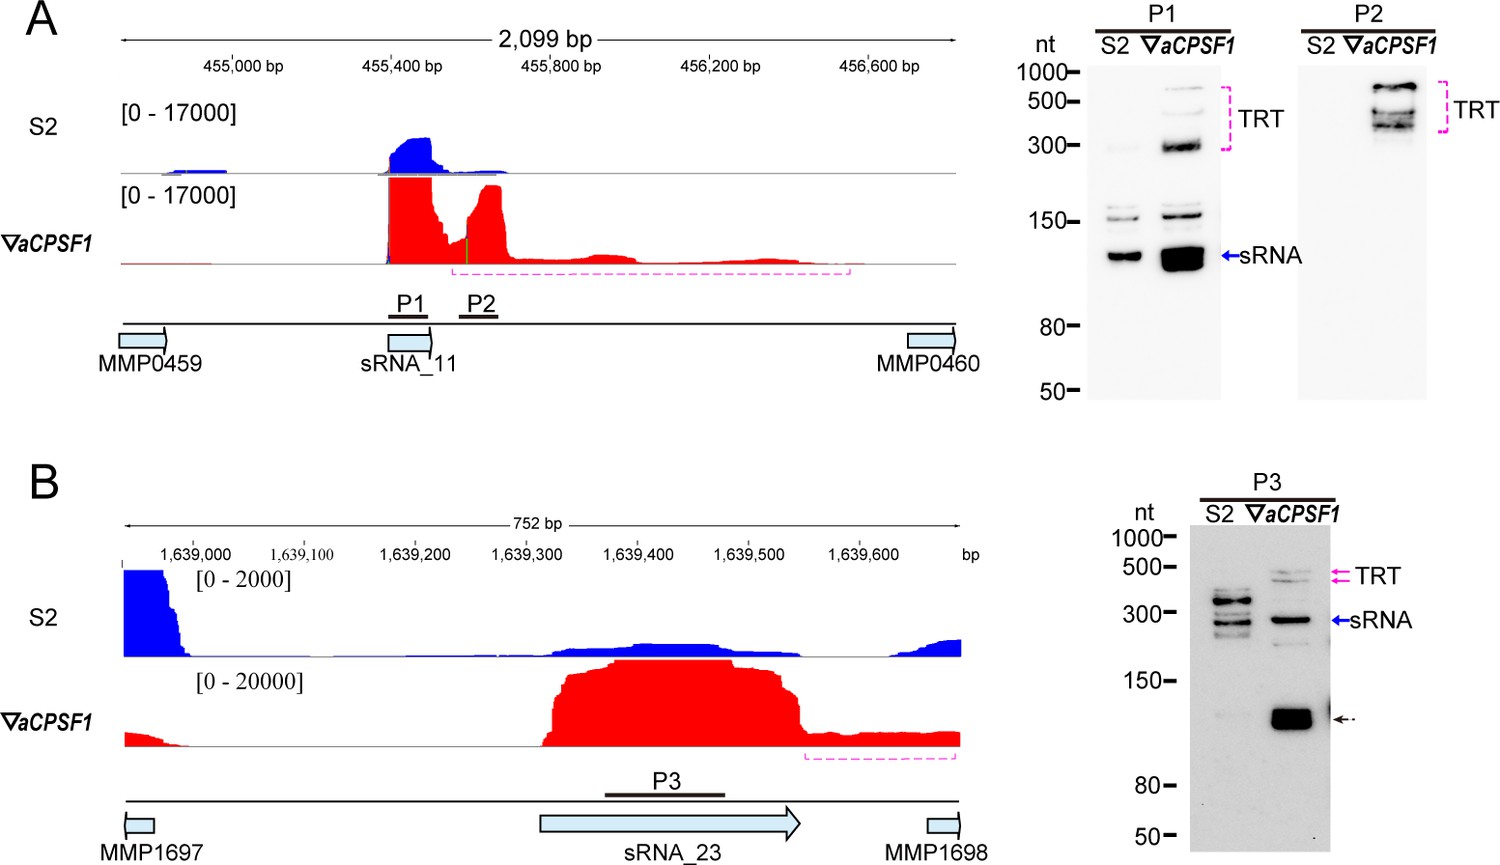
Transcription readthrough (TRT) of noncoding RNAs caused by the depletion of aCPSF1.
(A, B) The stand-specific RNA-seq mapping profiles (left) show 3′-end extensions (dot magenta brackets) of sRNA_11 (A) and sRNA_23 (B) in ▽aCPSF1 (red) referenced to that in strain S2 (blue). Numbers on top indicate the genomic sites. Northern blot (right panel) verified TRTs using the respective probes (horizontal sticks in A).
-
Figure 2—figure supplement 3—source data 1
Includes the bolt source date of Figure 2—figure supplement 3.
- https://cdn.elifesciences.org/articles/70464/elife-70464-fig2-figsupp3-data1-v1.zip
Figure 3 with 3 supplements
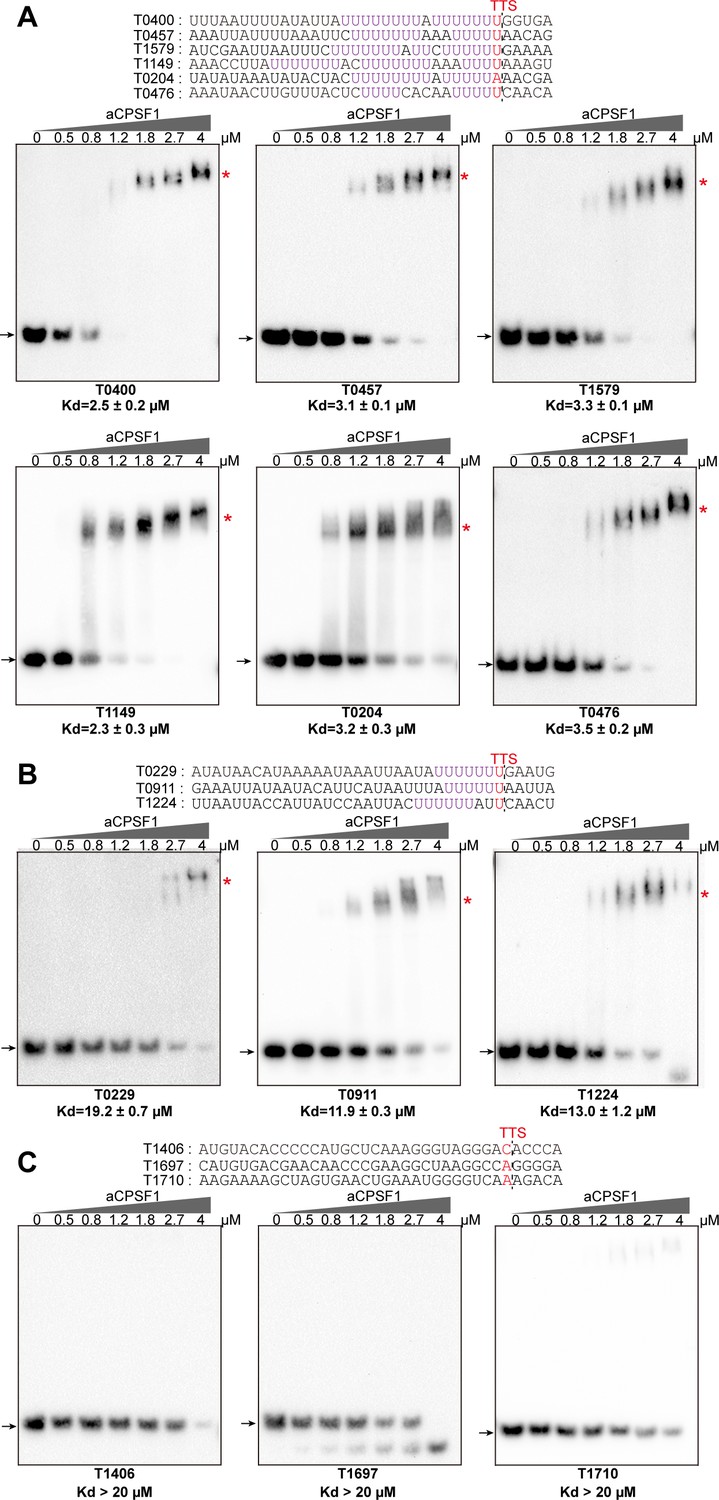
Binding specificity of aCPSF1 to RNAs carrying different numbers of U4-tracts determined by rEMSA assays.
RNAs with a consensus length of 36 nt derived from the indicated gene terminators that carry ≥2 U4-tracts (A), 1 U4-tract (B), and 0 U4-tract (C) were used as the binding substrates. RNA sequences are shown in the top panels with red letters indicating Term-seq identified TTSs. The gradient concentrations of aCPSF1 used in the binding reactions are indicated at the top of gels. Detailed binding procedure is described in the Materials and methods section. The arrows and red asterisks indicate the free RNA substrates and the shifted RNA-aCPSF1 complexes, respectively. The binding assay for each RNA substrate was performed in triplicate. Equilibrium dissociation constants (Kd) were calculated from the binding curves based on the quantification of unbound and bound substrates, and the average Kd and standard deviations are shown.
-
Figure 3—source data 1
Includes the gel source data of Figure 3.
- https://cdn.elifesciences.org/articles/70464/elife-70464-fig3-data1-v1.zip
Figure 3—figure supplement 1
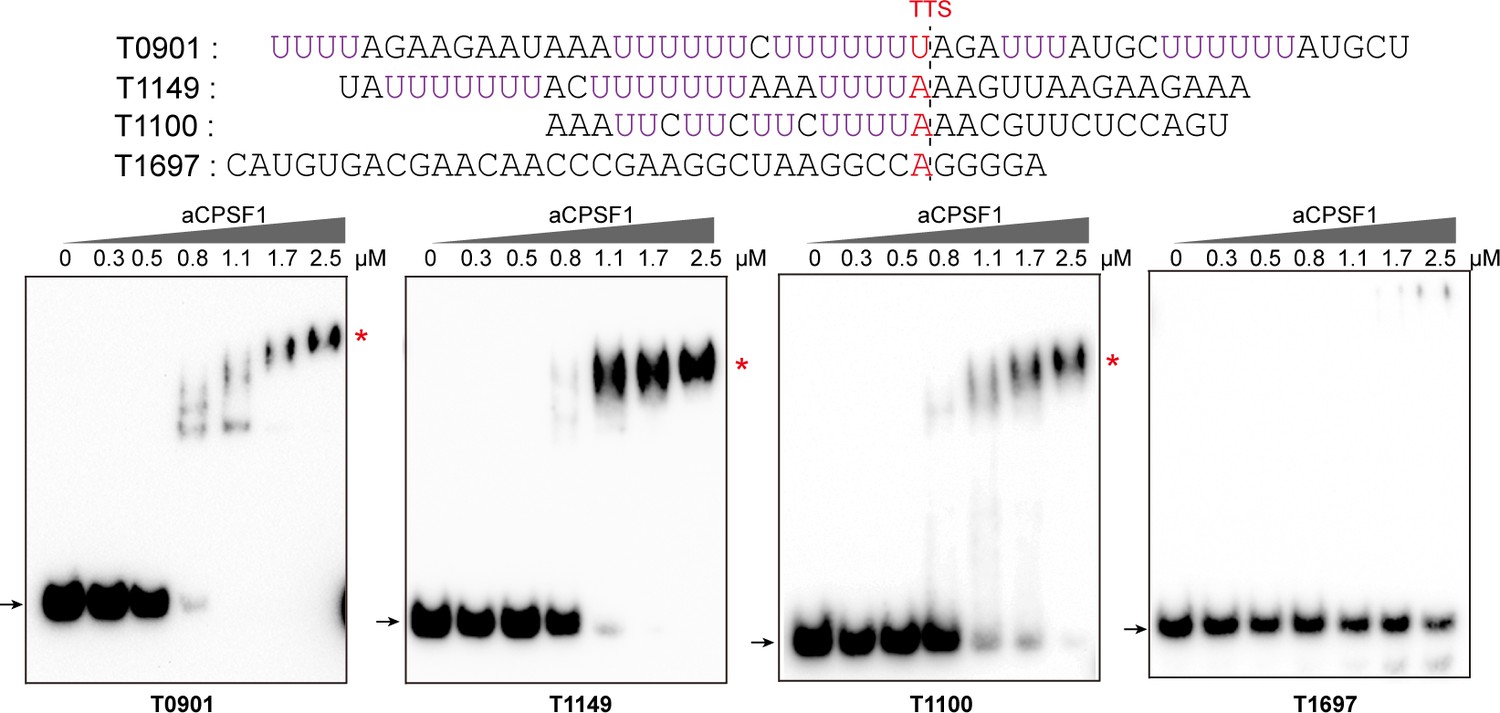
The binding specificity of aCPSF1 to U-tract RNAs determined by rEMSA assays.
Three RNAs (T0901, T1149, and T1100) containing the terminator U-tract sequences and one with no U-tract (T1697), which are from the indicated transcript 3′-ends, were used as the binding substrates for aCPSF1. The terminator sequences are shown in the upper panels, and the U-tract sequences and Term-seq identified TTS are shown as magenta and red letters, respectively. The gradient concentrations of aCPSF1 used in the binding reactions are indicated at the top of the gels. Black arrows indicate free RNAs and red asterisks specify RNA-aCPSF1 complexes.
-
Figure 3—figure supplement 1—source data 1
Includes the gel source data of Figure 3—figure supplement 1.
- https://cdn.elifesciences.org/articles/70464/elife-70464-fig3-figsupp1-data1-v1.zip
Figure 3—figure supplement 2
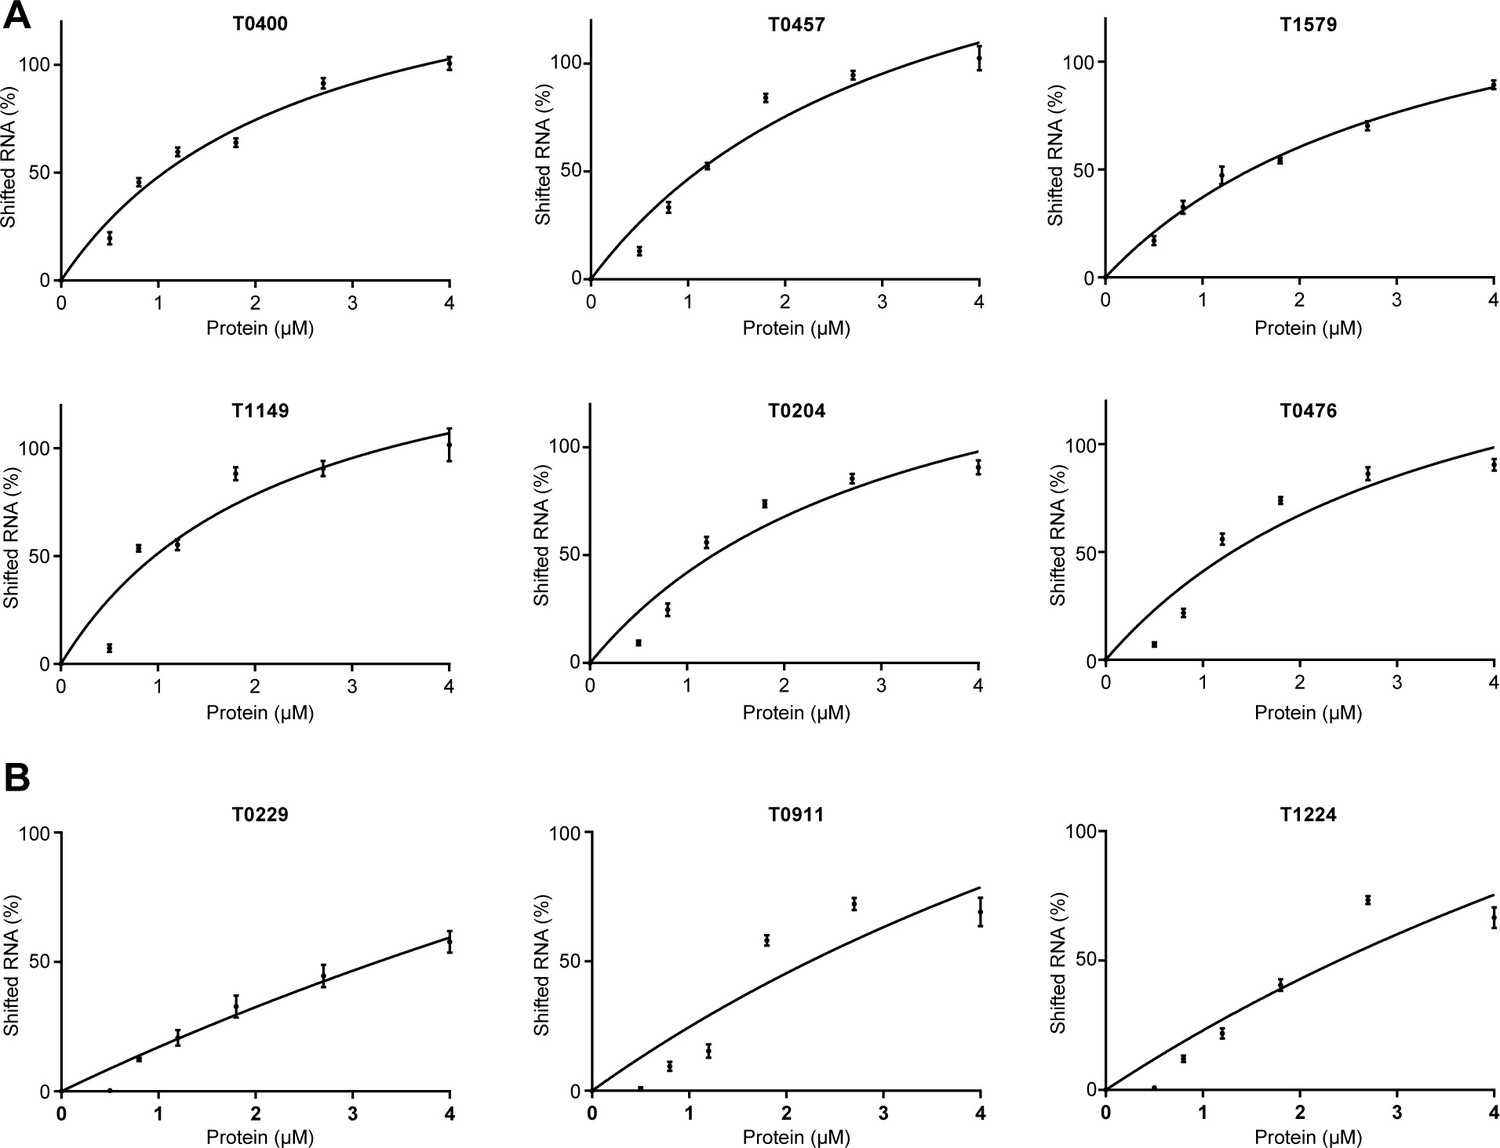
Binding curves of aCPSF1 to indicated RNAs.
The shifted RNA percentage was quantified based on quantifying the bound and unbound substrates shown in the rEMSA gels in Figure 3. The binding curves were obtained by plotting the shifted RNA (%) vs. the protein concentrations, and the Kd values were calculated based on the curve regression by the software Prism and is shown under the gels in Figure 3. All data were calculated from three independent experiments, and the average Kd and standard deviations are shown.
Figure 3—figure supplement 3
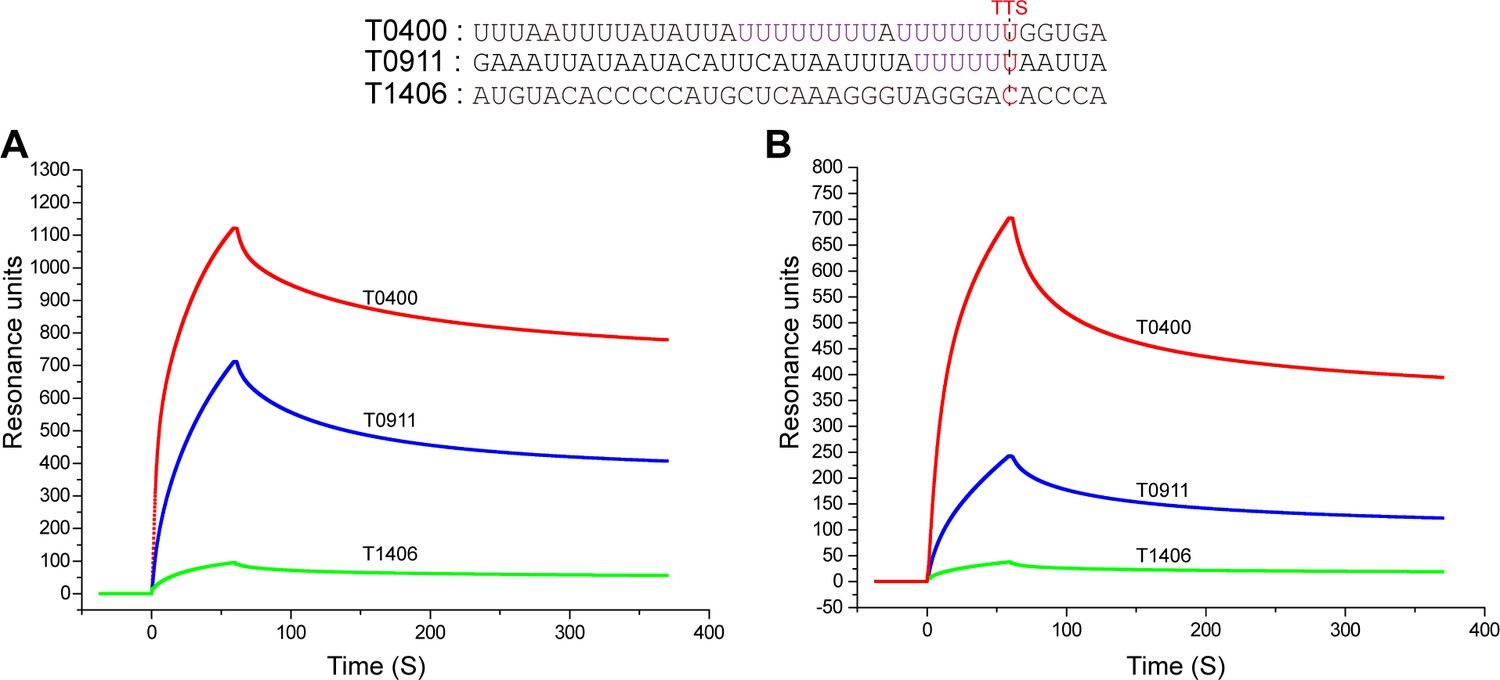
The binding specificity of aCPSF1 to U-tract RNAs assayed by SPR.
Two RNAs of terminator sequences carrying U-tracts (T0400 and T0911) and one with no U-tract (T1406) were used as the binding substrates for SPR assays. The RNA sequences are shown at the top. The purified recombinant Mmp-aCPSF1 at 500 µg/ml (A) and 125 µg/ml (B) were assayed for RNA binding.
-
Figure 3—figure supplement 3—source data 1
Includes the statistic source data of Figure 3—figure supplement 3.
- https://cdn.elifesciences.org/articles/70464/elife-70464-fig3-figsupp3-data1-v1.xlsx
Figure 4 with 3 supplements

The minimal RNA length and U-tract base stringency required for the specific binding of aCPSF1 determined by rEMSA assays.
RNAs with indicated lengths and base mutations shown in the top panels that are derived from the native terminator sequences of MMP0204 (T0204) and MMP0229 (T0229) were used as the binding substrates of aCPSF1. (A) The T0204 RNA with a length of 36 nt was truncated by six nts from the 5′ end, resulted in RNAs with lengths of 30 nt, 24 nt, and 18 nt. (B) The 18nt-T0204 RNA was base mutated in either one (M1 and M2) or both U-tracts (M3). (C) A one U-tract RNA derived from the T0209 was base mutated to construct a two U-tract mutant (M1) and a non-U-tract mutant (M2). (D) The T0204 RNA that contains two U-tracts was base mutated to generate the two U-tracts with each U-tract containing 5 (DU5), 4 (DU4), and 3 (DU3) consecutive Us, respectively. TTSs identified by Term-seq and the mutated residues are shown as plain and bold red letters, respectively. The gradient concentrations of aCPSF1 used in the binding reactions are indicated at the top of the gels. The detailed rEMSA procedure is described in the Materials and methods section. The arrows and red asterisks indicate the free RNA substrates and the RNA-aCPSF1 complexes, respectively. The binding assay for each RNA substrate was performed in triplicate. Equilibrium dissociation constants (Kd) were calculated from the binding curves based on the quantification of unbound and bound substrates, and the average Kd and standard deviations are shown.
-
Figure 4—source data 1
Includes the gel source data of Figure 4.
- https://cdn.elifesciences.org/articles/70464/elife-70464-fig4-data1-v1.zip
Figure 4—figure supplement 1
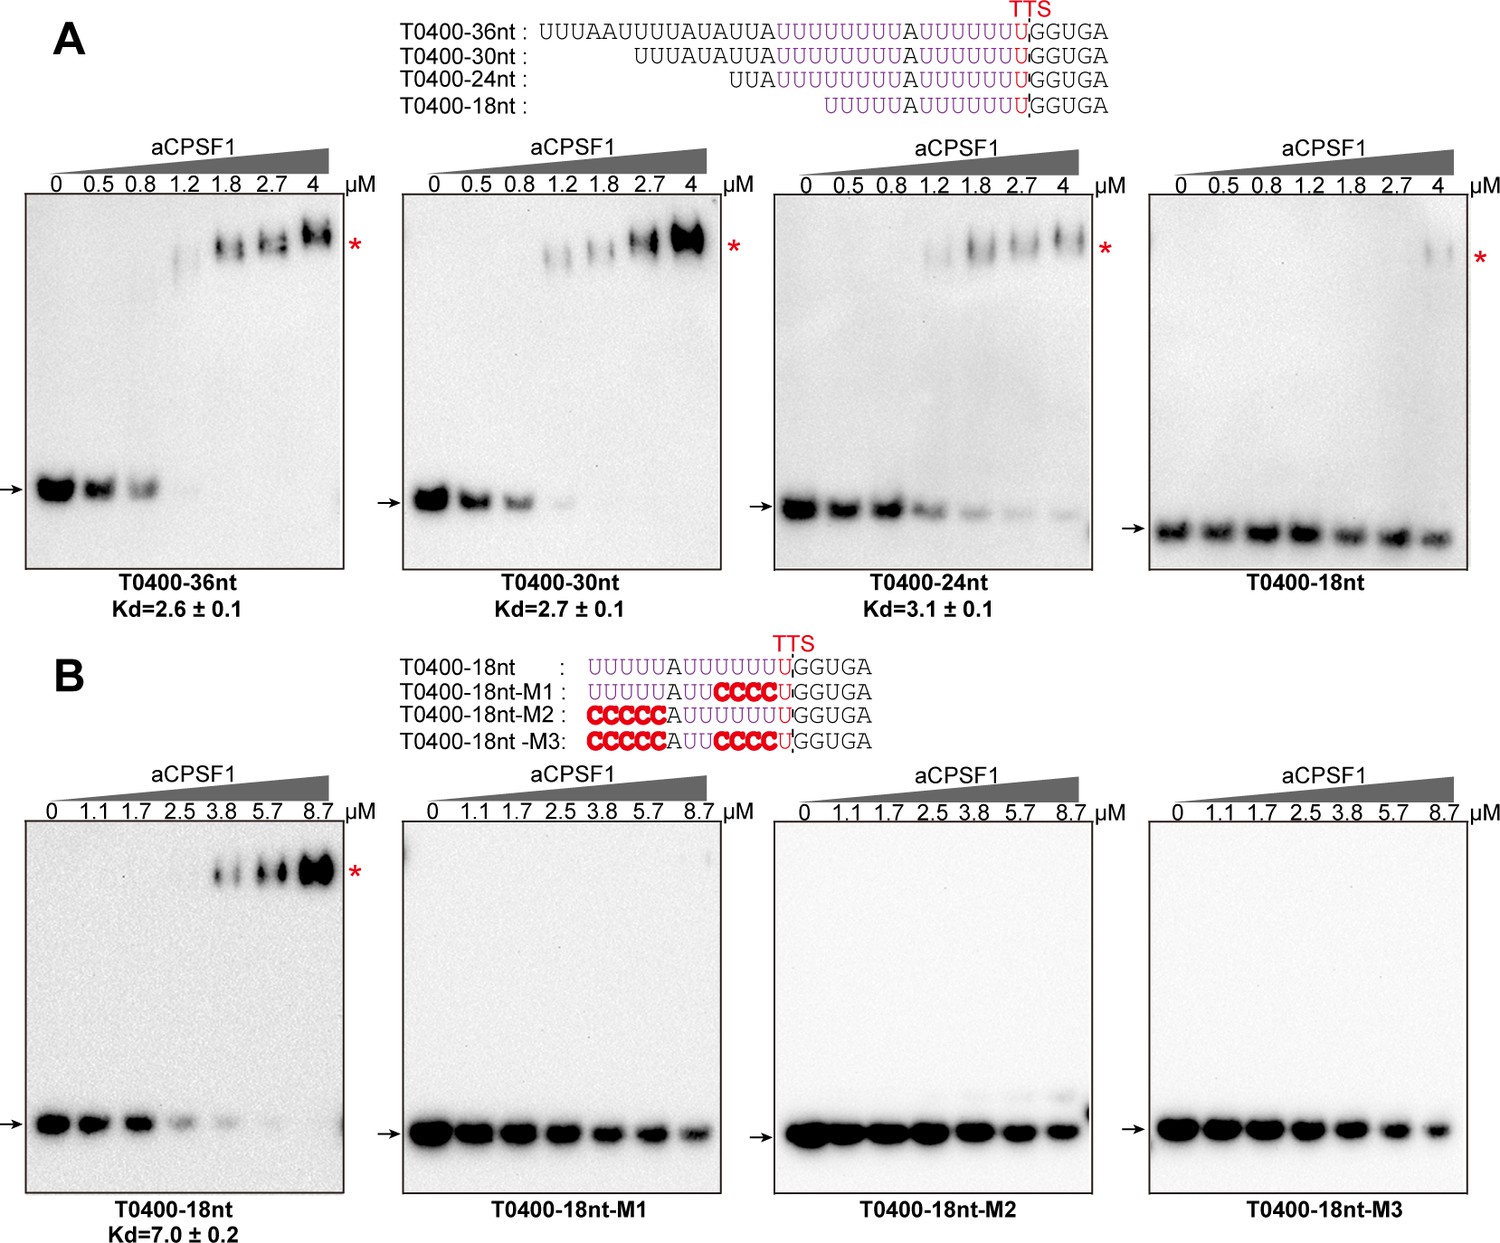
The minimal RNA length and U-tract base stringency required for the specific binding of aCPSF1 on T0400 terminator determined by rEMSA assays.
RNAs of indicated lengths and base mutations (shown on the top panels) that are derived from the native terminator sequences of MMP0400 (T0400) were used as the binding substrates of aCPSF1. (A) The T0400 RNA with a length of 36 nt was each six nt truncated from the 5′ end and resulted in RNAs of 30 nt, 24 nt and 18 nt in lengths, respectively. (B) The 18nt-T0400 RNA was base mutated on either one (M1 and M2) or two U-tracts (M3). TTSs identified by Term-seq and the mutated residues are shown as plain and bold red letters, respectively. The gradient concentrations of aCPSF1 used in the binding reactions are indicated at the top of the gels. The rEMSA procedure is described in the Materials and methods section. The arrows and red asterisks indicate free RNA substrates and RNA-aCPSF1 complexes, respectively.
-
Figure 4—figure supplement 1—source data 1
Includes the gel source data of Figure 4—figure supplement 1.
- https://cdn.elifesciences.org/articles/70464/elife-70464-fig4-figsupp1-data1-v1.zip
Figure 4—figure supplement 2
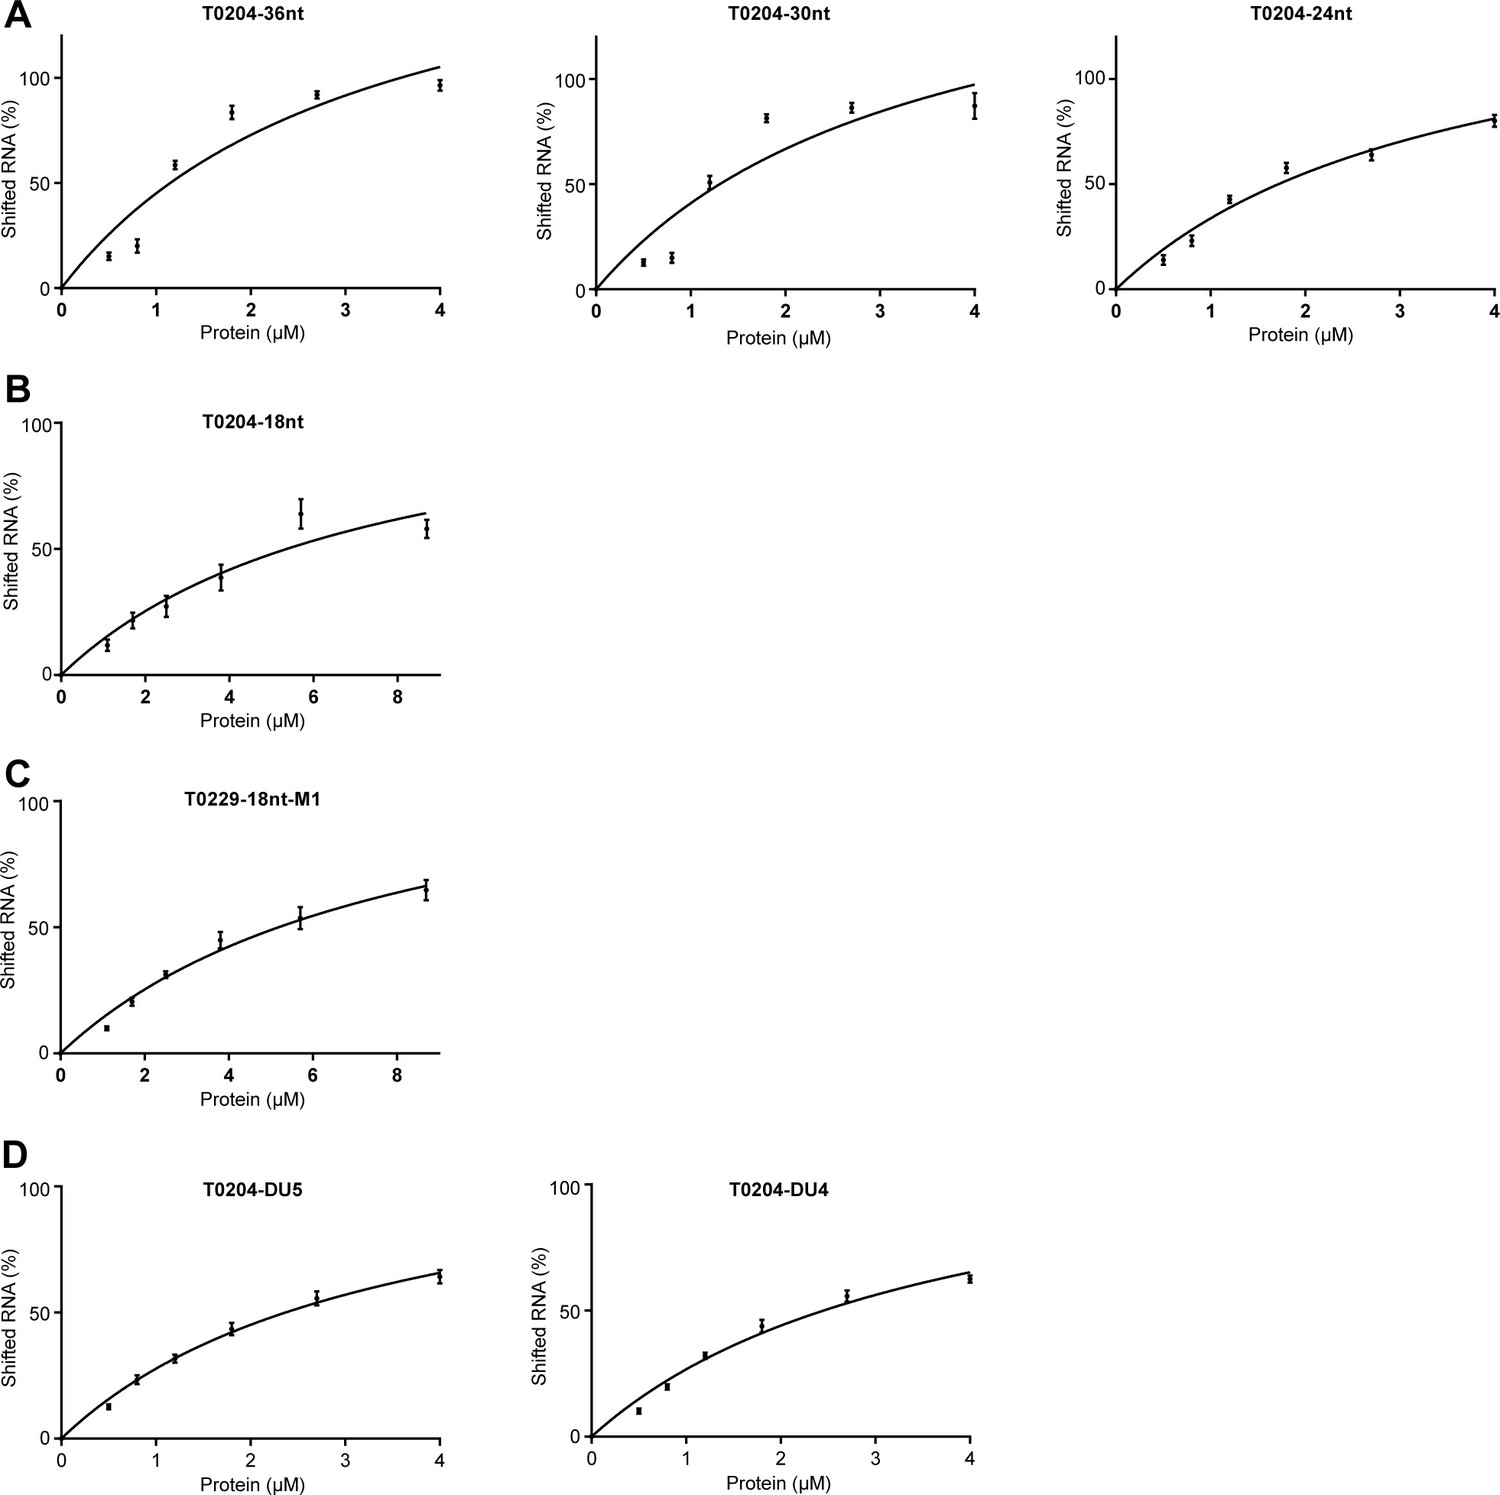
Binding curves of aCPSF1 to indicated RNAs.
The shifted RNA percentage was quantified based on quantifying the bound and unbound substrates shown in the rEMSA gels in Figure 4. The binding curves were obtained by plotting the shifted RNA (%) vs. the protein concentrations, and the Kd values were calculated based on the curve regression by the software Prism and is shown under the gels in Figure 4. All data were calculated from three independent experiments, and the average Kd and standard deviations are shown.
Figure 4—figure supplement 3
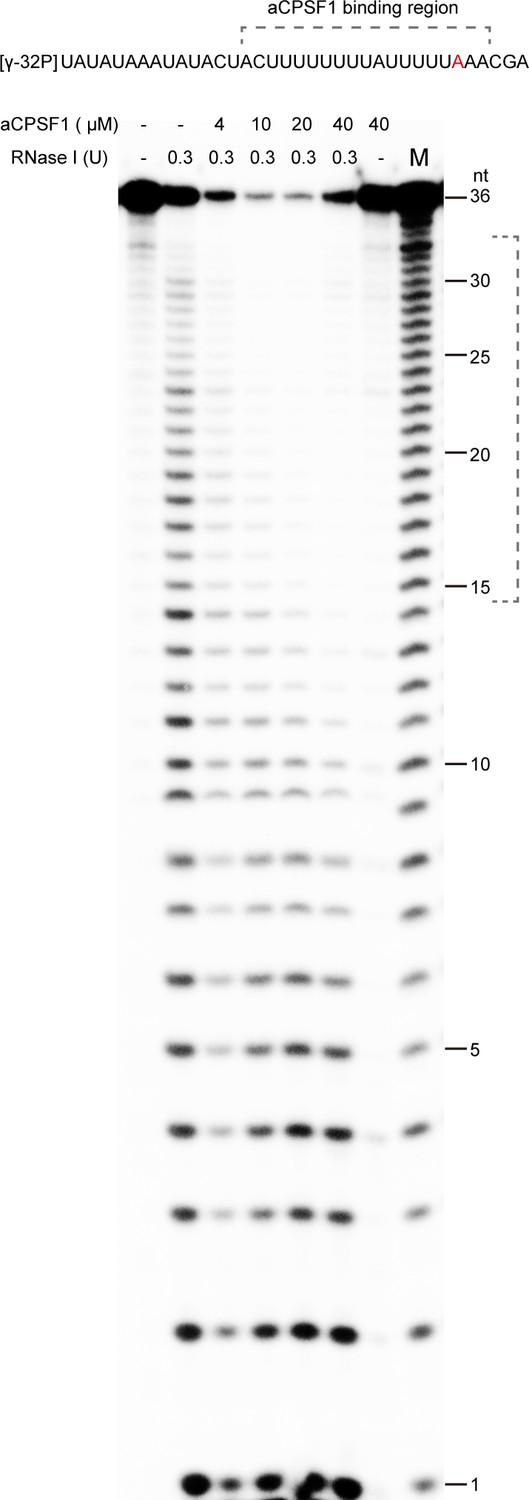
The RNase footprint assay identifies the binding region of aCPSF1 to the T0204 RNA carrying two terminator U-tracts.
The [γ-32P]-labeled RNA with the T0204 terminator sequence in length of 36 nt was digested with 0.3 U RNase I in either the absence (lanes -) or presence of the purified recombinant aCPSF1 at indicated concentrations. Dotted brackets specify the footprint region of aCPSF1 at the U-tracts.
-
Figure 4—figure supplement 3—source data 1
Includes the gel source data of Figure 4—figure supplement 3.
- https://cdn.elifesciences.org/articles/70464/elife-70464-fig4-figsupp3-data1-v1.zip
Figure 5
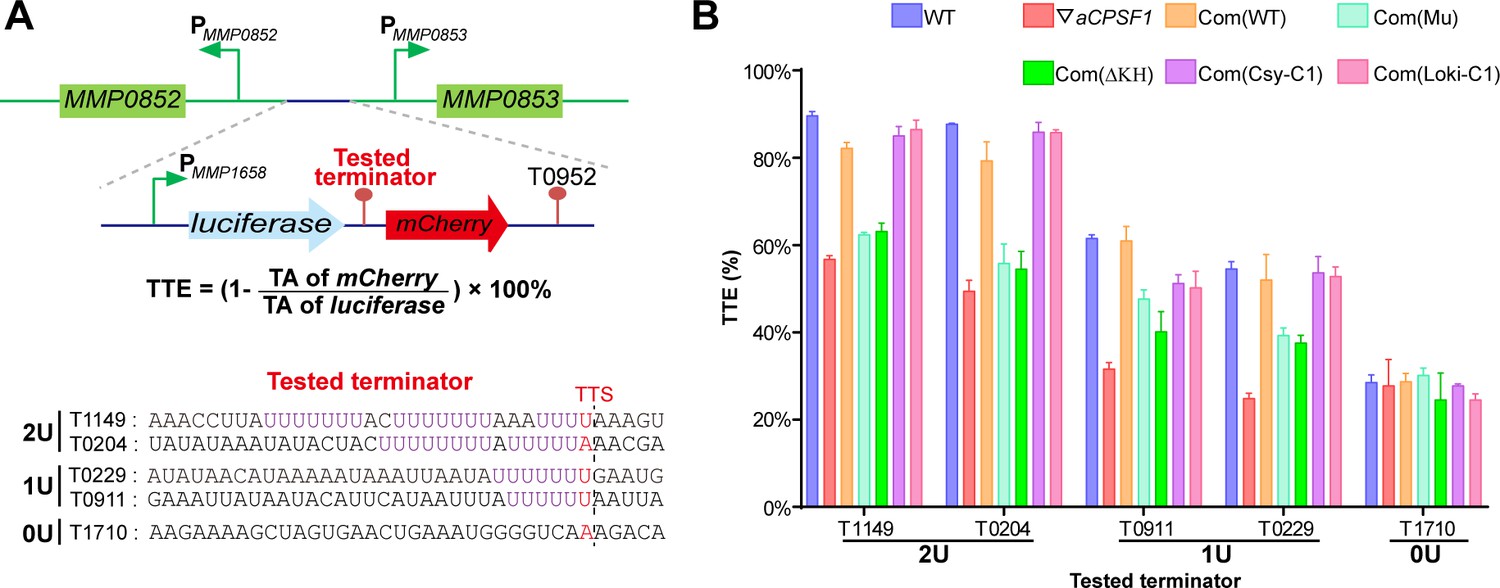
Terminator reporter system demonstrates TTE variations in co-occurrence and either absence of aCPSF1 and the terminator U-tract.
(A) Schematic depicting the construction of the terminator reporter system. The tested terminator sequences carrying different numbers of U-tracts were each inserted between the upstream luciferase and downstream mCherry genes, and then fused downstream of the MMP1658 promoter (PMMP1658) and upstream of the MMP0952 terminator (T0952). Subsequently, the constructed DNA fragment was inserted in between the promoters of MMP0852 and MMP0853 in the genomes of various strains listed in (B) through homologous recombination. The detailed protocol is described in the Materials and methods section. The formula for TTE calculation and the sequences of the tested terminators are shown below. (B) Quantitative RT-PCR was conducted to quantify the abundance of the luciferase and mCherry transcripts in various terminator constructs, which were expressed in the wild-type strain (WT), the aCPSF1 depletion mutant (▽aCPSF1), and the ▽aCPSF1 strain complemented with wild-type (Com(WT)), KH domain truncated (Com (ΔKH)), and catalytic mutated (Com(Mu)) mutants of the M. maripaludis aCPSF1 (Mmp-aCPSF1), and the aCPSF1 orthologs from Ca. Lokiarchaeum sp. GC14_75 Com(Loki-aCPSF1) and Ca. Cenarchaeum symbiosum Com(Csy-aCPSF1). The TTEs were calculated based on the formula in the middle panel of (A), and TA indicates transcription abundance. Triplicated cultures were assayed and the averages and standard derivations are shown. 2 U, 1 U, and 0 U indicate the tested terminators carrying 2 (T1149, T0204), 1 (T0911, T0229), and 0 (T1710) U4-tracts, respectively. The statistical significance of the qRT-PCR data in different genetic strains vs. WT were determined by T-test and are shown in Supplementary file 4e.
-
Figure 5—source data 1
Includes the statistic source data of Figure 5.
- https://cdn.elifesciences.org/articles/70464/elife-70464-fig5-data1-v1.xlsx
Figure 6 with 3 supplements
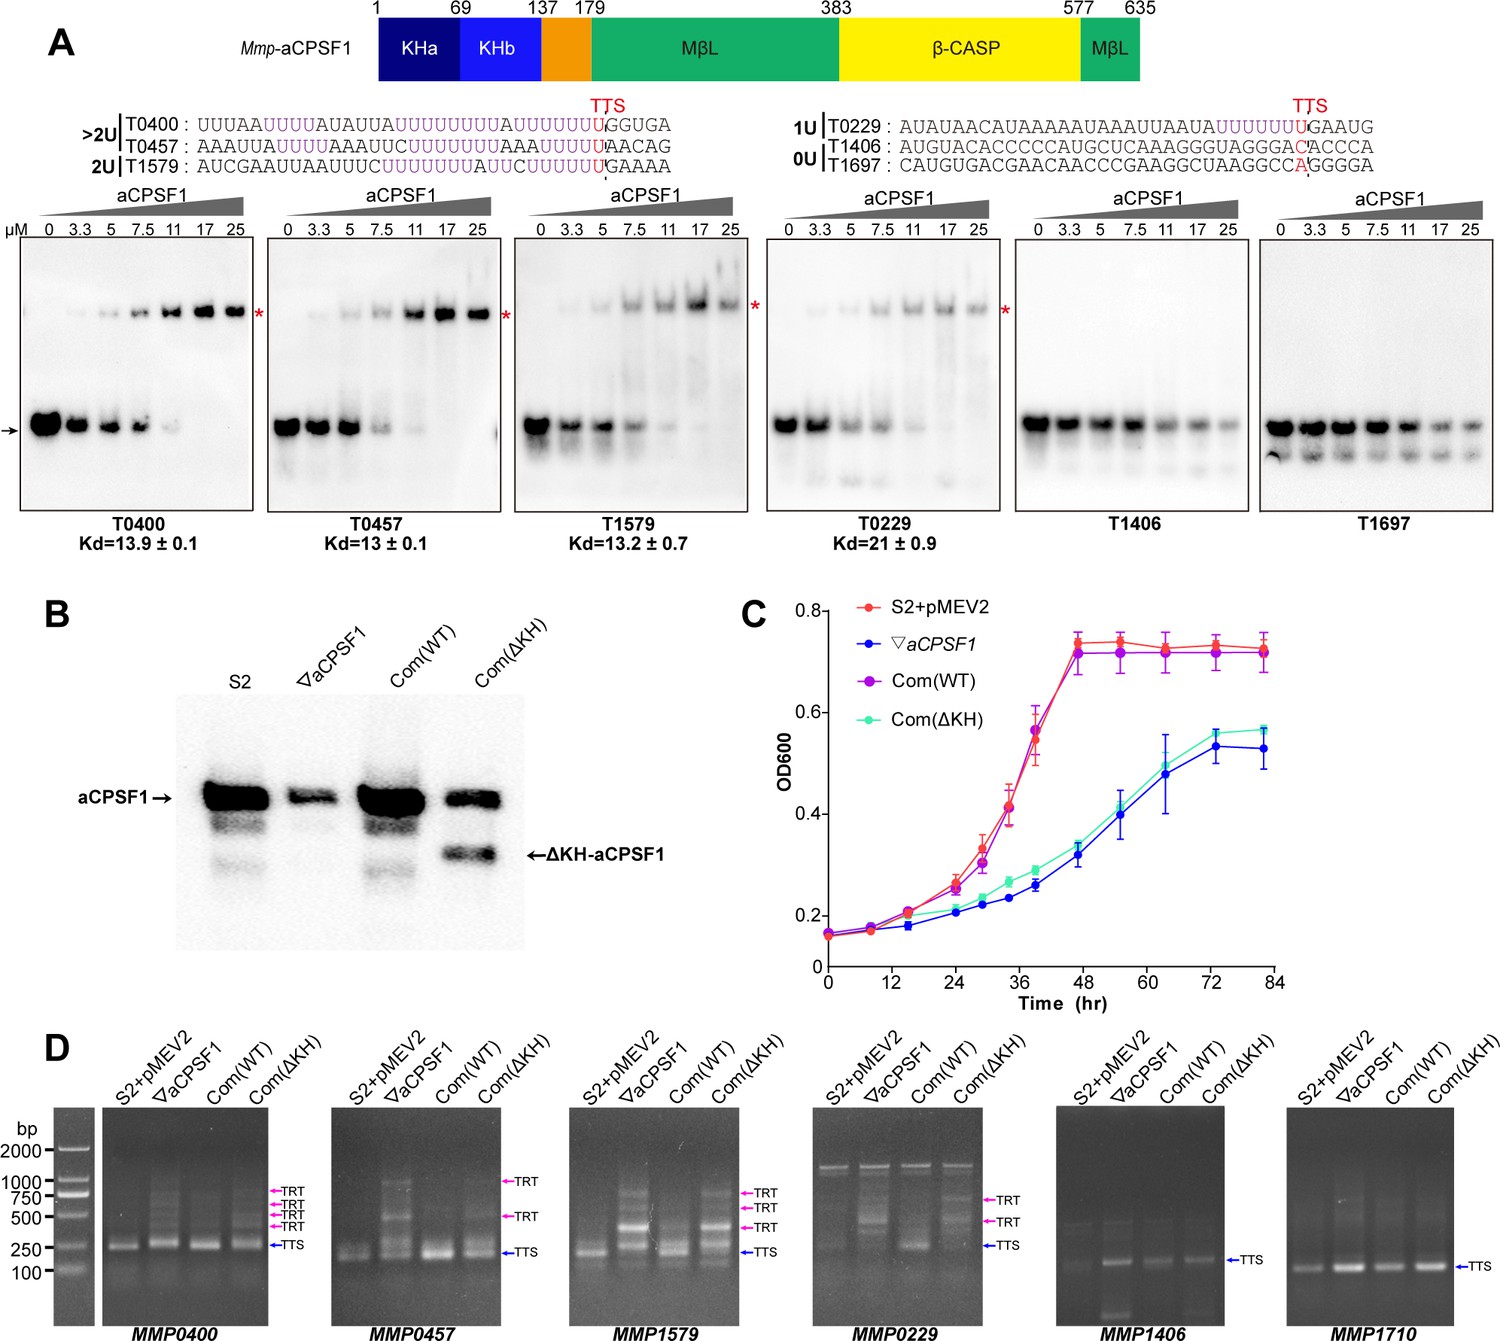
The N-terminal KH domains of aCPSF1 contribute to the binding specificity to terminator U-tracts and transcription termination.
(A) Schematic (upper panel) showing the aCPSF1 protein architecture with two N-terminal KH domains, the central MβL domain and the C-terminal β-CASP domain. rEMSA assay (lower panel) was performed to determine the binding specificity of the KH domains to the terminators carrying different numbers of U4-tract as indicated. >2 U, 2 U, 1 U, and 0 U indicate the tested RNAs carried >2, 2, 1, and 0 U4-tracts, respectively. The assayed RNA sequences are shown at the top of the gels with Term-seq identified TTSs shown in red. rEMSA was performed as in Figure 3, and the gradient concentrations of aCPSF1 KH domain are indicated. The arrows indicate free RNAs and red asterisks indicate the RNA–KH complexes. (B) Western blot demonstrates the expression of the intact and KH domain deleted aCPSF1 (aCPSF1-ΔKH) proteins in the wild-type strain S2 that carries the empty complementation plasmid of pMEV2 (S2+ pMEV2), the aCPSF1 depletion mutant (▽aCPSF1), the ▽aCPSF1 complemented with the wild-type (Com(WT)), and KH domain truncated Mmp-aCPSF1 (Com(ΔKH)). The arrows indicate the respective proteins. (C) Growths of the four strains were assayed on three batches of 22℃-grown cultures, and the averages and standard deviations are shown. (D) 3′RACE assays detected the transcriptional readthroughs (TRTs) in 22℃-grown strains using the same symbols as in (B). Blue and magenta arrows indicate the PCR products of normal terminations (TTSs) and transcriptional readthroughs (TRTs), respectively. M, a DNA ladder is shown on the left (lane M).
-
Figure 6—source data 1
Includes the gel and bolt source data of Figure 6.
- https://cdn.elifesciences.org/articles/70464/elife-70464-fig6-data1-v1.zip
-
Figure 6—source data 2
Includes the statistic source data of Figure 6C.
- https://cdn.elifesciences.org/articles/70464/elife-70464-fig6-data2-v1.xlsx
Figure 6—figure supplement 1
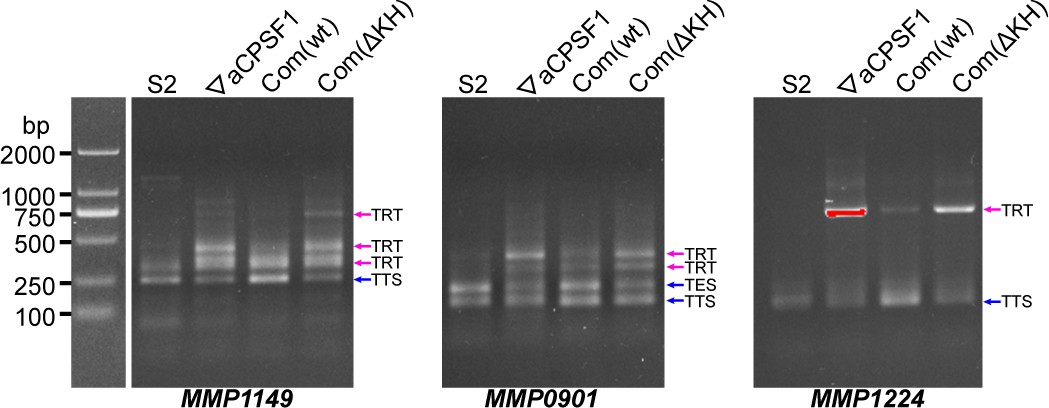
3′RACE assays detected transcriptional readthroughs (TRTs) of MMP1149, MMP0901 and MMP1224 in 22 °C -grown wild-type strain (S2), aCPSF1 depletion mutant (▽aCPSF1), and the ▽aCPSF1 complementated with the wild-type (Com(WT)) and KH domain truncated aCPSF1 (Com(ΔKH)) respectively.
Blue and magenta arrows indicate the PCR products of normal terminations (TTSs) and TRTs, respectively. A DNA ladder on the left provides references of the PCR product migrations.
-
Figure 6—figure supplement 1—source data 1
Includes the gel source data of Figure 6—figure supplement 1.
- https://cdn.elifesciences.org/articles/70464/elife-70464-fig6-figsupp1-data1-v1.zip
Figure 6—figure supplement 2
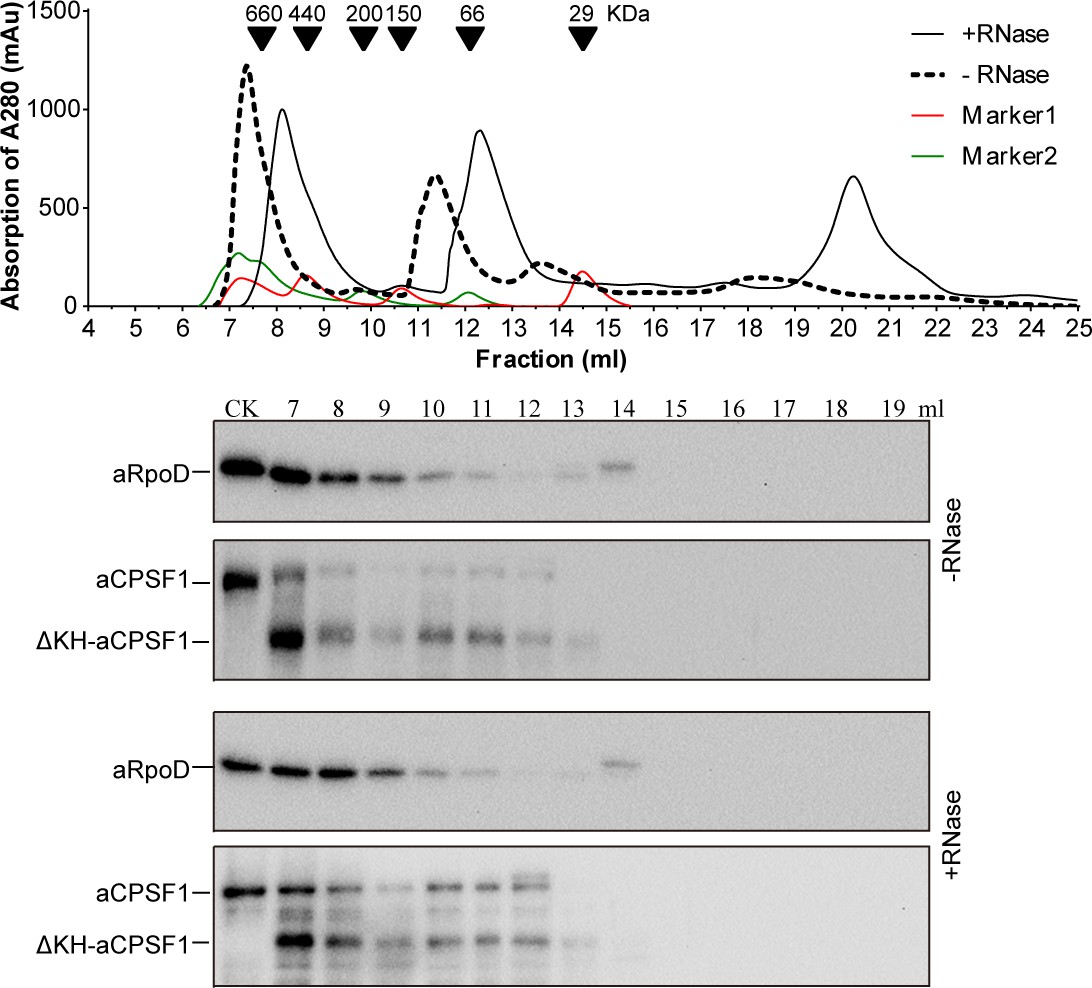
Interaction of the KH domain deleted aCPSF1 (ΔKH-aCPSF1) with RNA polymerase detected by gel filtration coupled with western blot.
Interaction of aCPSF1 and its mutant (ΔKH-aCPSF1) with the RNA polymerase were determined using the similar method as described previously (Yue et al., 2020). The co-occurrence of aCPSF1 and ΔKH-aCPSF1 with RpoD were detected in the same cell extract fractionation through size exclusion chromatography (upper) and coupled with western blot (lower).±RNase, with or without the treatment of RNase A.
-
Figure 6—figure supplement 2—source data 1
Includes the bolt source data of Figure 6—figure supplement 2.
- https://cdn.elifesciences.org/articles/70464/elife-70464-fig6-figsupp2-data1-v1.zip
Figure 6—figure supplement 3
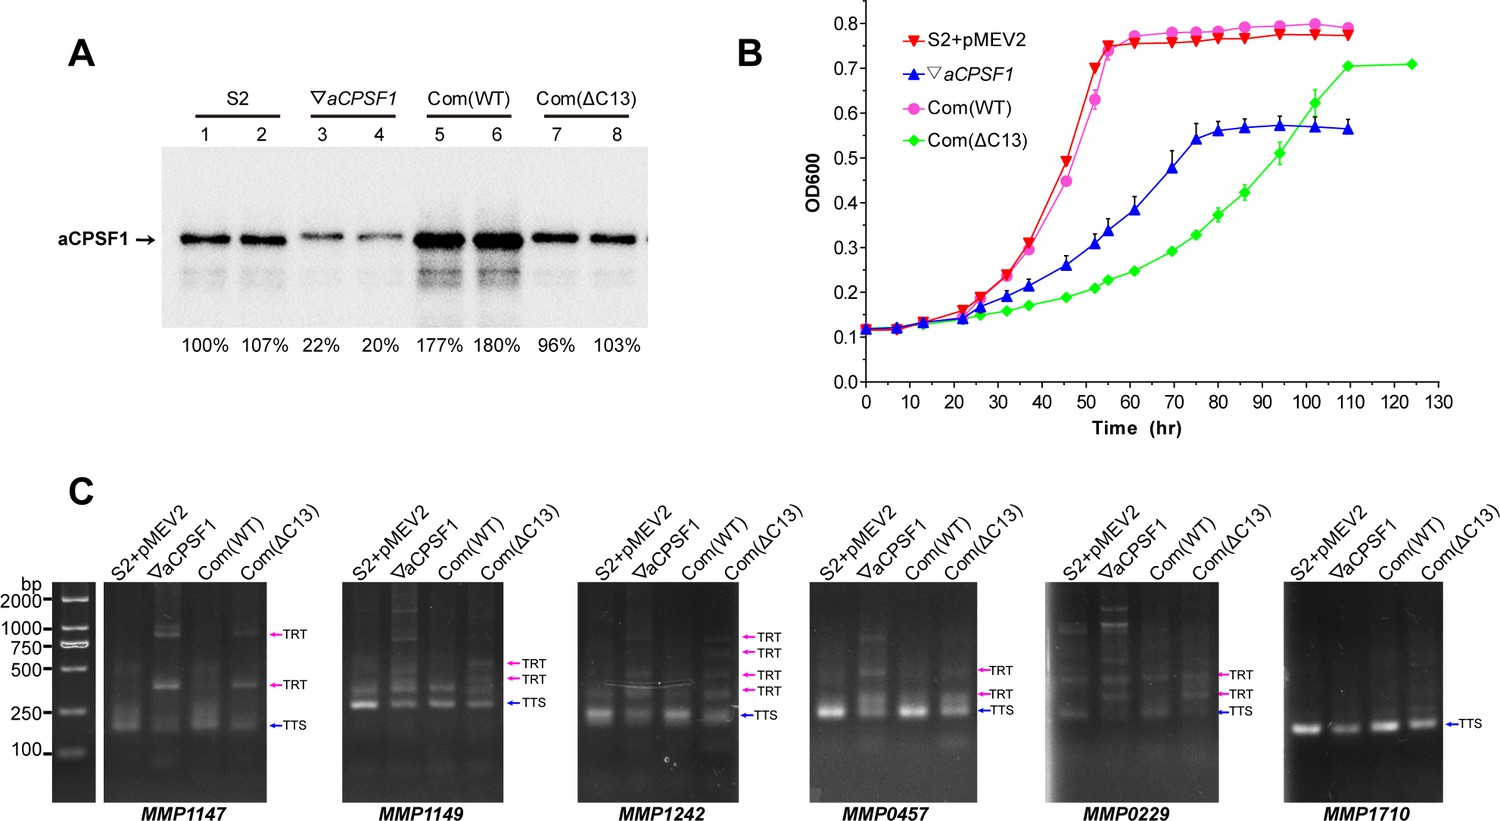
Assays that determines the vital role of the dimerization of aCPSF1 in transcription termination.
(A) Western blot assays demonstrate the expressions of the intact and C-terminal 13 residues truncated aCPSF1 in the wild-type strain S2 carrying the empty complementation plasmid of pMEV2 (S2+ pMEV2), the aCPSF1 depletion mutant (▽aCPSF1), and the ▽aCPSF1 strain complemented with the wild-type (Com(WT)) and C-terminal 13 residue truncated Mmp-aCPSF1 (Com (ΔC13)) respectively. Arrows indicate the respective proteins. (B) Growth of the four strains was assayed on three batches of 22℃-grown cultures, and the averages and standard deviations are shown. (C) 3′RACE detected the transcriptional readthroughs (TRTs) in 22℃-grown strains with the same symbols as in (A). Blue and magenta arrows indicate the PCR products of normal terminations (TTSs) and TRTs, respectively. M, a DNA ladder is shown on the left (lane M).
-
Figure 6—figure supplement 3—source data 1
Includes the bolt and gel source data of Figure 6—figure supplement 3A and C.
- https://cdn.elifesciences.org/articles/70464/elife-70464-fig6-figsupp3-data1-v1.zip
-
Figure 6—figure supplement 3—source data 2
Includes the statistic source data of Figure 6—figure supplement 3B.
- https://cdn.elifesciences.org/articles/70464/elife-70464-fig6-figsupp3-data2-v1.xlsx
Figure 7
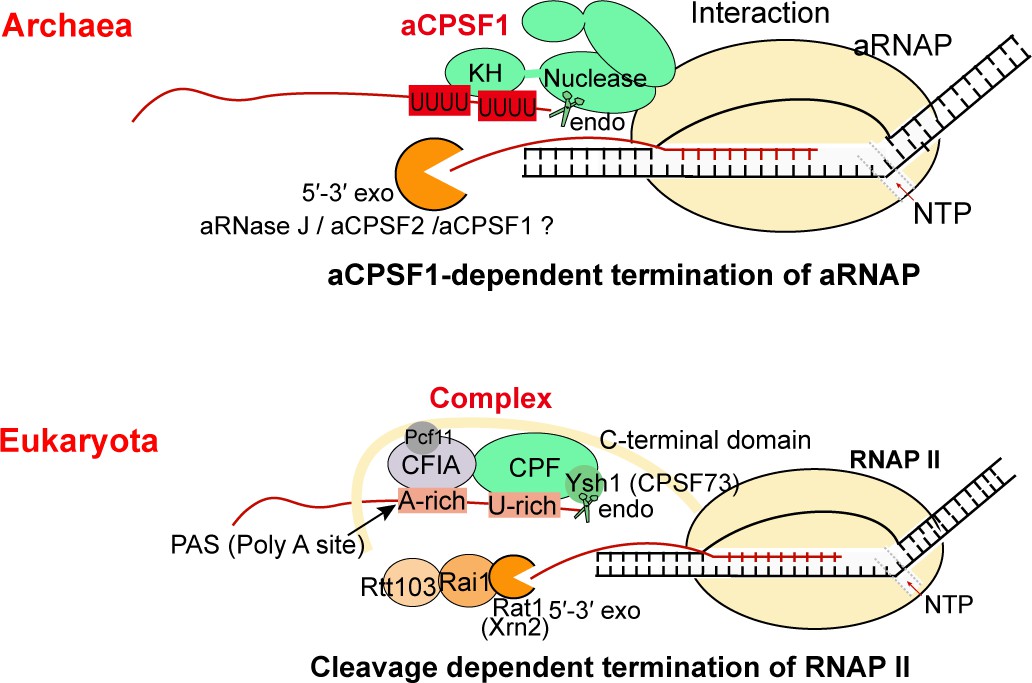
The aCPSF1-dependent archaeal transcription termination represents the archetype of the eukaryotic RNAP II termination mode.
The general archaeal transcription termination factor aCPSF1, relying on the N-terminal KH domains specifically recognizing the terminator U-tract and the nuclease domain cleaving at the 3′-end, triggers transcription termination of archaeal RNA polymerase (aRNAP) (upper panel). The representative budding yeast RNAP II transcription termination model (Kuehner et al., 2011; Porrua et al., 2016; Porrua and Libri, 2015) is shown in the lower panel.
Additional files
-
Supplementary file 1
Termseq identified TTSs and the read ratios of 1 to TTS 1 in M. maripaludis S2 and ▽aCPSF1.
- https://cdn.elifesciences.org/articles/70464/elife-70464-supp1-v1.xlsx
-
Supplementary file 2
The TTEs and TQRRs of primary TTSs.
- https://cdn.elifesciences.org/articles/70464/elife-70464-supp2-v1.xlsx
-
Supplementary file 3
The TTEs of TTSs for noncoding RNAs in the wild type S2 and ▽aCPSF1 mutant.
- https://cdn.elifesciences.org/articles/70464/elife-70464-supp3-v1.xlsx
-
Supplementary file 4
Includes Supplementary file 4a-4e.
- https://cdn.elifesciences.org/articles/70464/elife-70464-supp4-v1.docx
-
Transparent reporting form
- https://cdn.elifesciences.org/articles/70464/elife-70464-transrepform1-v1.docx
Download links
A two-part list of links to download the article, or parts of the article, in various formats.
Downloads (link to download the article as PDF)
Open citations (links to open the citations from this article in various online reference manager services)
Cite this article (links to download the citations from this article in formats compatible with various reference manager tools)
aCPSF1 cooperates with terminator U-tract to dictate archaeal transcription termination efficacy
eLife 10:e70464.
https://doi.org/10.7554/eLife.70464


