From Gondwana to the Yellow Sea, evolutionary diversifications of true toads Bufo sp. in the Eastern Palearctic and a revisit of species boundaries for Asian lineages
- Laboratory of Animal Behaviour and Conservation, College of Biology and the Environment, Nanjing Forestry University, China
- Department of Life Sciences and Division of EcoScience, Ewha Womans University, Republic of Korea
- Institute of Cytology, Russian Academy of Sciences, Russian Federation
- Federal Scientific Center of the East Asia Terrestrial Biodiversity Far Eastern Branch of Russian Academy of Sciences, Russian Federation
- Department of Ecology and Evolutionary Biology, University of Toronto, Canada
- Herpetology and Applied Conservation Laboratory, College of Biology and the Environment, Nanjing Forestry University, China
- CIBIO/InBIO (Centro de Investigação em Biodiversidade e Recursos Genéticos), Universidade do Porto, Portugal
- Graduate School of Human and Environmental Studies, Kyoto University, Japan
- Tokyo University of Agriculture and Technology, Japan
- Department of Life Sciences and Research Center for Global Change Biology, National Chung Hsing University, Taiwan
- Department of Life Science, Chinese Culture University, Taiwan
- Department of Life Sciences and Systems Biology, University of Turin, Italy
Figures
Figure 1 with 1 supplement
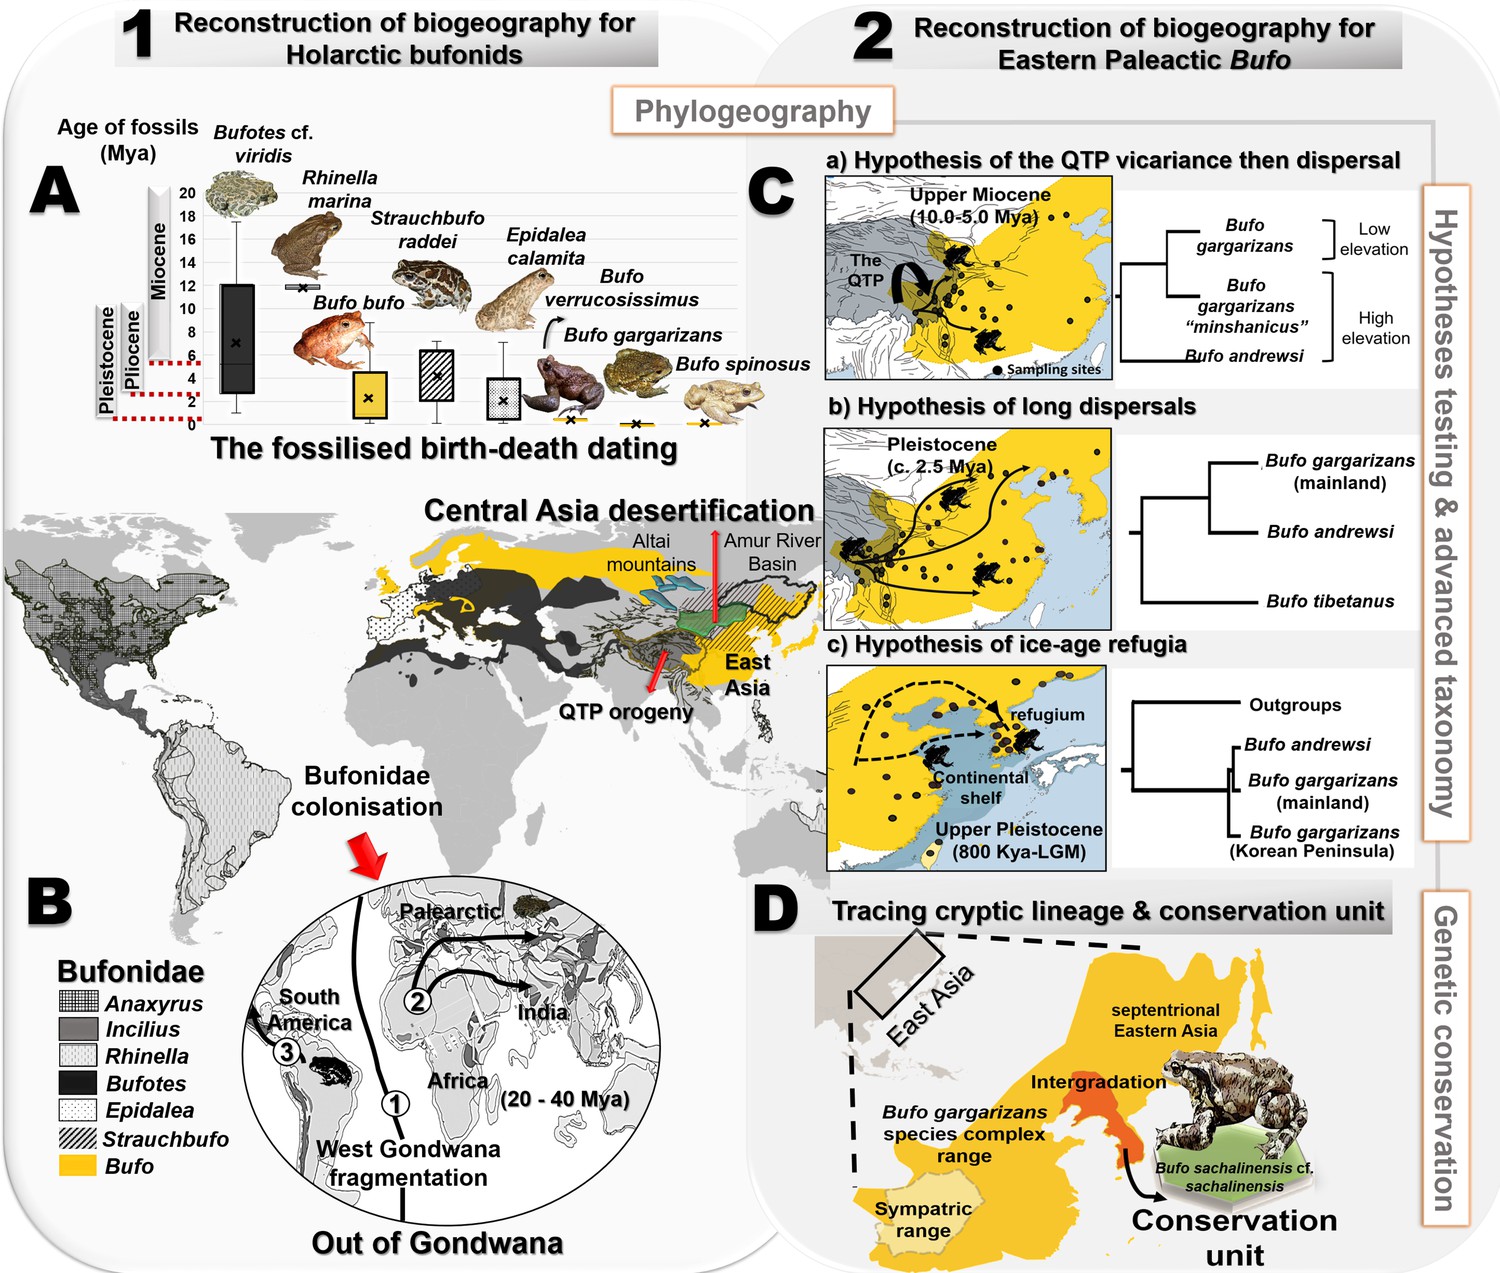
Resolution of the diversifications of bufonids in the Holarctic and the Eastern Palearctic.
(A) Dating of the species tree of Holarctic bufonids, refined using the fossilized birth-death method. Here, the box plots represent the age range of fossils for each focal species. (B) Hypothesized dispersal pathways of genus Bufo in the Palearctic based on the Gondwana origin and central Asia desertification hypotheses. The map displays the range of the bufonids genera used in the dating analyses. (C) Molecular dating estimates and ancestral range reconstruction addressing three phylogeographic hypotheses derived from Macey et al., 1998, Fu et al., 2005 and Borzée et al., 2017 to elucidate the evolutionary history of East Asian Bufo. (D) Retracing the hidden diversity in the Bufo gargarizans species complex in East Asia and determining taxonomic and conservation units.
Figure 1—figure supplement 1
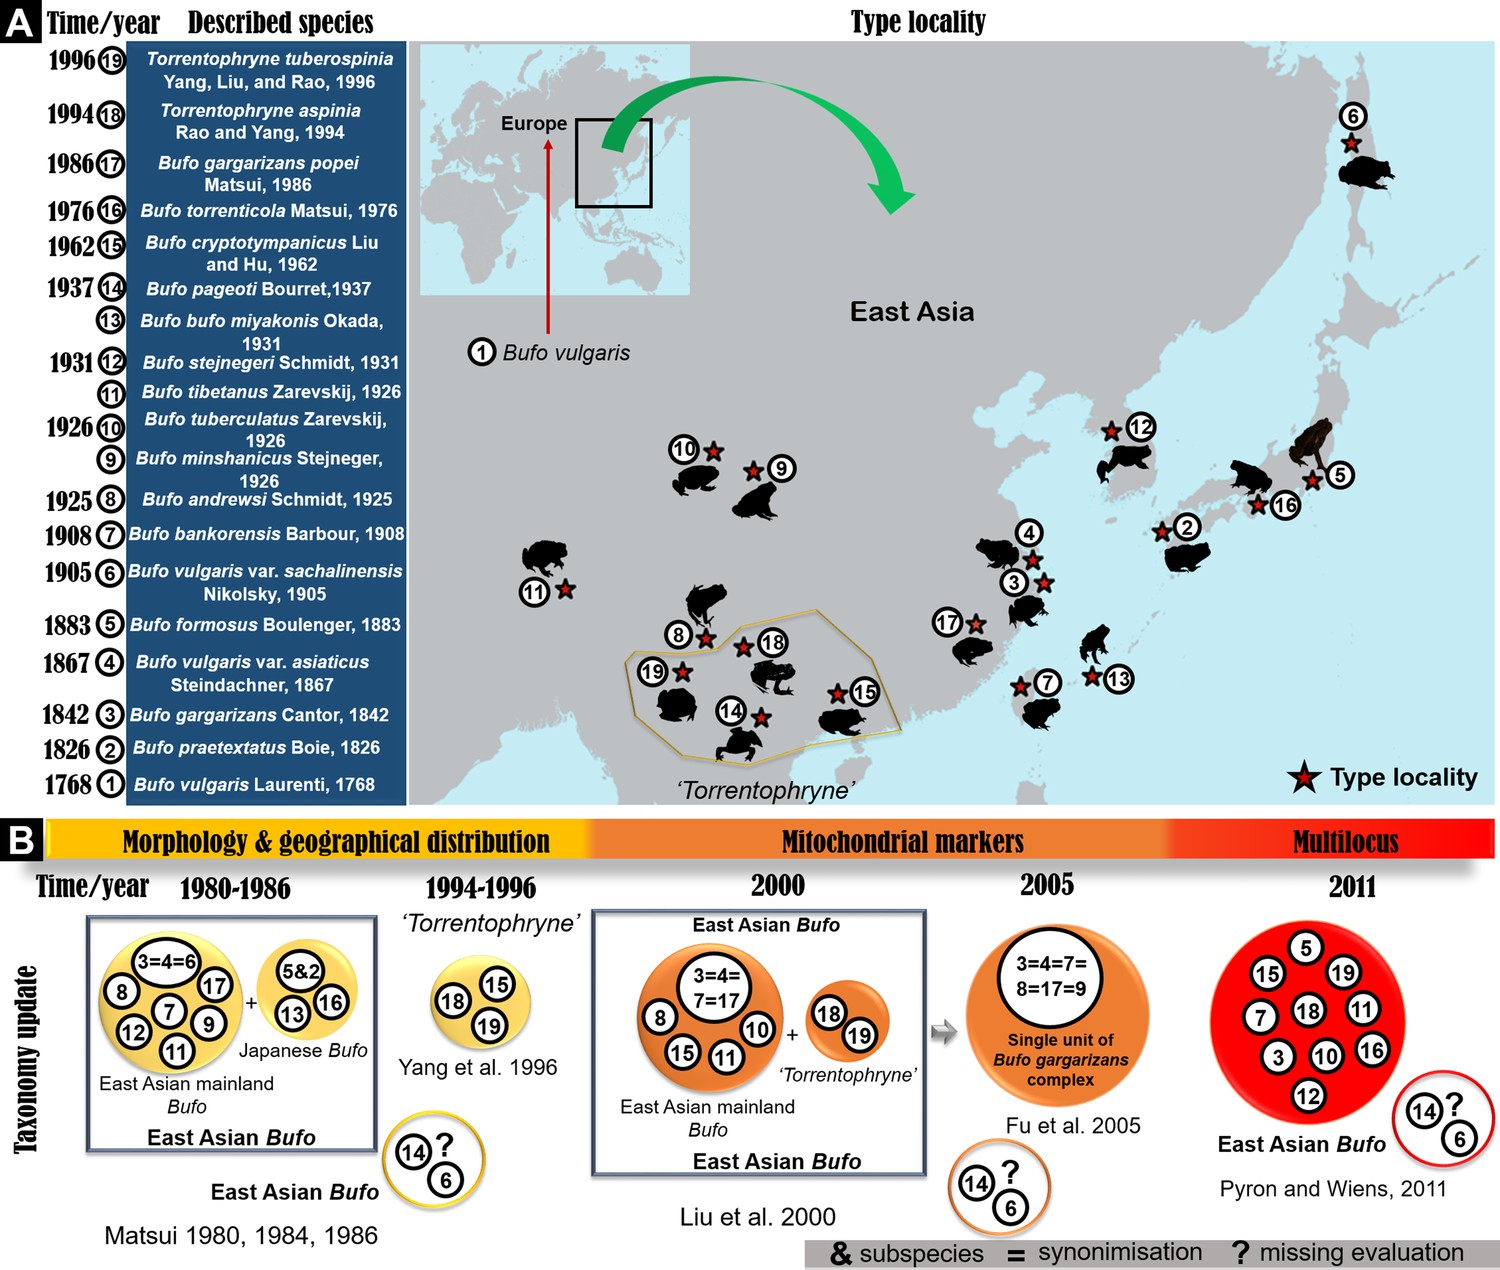
Chronology of species description in the East Asian Bufo genus and timeline of taxonomy updates.
(A) The map indicates the location of the type locality for each described Bufo taxa in East Asia since the 18th century. (B) The timeline of taxonomic revisions recorded in the literature using various approaches on East Asian Bufo since 1980.
Figure 2 with 1 supplement
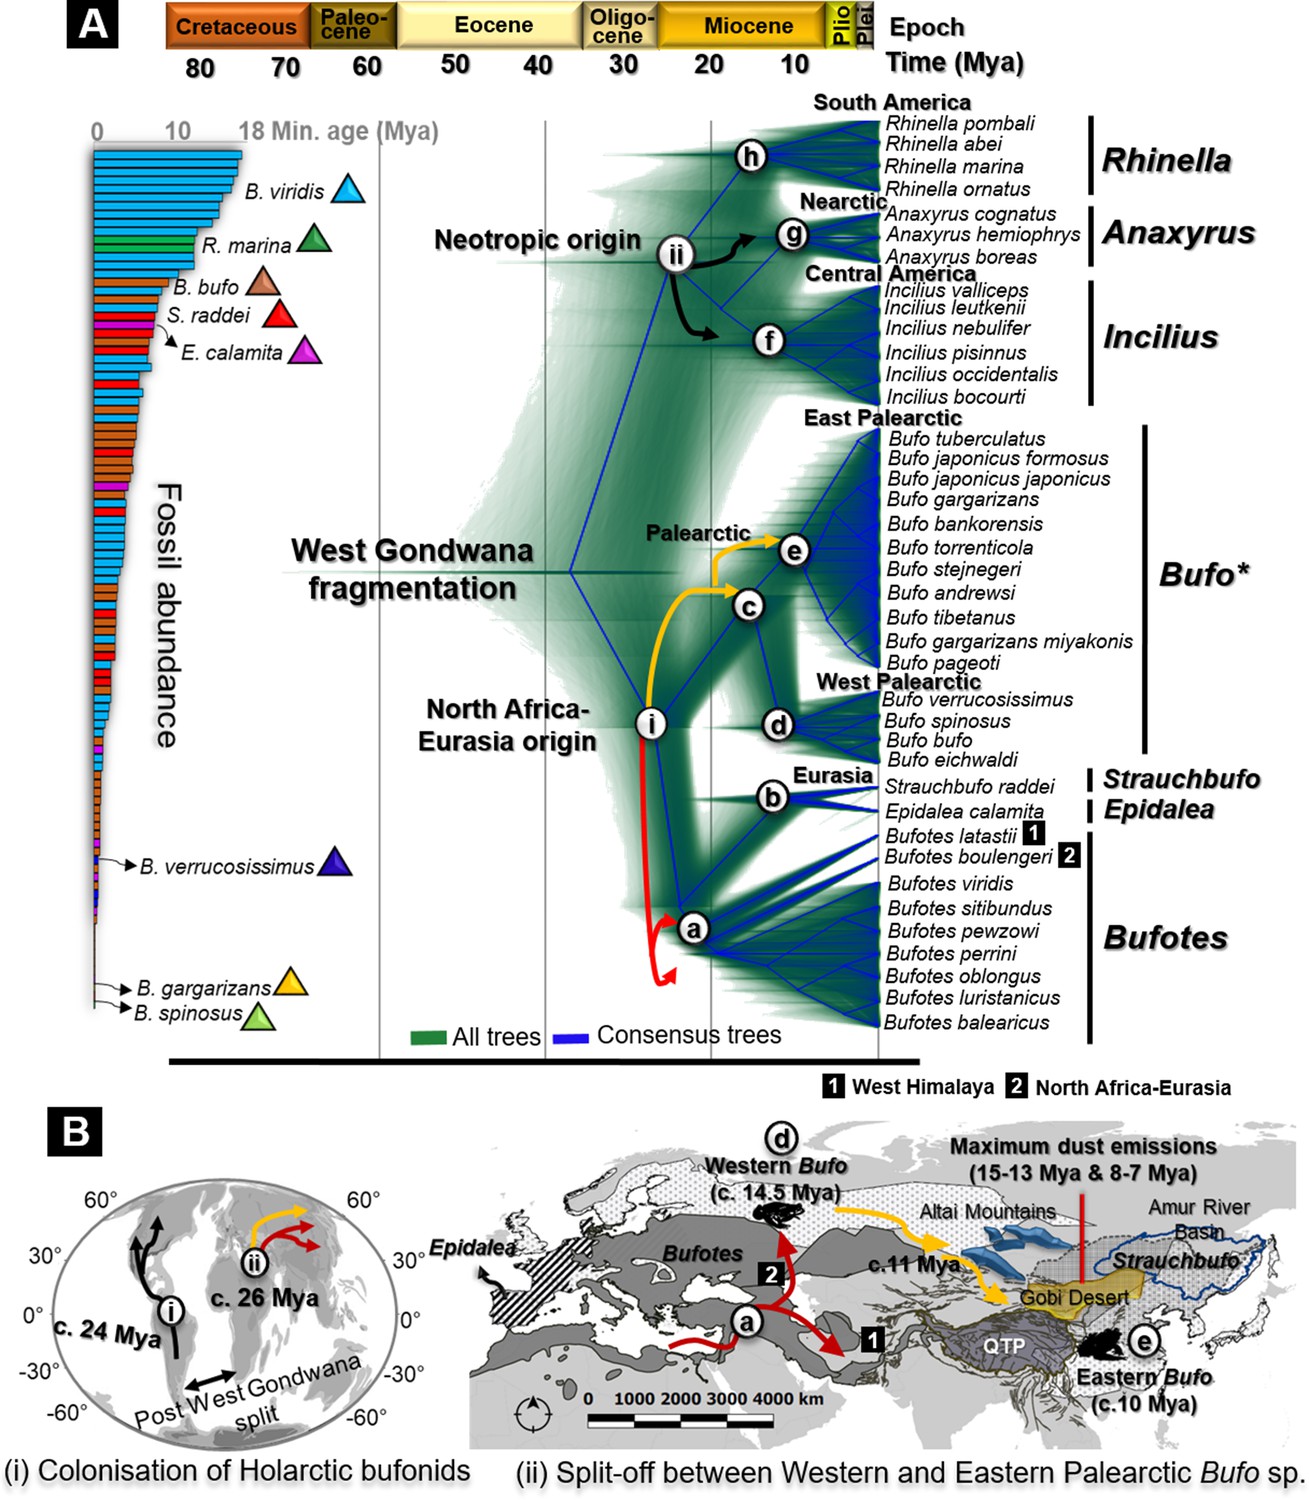
Fossils used for calibration and molecular dating of Holarctic Bufonidae.
(A) Fossilized birth-death species trees for 39 Holarctic bufonids characterized from the unlinked multi-locus CR-16S-ND2-CXCR4-POMC-RAG1-Rho with an abundance of fossils representative of the six genera of Bufonidae used as source of primary calibrations. The captions (i) and (ii) on the tree are geographically explained in (B), representing the hypothesized dispersal pathways of Holarctic bufonids and Bufo spp. in the Palearctic. Similarly, the letter-coded branches of the trees are marked on the map. The map displays the range of bufonids genera with relevant natural features in Central Asia. Black, red, and yellow arrows in dated trees and maps indicate the dispersal pathways predicted for neotropic bufonids, Bufotes, and Bufo in the Palearctic, respectively.
Figure 2—figure supplement 1
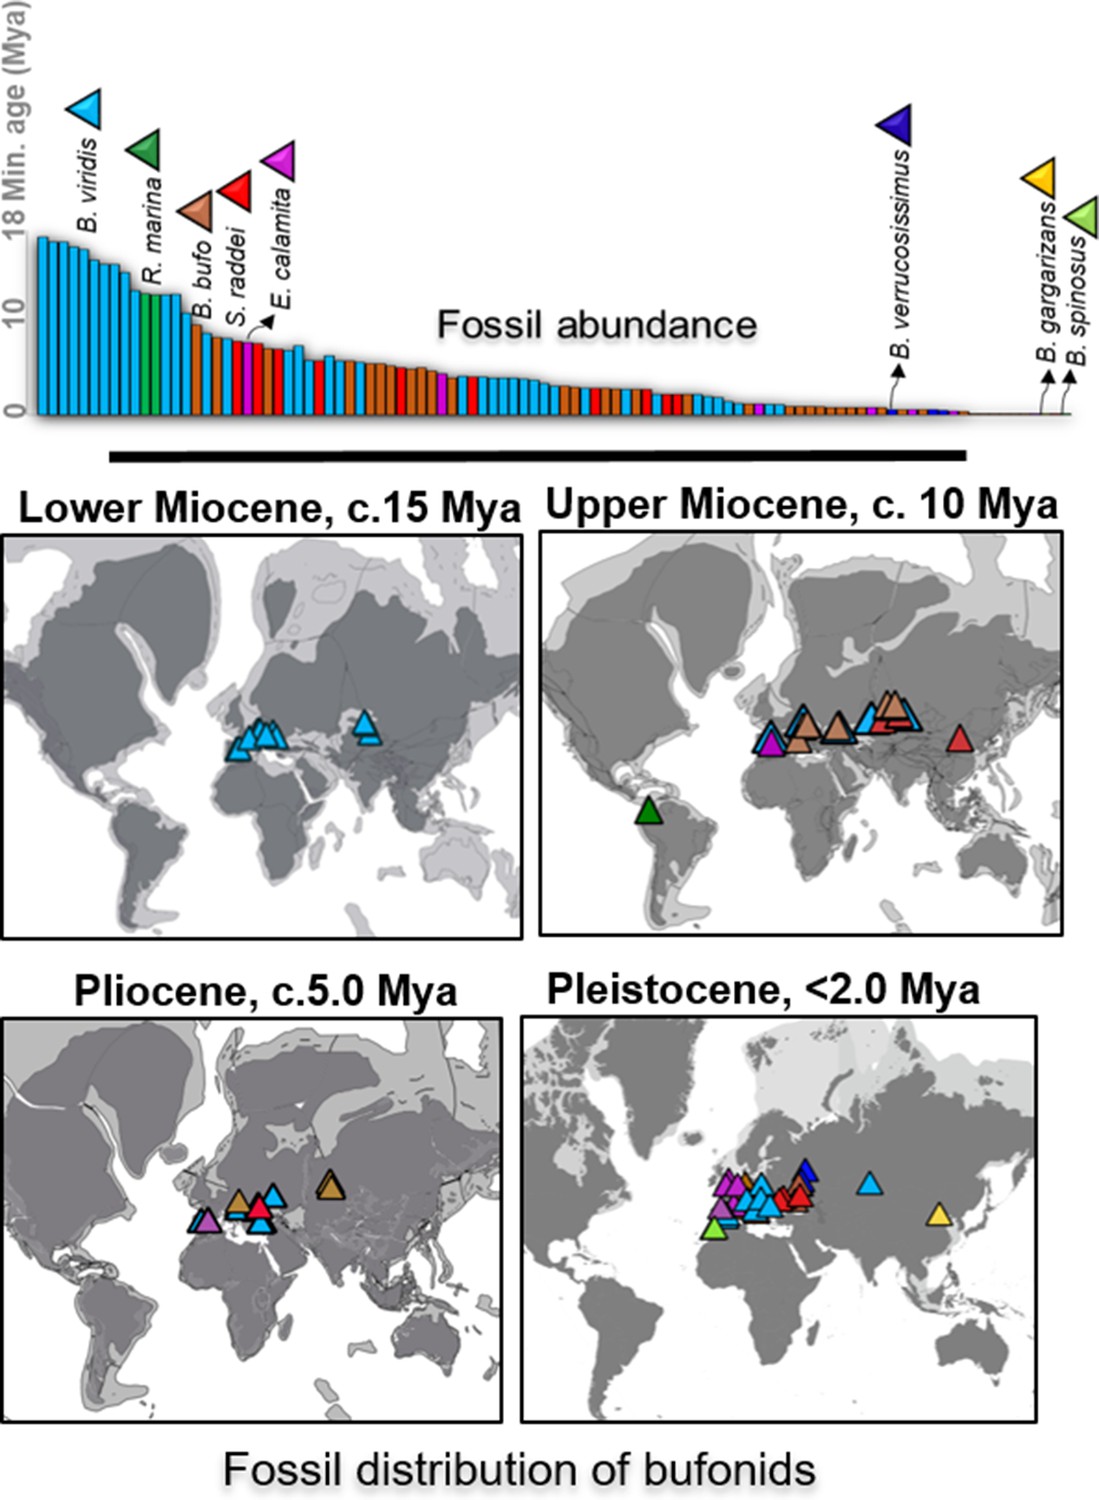
Fossil abundance and distribution of Holarctic bufonids.
The record of fossil distribution is retrieved from the open database FosFARbase (Böhme and Ilg, 2003) and the distribution of bufonids fossil embedded with the global paleomap of Early Miocene to Pleistocene modeled by Cao et al., 2019, (Matthews et al., 2016) and Ray et al., 2001 for molecular dating using fossilized birth-death method. The species with fossil records in the bar chart are represented by different colors and match with the color of fossils site in the maps.
Figure 3 with 1 supplement
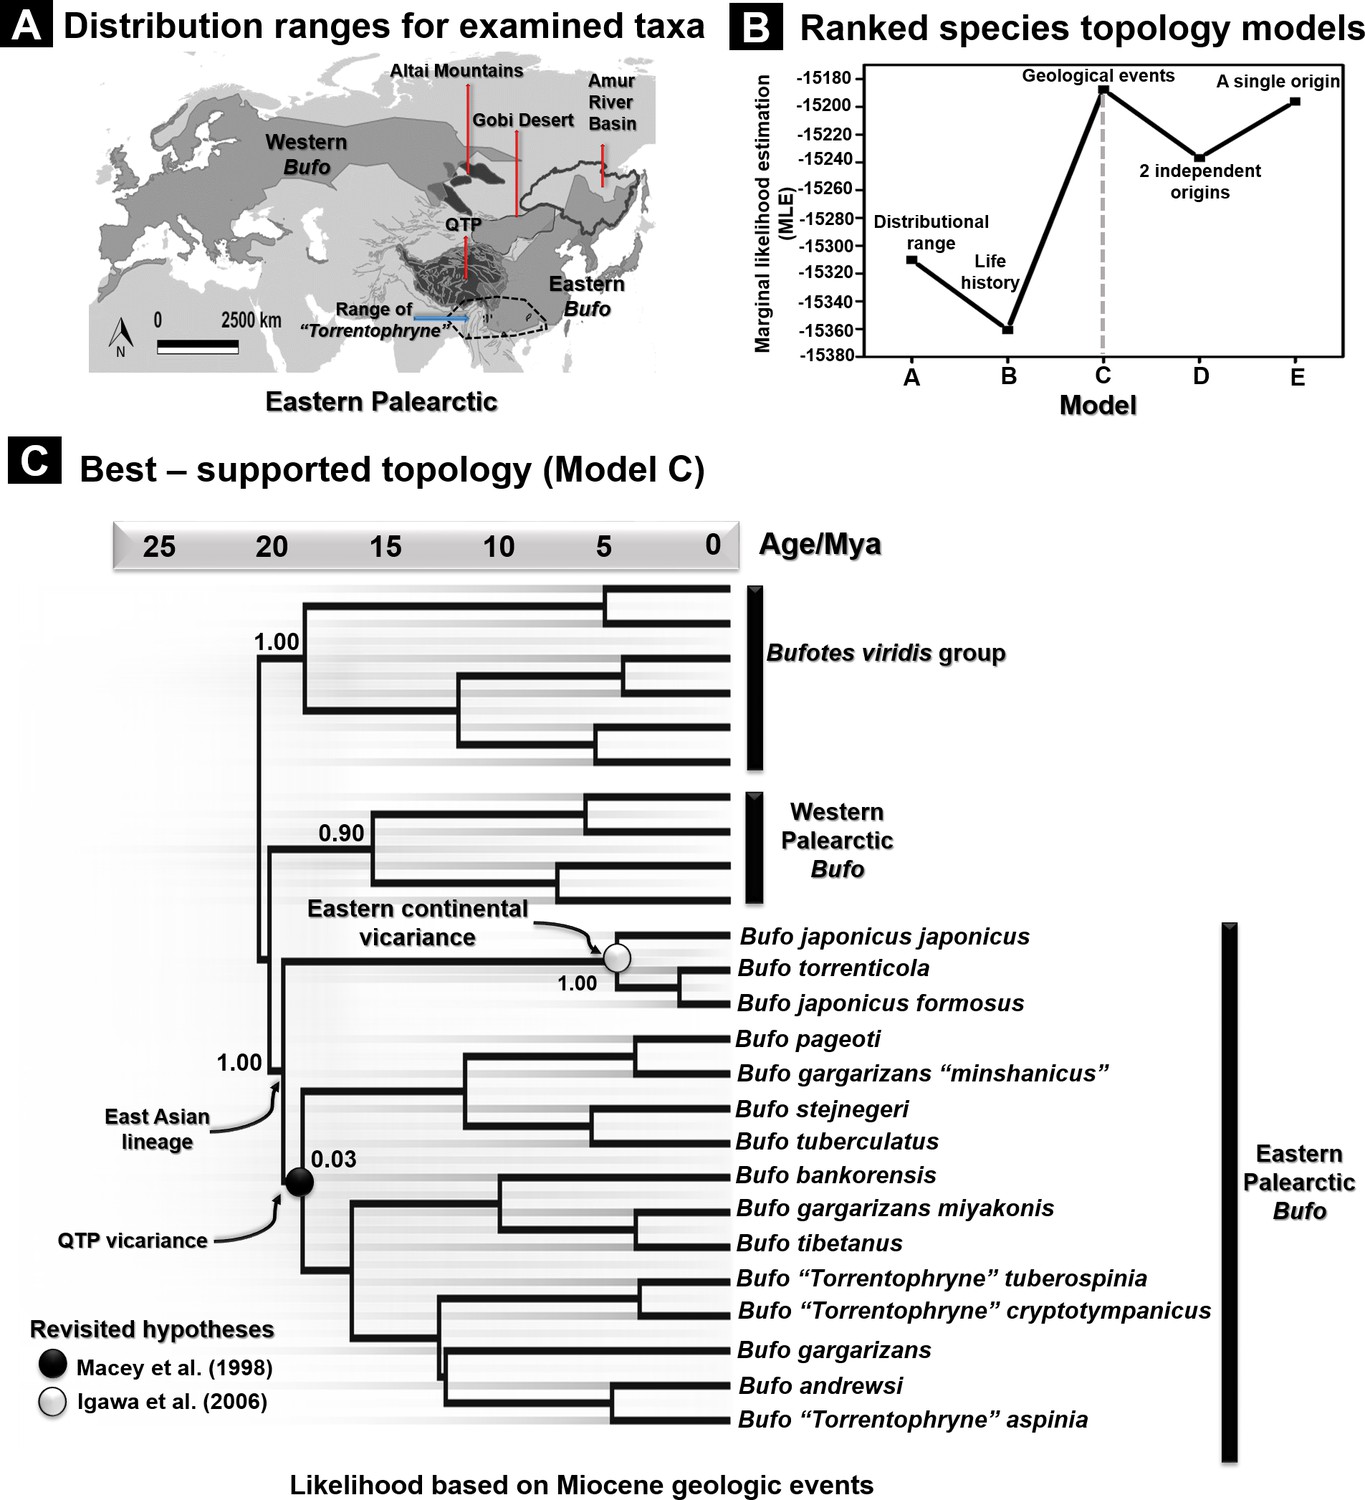
Species tree topology estimates based on hypotheses for 26 recognized Palearctic bufonids.
(A) Geographic range of the Palearctic Bufo genus and related ‘Torrentophryne’ species included in the reconstruction of the species tree. (B) Ranking of the topology models for the species tree examined using nested sampling analyses. (C) Best-supported topology on dated species trees reconstructed from the unlinked multilocus data (CR-16S-ND2-CXCR4-POMC-RAG1-Rho) under a relaxed clock and Yule prior. Each model tree (models A–E) represents the hypothesis tested for the tree topology with the rank of its likelihood based on the marginal likelihood estimation (MLE) values. The geology driven factor (model C) was selected to be the most accurate scenario for the species tree topology due to the highest value of MLE.
Figure 3—figure supplement 1
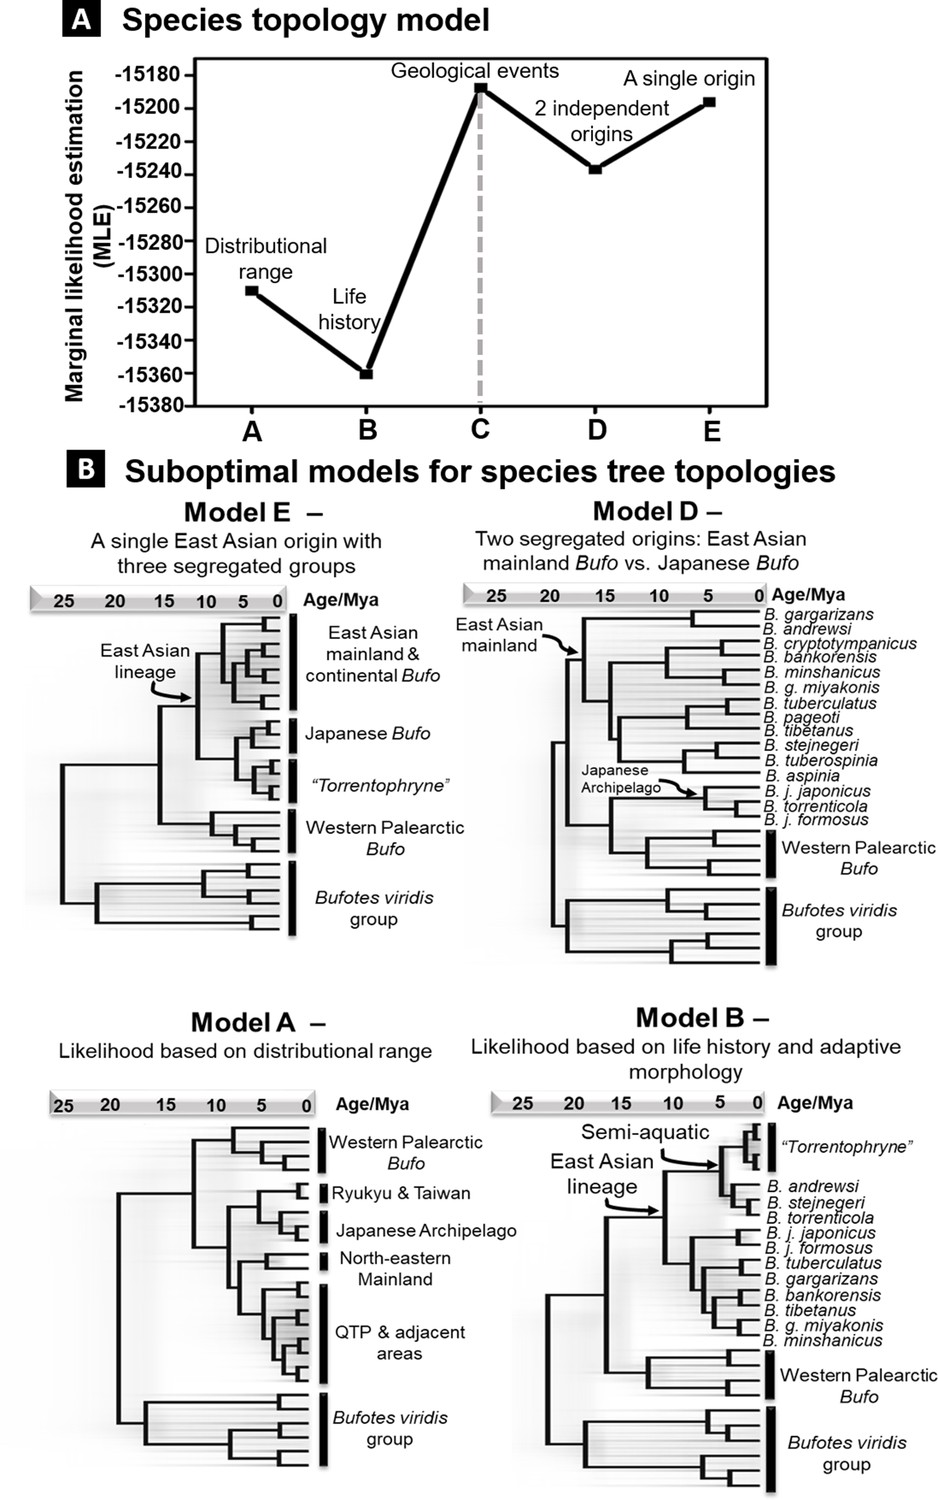
Alternative models of species tree topologies for Palearctic Bufo.
Each model is tested with nested sampling analyses and support is based on the MLE values. (A) Rank of support for tree topologies tested on different hypotheses. (B) The four suboptimal models here have lower MLE values than the best-supported model C in Figure 3. MLE. marginal likelihood estimation.
Figure 4 with 2 supplements
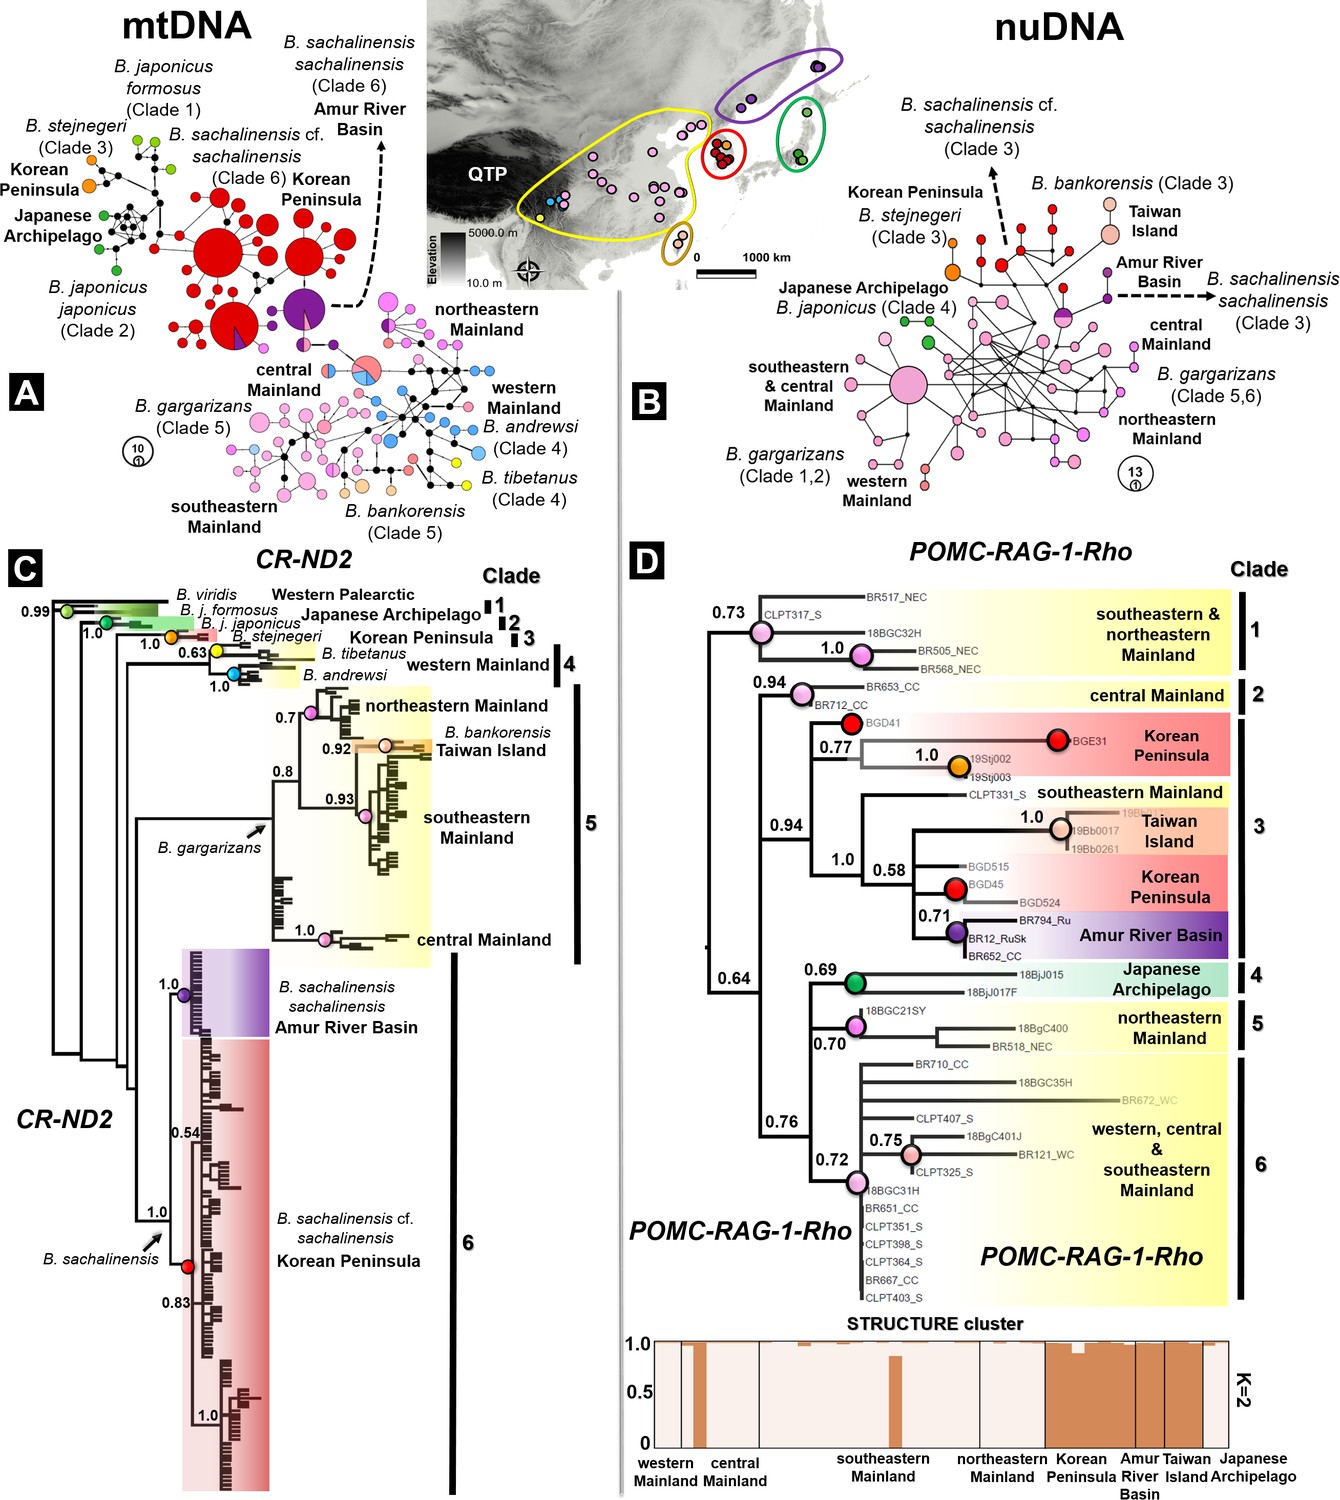
Discordance in phylogenetic and haplotype relationships of the Bufo genus in East Asia inferred from mtDNA and nuclear protein coding.
(A) Median joining network based on mtDNA CR-ND2 (894 bp) obtained from 221 individuals. (B) Phylogenetic relationships inferred from the same data set of concatenated mtDNA CR-ND2. (C) Haplotype relationship of 44 individuals of East Asian Bufo derived from diploid data (nuclear POMC-RAG-1-Rho; 1030 bp). The discordance in topology between the mitochondrial and nuclear trees is detailed in Table 2. (D) Phylogenetic relationship and population clustering inferred from SNP of the nuclear protein coding analyzed in STRUCTURE and CLUMPP (see Supplementary file 1F for details about the populations). The color code used in the map of East Asia matches with the colors coded for each particular clade and haplotype group.
Figure 4—figure supplement 1

The tests of isolation by distance on Bufo distributed in the Eastern Asia.
(A) Mantel test for mitochondrial CR-ND2 (N individual =224, N population =13). (B) Mantel test for nuclear POMC-RAG-1-Rho (N=49, N population =9).
Figure 4—figure supplement 2
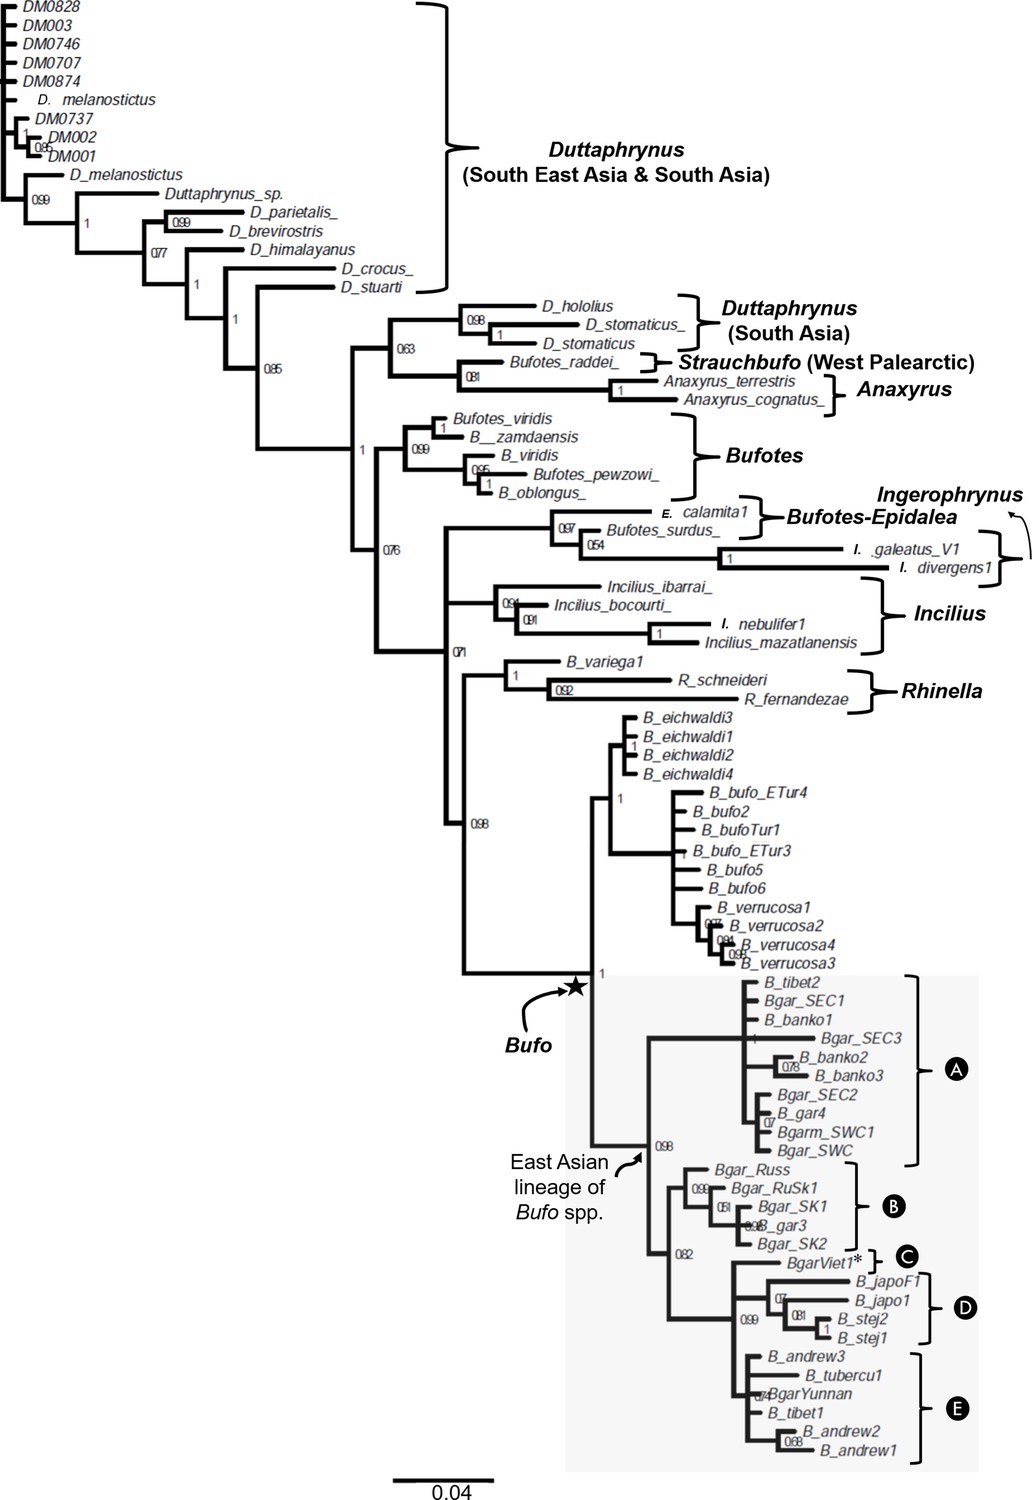
The phylogenetic relationship between Bufonidae with emphasis on East Asian Bufo lineage inferred on partial 16S rRNA gene fragment.
The gray shaded box highlights the paraphyletic of the placement of Bufo gargarizans sampled in Vietnam (Clade C) in a different subclade segregated from the low-elevated B. gargarizans clades from Eastern Mainland (Clade A) and the septentrional East Asia (Clade B). The name of each taxon in tree represents the names of sampled individuals.
Figure 5

Dated phylogeny and biogeography patterns of Bufo in the Eastern Palearctic.
(A) Hypothesized dispersal pathways for Bufo in the Eastern Palearctic. (B) Dated Maximum Clade Credibility (MCC) tree, ancestral ranges reconstruction, and colonization history for Palearctic bufonids inferred from the linked mtDNA CR-ND2 (N individuals =132). The dispersal pathways illustrated indicate two Miocene vicariance events for the MRCA of East Asian Bufo (A1–A2) and the routes hypothesized to have been followed by the B. gargarizans complex for dispersion through the Asian mainland (A3). The Miocene tectonic plates models and the Tibetan-Himalayan mapping were both retrieved from established data sets (refer to Supplementary file 1O) and projected to this paleomap.
Figure 6
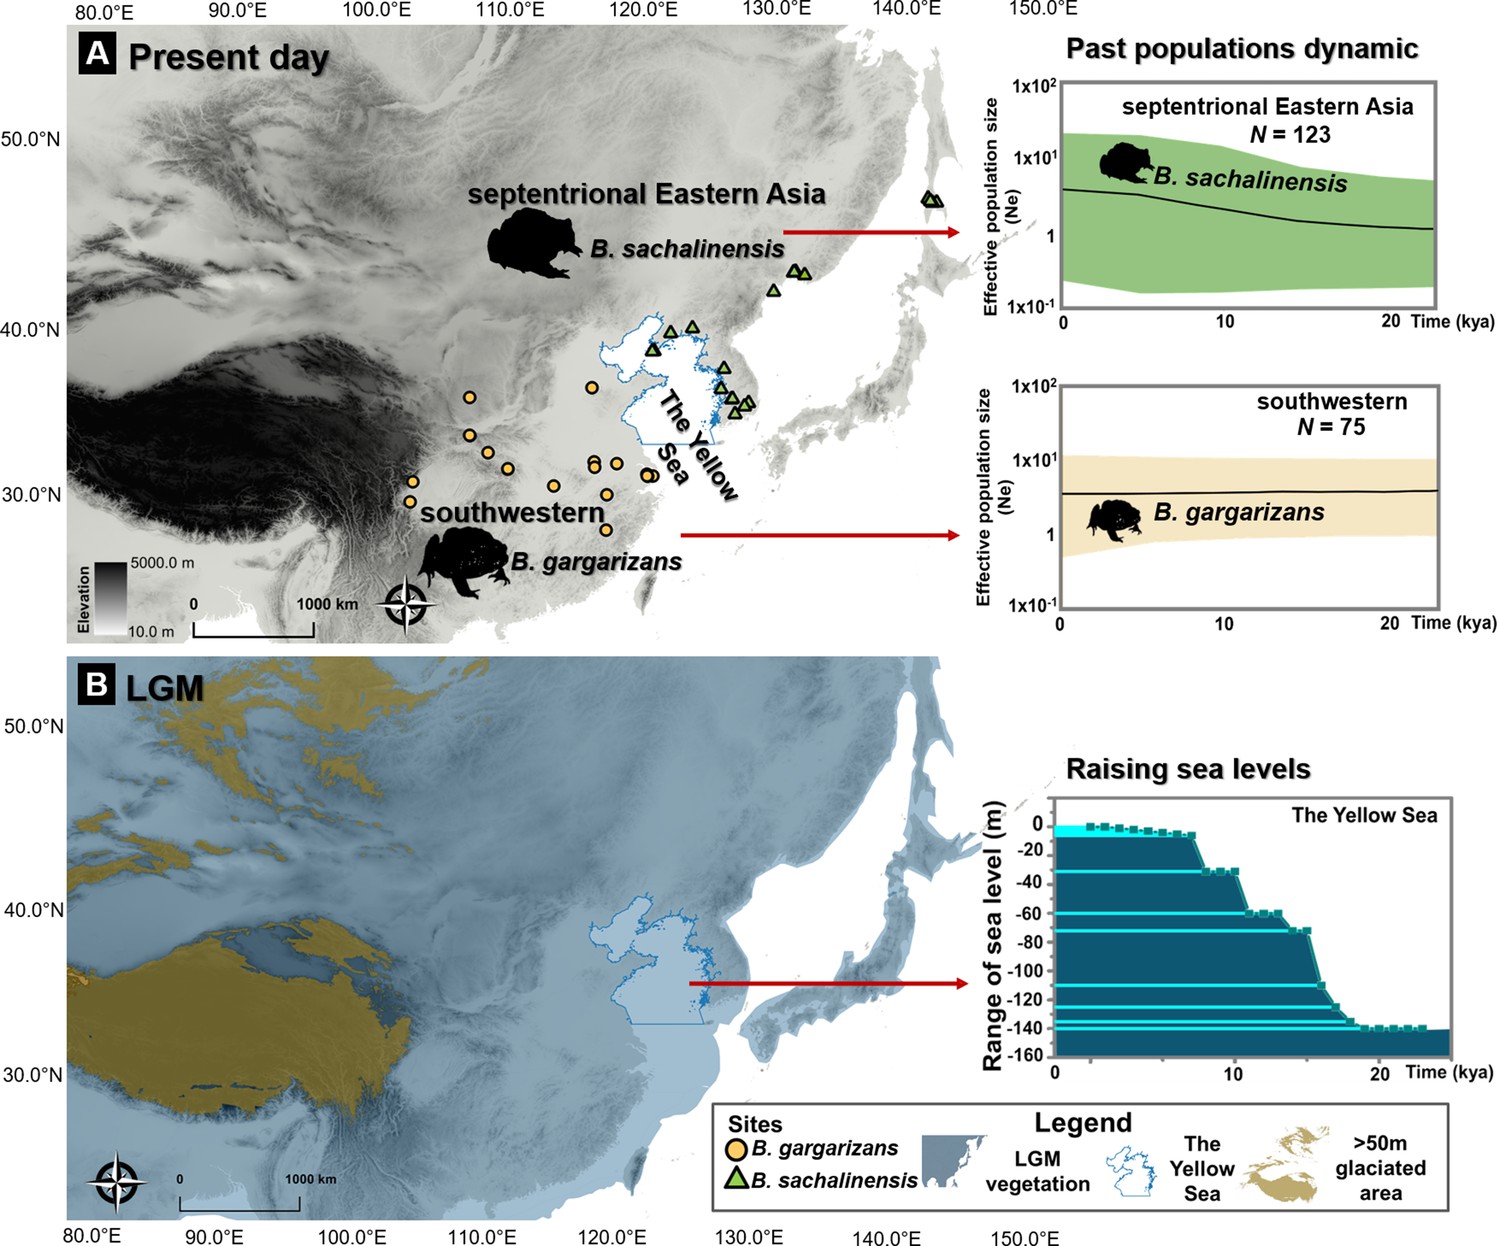
Ice age refugia hypothesis for two clades of Bufo in East Asia.
(A) Past population dynamics of Bufo sachalinensis show an increase in effective population size (Ne). (B) Variability in past sea levels of the Yellow Sea since the Last Glacial Maxima (LGM). The maps represent present-day distribution of Eastern Asia Bufo and the LGM condition in East Asia with the projection of continental shelves during the ice ages (refer to Supplementary file 1O). The variation of the Yellow Sea level during LGM to present day was extracted from literature (Li et al., 2016). All maps were produced using QGIS v10.1 (ESRI, CA, USA).
Figure 7 with 1 supplement
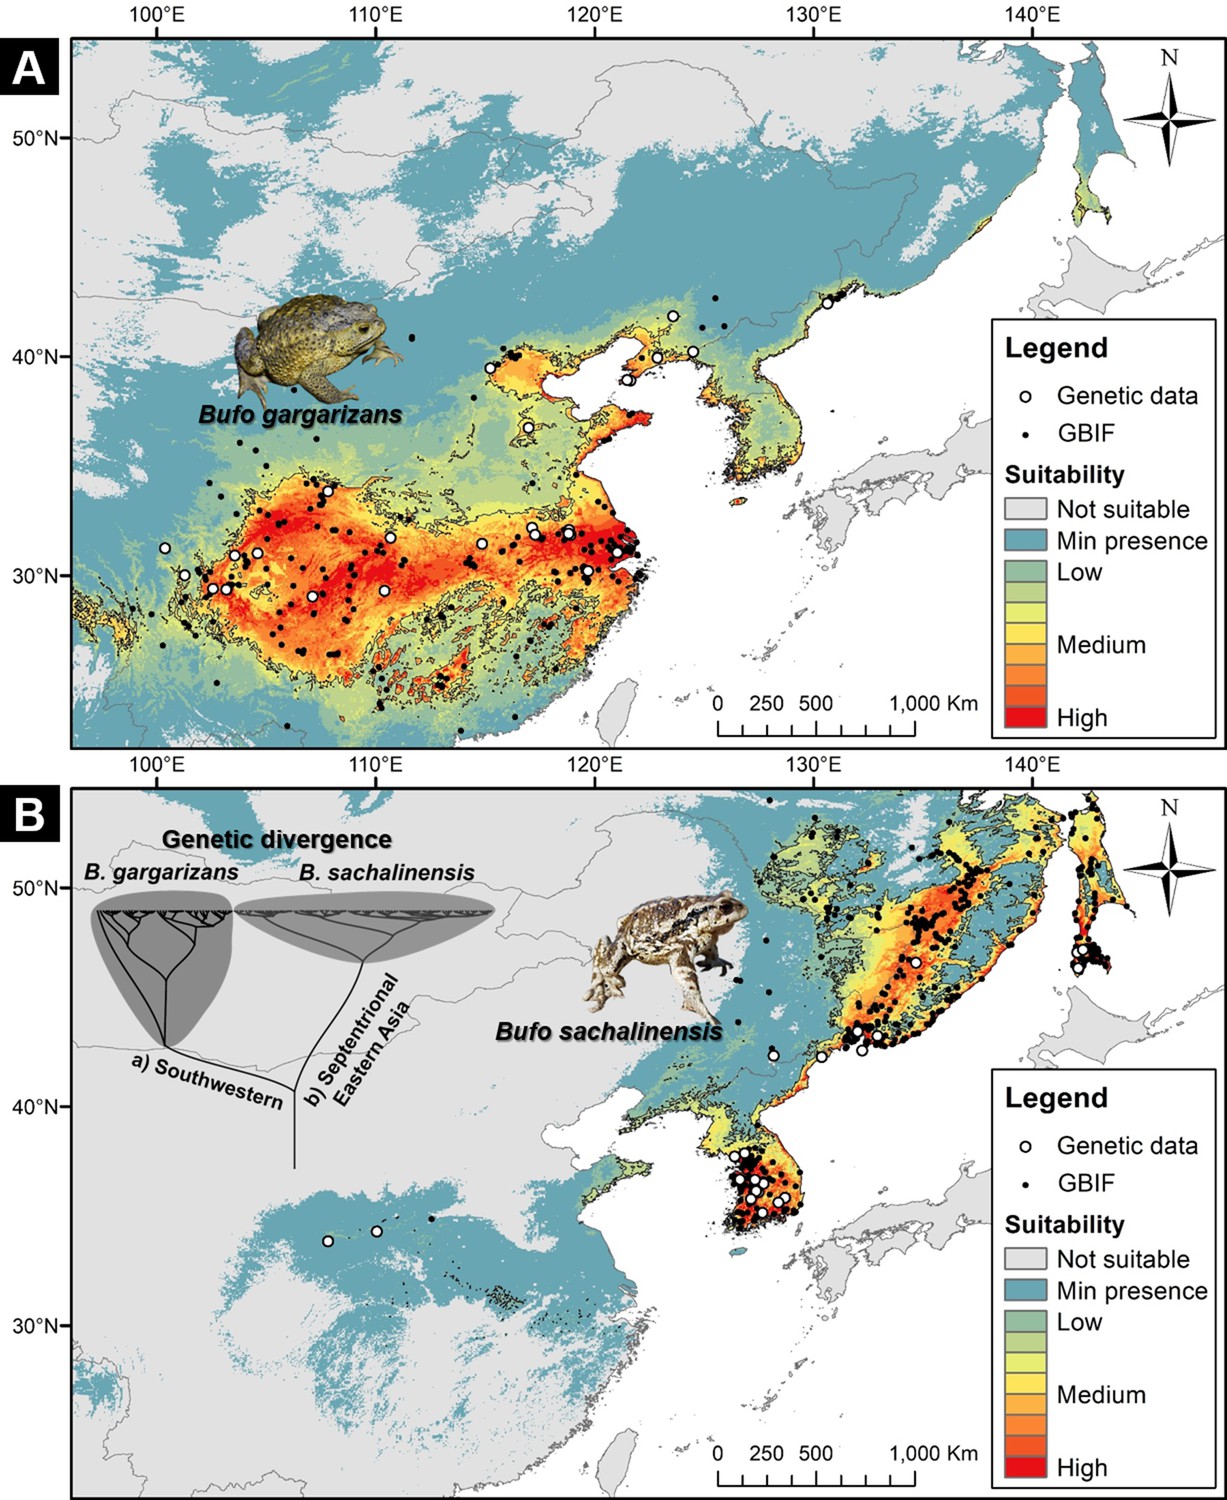
Niche suitability models for two segregated clades of East Asian Bufo.
(A) The niche suitability of the southwestern clade of B. gargarizans. (B) The divergence in niche suitability of the septentrional East Asian clade of B. sachalinensis. The colors represent the climate suitability of the populations with the red area indicating the highest suitability, the gray area represents unsuitable habitats, and black lines represent the maximum sensitivity plus specificity threshold. The white dots represent the occurrence based on the phylogenetic relationship data, and the black dots represent the occurrence recorded from the Global Biodiversity Information Facility (GBIF).
Figure 7—figure supplement 1
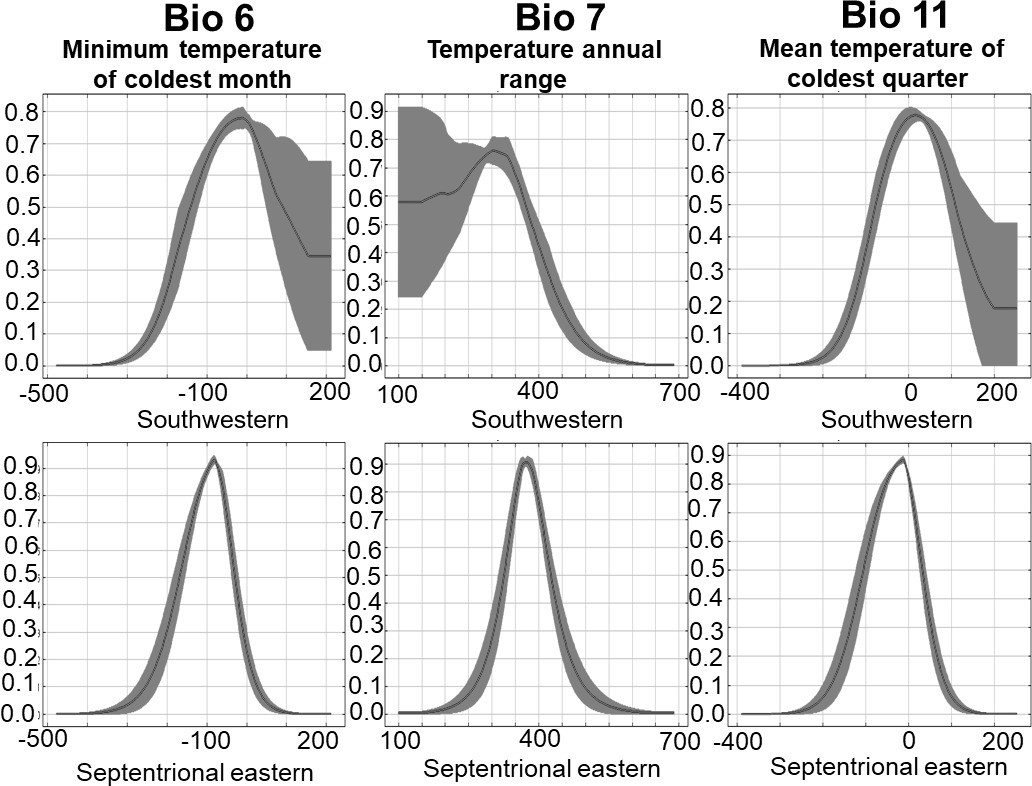
Niche segregation between Bufo sachalinensis and Bufo gargarizans.
Figure 8
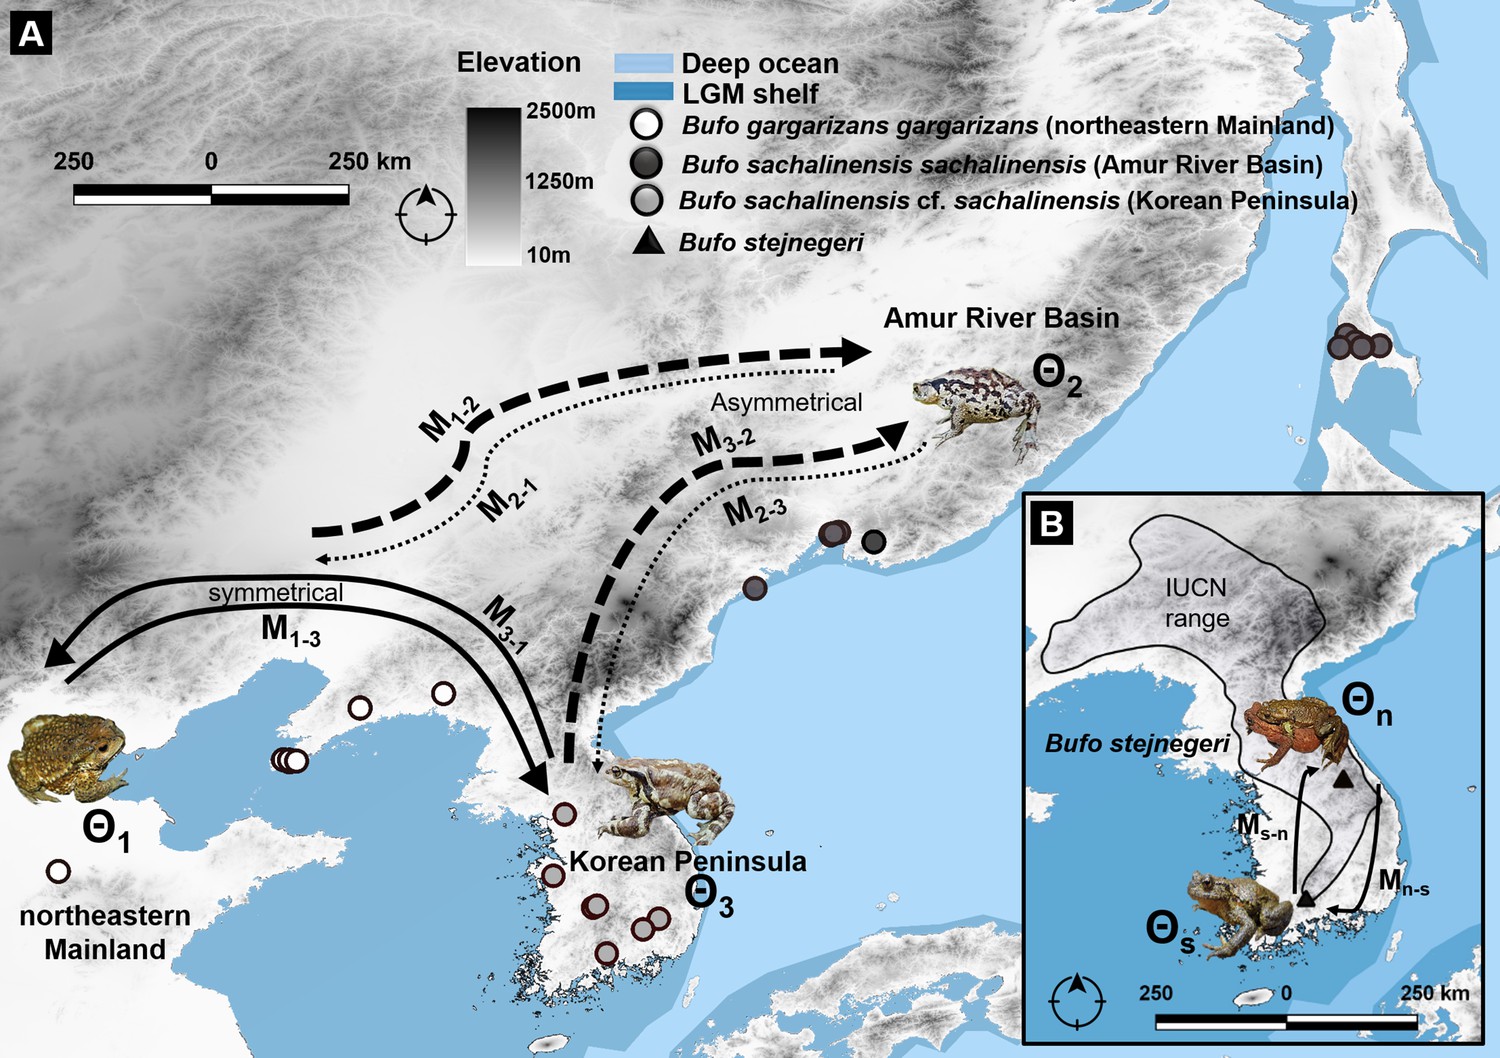
Migration trajectory estimated using MIGRATE-N among three northern latitudinal populations of Bufo characterized by mtDNA and nuDNA data.
(A) Predicted migration pattern of Bufo in the Northeast Asia, the Korean Peninsula, and the Amur River Basin. We detected an asymmetric flow from and toward the Amur River Basin, indicating a weak gene flow from B. s. sachalinensis and reflecting a potential local adaptation to the climatic condition of the area. (B) The symmetrical pattern of migration between the north and south populations of B. stejnegeri in the Republic of Korea. Bold arrows indicate higher rate and thin-dashed arrows indicate lower rate in one asymmetric migration between two regions.
Figure 9
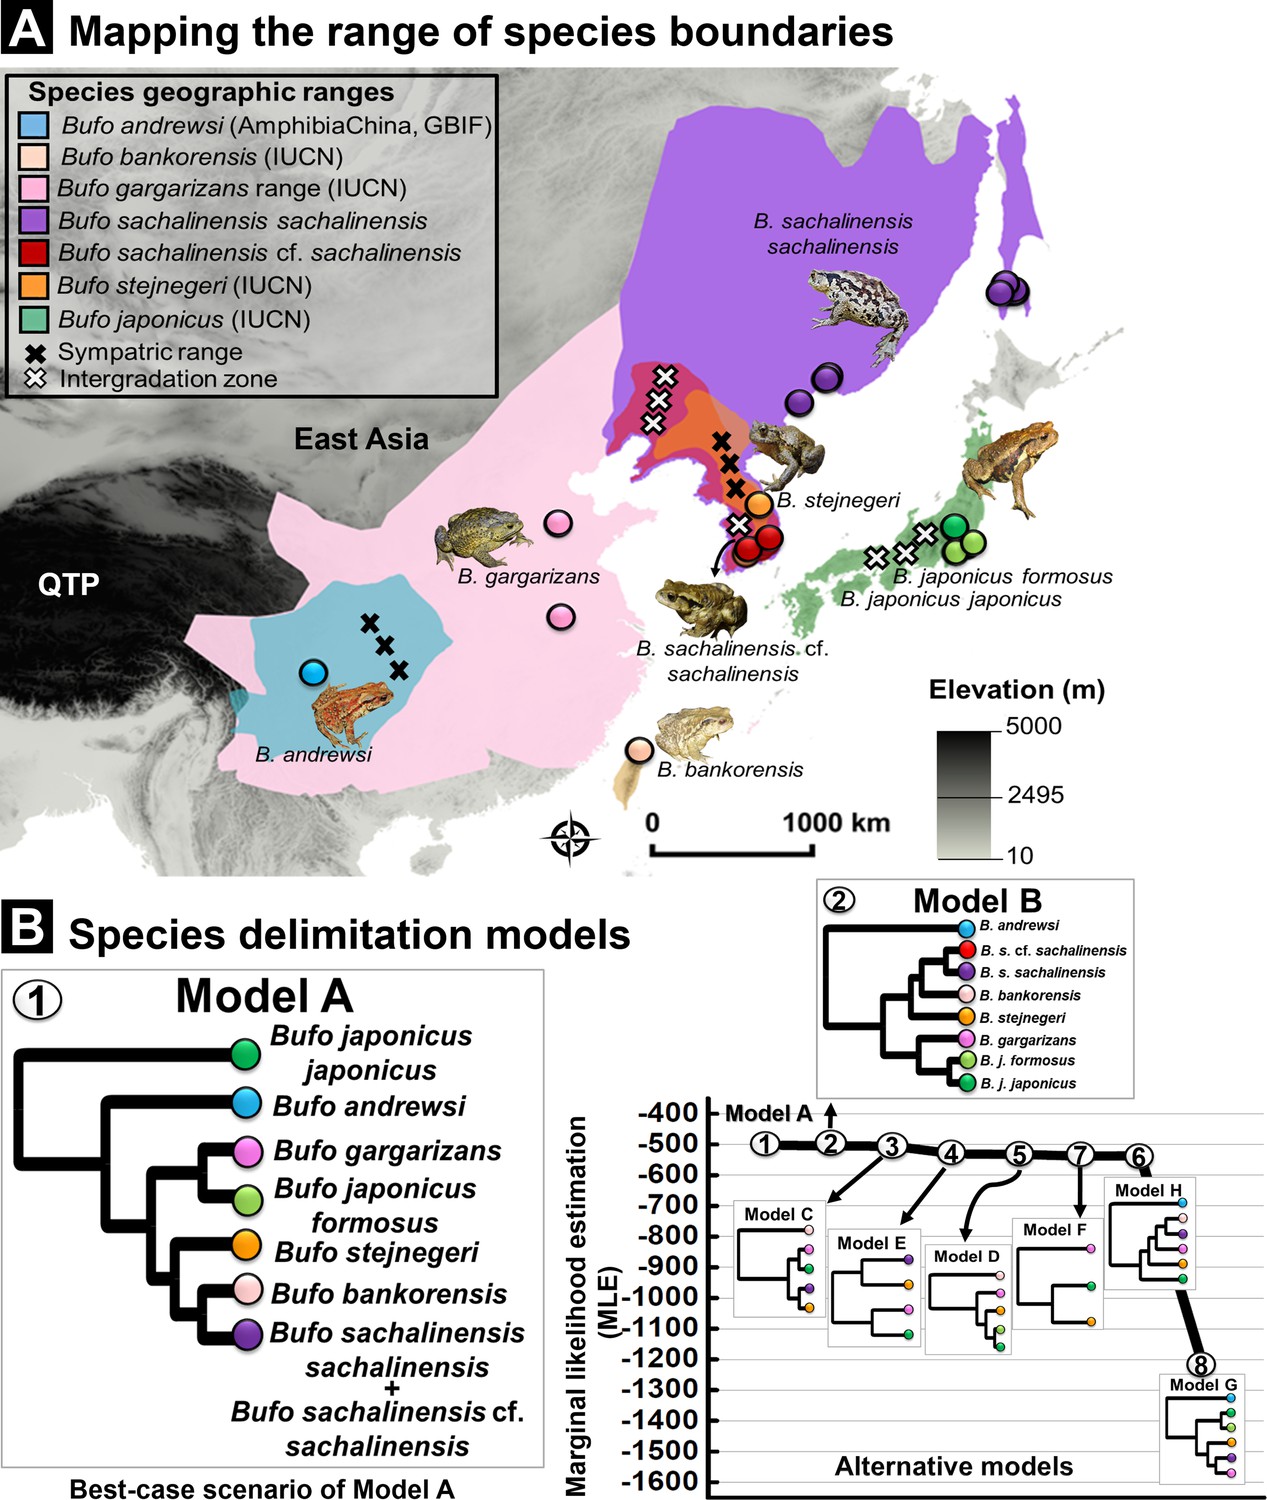
Species delimitation test using coalescent BFD approach inferred from nuDNA data (RAG-1- POMC-Rho).
(A) Geographic range for Eastern Asia Bufo based on best-supported species delimitation model. The range of each valid species is colored following the species color codes in the map. The marking for sympatric and intergradation range (the overlapped range between two subspecies in a broad species complex range) are indicated in the legend. (B) Topology of species delimitation Model A, followed by Model B as the best-supported scenarios among the eight alternative models tested. The ranking is supported through the highest Marginal likelihood estimate (MLE) and positive Bayes factor values. The comparison of all alternative models is explained in Supplementary file 1I.
Tables
Table 1
Timeframe estimate from the coalescent species tree for Holarctic bufonids following the Gondwanan origin hypothesis.
The key nodes represent the speciation events based on six internal calibrations of the minimum age range obtained from 102 fossils records under a log-normal distribution as priors. Dating analyses of the bufonids species tree shows the comparable datation estimated under a relaxed clock with the fossilized birth-death and Yule speciation models. The label for each clade is matched with the species tree in Figure 2.
| Clade | Key nodes | Dating analysis methods | |
|---|---|---|---|
| Fossilized birth-death (median [HPD 95%]/Mya) | Yule (median [HPD 95%]/Mya) | ||
| i | North Africa-Eurasia origin | 26.08 [22.54‒32.51] | 25.88 [22.55‒31.81] |
| ii | Neotropical origin | 24.25 [13.21–39.07] | 23.40 [13.10–35.61] |
| a (1) | Emergence of Bufotes (West Himalaya) | 21.72 [18.90–25.25] | 21.67 [19.63–27.68] |
| a (2) | Emergence of Bufotes (North Africa-Eurasia) | 20.42 [18.10‒23.28] | 20.37 [18.79–25.02] |
| c | Emergence of Palearctic Bufo | 14.49 [9.76‒22.70] | 14.52 [9.83‒22.58] |
| d | Radiation of western Palearctic Bufo | 11.03 [9.14‒15.42] | 11.04 [9.12–15.37] |
| e | Emergence and early radiation of eastern Palearctic Bufo | 9.99 [4.66‒16.57] | 10.11 [4.58–6.34] |
| b | Emergence of Epidalea and Strauchbufo (Eurasia) | 10.88 [7.11‒17.78] | 10.87 [7.03‒17.51] |
| h | Emergence of Rhinella (South America) | 14.16 [11.16‒22.24] | 14.00 [11.15–21.54] |
| g | Emergence of Incilius (Central America) | 11.90 [7.15‒22.40] | 11.80 [7.16–21.52] |
| f | Emergence of Anaxyrus (Nearctic) | 9.56 [6.16‒18.14] | 9.53 [6.13–17.58] |
Table 2
Comparison of the cladistic characteristics between the mitochondrial and nuclear trees of East Asian Bufo.
The comparison between concatenated mtDNA and nuDNA trees demonstrated the discordances between the recovered clades of Bufo gargarizans distributed in East Asia and showed identical patterns of divergence in the septentrional East Asian Bufo sachalinensis clades. The number of clades in the description is matching the phylogenetic trees in Figure 4.
| Distribution range | Clade | Description of cladistics | |
|---|---|---|---|
| Concatenated mtDNA (CR-ND2) | Concatenated nuDNA (POMC-RAG1-Rho) | ||
| Japanese Archipelago | Bufo japonicus formosus | Monophyletic (Clade 1) | Grouped together in a clade of Japanese Bufo |
| Japanese Archipelago | Bufo japonicus japonicus | Monophyletic (Clade 2) | |
| Korean Peninsula | Bufo stejnegeri | Monophyletic (Clade 3) | B. stejnegeri were grouped with Korean B. gargarizans in a nested clade of southeastern mainland and septentrional East Asian B. gargarizans (Clade 3) |
| Northeastern Mainland Asia | Bufo gargarizans | Monophyletic (Clade) | Contained multiple clades of B. gargarizans restricted to the southeastern and northeastern Asian mainland |
| Eastern Mainland | Bufo gargarizans | Polyphyletic with a clade of B. bankorensis distributed in Taiwan Island(Clade 5) | Formed multiple clades across Eastern Asian Bufo lineages. A clade grouped with northeastern B. gargarizans. Another clade is polyphyletic with of B. bankorensis of Taiwan Island and B. gargarizans distributed in septentrional East Asia (Clade 3). |
| Taiwan Island | Bufo bankorensis | ||
| Central Mainland | Bufo gargarizans | Formed two distinctive clades:
| |
| Septentrional East Asia (Korean Peninsula) | Bufo sachalinensis cf. sachalinensis | Monophyletic (Clade 6) | Monophyletic (Clade 3) |
| Septentrional East Asia (Amur River Basin) | Bufo sachalinensis sachalinensis | Monophyletic (Clade 6) | Monophyletic (Clade 3) |
Table 3
Molecular dating analyses for the East Asian Bufo.
This analysis is based on linked mtDNA genes (CR-ND2) and unlinked multiple nuclear protein-coding genes (POMC-RAG-1-Rho) under a relaxed molecular clock with different tree priors. The node numbers are matching the clades in the dated phylogenetic tree and hypothesized dispersal pathways in Figure 5.
| Key events (node number) | mtDNA (CR-ND2) | nuDNA (POMC-RAG-1-Rho) | ||
|---|---|---|---|---|
| Relaxed molecular clock | Strict molecular clock | |||
| Yule prior (median [HPD 95%]/Mya) | Birth-death prior (median [HPD 95%]/Mya) | Mean(median [HPD 95%]/Mya) | Birth-death prior(median [HPD 95%]/Mya) | |
| Root age of East Asian Bufo | 10.47 [7.88‒13.40] | 17.93 [11.81‒26.63] | 14.20 [9.46‒20.02] | 10.12 [6.60‒12.77] |
| Emergence of Japanese Bufo (A1) | 7.75 [5.98‒9.52] | 8.70 [6.97‒10.44] | 8.23 [6.48‒9.98] | 7.64 [4.99‒8.92] |
| Crown clade of B. j. formosus | 3.71 [1.71‒5.92] | 4.15 [2.38‒6.13] | 3.93 [2.05‒6.03] | ‒ |
| Crown clade of B. j. japonicus | 2.24 [0.72‒4.33] | 1.58 [0.57‒2.84] | 1.91 [0.65‒3.59] | ‒ |
| Crown clade of B. stejnegeri | 3.32 [1.54‒5.24] | 2.22 [0.72‒4.12] | 2.77 [1.13‒4.68] | 4.09 [1.46‒5.43] |
| MRCA of East Asian mainland Bufo (A2) | 8.38 [6.13‒10.88] | 14.25 [9.67‒19.44] | 11.32 [7.90‒15.16] | ‒ |
| Crown clade of B. tibetanus ‒ B. andrewsi | 5.21 [3.25‒7.45] | 5.26 [3.01–7.66] | 5.24 [3.13‒7.55] | ‒ |
| Stem node of B. gargarizans complex (A3) | 6.85 [4.70‒9.32] | 11.25 [7.28‒16.08] | 9.04 [5.99‒12.70] | ‒ |
| Stem clade of Chinese mainland of B. gargarizans | 5.19 [3.16‒6.72] | 5.34 [3.45‒7.83] | 5.27 [3.31‒7.28] | ‒ |
| Segregation between B. gargarizans inhabiting high (B. minshanicus) and low elevation (B. g. gargarizans) | 4.70 [3.23‒6.53] | 2.68 [1.82‒3.26] | 3.69 [2.53‒4.90] | 3.77 [2.39‒3.83] |
| Crown clade of B. andrewsi and B. gargarizans inhabiting high elevated range (B. minshanicus) | 2.89 [2.18‒3.54] | 2.55 [1.86‒3.28] | 2.72 [2.02‒3.41] | 2.79 [1.18‒3.10] |
| Crown clade of B. g. gargarizans in the southeastern Mainland | 3.14 [1.92‒4.49] | 2.56 [1.48‒3.86] | 2.85 [1.70‒4.18] | 3.05 [1.04‒3.45] |
| Nested clades of B. gargarizans popei and B. g. gargarizans in the Central, southeastern and northeastern Mainland | 2.21 [1.37‒3.20] | 1.28 [0.71‒1.95] | 1.85 [1.04‒2.58] | 3.65 [1.18‒5.28] |
| Crown clade of B. bankorensis | 1.34 [0.74‒1.94] | 1.28 [0.72‒1.84] | 1.31 [0.73‒1.89] | 1.80 [0.50‒1.80] |
| Stem clade of septentrional East Asian B. sachalinensis | 1.95 [1.55‒2.34] | 1.81 [1.38‒2.28] | 1.88 [1.47‒2.31] | 2.21 [0.93‒2.16] |
| Crown clade of Korean B. sachalinensis cf. sachalinensis | 1.58 [1.18‒1.93] | 1.22 [0.82‒1.61] | 1.40 [1.00‒1.77] | ‒ |
| Crown clade of Russian B. sachalinensis sachalinensis | 1.06 [0.62‒1.53] | 0.46 [0.19‒0.79] | 0.76 [0.41‒1.16] | ‒ |
Appendix 1—key resources table
| Reagent type (species) or resource | Designation | Source or reference | Identifiers | Additional information |
|---|---|---|---|---|
| Biological sample(Bufo gargarizans) | Buccal DNA swabs and road kills tissues of Bufo individuals across East Asia. | GenBank, this study | Voucher list in Supplementary file 1J | https://www.ncbi.nlm.nih.gov/genbank/ |
| Biological sample (B. andrewsi) | Buccal DNA swabs and road kills tissues of Bufo individuals across East Asia. | GenBank, this study | Voucher list in Supplementary file 1J | https://www.ncbi.nlm.nih.gov/genbank/ |
| Biological sample (B. bankorensis) | Buccal DNA swabs and road kills tissues of Bufo individuals across East Asia. | GenBank, this study | Voucher list in Supplementary file 1J | https://www.ncbi.nlm.nih.gov/genbank/ |
| Biological sample (B. stejnegeri) | Buccal DNA swabs and road kills tissues of Bufo individuals across East Asia | GenBank, this study | Voucher list in Supplementary file 1J | https://www.ncbi.nlm.nih.gov/genbank/ |
| Biological sample (B. japonicus formosus) | Buccal DNA swabs and road kills tissues of Bufo individuals across East Asia | GenBank, this study | Voucher list in Supplementary file 1J | https://www.ncbi.nlm.nih.gov/genbank/ |
| Biological sample (B. j. japonicus) | Buccal DNA swabs and road kills tissues of Bufo individuals across East Asia | GenBank, this study | Voucher list in Supplementary file 1J | https://www.ncbi.nlm.nih.gov/genbank/ |
| Biological sample (B. s. sachalinensis) | Buccal DNA swabs and road kills tissues of Bufo individuals across East Asia | GenBank, this study | Voucher list in Supplementary file 1J | https://www.ncbi.nlm.nih.gov/genbank/ |
| Gene (B. gargarizans) | Multi loci(CR-ND2-POMC-RAG-1-CRCX4-Rho) | GenBank, this study | Voucher list in Supplementary file 1J | https://www.ncbi.nlm.nih.gov/genbank/ |
| Gene (B. andrewsi) | Multi loci(CR-ND2-POMC-RAG-1-CRCX4-Rho) | GenBank, this study | Voucher list in Supplementary file 1J | https://www.ncbi.nlm.nih.gov/genbank/ |
| Gene (B. bankorensis) | Multi loci(CR-ND2-POMC-RAG-1-CRCX4-Rho) | GenBank, this study | Voucher list in Supplementary file 1J | https://www.ncbi.nlm.nih.gov/genbank/ |
| Gene (B. stejnegeri) | Multi loci(CR-ND2-POMC-RAG-1-CRCX4-Rho) | GenBank, this study | Voucher list in Supplementary file 1J | https://www.ncbi.nlm.nih.gov/genbank/ |
| Gene (B. j. formosus) | Multi loci(CR-ND2-POMC-RAG-1-CRCX4-Rho) | GenBank, this study | Voucher list in Supplementary file 1J | https://www.ncbi.nlm.nih.gov/genbank/ |
| Gene (B. j. japonicus) | Multi loci(CR-ND2-POMC-RAG-1-CRCX4-Rho) | GenBank, this study | Voucher list in Supplementary file 1J | https://www.ncbi.nlm.nih.gov/genbank/ |
| Gene (B. s. sachalinensis) | Multi loci(CR-ND2-POMC-RAG-1-CRCX4-Rho) | GenBank, this study | Voucher list in Supplementary file 1J | https://www.ncbi.nlm.nih.gov/genbank/ |
| Commercial assay or kit | Qiagen DNeasy Blood and Tissue Kit | QIAGEN Group, Hilden, Germany | Cat. no./ID: 69504 | |
| Commercial assay or kit | PCR purificationCaspaseGlo 3/7 | PROMEGA | G8090 | |
| Commercial assay or kit | BigDye Terminator v.3.1 Cycle Sequencing Kit | Cosmo Genetech Corp. (Seoul, Republic of Korea) | Thermo Fisher Scientific, Gangnam, Republic of Korea | |
| Sequence-based reagent | Control B-H | Goebler et al. (1999) | PCR primers for control region (CR); Supplementary file 1K | Forward: GTCCATTGGAGGTTAAGATCTACCA |
| Sequence-based reagent | CR-BGarF and CR-BGarR | Borzée et al., 2017 | PCR primers for control region (CR); Supplementary file 1K | Forward: TTGGACGATAGCAAGGAACACTCReverse: CCTGACTTCTCTGAGGCCGCTTT |
| Sequence-based reagent | conBG-L and conBG-H | Liu et al., 2000 | PCR primers for control region (CR); Supplementary file 1K | Forward: GCACGATAGCAAGGAACACReverse: CCGCTTTAAGGTACGATA |
| Sequence-based reagent | ND1-L-int | Fu et al., 2005 | PCR primers for NADH dehydrogenase 1 (ND1) and NADH dehydrogenase 2 (ND2);Supplementary file 1K | Forward: CGAGCATCC TACCCACGATTTCG |
| Sequence-based reagent | ND1-H4980 | Macey et al., 1998 | PCR primers for NADH dehydrogenase 1 (ND1) and NADH dehydrogenase 2 (ND2);Supplementary file 1K | Reverse:ATT TTTCGTAGTTGGGTTTGRTT |
| Sequence-based reagent | BGND2F andBGND2R | This study | PCR primers for ND2; Supplementary file 1K | Forward: TCTCATTCCCAATCTCACTTCTACTReverse: GCC TCACCCTCCGACAATA |
| Sequence-based reagent | POMC DRV F1 andPOMC DRV R1 | Vieites et al., 2009 | PCR primers for proopiomelanocortin (POMC); Supplementary file 1K | Forward: ATATGTCATGASCCAYTTYCGCTGGAAReverse: GGCRTTYTTGAAWAGAGTCATTAGWGG |
| Sequenced-based reagent | snoBGRAG1F and snoBGRAG1R | This study | PCR primers for recombination activating gene 1 (RAG-1); Supplementary file 1K | Forward:TGAGAAACGCAGAGAAAGCCCReverse:GACGGGTGGCATCACAAAGAG |
| Sequence-based reagent | BGRho01-F and BGRho01-R | This study | PCR primers for rhodopsin (Rho);Supplementary file 1K | Forward:CGACTACACCCTGAAGCCReverse:CCAACAGATAAGGAAGAAGACCAC |
| Chemical compound, drug | Ethyl alcohol anhydrous 94.5%–99.9% | DAEJUNG | (EP/GR) 500 ml/1 L; CAS: 64-17-5 | |
| Software, algorithm | BEAST v.2.6.1 and STARBEAST | Bouckaert et al., 2019 | https://www.beast2.org/ | |
| Software, algorithm | SNP and AFLP Package for Phylogenetic analysis (SNAPP) in BEAST v.2.6.1 | Grummer et al., 2014; Bouckaert et al., 2019 | https://www.beast2.org/snapp/ | |
| Software, algorithm | QGIS v.10.1. | ESRI, CA | ||
| Software, algorithm | ArcMap v. 10.6 | ESRI, Redlands, CA | ||
| Software, algorithm | MAXENT v.3.1 | http://www.cs.princeton.edu/~schapire/maxent/; Phillips et al. 2004, 2006 | ||
| Software, algorithm | R version 3.5.1 and | R Core Team (2017) | ||
| Software, algorithm | R Studio version 1.1.442 | R Studio Team (2020) | ||
| Software, algorithm | MIGRATE v.3.6.11 | Beerli et al., 2019 | https://peterbeerli.com/migrate-html5/ | |
| Software, algorithm | MrBayes is 3.2.7 | Huelsenbeck and Ronquist, 2001 |
Additional files
-
Supplementary file 1
Preliminaries and additional results for phylogeography, population genetics, species delimitation and ecological niche modelling analyses.
- https://cdn.elifesciences.org/articles/70494/elife-70494-supp1-v2.docx
-
Supplementary file 2
The references and notes for all citations in Supplementary file 1A and Supplementary file 1J.
- https://cdn.elifesciences.org/articles/70494/elife-70494-supp2-v2.docx
-
Transparent reporting form
- https://cdn.elifesciences.org/articles/70494/elife-70494-transrepform1-v2.docx
Download links
A two-part list of links to download the article, or parts of the article, in various formats.
Downloads (link to download the article as PDF)
Open citations (links to open the citations from this article in various online reference manager services)
Cite this article (links to download the citations from this article in formats compatible with various reference manager tools)
From Gondwana to the Yellow Sea, evolutionary diversifications of true toads Bufo sp. in the Eastern Palearctic and a revisit of species boundaries for Asian lineages
eLife 11:e70494.
https://doi.org/10.7554/eLife.70494


