A modular platform for automated cryo-FIB workflows
- Department Molecular Structural Biology, Max Planck Institute of Biochemistry, Germany
- Structural and Computational Biology Unit, European Molecular Biology Laboratory, Germany
- Collaboration for joint PhD degree between EMBL and Heidelberg University, Faculty of Biosciences, Germany
- Cell Biology and Biophysics Unit, European Molecular Biology Laboratory, Germany
Figures
Figure 1 with 2 supplements
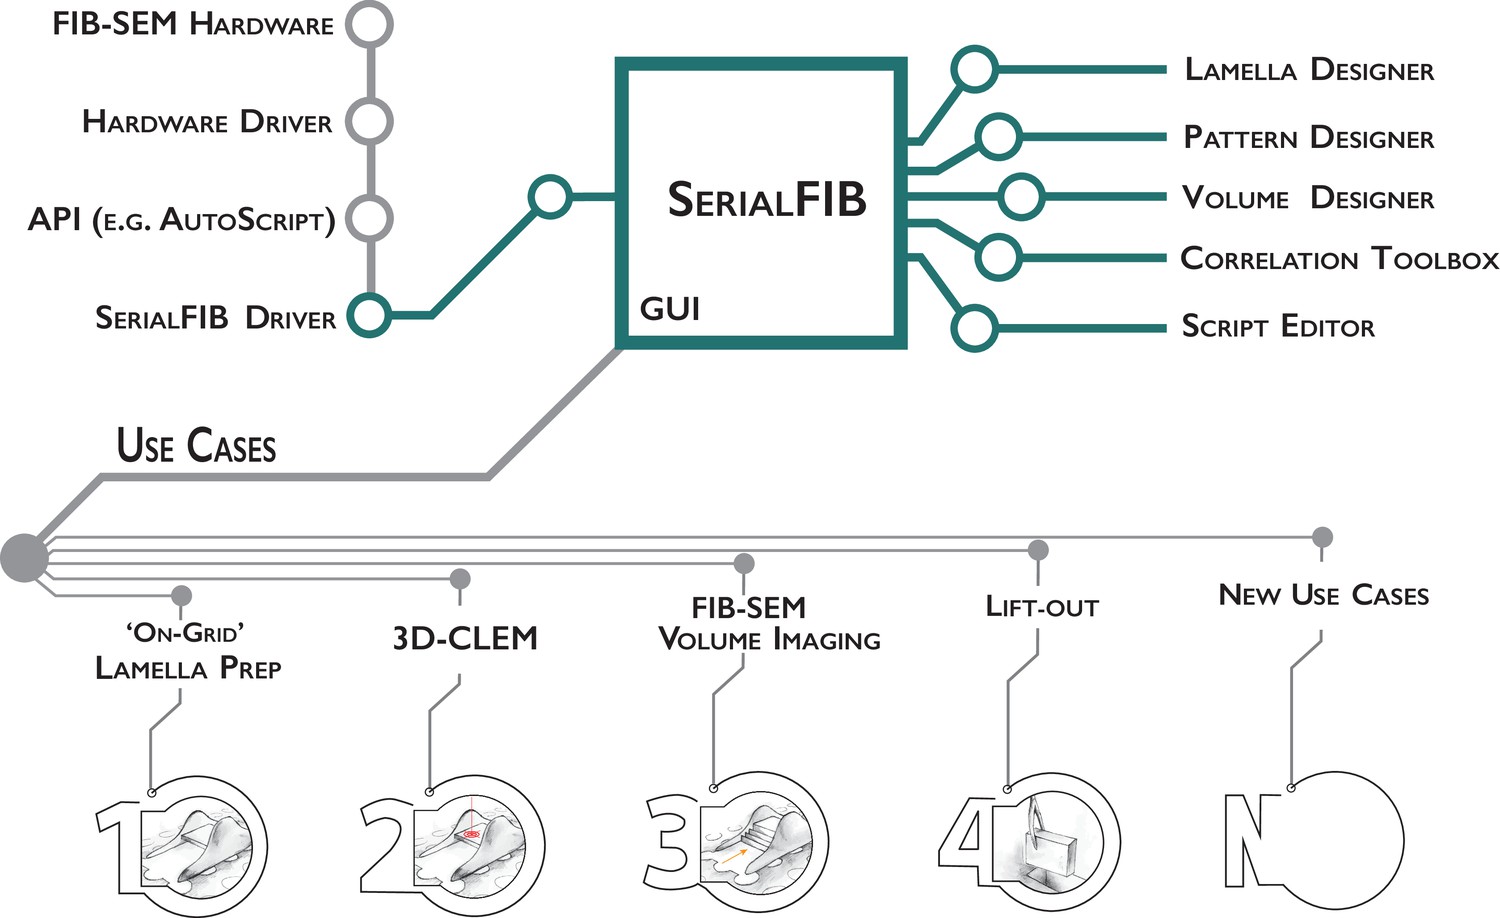
Software architecture, modules, and use cases of SerialFIB.
Developments presented in this work are highlighted in green. The graphical user interface (GUI) is largely decoupled from instrument operations, which are controlled by the developed SerialFIB driver. Modules (right) enable design of protocols for different use cases (bottom, 1–4), and a scripting interface that offers flexibility for new developments (bottom, N).
Figure 1—figure supplement 1
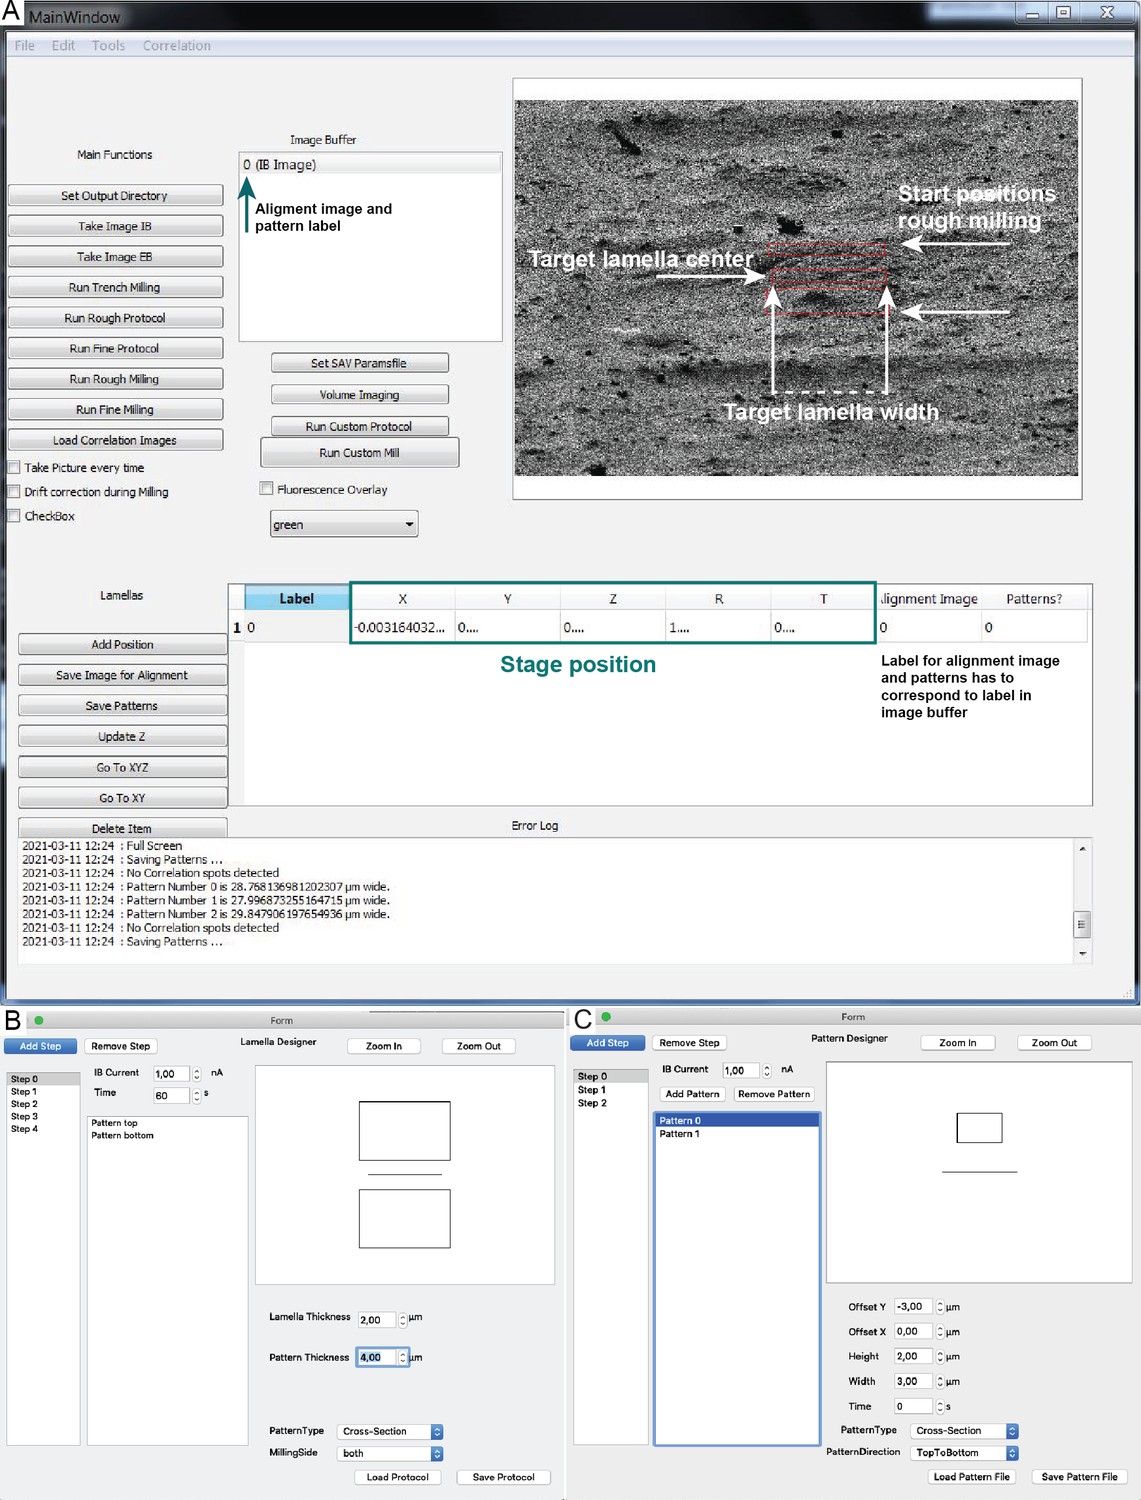
Graphical user interface (GUI) for automated cryo-focused ion beam (cryo-FIB) protocols.
(A) The GUI displays buttons for the main functions (imaging and several FIB milling procedures; left), the image buffer where reference images are selected and displayed in the alignment window to prepare and adjust milling patterns (top right, red rectangles). Specialized applications (volume imaging, custom milling procedures, and fluorescence overlay) are available below the image buffer. In the coordinate navigator (bottom), milling sites are connected with alignment images and corresponding patterns. From the Tools tab, Lamella Designer, Pattern Designer, Volume Designer, and Script Editor can be selected. (B) The Lamella Designer allows for stepwise construction of user-defined patterns and milling procedures. (C) The Pattern Designer enables creation of customized patterns, for example, for lift-out site preparation.
Figure 1—figure supplement 2

SerialFIB interface for volume imaging and Script Editor.
(A) In the Volume Designer, FIB-SEM volume imaging workflows can be constructed with user-definable FIB milling and SEM imaging parameters. (B) The Script Editor offers a scriptable interface for customized milling protocols, which can be saved as independent scripts or within libraries.
Figure 2 with 7 supplements
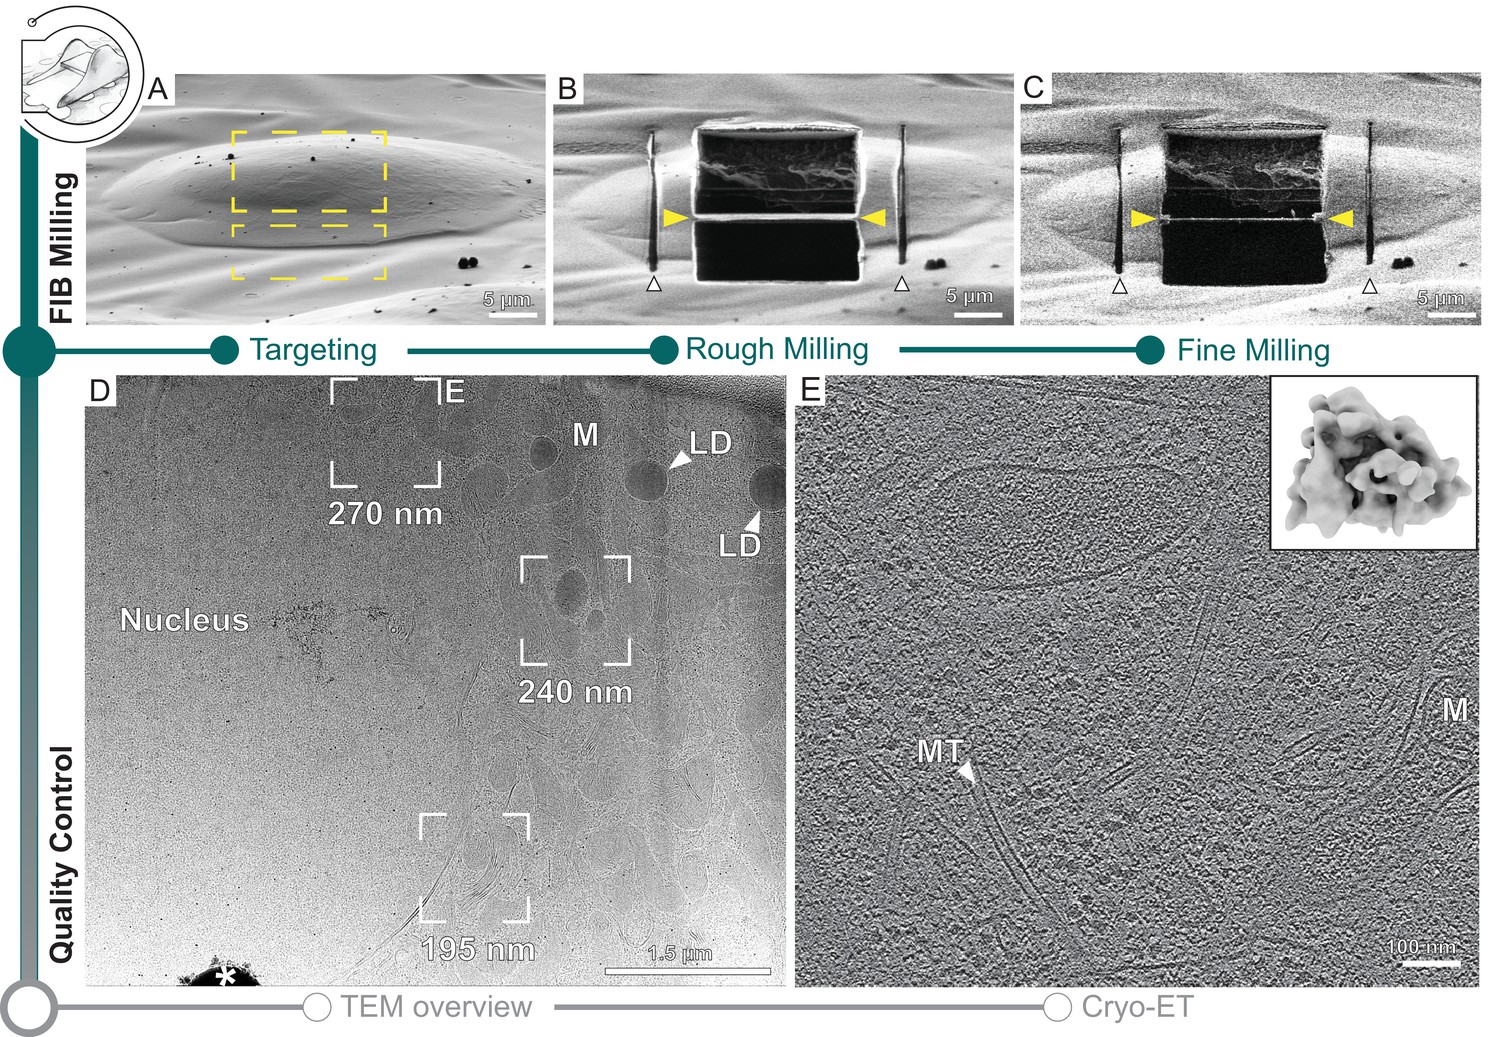
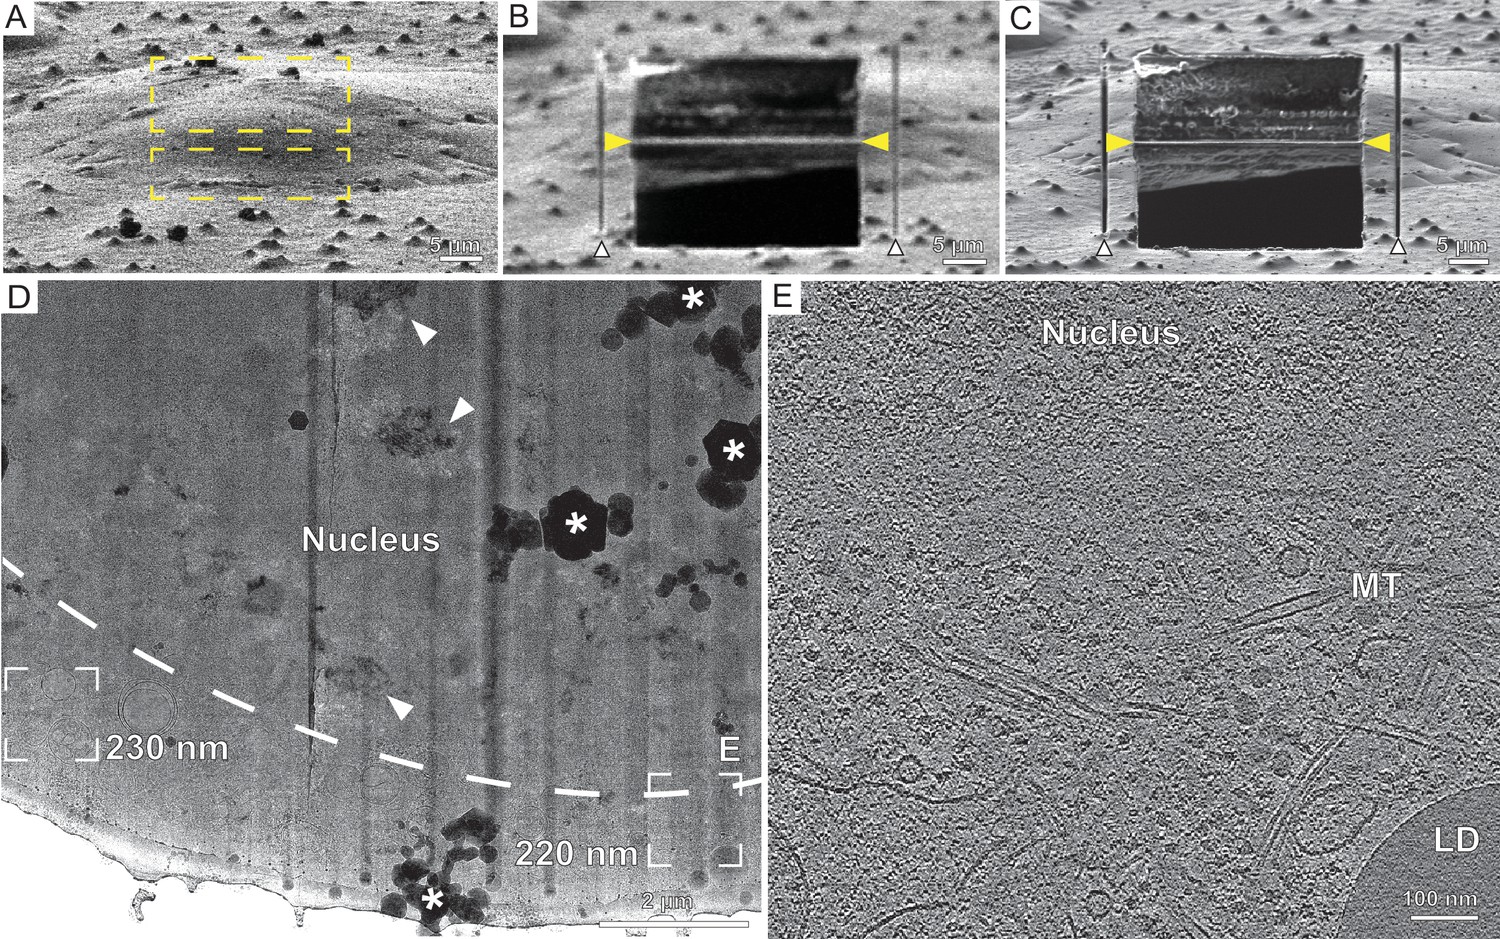
Automated on-grid lamella preparation of Sum159 breast cancer cells.
(A) Focused ion beam (FIB) image of a cell prior to lamella preparation. Yellow rectangles indicate milling patterns where material is subsequently removed. (B) Micro-expansion joints (white arrowheads) and lamella (yellow arrowheads) milled to a target thickness of 1 µm. (C) Lamella after fine milling to a target thickness of 300 nm. (D) Transmission electron microscopy (TEM) overview of lamella in (C). Frames indicate examples of tilt series acquisition positions (out of eight acquired on this lamella) and the local thickness determined from reconstructed tomograms. Nucleus, lipid droplets (LD), and mitochondria (M) are observable. * indicates an ice crystal introduced during transfer between FIB and TEM. Area indicated by (E) is enlarged. (E) A slice through the tomogram depicts the cytosol with microtubules (MT) and a mitochondrion (M). Inset shows a ribosome subtomogram average determined from the dataset collected on this single lamella (four tomograms; 4378 subtomograms; 24 Å resolution).
Figure 2—figure supplement 1
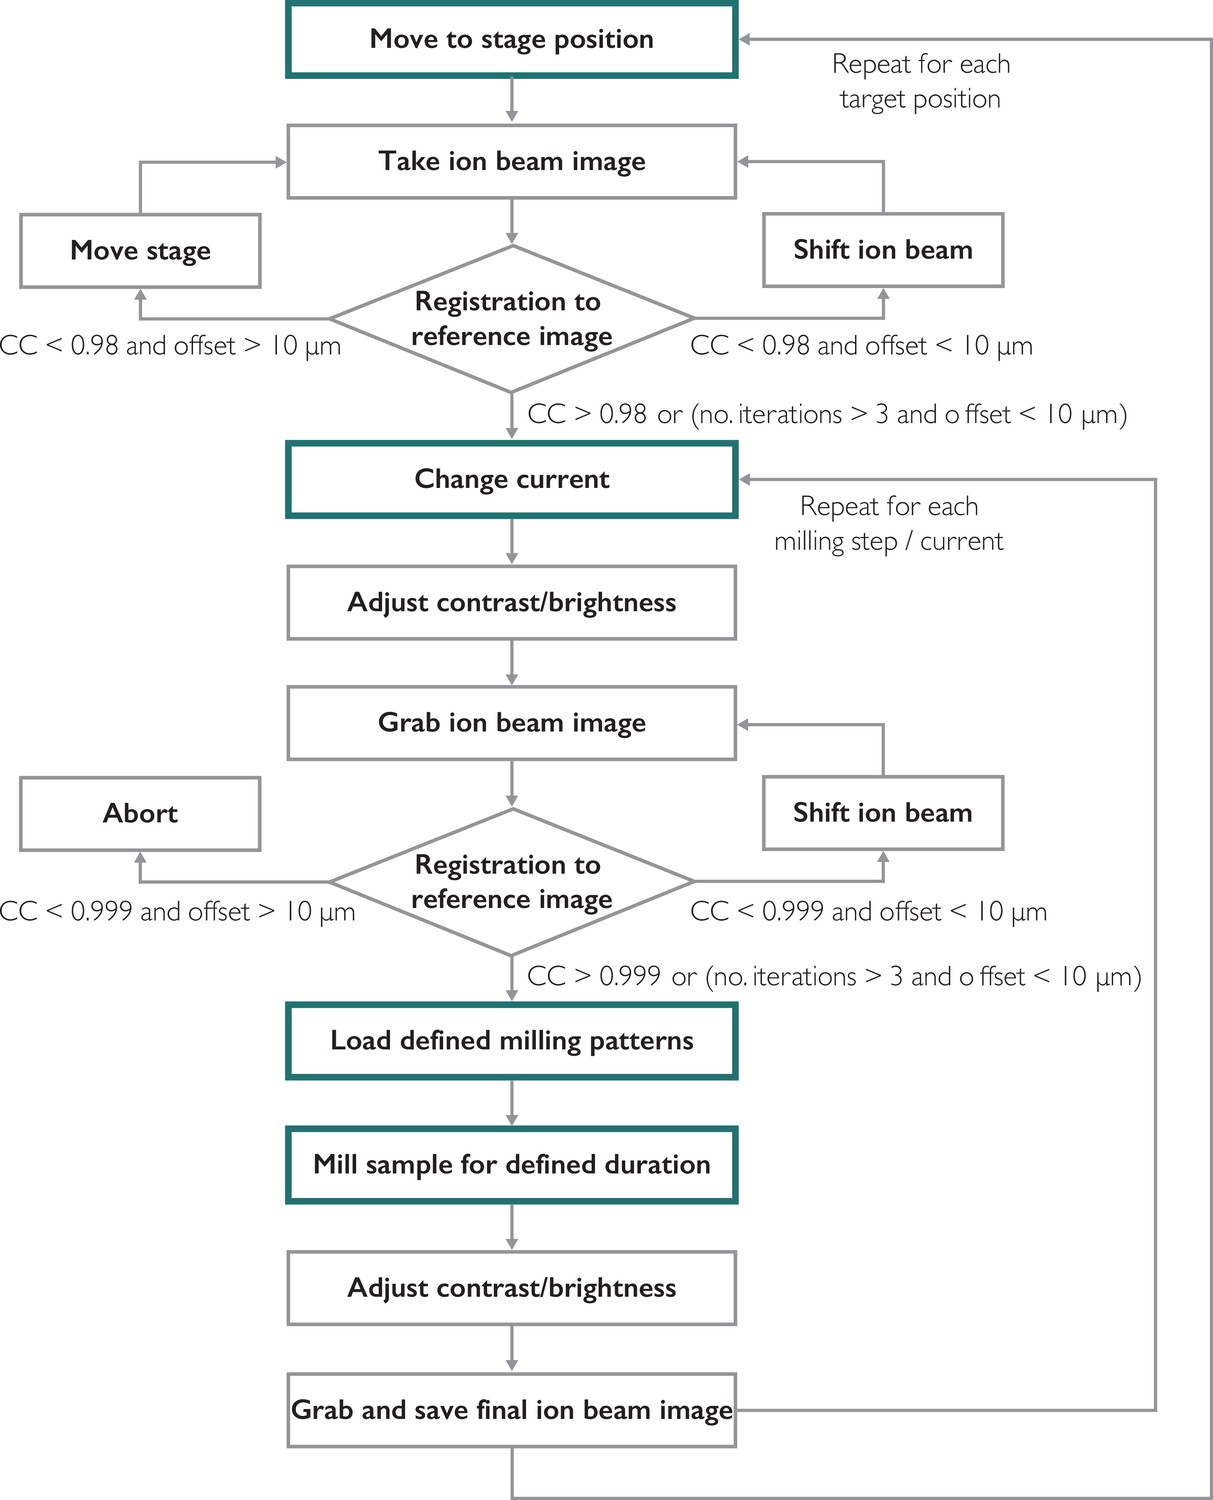
Functions executed by SerialFIB for preparation of on-grid lamellae.
Main steps of the milling procedure are highlighted in green boxes. Gray boxes indicate subsequent steps performed by the software. Rhombus boxes indicate decision points for the image-based alignment.
Figure 2—figure supplement 2
Automated on-grid lamella preparation of HeLa cells.
(A) Focused ion beam (FIB) image of a cell prior to lamella preparation. Yellow rectangles indicate milling patterns where material is subsequently removed. (B) Micro-expansion joints (white arrowheads) and rough lamella (yellow arrowheads) milled to a target thickness of 1 µm. (C) Lamella after fine milling to a target thickness of 300 nm. (D) Transmission electron microscopy (TEM) overview of lamella in (C). Frames indicate examples of tilt series acquisition positions (out of three acquired on this lamella) and the local thickness determined from reconstructed tomograms. Nuclear envelope delineated by a dashed line. Vertical dark stripes (curtains) commonly originate from dense lipid droplets or surface fiducials, which resist milling. Milling protocol was adjusted to minimize curtaining (Supplementary file 1). * denotes ice crystal contamination from transfer between FIB and TEM. Arrowheads point to crystalline ice reflections in the nucleus. Area indicated by (E) is enlarged. (E) A slice through the tomogram depicts the cytosol with microtubules (MT), a lipid droplet (LD), and the nucleus.
Figure 2—figure supplement 3

Automated on-grid lamella preparation of E. huxleyi cells.
(A) Focused ion beam (FIB) image of an agglomeration of cells prior to lamella preparation. Yellow rectangles indicate milling patterns where material is subsequently removed. (B) Micro-expansion joints (white arrowheads) and rough lamella (yellow arrowheads) milled to a thickness smaller than the target of 1 µm due to prolonged milling times. (C) Final lamella after fine milling to a target thickness of 300 nm. (D) Section of the transmission electron microscopy (TEM) overview of the lamella showing three individual cells. Frames indicate examples of tilt series acquisition positions (out of 10 acquired on this lamella) and the local thickness determined from reconstructed tomograms. Dense structures include intra- and extra-cellular calcium carbonate crystals (top two and bottom three white arrowheads, respectively) are observable, as well as the protective Pt layer. Milling protocol was adjusted to minimize curtaining from the dense crystalline structures (Supplementary file 1). * denotes ice crystal contamination from transfer between FIB and TEM. (E) A slice through the tomogram indicated by (E) in the TEM overview in (D) depicts the cytosol with microtubules (white arrowheads) assembled into doublets and triplets constituting a basal body of a cilium.
Figure 2—figure supplement 4
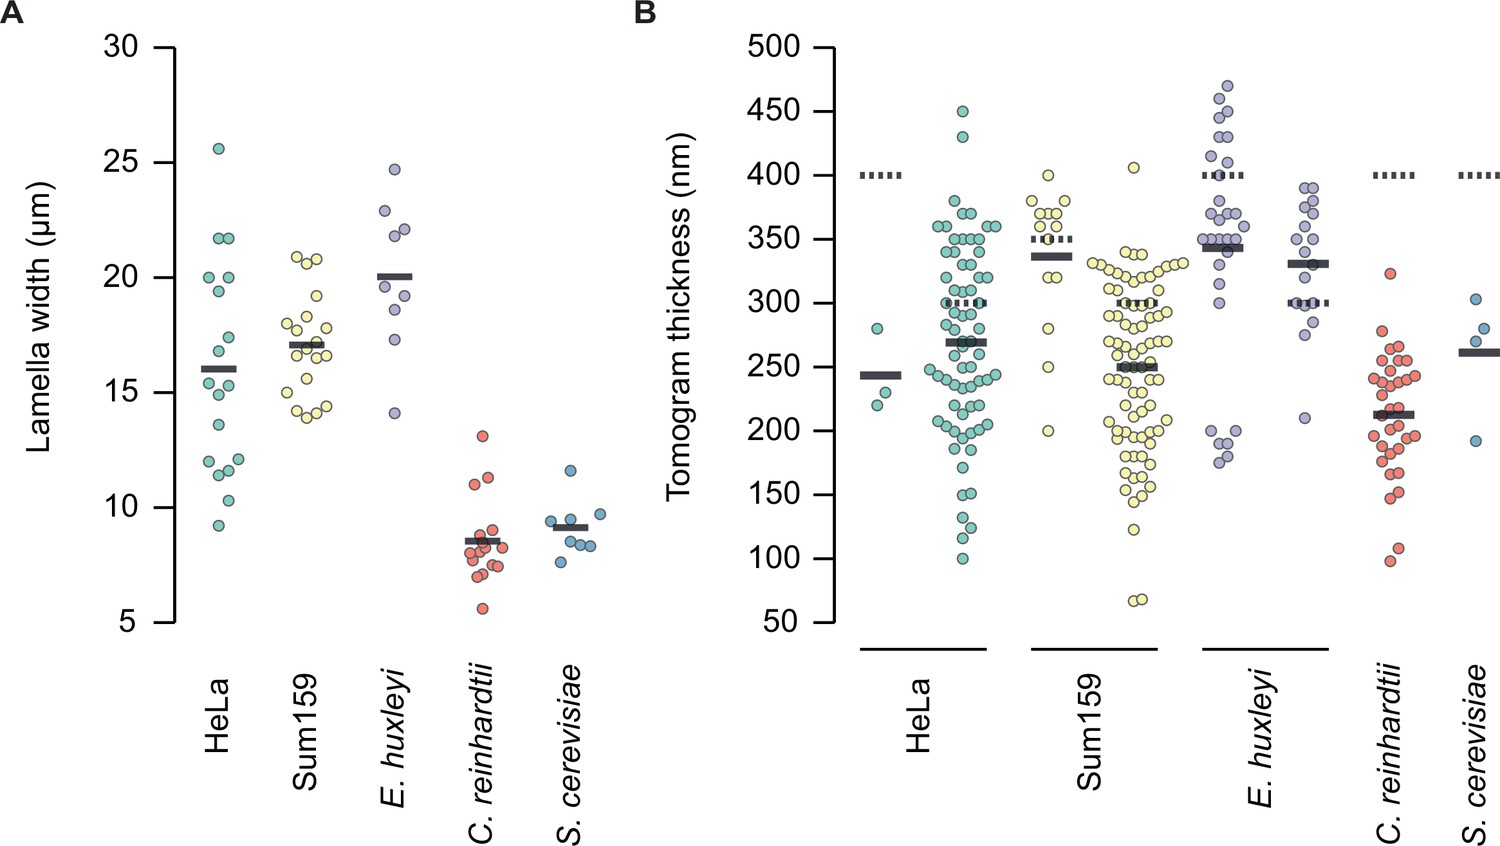
Width (A) and thickness (B) of successfully prepared lamellae from five eukaryotic cell types.
Multiple tomograms were collected per lamella. Thicknesses were measured per tomogram. Solid line indicates the mean thickness; dotted line indicates the target thickness. Data represents lamellae prepared over a series of independent focused ion beam (FIB) sessions: six grids for HeLa; three grids for Sum159; two grids for E. Huxleyi; two grids for C. reinhardtii; and one grid for S. cerevisiae.
Figure 2—video 1
Tomographic volume of a Sum159 breast cancer cell related to Figure 2E depicting the cytosol with microtubules (MT) and a mitochondrion (Mito) next to the nucleus.
Figure 2—video 2
Tomographic volume of a HeLa cell related to Figure 2—figure supplement 2E depicting the nuclear periphery, and the cytosol with microtubules (MT) and a lipid droplet (LD).
Figure 2—video 3
Tomographic volume of E. huxleyi cells related to Figure 2—figure supplement 3E depicting the cytosol with the basal body of a cilium.
Figure 3 with 4 supplements
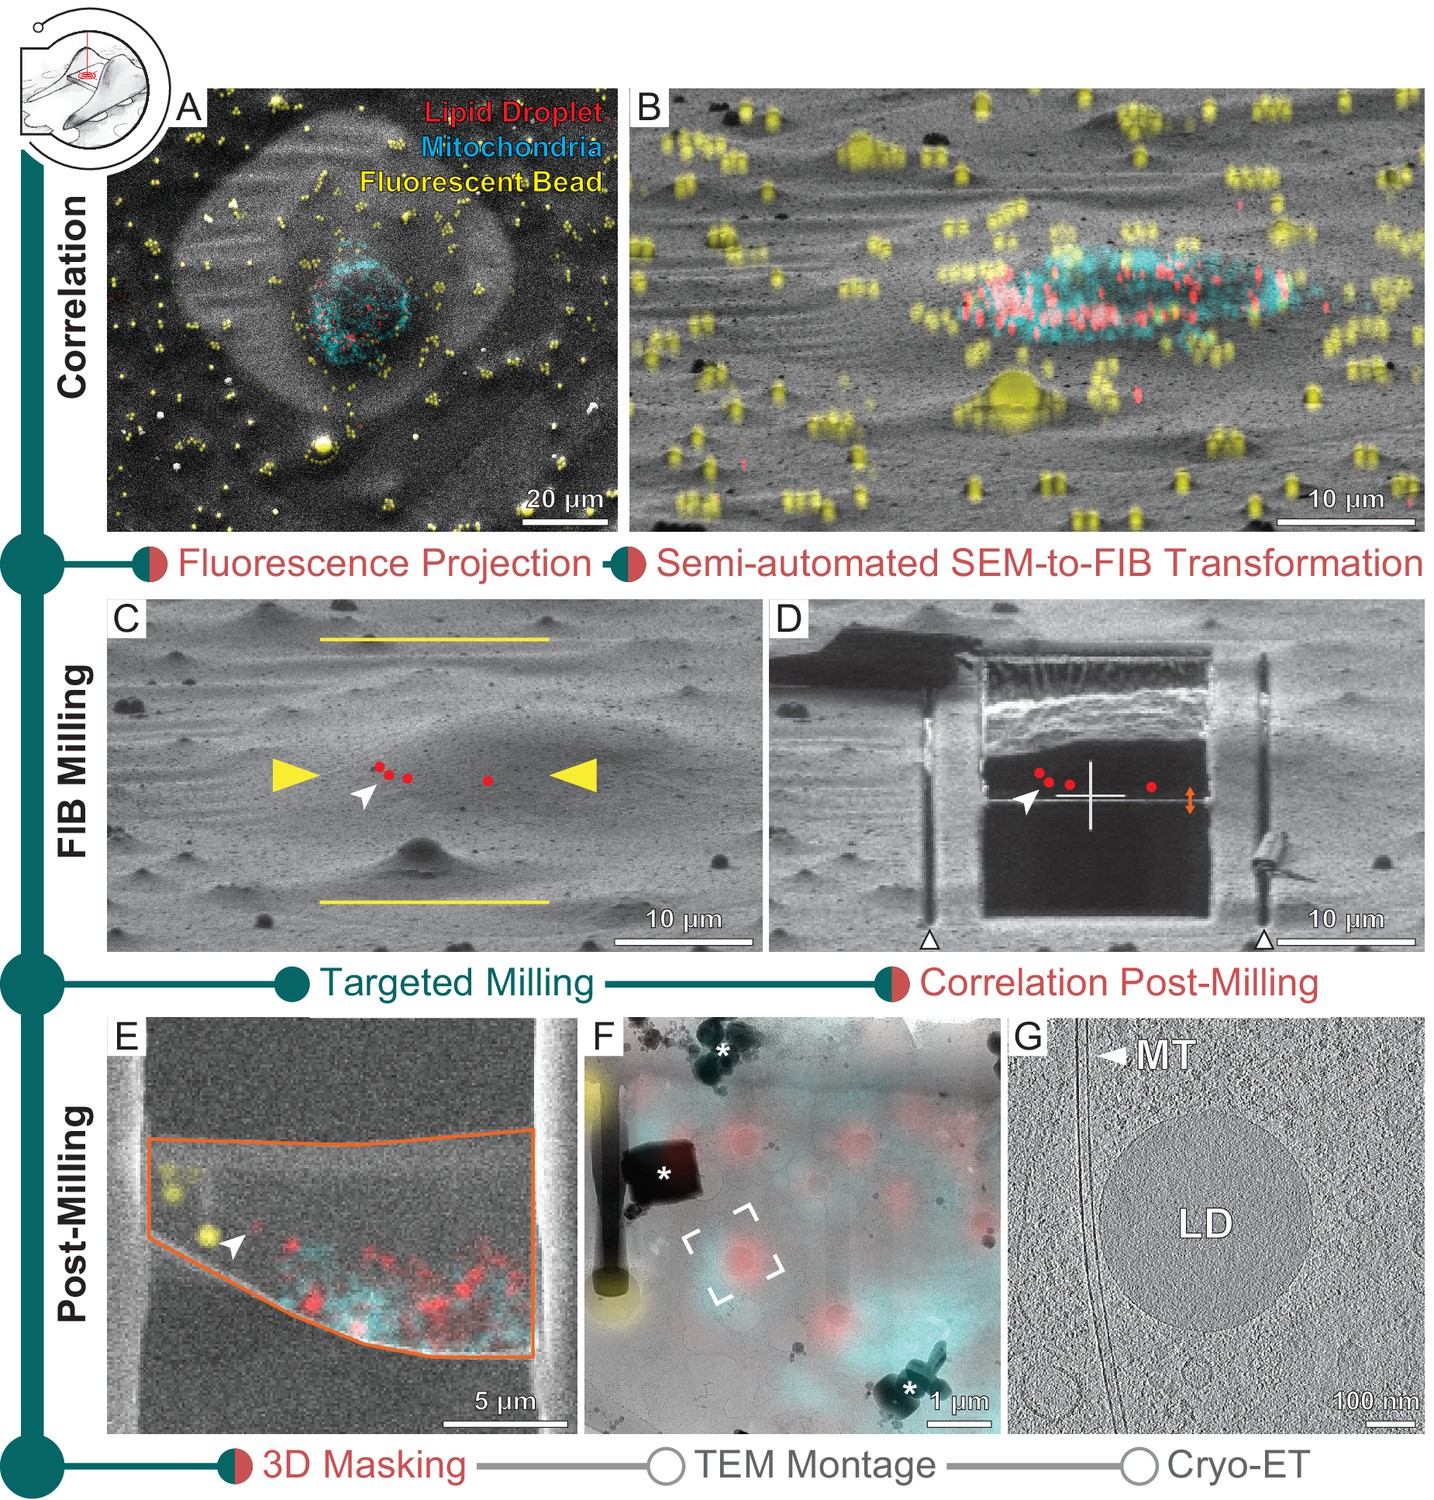
Three-dimensional correlative light and electron microscopy (3D-CLEM)-targeted lamella preparation of HeLa cells.
Green modules represent tasks performed with SerialFIB; orange, with 3D Correlation Toolbox (3DCT). (A) Scanning electron microscopy (SEM) and (B) focused ion beam (FIB) images of a cell. Overlaid are maximum intensity projections of cryo-fluorescence light microscopy (cryo-FLM) signal corresponding to lipid droplets (red), mitochondria (cyan), and beads (yellow). Correlation with the FIB image is aided by 3D transformation of fiducials detected in the SEM image. (C) Correlated positions of lipid droplets (red dots) imported into SerialFIB. White arrowhead indicates the targeted lipid droplet. Yellow arrowheads indicate the targeted lamella position; yellow lines indicate milling extreme positions. (D) Final lamella after automated FIB milling. Red dots indicate the position of lipid droplets following re-correlation with the FIB image after milling. White triangles highlight micro-expansion joints. (E) Masking of FLM volumes based on lamella outline in the SEM image (orange) and lamella position in the FIB image (orange double arrow in D). A 300 nm FLM virtual slice centered on the lamella is shown. (F) Overlay of the best-fitting fluorescence plane with the transmission electron microscopy (TEM) image of the lamella. Different heights were sampled in relation to the FIB image post-milling to determine the plane where bead and lipid droplet fluorescence signal overlaps best with the TEM image (see Materials and methods). White frame indicates the targeted lipid droplet and area of cryo-ET acquisition. * denotes ice crystal contamination from transfers. (G) Tomographic slice of area indicated in (F) depicts the cytosol with a microtubule (MT) and a lipid droplet (LD).
Figure 3—figure supplement 1
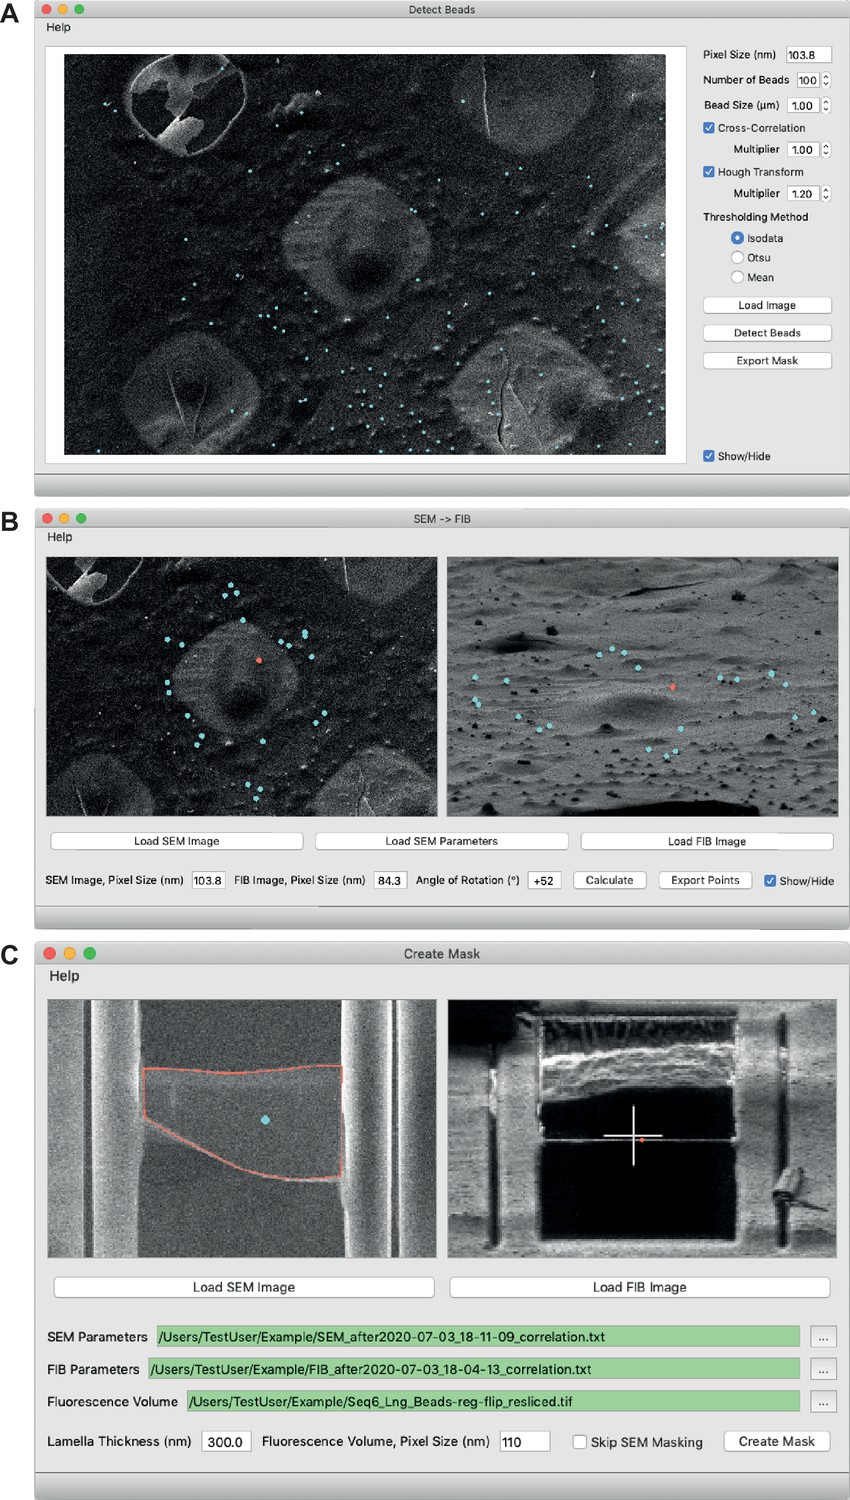
New 3D Correlation Toolbox (3DCT) features.
(A) Semi-automated detection of beads in scanning electron microscopy (SEM) images. Different methods for detection are available. Blue dots indicate beads found. (B) Rotation of fiducials from SEM (left) to focused ion beam (FIB) (right) orientation. Blue dots in the SEM image indicate fiducial beads used for correlation. Red dot in both images indicates a common feature defined manually, which serves as the center of rotation. Blue dots in the FIB image indicate the rotated positions. (C) 3D mask creation for generation of a virtual slice in the cryo-fluorescence light microscopy (cryo-FLM) volume. Red outline in the SEM image (left) indicates lamella boundary, and blue dot indicates lamella interior. Red dot in the FIB image (right) indicates the lamella position.
Figure 3—figure supplement 2
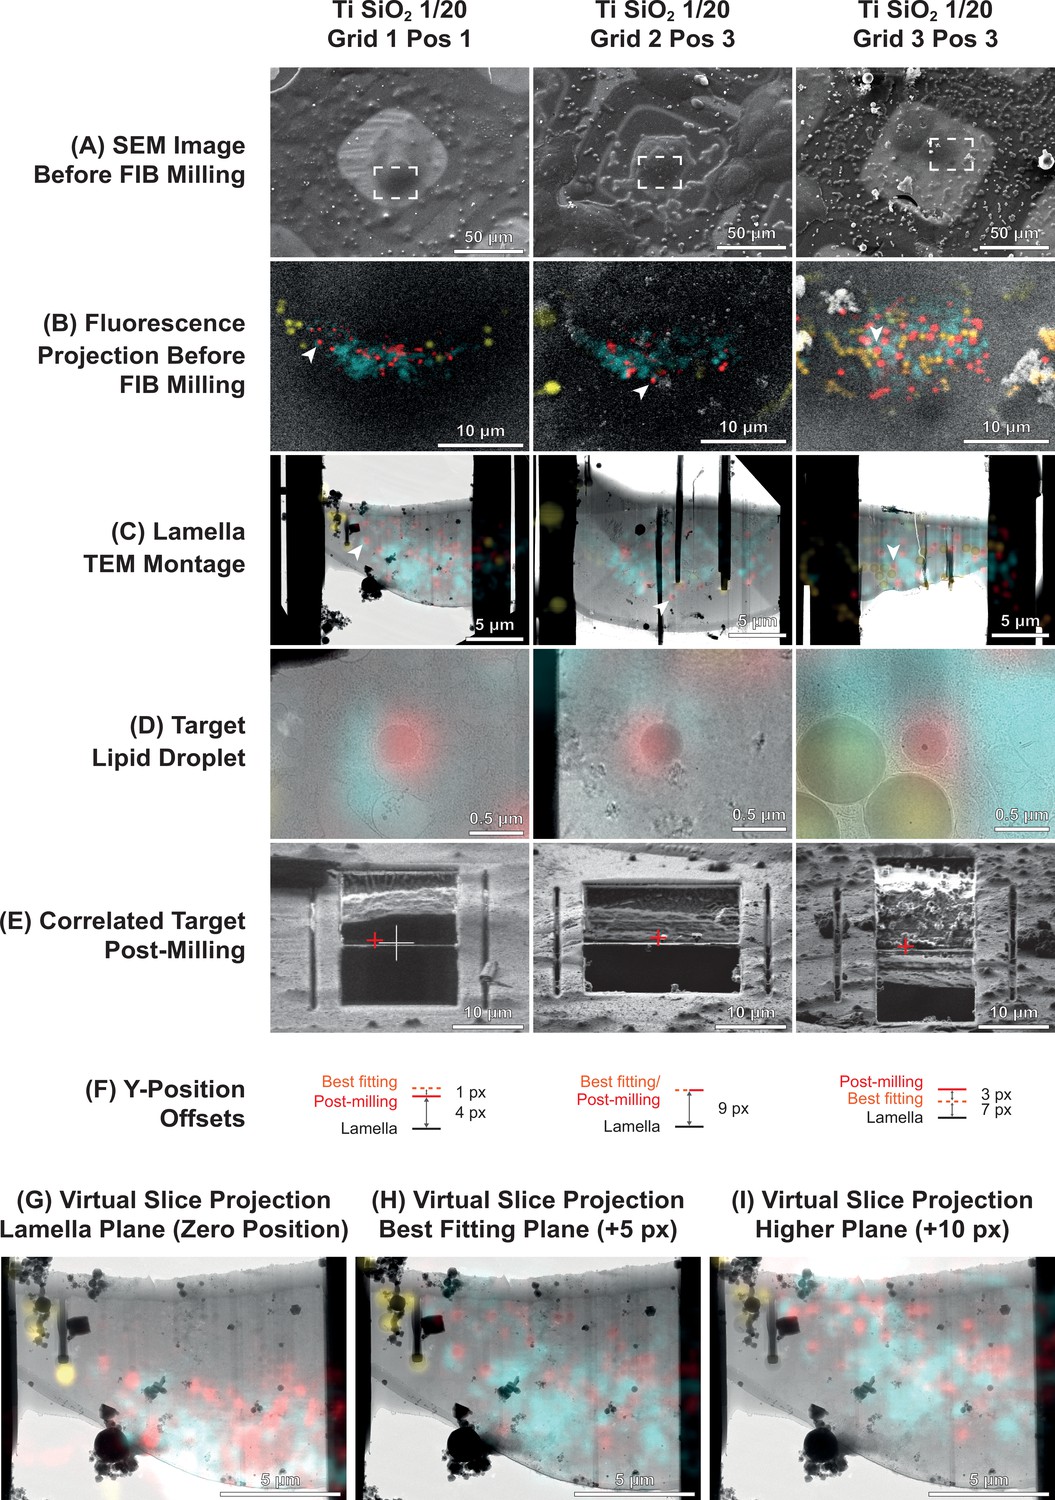
Examples of successful 3D-targeted milling of lipid droplets.
(A) Scanning electron microscopy (SEM) images before focused ion beam (FIB) milling. (B) Cryo-fluorescence light microscopy (cryo-FLM) volumes projected onto SEM images before FIB milling in the areas indicated in (A). Red, lipid droplets; cyan, mitochondria; yellow, fiducial beads. White arrowhead indicates the targeted lipid droplet. (C) Transmission electron microscopy (TEM) montage of the lamella, overlaid with the best-fitting fluorescence virtual slice. The best-fitting slice was determined by sampling slices of the cryo-FLM volume corresponding to different heights (along the y axis) in the FIB image generated using the 3D Correlation Toolbox (3DCT) masking utility. See panels (G–I). Vertical black stripes in the montage are curtaining artifacts due to different ablation rates of the fiducial beads. (D) Zoom-in view of the targeted lipid droplet (arrowheads in C). (E) FIB view of the final lamella. Red cross indicates the correlated position of the target lipid droplet based on the final FIB image post-milling. (F) Offsets of correlated positions post-milling and positions of the best-fitting slice relative to the final lamella position in the FIB image, tabulated in Supplementary file 2. (G-I) Determination of the best-fitting slice for Grid 1 Position 1 by matching of lipid droplet (red) and microbead fiducial (yellow) fluorescence at different heights in the FIB image with the lamella TEM montage.
Figure 3—figure supplement 3
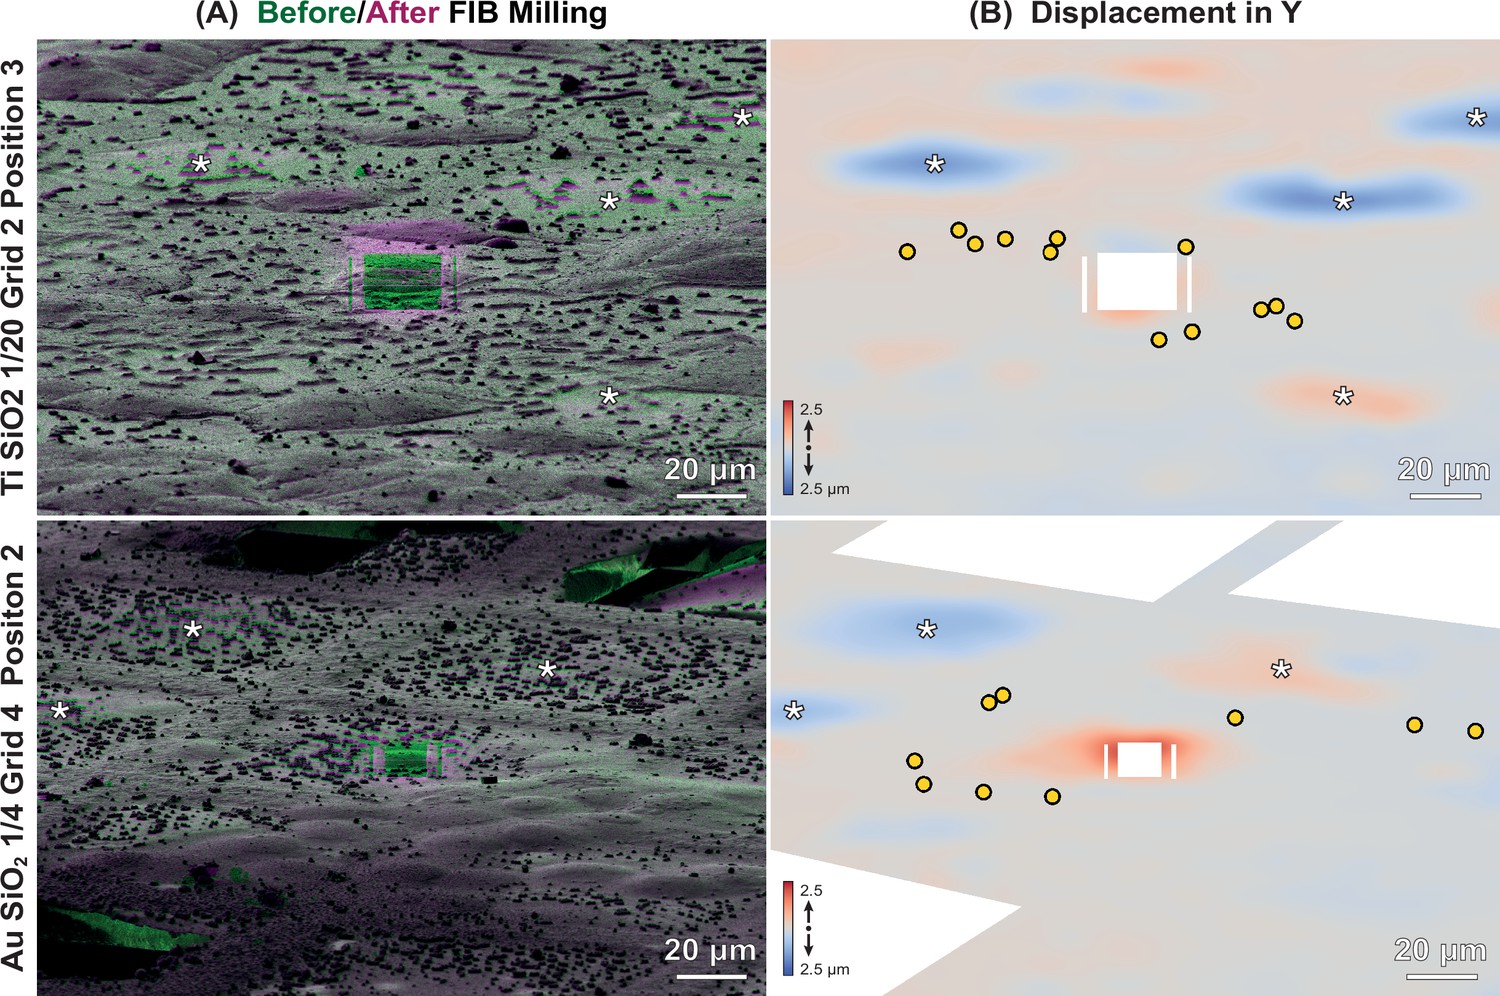
Local deformations of specimens.
(A) Overlay of representative focused ion beam (FIB) images of HeLa cells on Ti SiO2 1/20 (top) or Au SiO2 1/4 (bottom), before (green), and after milling (magenta). Grid and position numbering corresponds to Supplementary file 2. (B) Heatmap depicting displacements in the y-direction of FIB image determined by 2D elastic B-spline registration using bUnwarpJ (Arganda-Carreras et al., 2006). Red, up; blue, down. Yellow circles represent beads used for correlation in 3D Correlation Toolbox (3DCT). White areas were excluded from the analysis, which included broken squares, surface contaminants, and the site of milling. White asterisks indicate unmilled squares, which exhibited strong deformations (up to 2.5 μm).
Figure 3—video 1
Tomographic volume of a HeLa cell related to Figure 3G depicting the cytosol with microtubules (MT), a lipid droplet (LD), and a multivesicular body (MVB).
* denotes ice reflections originating from incomplete vitrification.
Figure 4 with 5 supplements
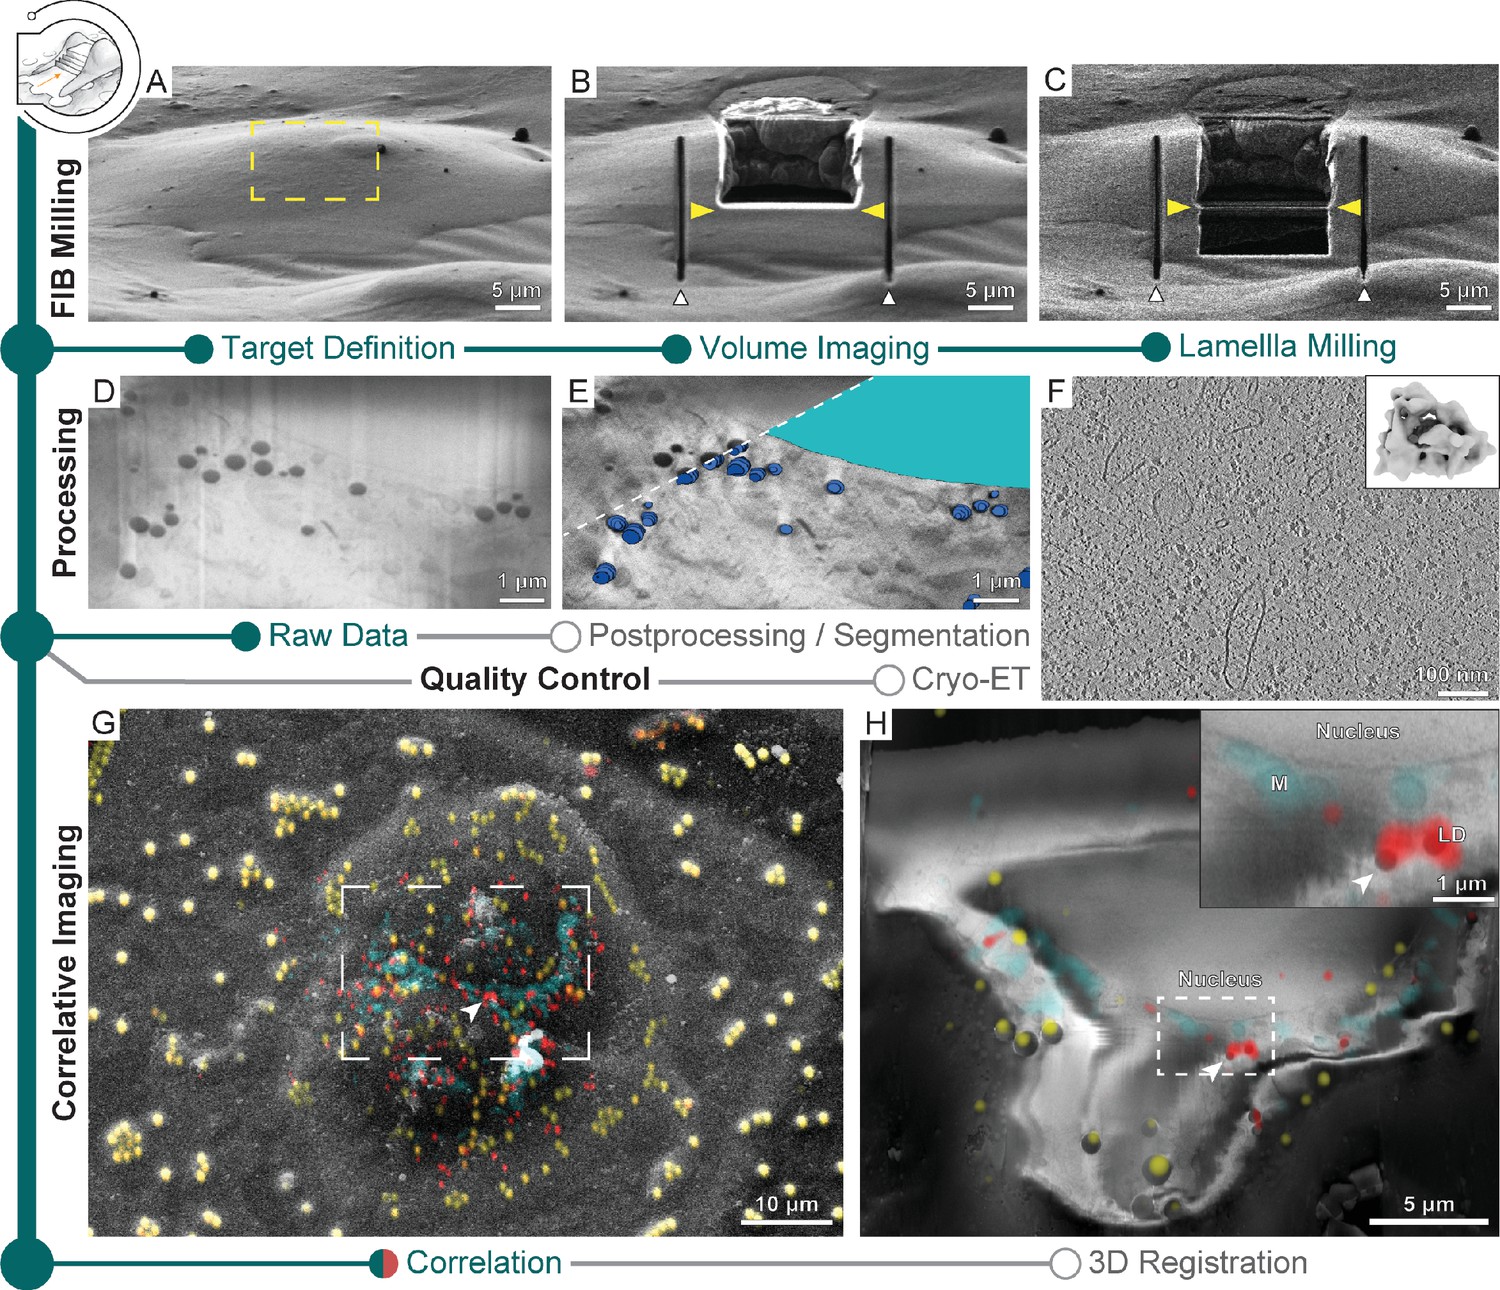
Multi-modal 3D cryogenic imaging by focused ion beam-scanning electron microscopy (FIB-SEM) volume imaging and cryo-electron tomography (cryo-ET).
Green modules represent tasks performed with SerialFIB; orange, with 3D Correlation Toolbox (3DCT). Gray modules represent tasks performed externally. (A) Focused ion beam (FIB) image of a Sum159 breast cancer cell prior to milling. Yellow rectangle indicates the volume for FIB-SEM volume data acquisition. (B) FIB image of the cell after FIB-SEM volume imaging. Yellow arrowheads indicate the defined position for lamella preparation. White arrowheads indicate micro-expansion joints prepared after volume imaging. (C) FIB image of the final lamella. (D) Representative slice of the raw FIB-SEM volume data and (E) postprocessed data, overlaid with manual segmentations of lipid droplets (dark blue) and the nucleus (cyan). (F) Slice through a tomogram acquired from lamella in (C). Inset shows the ribosome subtomogram average from data collected on lamellae prepared by this workflow (two tomograms; 3380 subtomograms; 24 Å resolution). (G) SEM view of two HeLa cells overlaid with a fluorescence light microscopy (FLM) maximum intensity projection of lipid droplet (red), mitochondria (cyan), and fiducial bead (yellow) fluorescence signals, determined by correlation in 3D Correlation Toolbox (3DCT). (H) Representative slice through the postprocessed FIB-SEM volume overlaid with a 200 nm virtual slice through the affine-transformed 3D-registered fluorescence volumes. White arrowhead points to a pair of lipid droplets, which are displayed at higher magnification in the inset.
Figure 4—figure supplement 1

Serial focused ion beam-scanning electron microscopy (FIB-SEM) volume imaging of C. reinhardtii and subsequent image processing adapted from Spehner et al., 2020.
(A) Raw data. Arrowheads indicate curtaining artifacts from ion beam milling. (B) De-striped image using wavelet decomposition to eighth level, Coiflets family 3 and Gaussian blurring (sigma = 6) of the vertical component. (C) Local charge adjusted by image subtraction of a Gaussian blurred (sigma = 35) and subsequently three times eroded image from the image in (B). (D) Image after median filtering (3.0 pixels) and local contrast enhancement using CLAHE (slope 3.0). (E–G) Zoom into regions indicated in (D), showing a Golgi stack (E, rectangle), thylakoid membranes (F), the nucleolus (E and G, dashed circles), and nuclear pore complexes in the nuclear envelope (G, arrowheads).
Figure 4—figure supplement 2
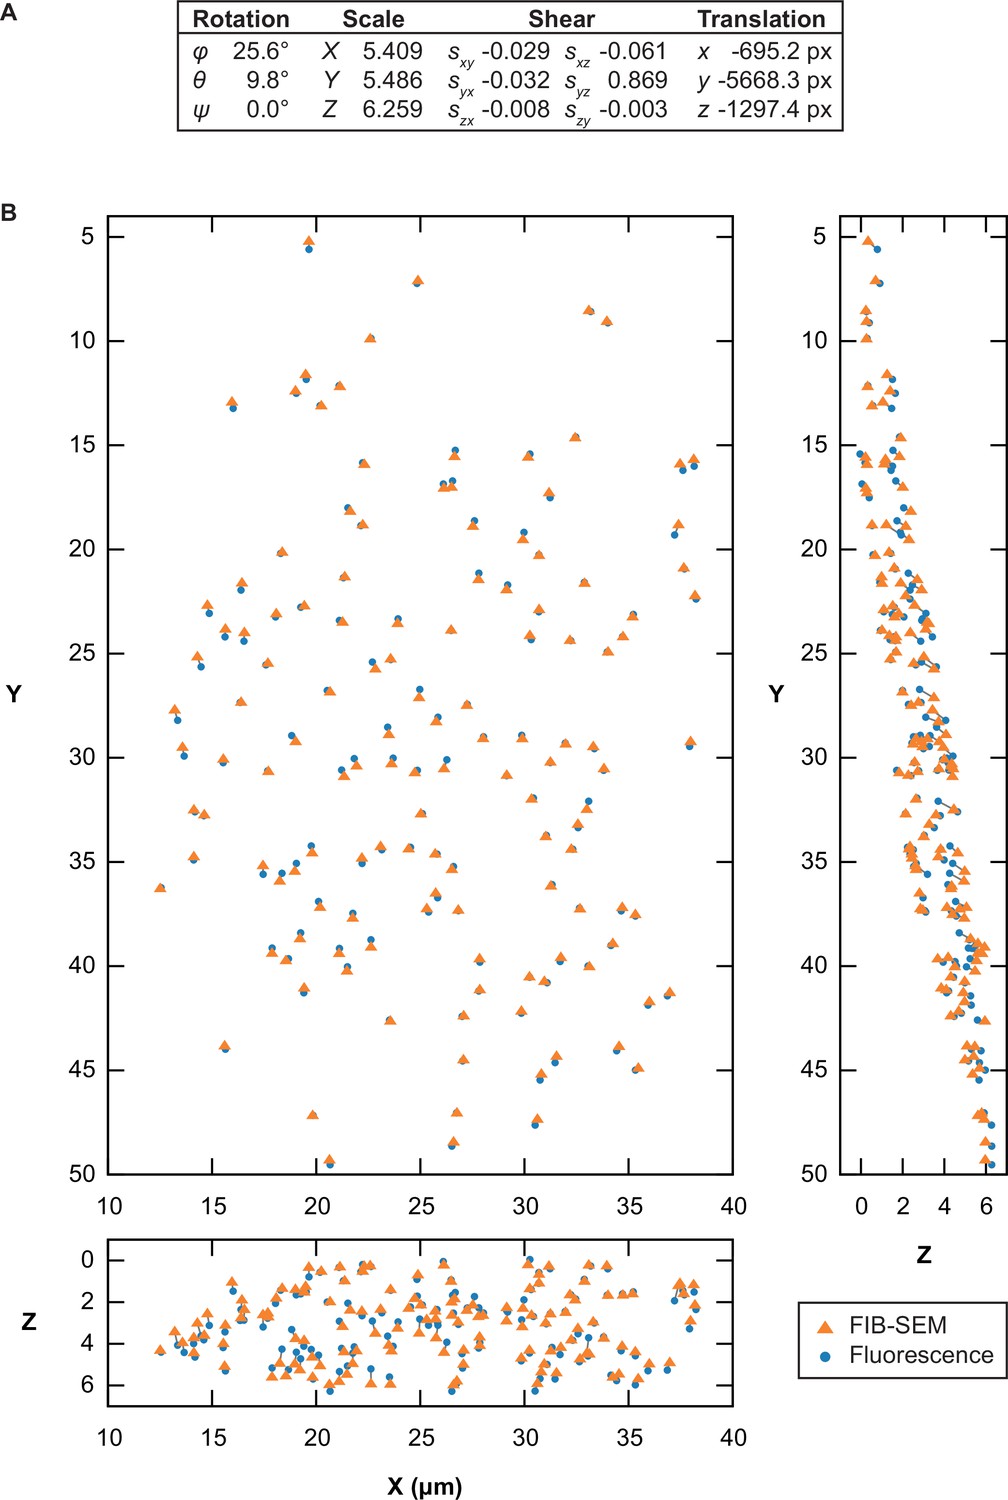
Point-based affine 3D registration between focused ion beam-scanning electron microscopy (FIB-SEM) and fluorescence volumes.
Registration in 3D Correlation Toolbox (3DCT) based on the unweighted centroids of lipid droplets and beads manually segmented in the FIB-SEM data, and centers of their fluorescence signal from Gaussian fitting in the corresponding fluorescence light microscopy (FLM) volume (n = 133). Lipid droplet and bead coordinates were pooled and used equally for the registration. (A) Fitted parameters for transformation of the FLM volume. Euler rotation angles are given in zxz convention. Shear factor syz represents shearing in y along the z axis. (B) 2D orthogonal projections of the FIB-SEM and transformed fluorescence coordinates. A gray line connects matching points between the two volumes. The root-mean-square-deviation of the fit was 386 nm, with residuals ranging from 29 nm to 882 nm.
Figure 4—video 1
Cryo-focused ion beam-scanning electron microscopy (cryo-FIB-SEM) volume of a Sum159 cell depicting raw and postprocessed data with segmentations of lipid droplets (blue) and the nucleus (cyan).
Figure 4—video 2
Tomographic volume of a Sum159 breast cancer cell related to Figure 4F depicting the cytosol with two vault structures and a vesicle (V).
Figure 4—video 3
Focused ion beam-scanning electron microscopy (FIB-SEM) volume of HeLa cells in Figure 4H, superposed with lipid droplet and bead segmentations and fluorescence volumes transformed.
Figure 5 with 2 supplements
Cryo-focused ion beam (cryo-FIB) lift-out from high-pressure frozen (HPF) D. melanogaster egg chambers.
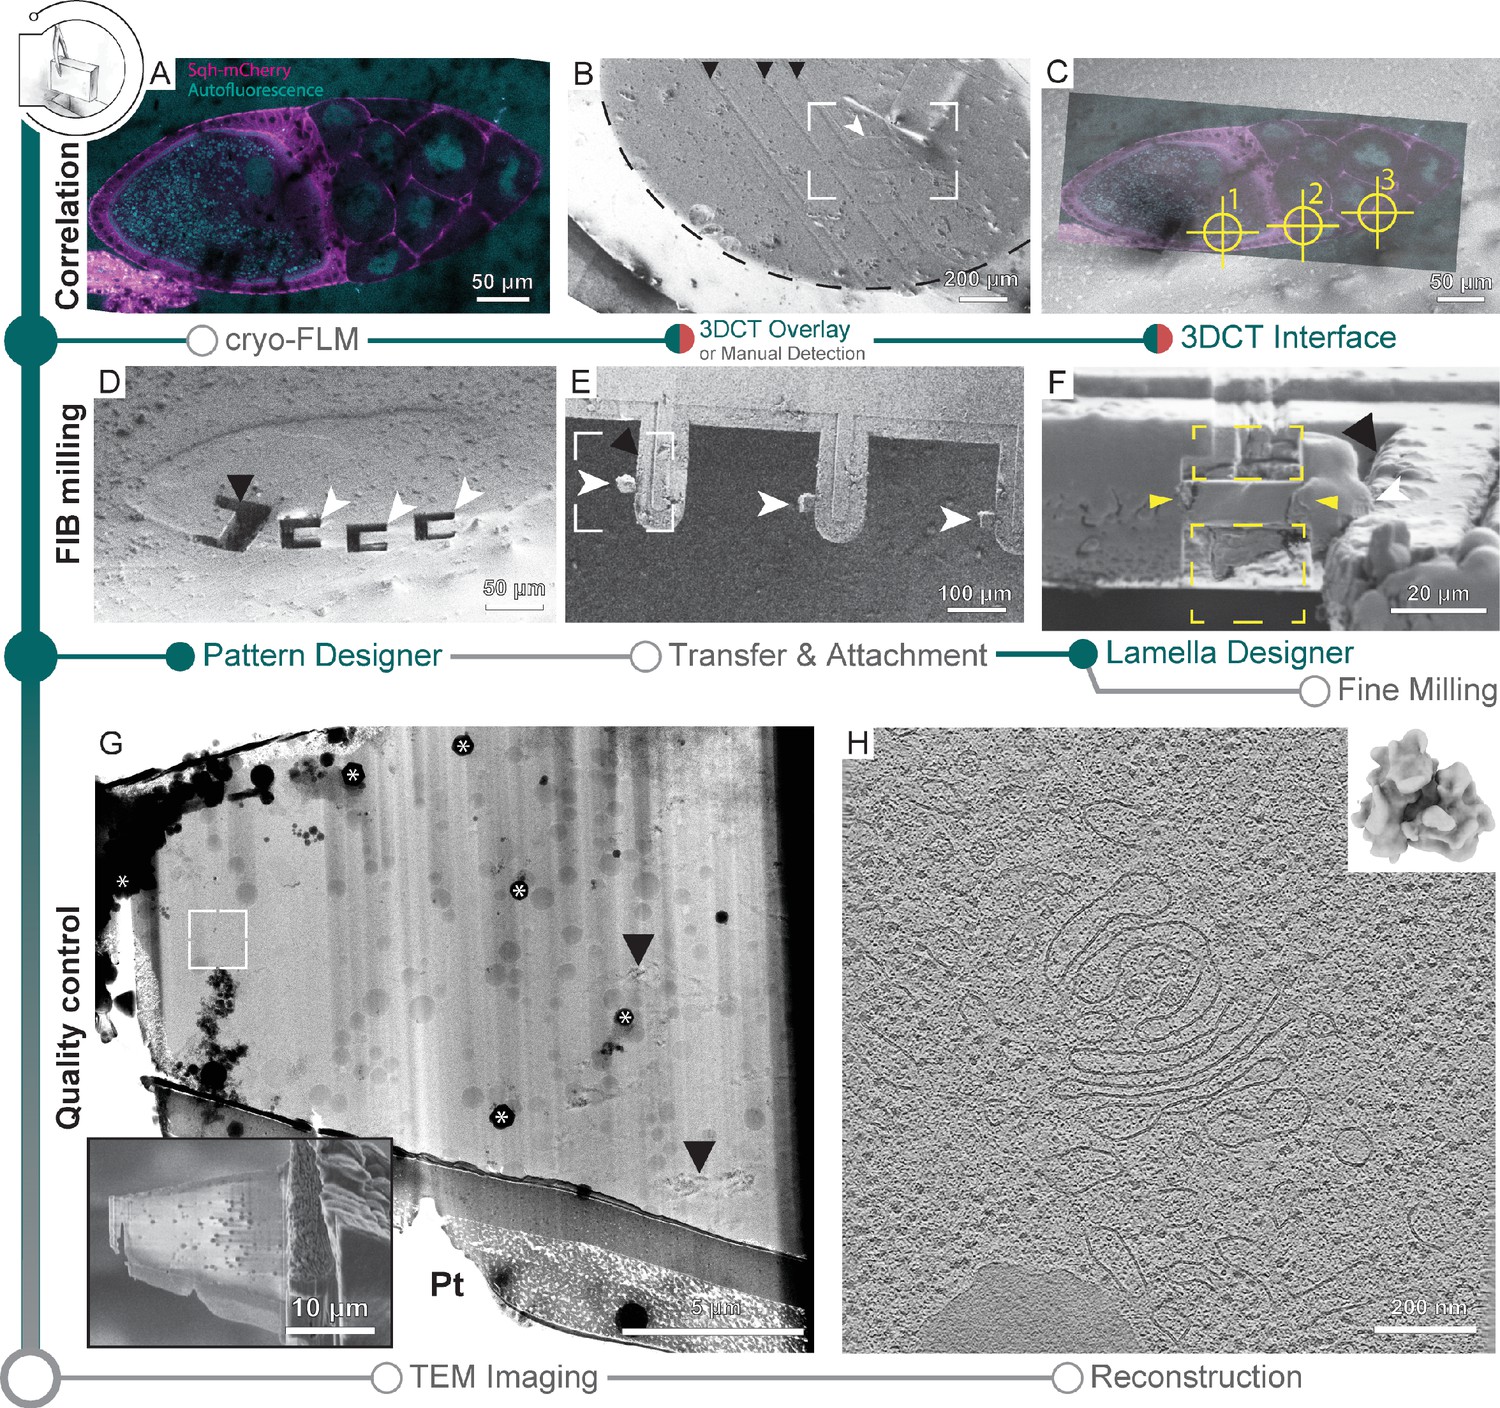
(A) Cryo-fluorescence light microscopy (cryo-FLM) image of an egg chamber expressing Sqh-mCherry (magenta). Autofluorescence (cyan) indicates oocyte and nurse cell nuclei. The anterior of the egg chamber is to the right. (B) Scanning electron microscopy (SEM) overview of the sample in (A). Black arrowheads indicate knife marks introduced during planing in the cryo-ultramicrotome. White arrowhead indicates the egg chamber. Dashed line outlines the frozen material within the HPF planchette. Frame indicates the area depicted in (C). (C) Overlay of the cryo-FLM and SEM image of the egg chamber. Crosshairs indicate positions chosen for trench preparation, marked 1–3. (D) SEM image of sites prepared for lift-out. Black arrowhead indicates a site produced for FIB-SEM volume imaging to confirm correlation with the fluorescence data, prior to lift-out site preparation (compare Figure 5—figure supplement 1). (E) SEM overview of the half-moon grid after transfer and attachment of the lift-out specimens. White arrowheads indicate the biological material attached to the grid pins (black arrowhead). Frame indicates the region shown in (F). (F) FIB image of the lift-out specimen (yellow arrowheads) after attachment to a half-moon grid. Yellow rectangles indicate the milling area for lamella thinning. White arrowhead indicates the lift-out specimen from (F). Black arrowhead indicates the edge of the half-moon pin. (G) Transmission electron microscopy (TEM) overview of the lamella from (F). Inset shows the SEM image of the final lamella prior to transfer to the TEM. White frame denotes the area of the tomogram shown in (H). Asterisks indicate ice contamination from transfer, arrowheads indicate reflection artifacts from poorly vitrified local regions. Pt: protective organometallic platinum layer at the front of the lamella. (H) Single slice through the tomogram collected on the lamella shown in (G). Inset shows the D. melanogaster ribosome subtomogram average produced from the dataset collected on two lift-out lamellae (8 tomograms; 20,284 subtomograms, 20.8 Å).
Figure 5—figure supplement 1
Correlation for cryo-focused ion beam (cryo-FIB) lift-out from high-pressure frozen (HPF) D. melanogaster egg chamber.
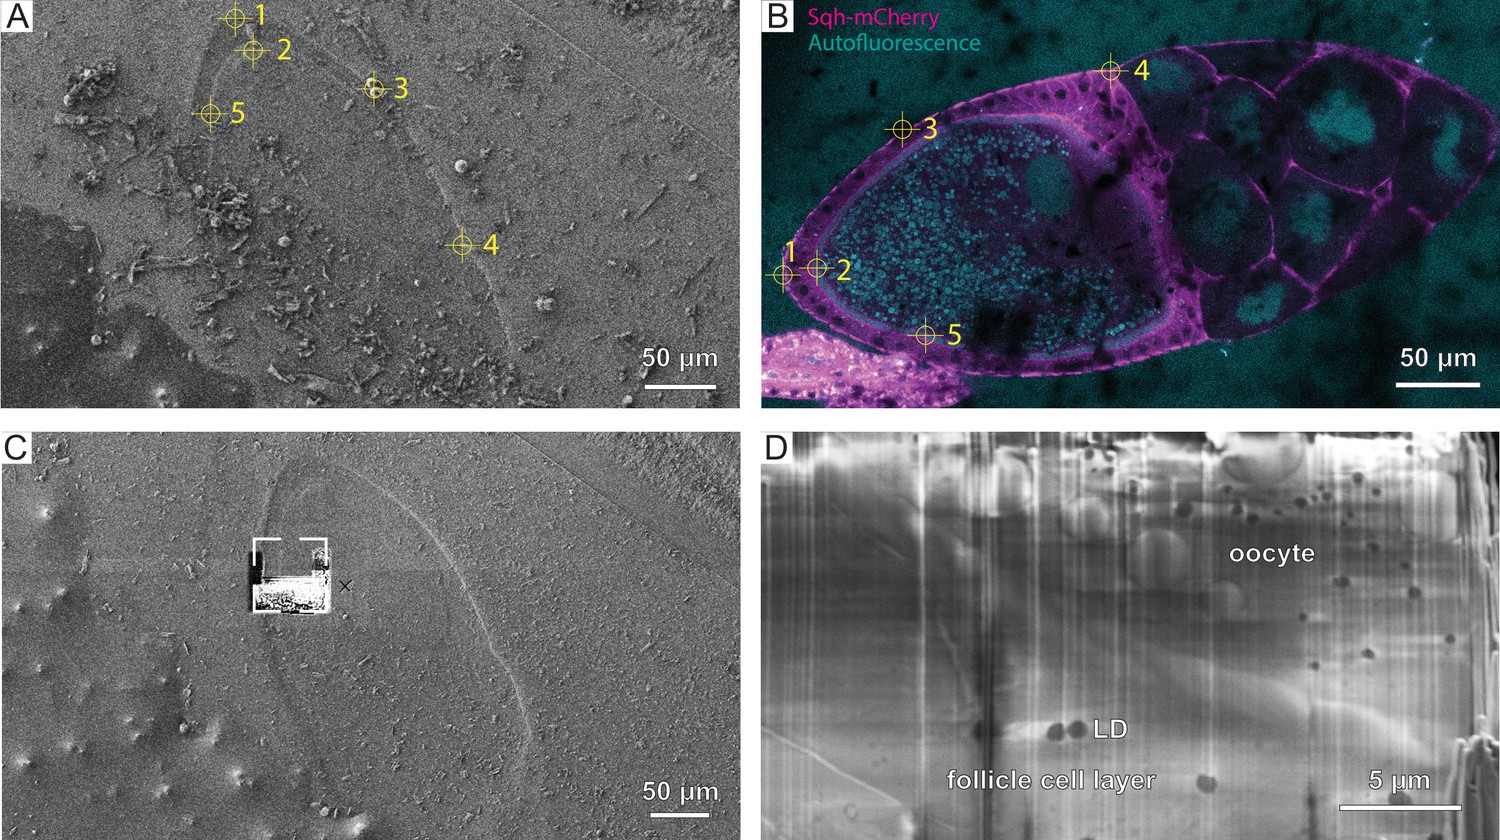
(A) FIB and (B) cryo-fluorescence light microscopy (cryo-FLM) image (anterior to the right) used for correlation. Crosshair and numbering indicate features used for registration of the two imaging modalities in 3D Correlation Toolbox (3DCT). (C) FIB image of the trench milled for scanning electron microscopy (SEM) imaging. Frame indicates the region imaged in (D). (D) SEM image of the prepared surface showing the oocyte and follicle cell layer, as well as cellular features such as lipid droplets (LD).
Figure 5—video 1
Tomographic volume from a D. melanogaster lift-out lamellae related to Figure 5H depicting the cytosol with a lipid droplet (LD) and a Golgi apparatus.
Figure 6

Fourier shell correlation (FSC) curves for ribosome subtomogram averages from (A) Sum159 cells, (B) Sum 159 cells after focused ion beam-scanning electron microscopy (FIB-SEM) volume imaging, and from (C) a D. melanogaster egg chamber.
FSC threshold at 0.143 indicated by gray dotted line.
Author response image 1
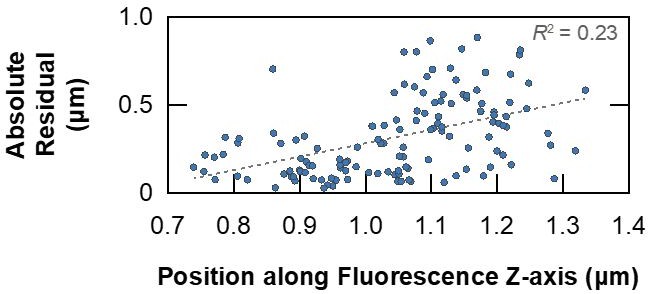
Absolute residuals from the point-based affine 3D registration between FIB-SEM and fluorescence volumes of HeLa cells presented in Figure 4—figure supplement 2, plotted against their z-position in the fluorescence volume for each point.
Correlation between residual error and imaging depth is weak in this instance, as reflected in the squared Pearson correlation coefficient.
Tables
Table 1
Statistics and success rates of automated on-grid lamellae milling with SerialFIB for five different cell types.
| Sample | # Target sites | # Fine-milled lamellae | # Successfully transferred to TEM | Lamella thickness (nm) |
|---|---|---|---|---|
| Sum159 | 22 | 19 | 17 | 70–410 |
| HeLa | 22 | 18 | 18 | 100–450 |
| E. huxleyi | 9 | 9 | 9 | 175–470 |
| C. reinhardtii | 16 | 10 | n/a | 140–350 |
| S. cerevisiae | 8 | 8 | 8 | 190–300 |
| Total | 77 | 64 | ||
| Success rate (%) | 83.1 |
-
TEM, transmission electron microscope.
Key resources table
| Reagent type (species) or resource | Designation | Source or reference | Identifiers | Additional information |
|---|---|---|---|---|
| Cell line(Homo sapiens) | HeLa Kyoto | Hyman Lab, MPI-CBG | RRID:CVCL_1922 | |
| Cell line(H. sapiens) | Sum159 | Walter and Farese Lab, Harvard T.H. Chan School of Public Health | RRID:CVCL_5423 | |
| Strain, strain background (Saccharomyces cerevisiae) | Ede1-eGFP | Wilfling lab, MPI for Biophysics | FWY0153 | MATα, his3-Δ200, leu2-3,2-112, lys2- 801, trp1-1(am), ura3-52, yap1801Δ::kanMX4, yap1802Δ::hphNT1, apl3Δ::HIS3MX6, Ede1::EGFP::TRP1, atg15Δ::natNT2, atg19Δ::URA3 |
| Strain, strain background (Emiliania huxleyi) | Eh1 | Vardi Lab, Weizmann Institute of Science | Isolated in June 2018 at Espegrend, Norway | |
| Strain, strain background (Chlamydomonas reinhardtii) | mat3-4 | Chlamydomonas Resource Center, University of Minnesota, MN | CC-3994 | |
| Strain, strain background (C. reinhardtii) | CW15 | Chlamydomonas Resource Center, University of Minnesota, MN | CC-400 | Reference cell-wall deficient WT strain of Chlamydomonas |
| Genetic reagent (Drosophila melanogaster) | sqh-mCherry | Blooming ton Drosophila Stock Center | FLYB: FBst0059024 | FlyBase genotype: w*; P{sqh-mCherry.M}3 |
| Other | BODIPY 558/568C12 | Thermo Fisher Scientific | D3835 | Lipid droplet live stain (1:2000) |
| Other | Mito Tracker Green(490/516) | Thermo Fisher Scientific | M7514 | Mitochondria live stain (1:2000) |
| Other | Carboxylate-Modified Microspheres, 1.0 µm, crimson fluorescent (625/645) | Thermo Fisher scientific | F8816 | Fluorescence bead fiducials for 3D correlation (1:30) |
| Software, algorithm | SerialFIB | https://github.com/sklumpe/SerialFIB (copy archived at swh:1:rev:0eaaaf66afa2d803440cea18af85c444df10478f, Klumpe, 2021) | This study | |
| Software, algorithm | AutoScript4 | Thermo Fisher Scientific | https://www.thermofisher.com/de/de/home/electron-microscopy/products/software-em-3d-vis/autoscript-4-software.html | |
| Software, algorithm | LAS X | Leica Microsystems | https://www.leica-microsystems.com/products/microscope-software/p/leica-las-x-ls/ | |
| Software, algorithm | Fiji | https://imagej.net/software/fiji/ | ||
| Software, algorithm | 3DCT | https://3dct.semper.space/index.html | ||
| Software, algorithm | SerialEM | https://bio3d.colorado.edu/SerialEM/ | ||
| Software, algorithm | Warp | http://www.warpem.com/warp/ | ||
| Software, algorithm | TOMOMAN | https://github.com/williamnwan/TOMOMAN | ||
| Software, algorithm | MotionCorr2 | https://emcore.ucsf.edu/ucsf-software | ||
| Software, algorithm | NovaCTF | Turoňová et al., 2017b | ||
| Software, algorithm | CTFFIND4 | https://grigoriefflab.umassmed.edu/ctffind4 | ||
| Software, algorithm | IMOD | https://bio3d.colorado.edu/imod | ||
| Software, algorithm | pyTOM | https://pytom.sites.uu.nl/ | ||
| Software, algorithm | RELION | https://www3.mrc-lmb.cam.ac.uk/relion/index.php/Main_Page | ||
| Software, algorithm | STOPGAP | Wan, 2020 | ||
| Software, algorithm | UCSF ChimeraX | https://www.rbvi.ucsf.edu/chimerax/ | ||
| Other | Cryo-Gripper | Kleindiek Nanotechnik | https://www.nanotechnik.com/cryoliftout.html |
Additional files
-
Supplementary file 1
Selected parameters for milling of micro-expansion joints, lamella rough, and fine milling of five different cell types.
- https://cdn.elifesciences.org/articles/70506/elife-70506-supp1-v2.docx
-
Supplementary file 2
Correlated lipid droplet positions post-milling and best-fitting fluorescence plane position in the y-direction of the focused ion beam (FIB) image relative to the observed lamella position.
- https://cdn.elifesciences.org/articles/70506/elife-70506-supp2-v2.docx
-
Transparent reporting form
- https://cdn.elifesciences.org/articles/70506/elife-70506-transrepform1-v2.docx
Download links
A two-part list of links to download the article, or parts of the article, in various formats.
Downloads (link to download the article as PDF)
Open citations (links to open the citations from this article in various online reference manager services)
Cite this article (links to download the citations from this article in formats compatible with various reference manager tools)
A modular platform for automated cryo-FIB workflows
eLife 10:e70506.
https://doi.org/10.7554/eLife.70506


