Impaired HA-specific T follicular helper cell and antibody responses to influenza vaccination are linked to inflammation in humans
- Department of Immunology and Pathology, Monash University, Australia
- Immunology Program, The Babraham Institute, Babraham Research Campus, United Kingdom
- Division of Nephrology, Department of Medicine and Clinical and Translational Science Institute, University of Rochester Medical Center, United States
- Benaroya Research Institute at Virginia Mason, Translational Research Program and Tetramer Core Laboratory, United States
- Department of Medicine, Cambridge Biomedical Campus, University of Cambridge, United Kingdom
- Cambridge Institute of Therapeutic Immunology & Infectious Disease, Jeffrey Cheah Biomedical Centre, Cambridge Biomedical Campus, University of Cambridge, United Kingdom
- Benaroya Research Institute at Virginia Mason, Diabetes Program, United States
- Department of Medicine, University of Washington, United States
Figures
Figure 1 with 6 supplements

Robust haemagglutinin (HA)-specific CD4+ T cells’ response to seasonal influenza vaccination.
(A) Overview of cohort characteristics, vaccination strains, and immune variables measured before (d0), 7 days (d7), and 42 days (d42) after seasonal influenza vaccination. (B) IgG responses to HA proteins from vaccine influenza strains measured by Luminex. Dashed line indicates limit of detection in Luminex assay. (C) Log2 fold change versus -log10 false discovery rate (FDR)-adjusted p-value of Flu HA Luminex, Cytokine Luminex, B cell and CD4+ T cell immunophenotyping parameters before and after vaccination at indicated time points for cohort 1. Dashed line represents the p-value cut-off at FDR-adjusted p=0.05. (D) Representative flow cytometry plots of HA257-276HLADR*0701 staining on CD4+CD45RA- cells, gate corresponds to HA-specific TET+ T cells, and (E) the frequency of HA-specific TET+ T cells among all CD4+CD45RA- cells on d0 compared to d7. (F) Representative ICOS staining and (G) the percentage of ICOS+ cells among HA-specific TET+ T cells on d0 and d7. (H) CXCR5 and PD1 staining on HA-specific TET+ T cells on d0 and d7, gate corresponds to ‘TET+cTfh’ T cells, and (I) the percentage of circulating T follicular helper (cTfh) cells among HA-specific TET+ T cells on d0 and d7 for each cohort. In parts (D–I), cohort 1 n = 16; cohort 2 n = 19. Paired p-values determined using Wilcoxon signed-rank test.
Figure 1—figure supplement 1
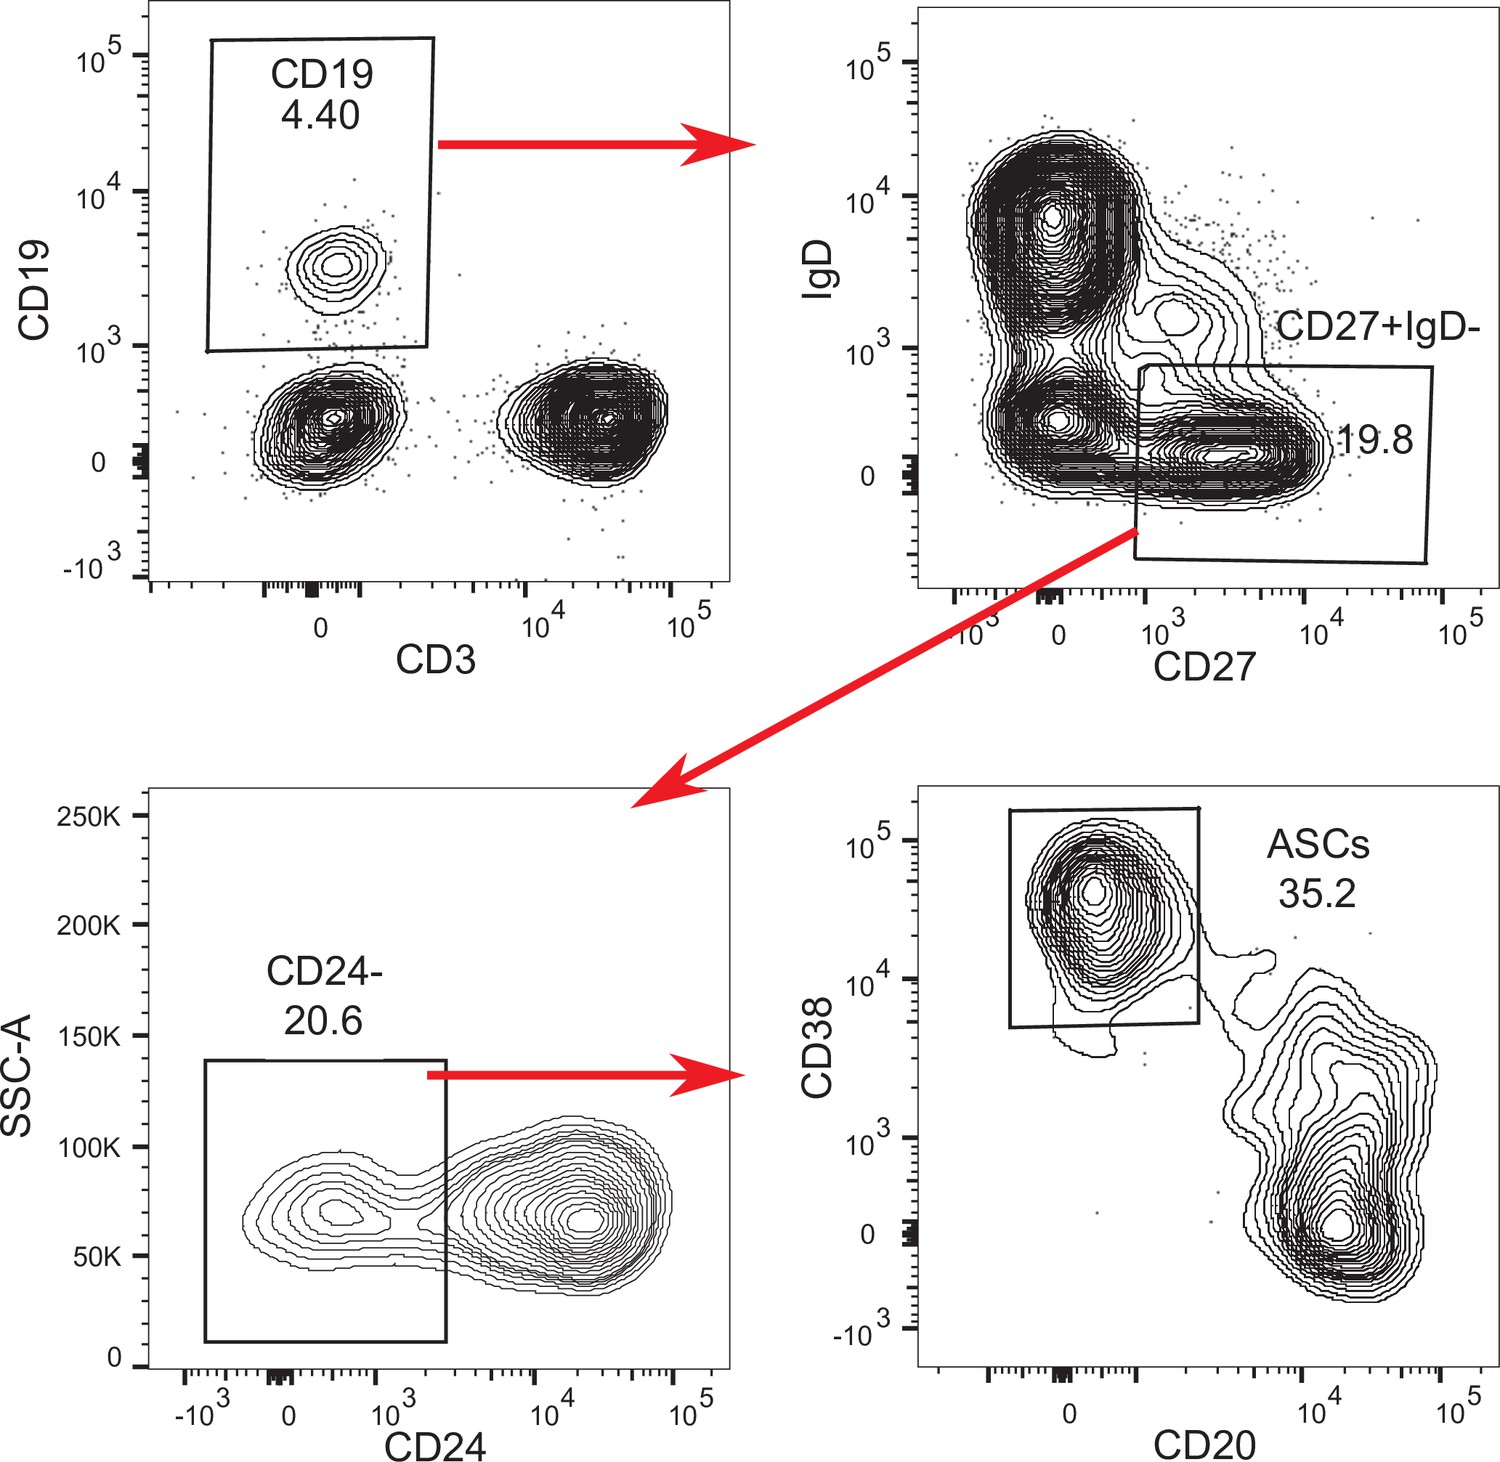
B cell flow cytometry gating strategy.
Representative flow cytometry plots for B cell immunophenotyping pre-gated on single, live lymphocytes, stained with the panel outlined in Supplementary file 3.
Figure 1—figure supplement 2
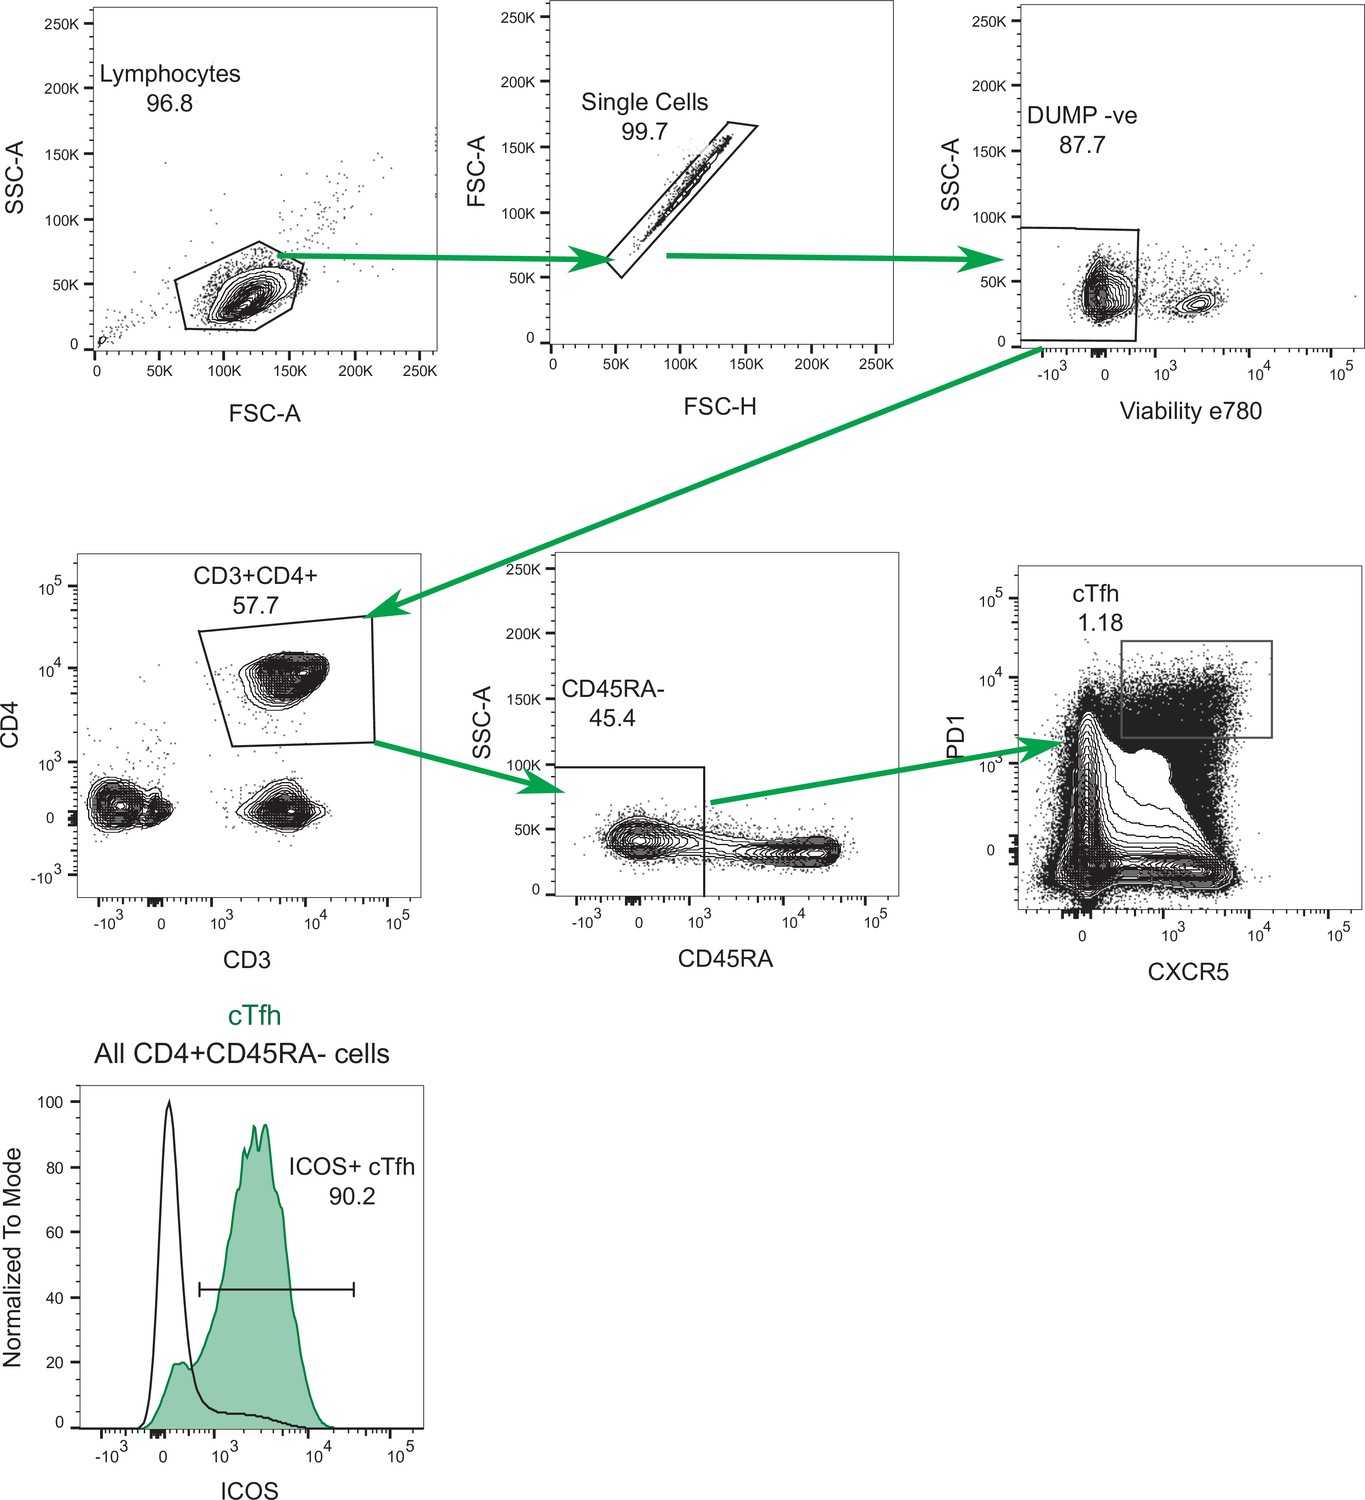
CD4+ T cell flow cytometry gating strategy.
Representative flow cytometry plots for the analysis of CD4+ T cells, stained with the panel outlined in Supplementary file 4. Histograms show representative staining for ICOS expression on d7 circulating T follicular helper (cTfh) cells (green) shown relative to the entire CD4+ CD45RA- T cell population (black outline) from the same sample.
Figure 1—figure supplement 3
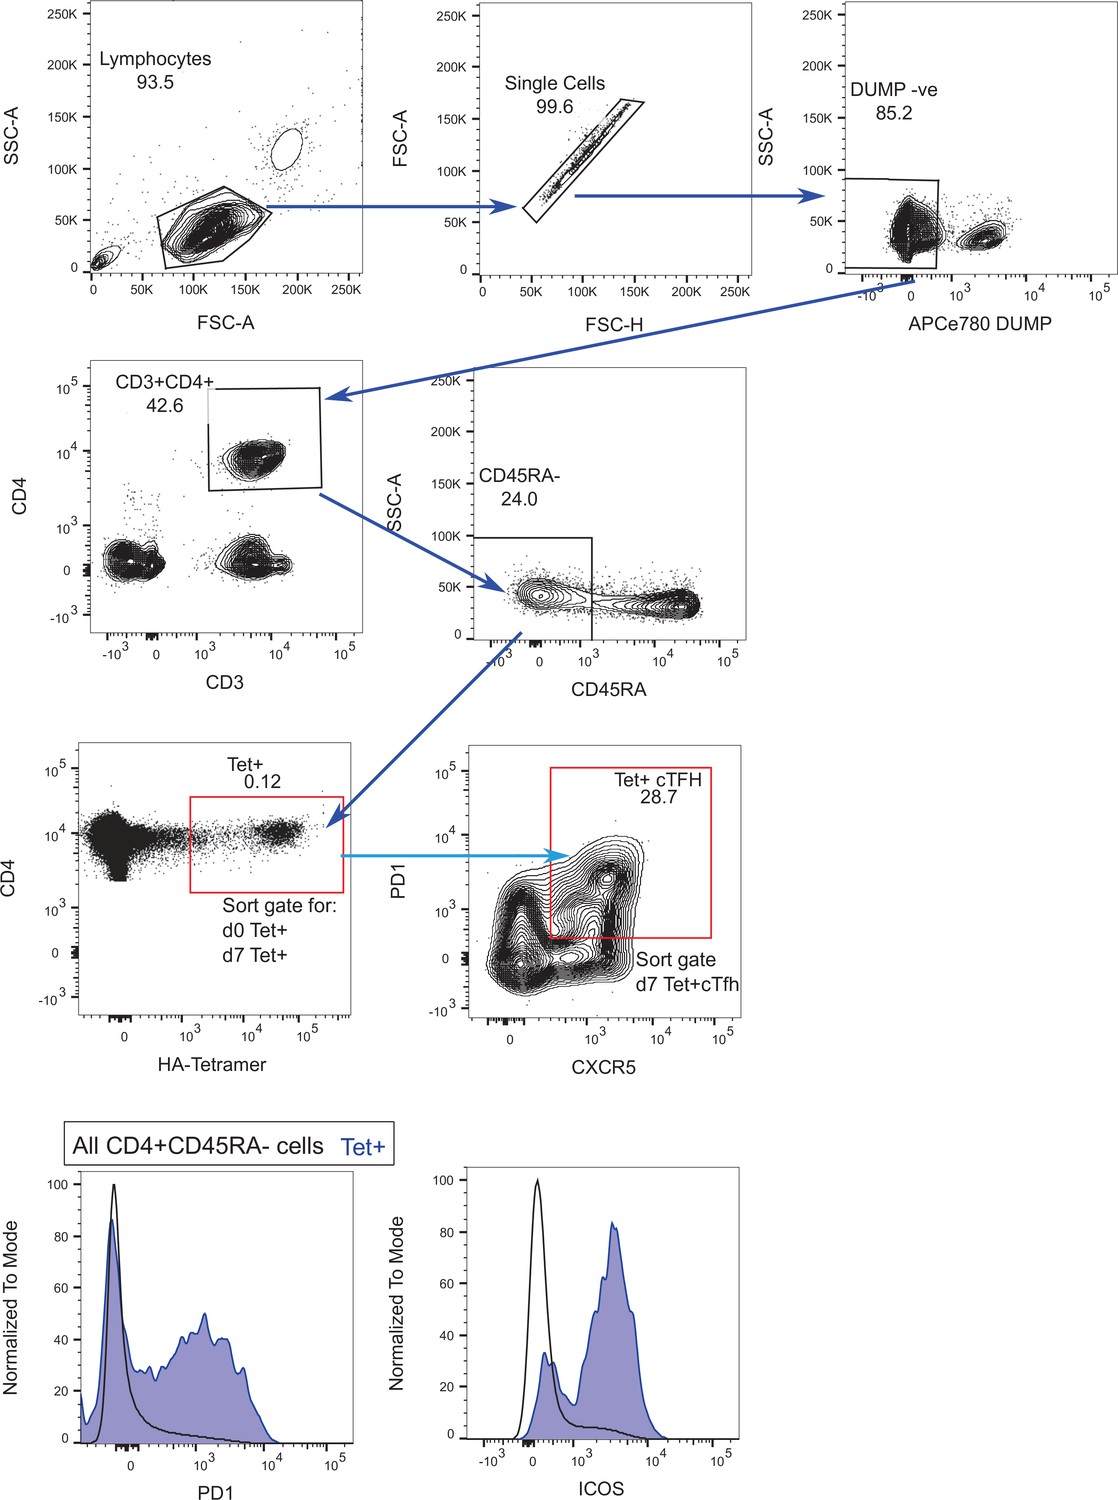
Haemagglutinin (HA)-specific CD4+ T cell sorting strategy.
Representative flow cytometry plots for the cell sorting of HA-specific Tet+ cells, stained with the panel outlined in Supplementary file 4. Red gates indicate the sorted populations on d0 and/or d7. Histograms show representative staining for PD1 and ICOS expression on d7 Tet+ cells (blue) shown relative to the entire CD4+ CD45RA- T cell population (black outline) from the same sample.
Figure 1—figure supplement 4
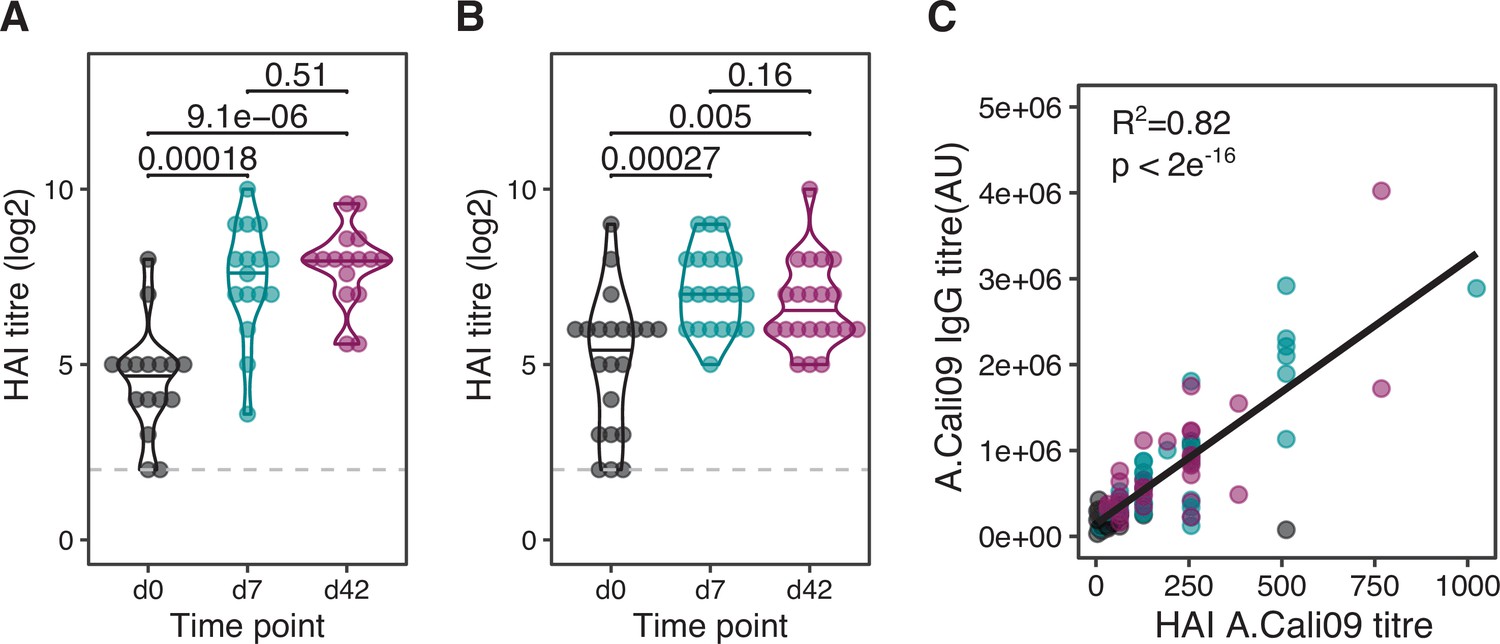
Haemagglutination inhibition (HAI) responses before and after vaccination.
(A) Log2 HAI titres at baseline (d0), d7, and d42 for cohort 1 (n = 16) and (B) cohort 2 (n = 21). (C) Correlation between HAI and A.Cali09 IgG as measured by Luminex assay for cohorts 1 and 2 combined. Paired p-values determined using Wilcoxon signed-rank test and Pearson’s correlation.
Figure 1—figure supplement 5
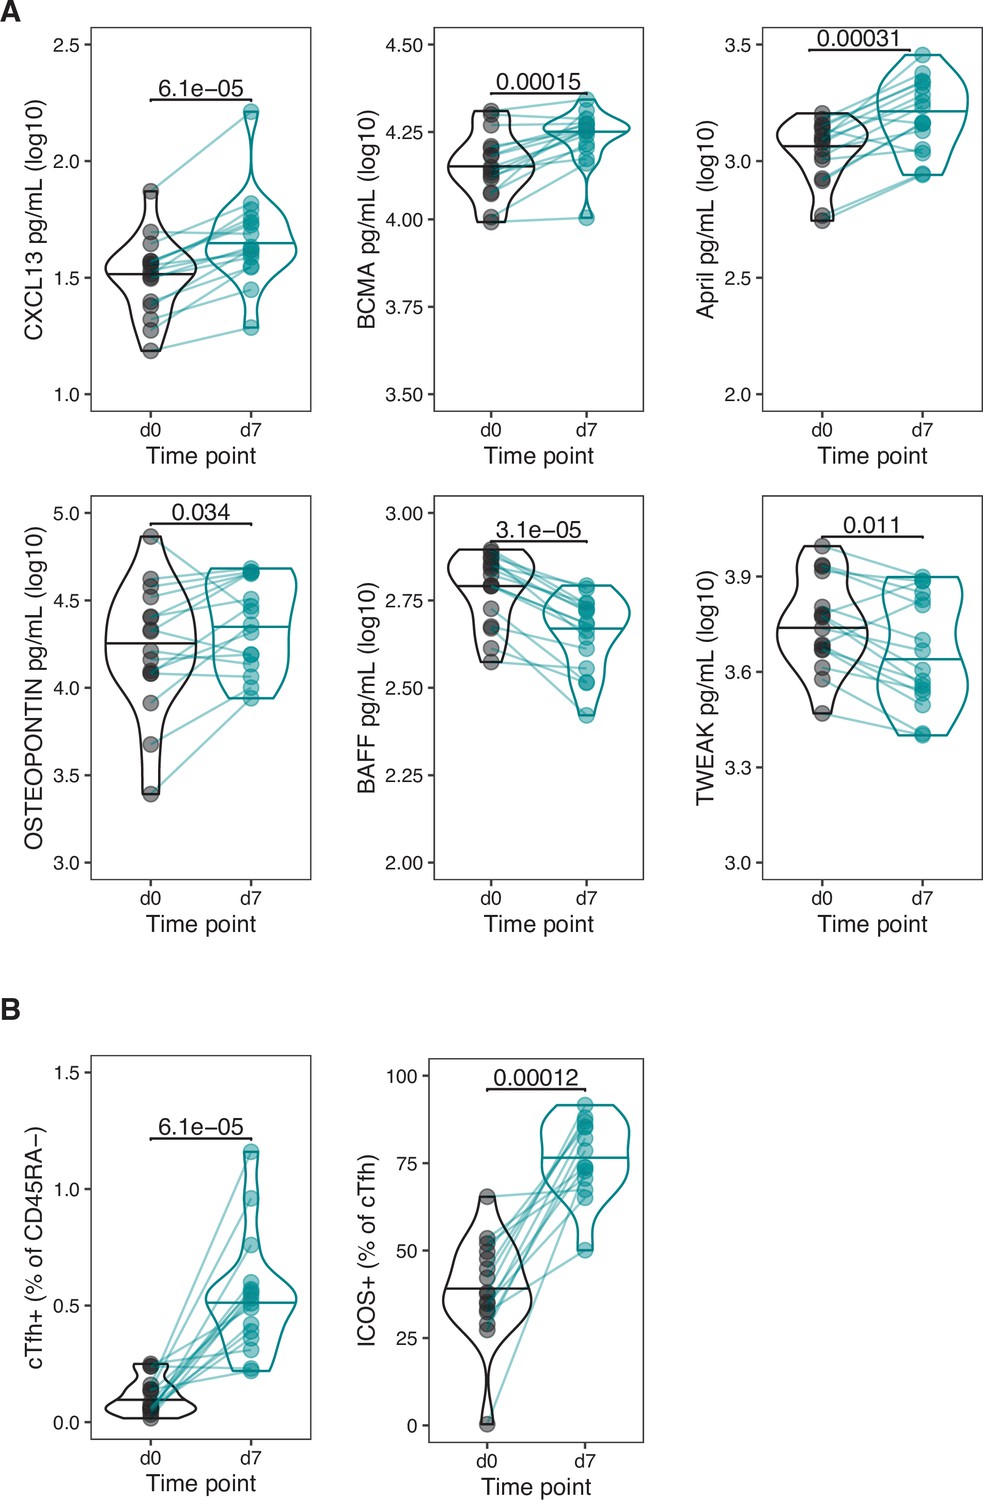
Cytokine and CD4+ T cell variables altered after vaccination in 18–36-year-old individuals.
(A) The concentration of cytokines in serum (log10 pg/mL) at d0 and d7. Variables with significant log2 fold change in Figure 1 shown. (B) The percentage of circulating T follicular helper (cTfh+) cells among CD45RA- T cells, and ICOS+ cells among cTfh cells at d0 and d7. Cohort 1 only (n = 16). Paired p-values determined using Wilcoxon signed-rank test.
Figure 1—figure supplement 6
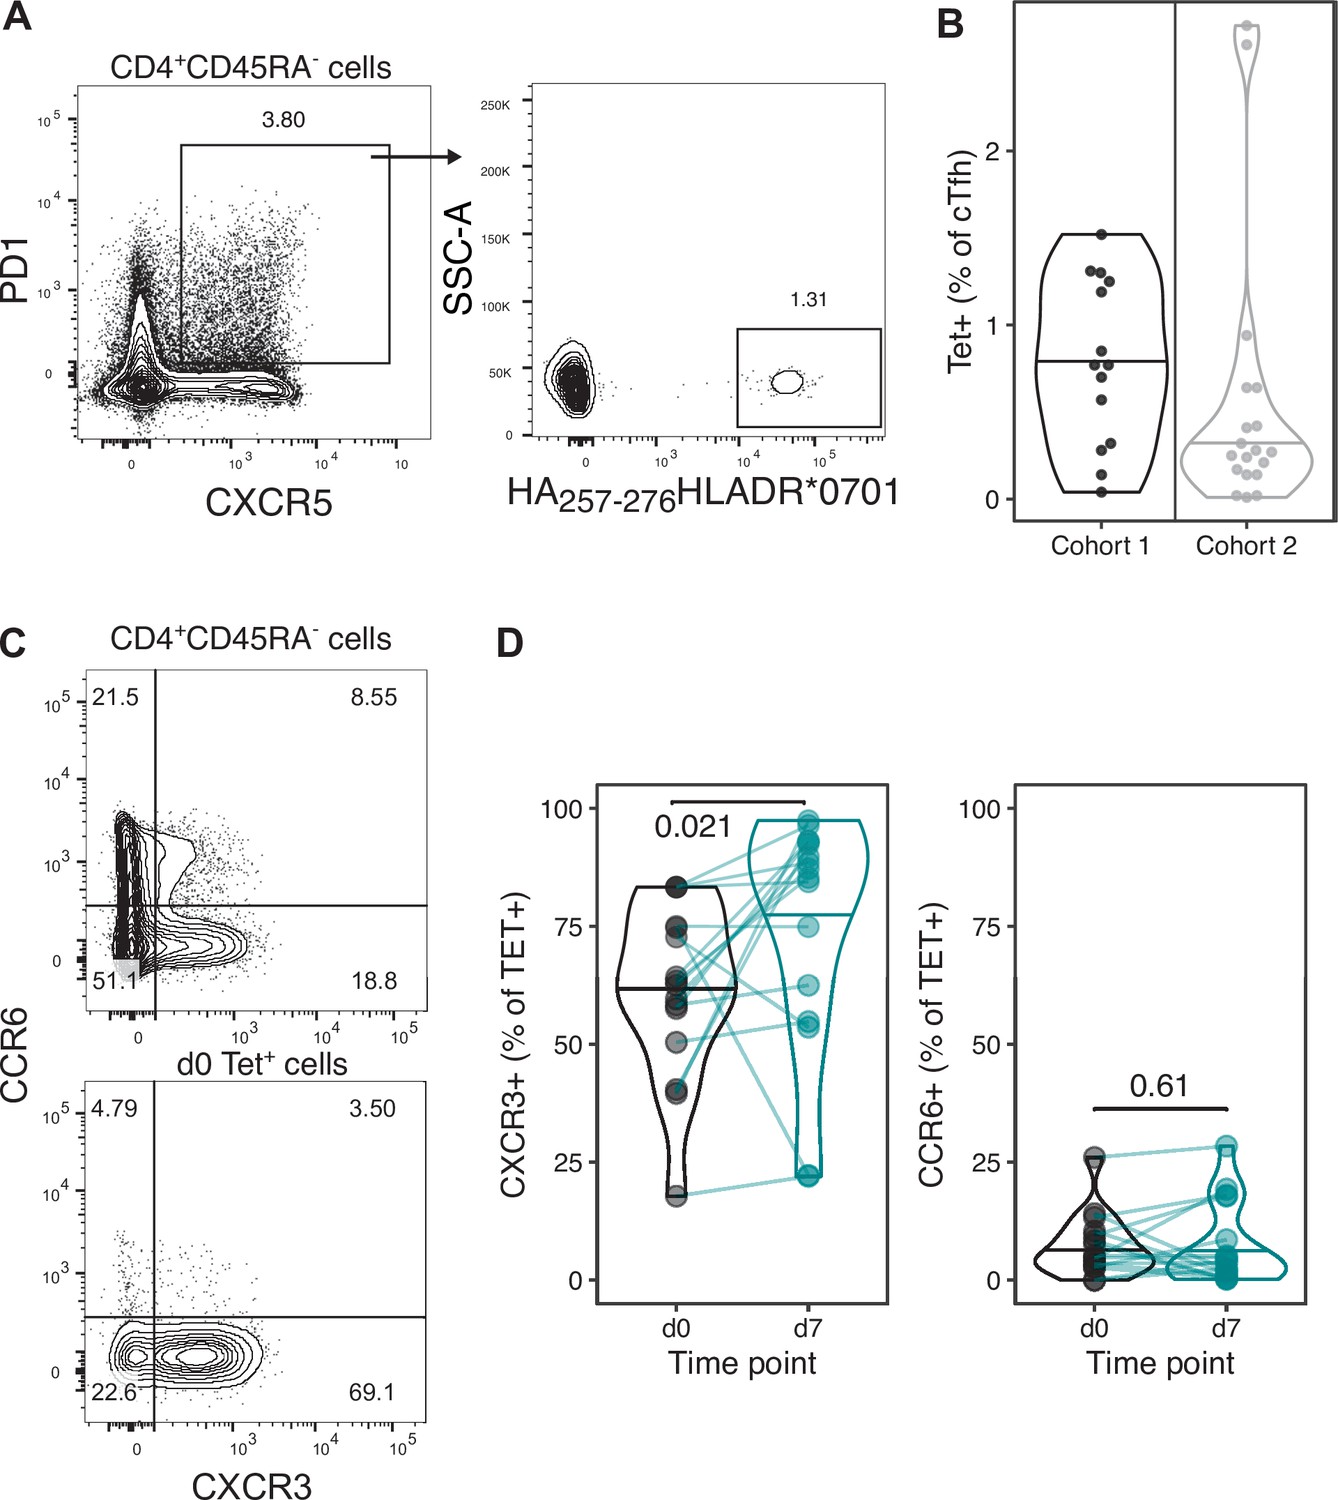
Percentage of circulating T follicular helper (cTfh) cells that are Tet+ and CXCR3 and CCR6 expression on haemagglutinin (HA)-specific CD4+ T cells.
(A) Representative flow cytometry gating strategy for CXCR5+ PD-1+ cTfh cells on CD4+ CD45RA- T cells, and the proportion of HA-specific Tet+ cells within the CXCR5+ PD-1+ cTfh cell gate. (B) The percentage of Tet+ cells within the CXCR5+ PD-1+ cTfh cell population. Within-cohort age group differences were determined using the Mann–Whitney U test. (C) Representative flow cytometry plots for CXCR3 and CCR6 expression on CD4+ CD45RA- T cells and HA-specific Tet+ cells. (D) The quantification of CXCR3 and CCR6 expression on Tet+ cells on day 0 and d7. Paired p-values determined using Wilcoxon signed-rank test.
Figure 2 with 1 supplement
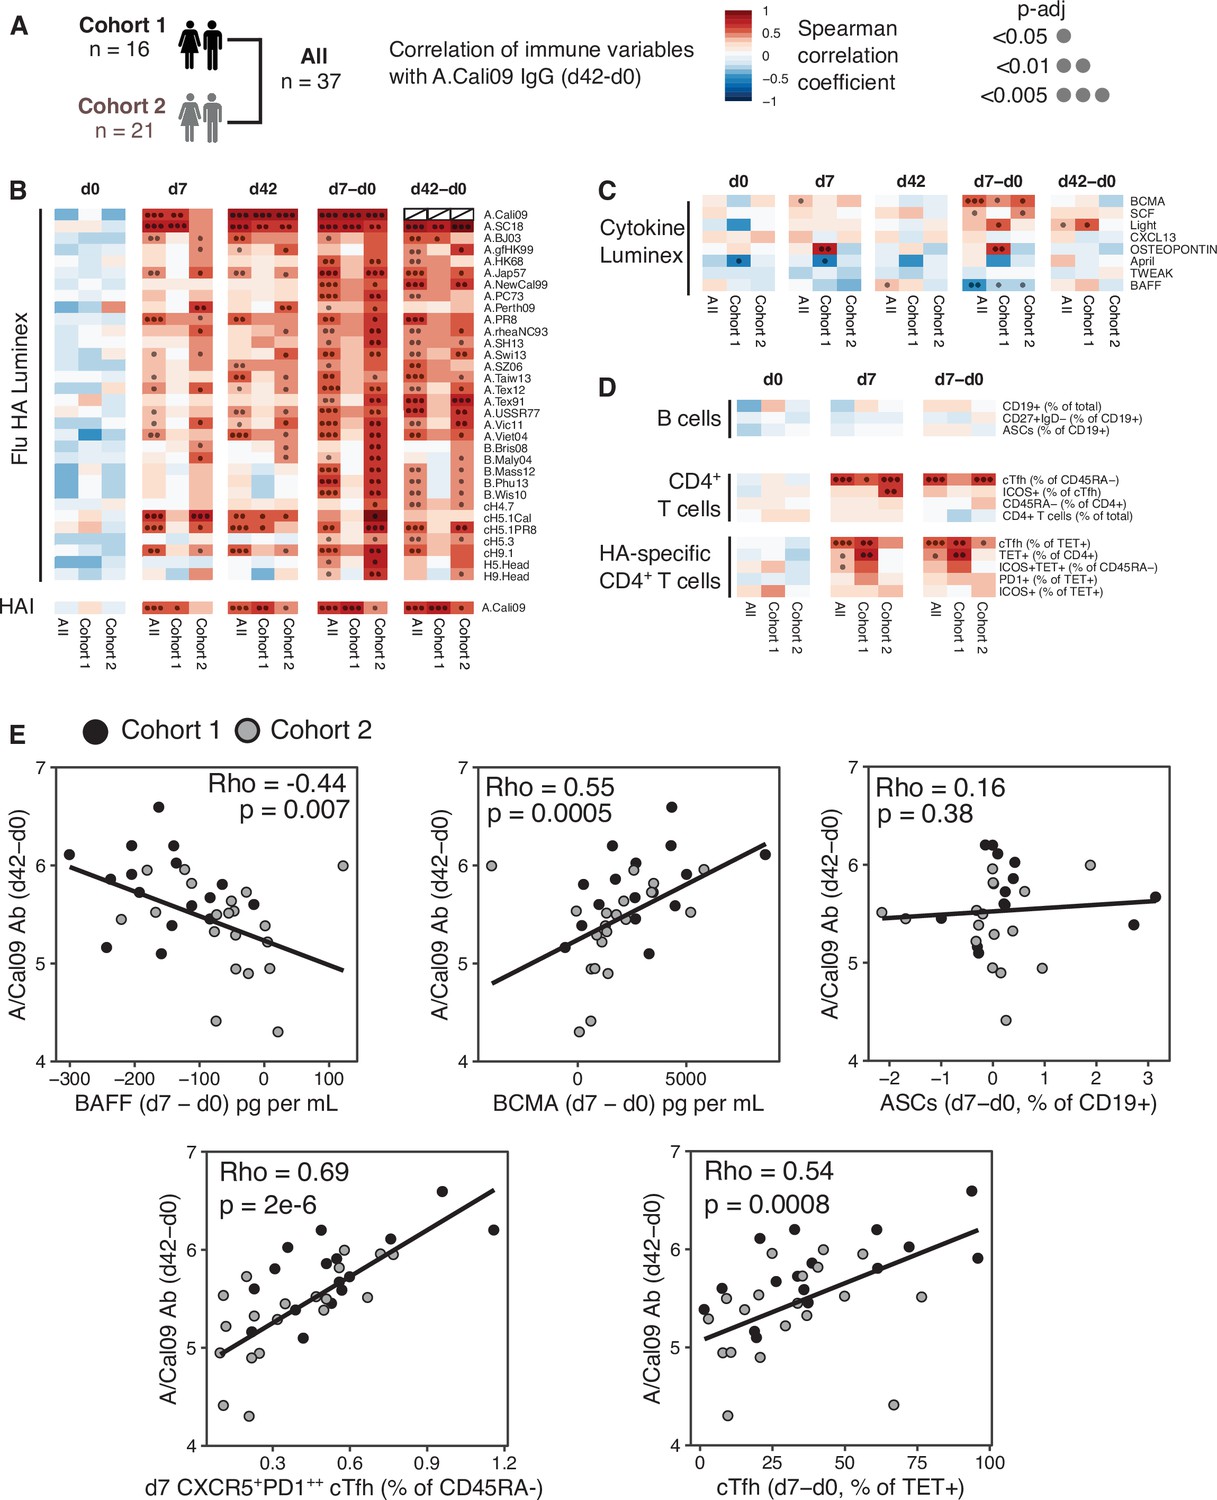
Circulating haemagglutinin (HA)-specific T follicular helper (Tfh) cells correlate with vaccine IgG response.
(A) Overview of correlation analysis between A.Cali09 IgG response at day 42 (minus d0 baseline titre, d42-d0) and immune variables for cohort 1, cohort 2, and both cohorts combined (All). (B) Correlations for Flu HA Luminex IgG and haemagglutination inhibition (HAI) titres at d0, d7, and d42, and at d7 and d42 after subtracting each individual’s d0 baseline value (d7-d0, d42-d0). (C) Correlations for serum cytokines measured by Luminex at d0, d7, and d42, and at d7 and d42 after subtracting each individual’s d0 baseline value (d7-d0, d42-d0). (D) Correlations for B cell, CD4+ T cell, and HA-specific CD4+ T cell variables at d0, d7, and d7 after subtracting each individual’s d0 baseline value (d7-d0). (E) Correlation between vaccine-induced A.Cali09 IgG at d42 with selected immune parameters in both cohort 1 and cohort 2 (n = 37). Dot colour corresponds to the cohort (black = cohort 1, grey = cohort 2). Coefficient (Rho) and p-value determined using Spearman’s correlation, and line represents linear regression fit.
Figure 2—figure supplement 1
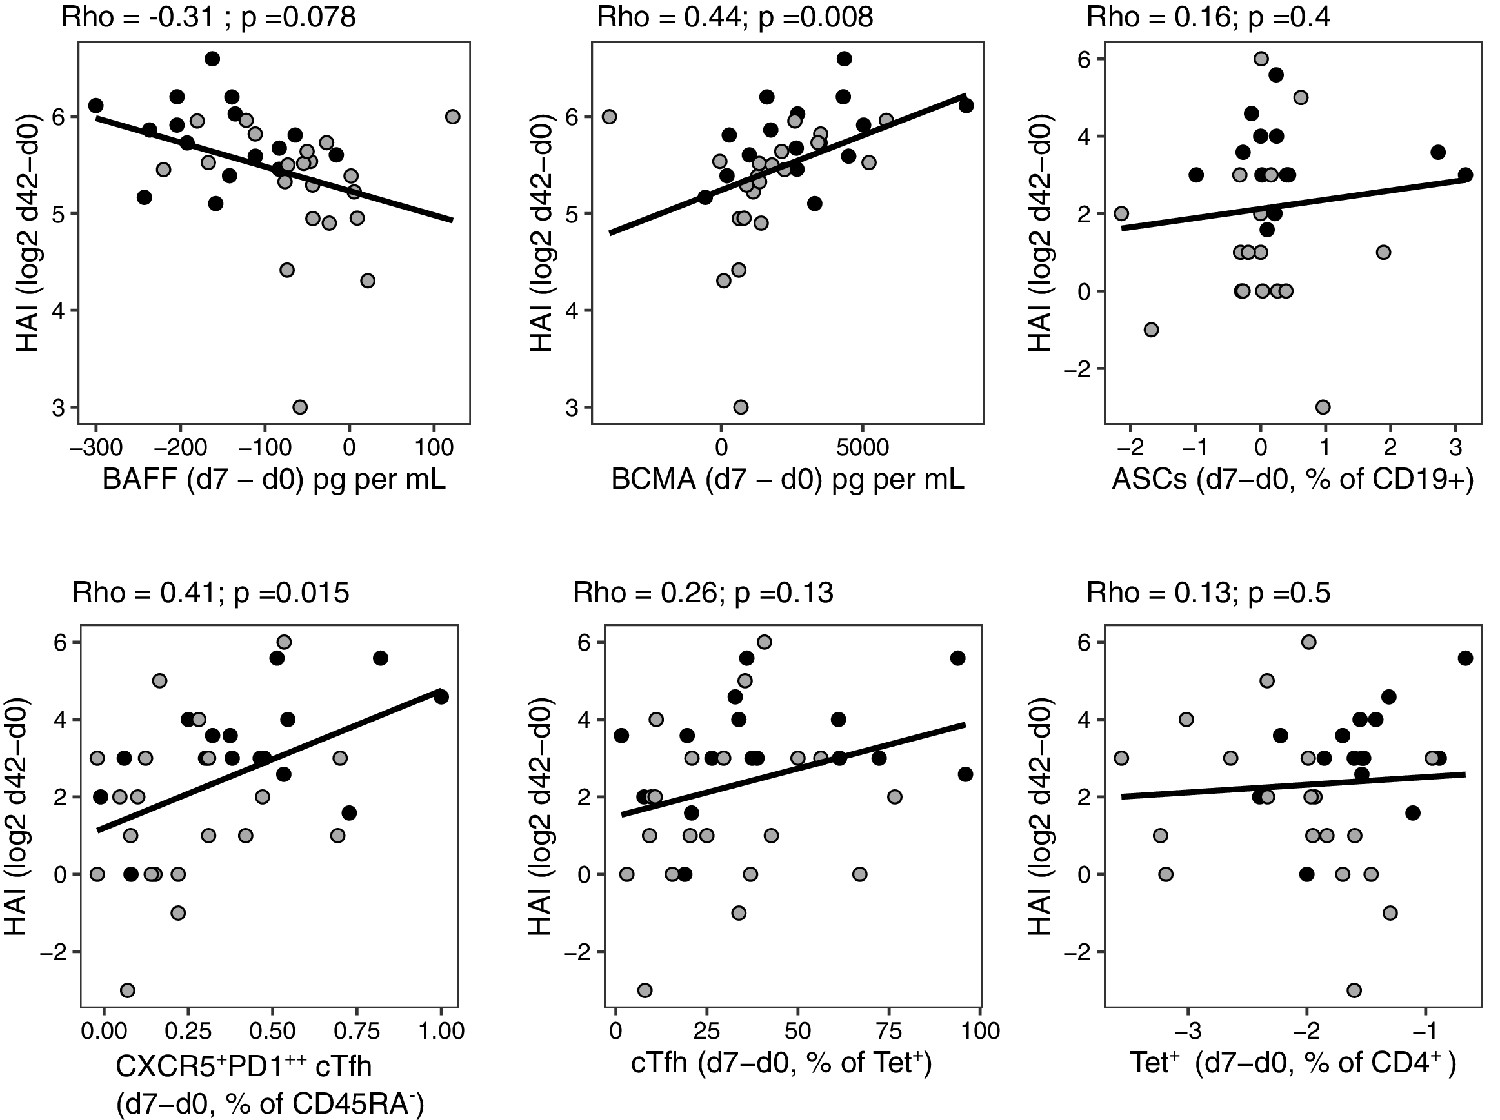
Correlations between haemagglutination inhibition (HAI) assay titres and selected immune parameters.
Correlation between vaccine-induced A.Cali09 HAI titres at d42 with selected immune parameters in both cohort 1 and cohort 2 (n = 37). Dot colour corresponds to the cohort (black = cohort 1, grey = cohort 2). Coefficient (Rho) and p-value determined using Spearman’s correlation, and line represents linear regression fit.
Figure 3 with 1 supplement

Haemagglutinin (HA)-specific circulating T follicular helper (cTfh) response to flu vaccination includes recalled and public T cell receptor (TCR) clonotypes.
(A) Overview of cell types and sample sizes that were sequenced d0 and d7 at each cohort. d0 median = 45 cells (6–258); d7 median = 88 cells (5–1000). (B) Representative pie charts of the proportions of unique TCR β-chain clonotypes for participants 408S and 425L at d0 and d7. Inset numbers indicate the number of cells sequenced and number of unique TCRβ clonal sequences retrieved. (C) Normalised Shannon–Wiener index of TCRβ and TCRα repertoire diversity at d0 TET+ T cells and d7 TET+ cTfh cells for both cohorts combined. (D) The number of dominant TCRβ clones (frequency of >10%) for each individual in d0 and d7 sequenced cells for both cohorts combined. (E) TCRβ clonotype frequencies at d0 and d7 in combined dataset of 15 individuals with paired d0 and d7 samples (1772 clones in total). Each dot represents a clonotype, size corresponds to d7 frequency. Red colour indicates ‘recalled’ clones that were measured at both time points, and solid lines indicate where clones are only detected at a single time point. (F) The number of ‘recalled’ TCRβ clones per individual (present at both d0 and d7) and (G) the aggregate frequency of d7 TET+ cTfh TCRβ clones that were recalled for each individual (n = 15). (H) The log10 d0 frequency of each ‘recalled’ or ‘unique’ (present at d0 only) clone (n = 102 recalled, n = 663 unique clones). (I) The number and (J) combined frequency of public clonotypes per individual at each time point, cohorts 1 and 2 combined (d0 n = 25; d7 n = 20). Public clonotypes were defined as TCRβ sequences with identical v, d, j genes and CDR3 amino acid sequence shared between two or more samples from the same time point. (K) TRBJ and TRBV gene usage among the 26 HA-specific public clonotypes, separated by HLADR genotype and time point. All p-values were calculated using a Mann–Whitney U test.
Figure 3—figure supplement 1
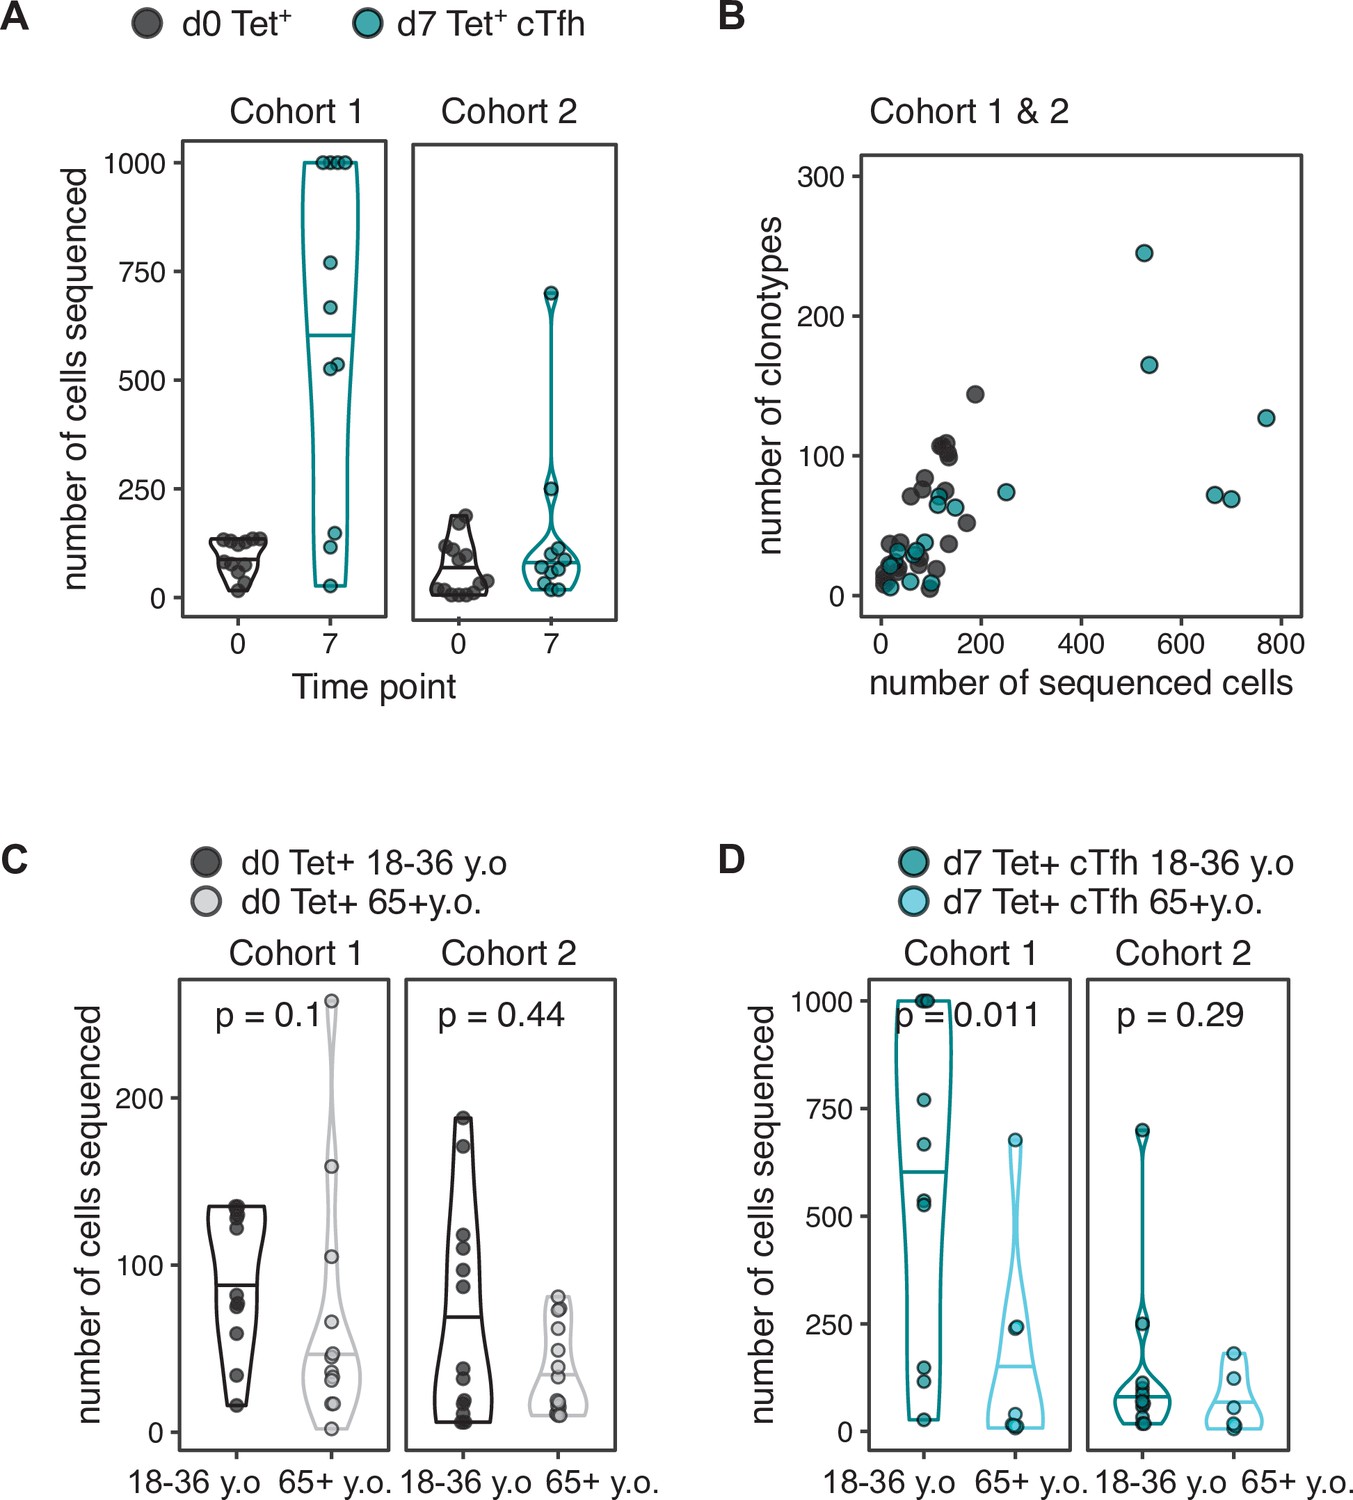
Cell number and clonotype number from T cell sequencing.
(A) The number of cells sorted and sequenced at each time point for each cohort, 18–36-year-old samples only. (B) The number of sequenced cells displayed against the number of TCRB clonotypes recovered from sequencing, for 18–36-year-old samples from both cohorts combined. (C) The number of Tet+ cells sorted and sequenced at d0 for each cohort and for each age group. (D) The number of Tet+ circulating T follicular helper (cTfh) cells sorted and sequenced at d7 for each cohort and for each age group. p-Values calculated by Mann–Whitney U test.
Figure 4
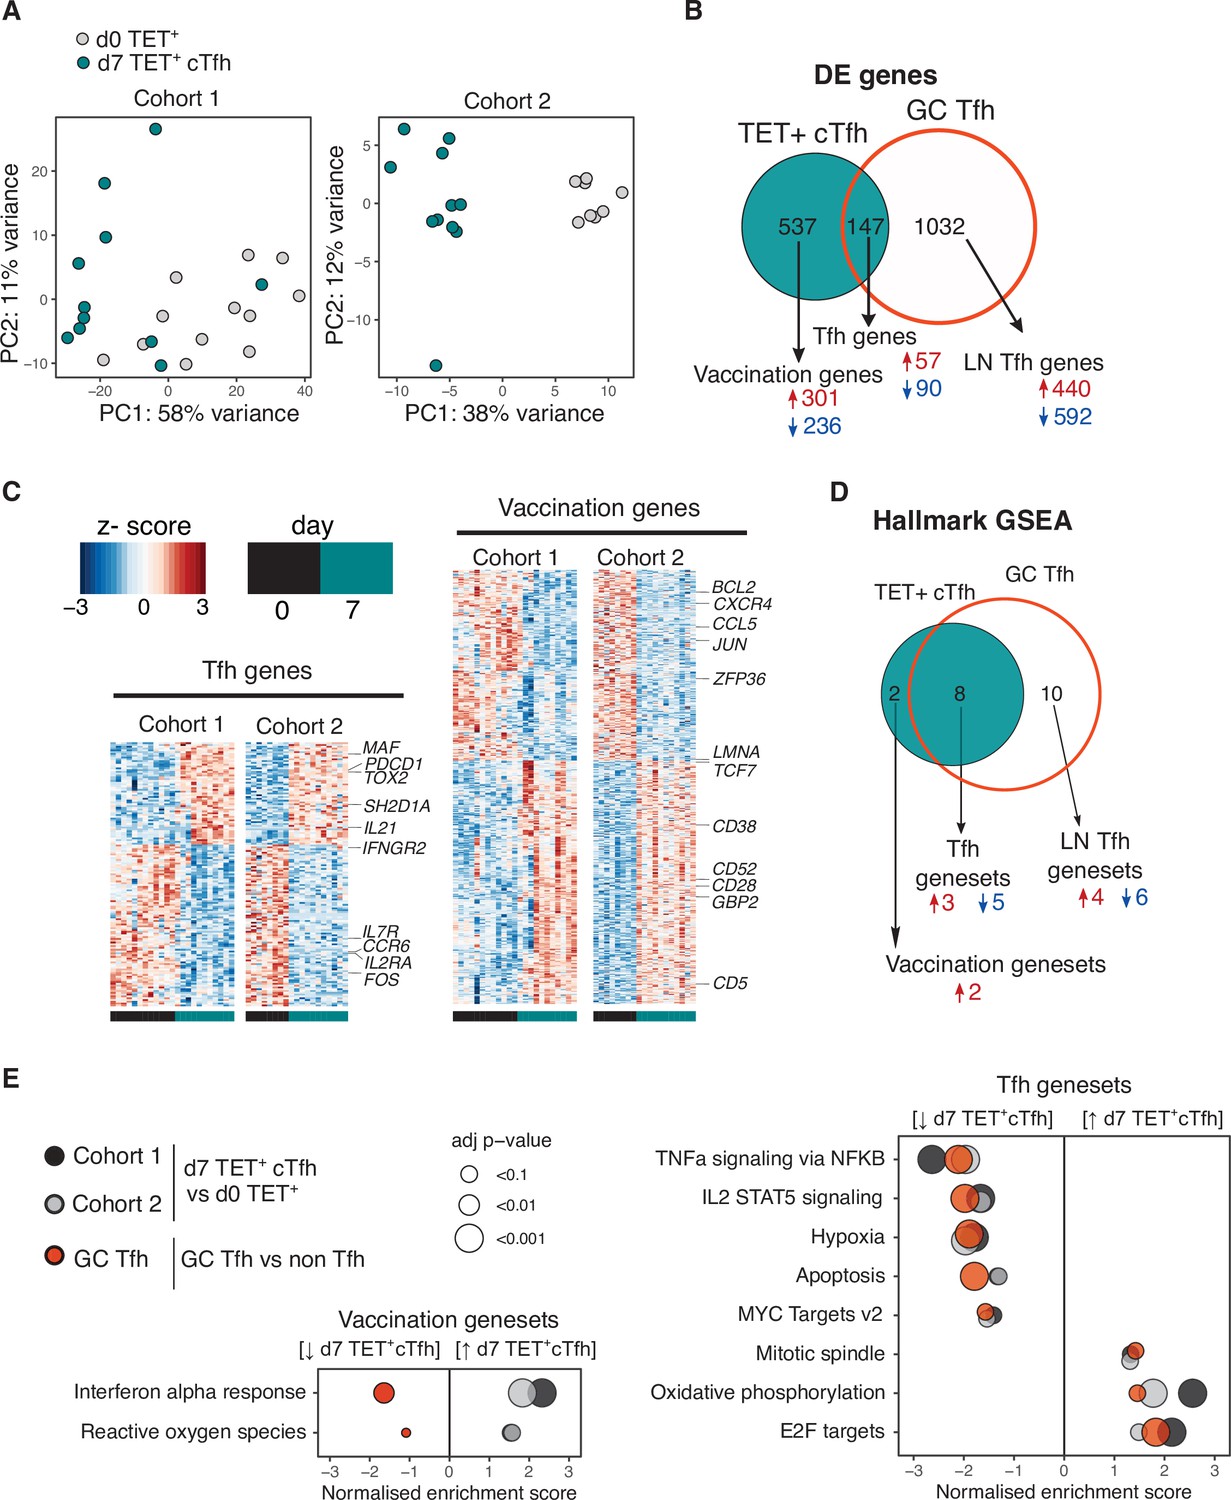
Vaccination-induced circulating T follicular helper (Tfh) cells share a common transcriptional signature with lymph node Tfh cells.
(A) Principal component analysis of 1000 genes with the largest variance in sequenced cells from d0 TET+ cells (shown in grey) and d7 TET+ circulating T follicular helper (cTfh) cells (shown in green) for each cohort separately. (B) Venn diagram of the 684 significantly differentially expressed (DE) genes in d7 TET+cTfh cells (relative to d0) in both cohorts, and the overlap with a signature of human lymph node germinal centre (GC) Tfh cells where genes had the same direction of expression. DE genes were determined using DESeq2 and had adjusted p-value<0.1 and fold change of 2. Up- and downregulated genes represented by red and blue colours, respectively. (C) Heatmaps of gene signatures determined in (B) for each cohort, with representative genes labelled. (D) Venn diagram of the 10 consistently enriched Hallmark pathways in d7 TET+cTfh cells relative to d0 TET+ cells in both cohorts, and the overlap with positively or negatively enriched gene sets in LN GC Tfh cells compared to non-Tfh CD4+ cells. Significant pathways were determined using gene set enrichment analysis (GSEA) and had adjusted p-value<0.1 and normalised enrichment score of >1 or <–1. Up- and downregulated pathways are represented by arrows and red and blue colours, respectively. (E) Bubble plots showing the normalised enrichment scores for significantly enriched pathways for d7 TET+ cTfh cells versus d0 TET+ cells in each cohort, and LN GC Tfh cells versus non-Tfh cells, with positive and negative scores indicating positive and negative enrichment, respectively, in TET+ Tfh and/or GC Tfh compared to their non-Tfh comparator. Circle colour represents the type of comparison, and size represents the adjusted p-value.
Figure 5 with 1 supplement
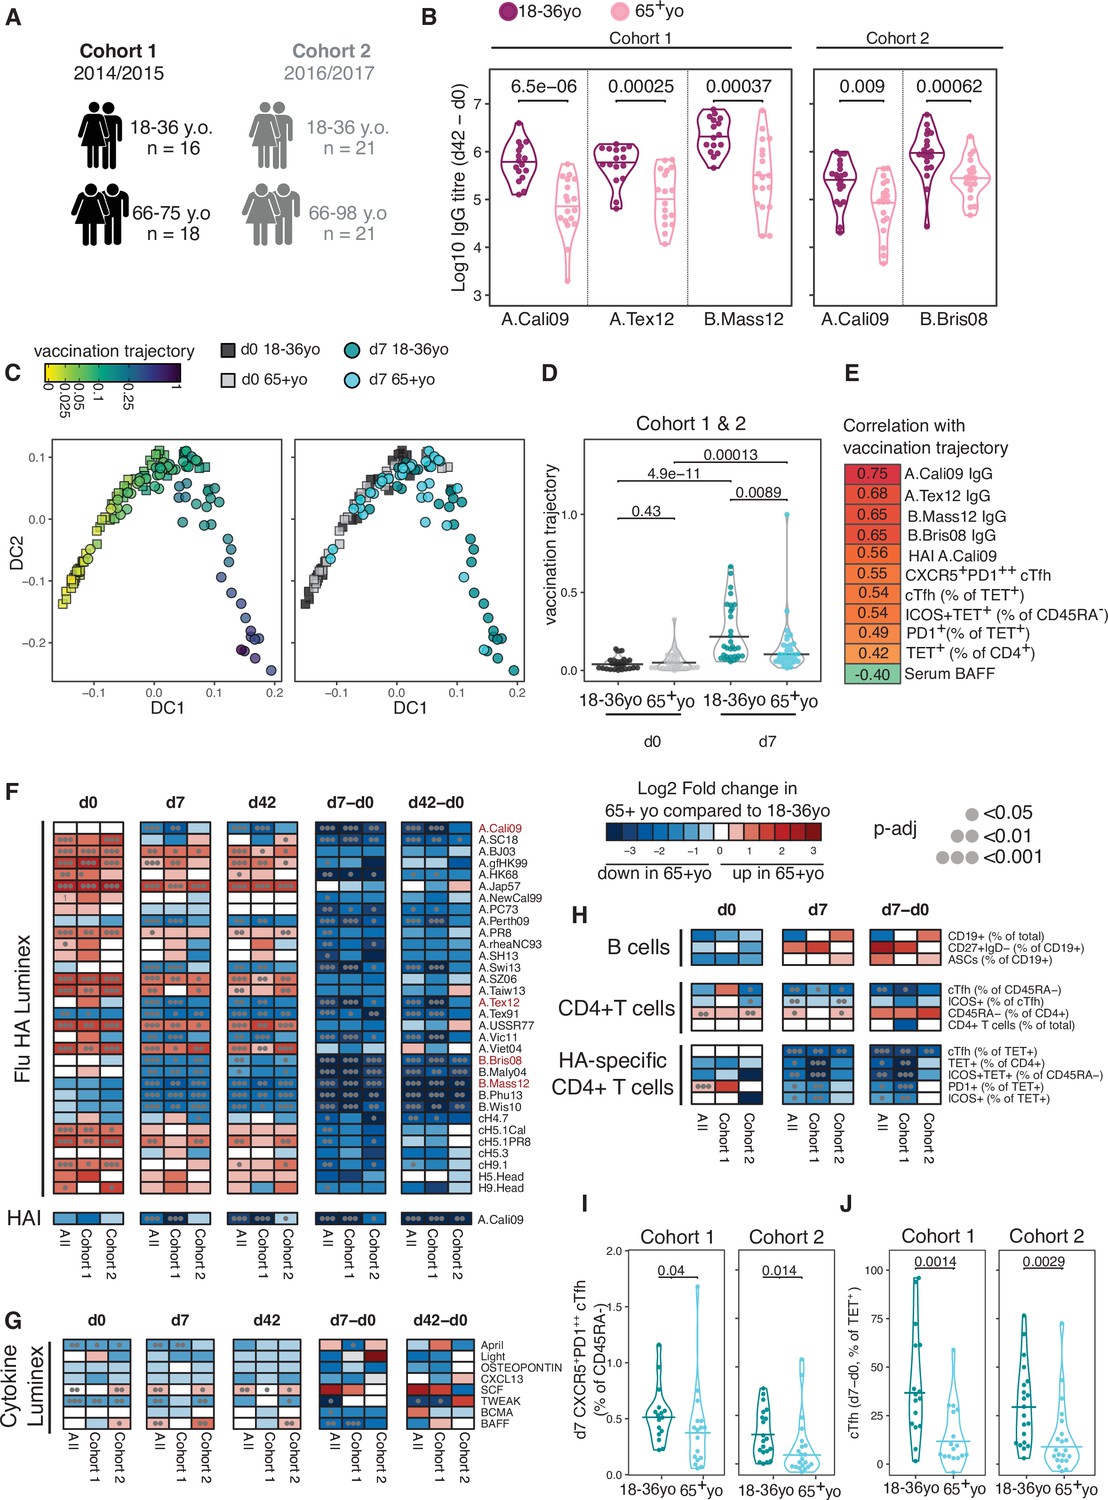
Impaired vaccination immune trajectory in older individuals.
(A) Overview of age groups and sample sizes for each cohort. (B) IgG responses to haemagglutinin (HA) proteins from vaccine influenza strains measured by Luminex for each age group. (C) Diffusion map dimensionality reduction of 122 samples from both cohorts combined using scaled values for 23 immune parameters and the diffusion-pseudotime algorithm (d0 18–36 year olds n = 27; d0 65+ year olds n = 32; d7 18–36 year olds n = 30; d7 65+ year olds n = 33). Each dot represents a sample, shape represents time point (d0 = squares, d7 = circles), and colour either the pseudotime ‘vaccination trajectory’ output value or age group category. Diffusion components (DCs) 1 and 2 shown. (D) Vaccination trajectory values for sample in each age category from both cohorts combined, with p-values calculated using Dunn’s post hoc test. (E) Spearman’s correlation coefficients for the 11 parameters that significantly correlated with the vaccination trajectory variable (padj<0.05). (F–H) Heatmap of FDR-adjusted p-values from Mann–Whitney U test comparing immune parameters between age groups for cohort 1, cohort 2, and both cohorts combined (All), at d0, d7, and d42, and at d7 and d42 after subtracting each individual’s d0 baseline value (d7-d0, d42-d0) for (F) Flu HA Luminex and haemagglutination inhibition (HAI), (G) Cytokine Luminex, (H) B cells, CD4+ T cells, and HA-specific CD4+ T cells. Colour corresponds to p-value and the direction of change. (I) The percentage of CXCR5+PD1++ circulating T follicular helper (cTfh) cells and (J) TET+ cTfh cells for each age group and each cohort, with p-values calculated by Mann–Whitney U test (cohort 1 18–36 years old n = 17, 65+ years old n = 17; cohort 2 18–36 years old n = 20, 65+ years o n = 21).
Figure 5—figure supplement 1
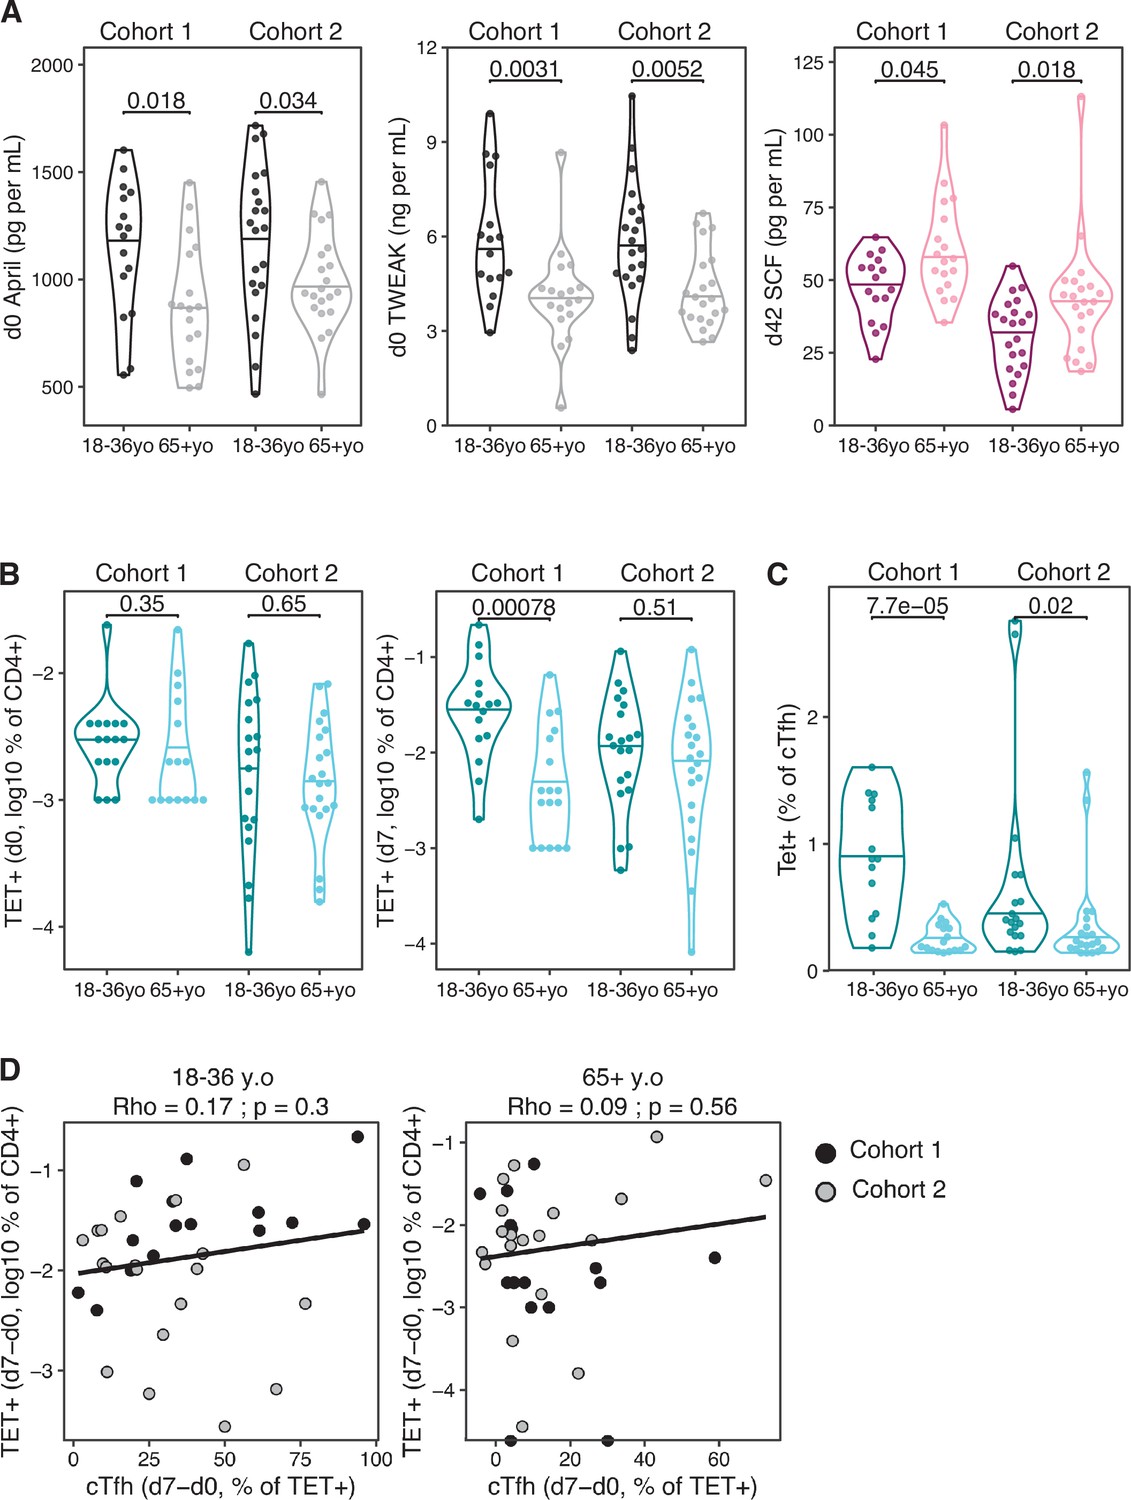
Age-related differences in cytokines and haemagglutinin (HA)-specific CD4+ T cell parameters.
(A) The serum concentration (log10 pg/mL) of d0 April, d0 TWEAK, and d42 SCF across age groups and cohorts. Variables with consistently significant (padj<0.05) across both cohorts as in Figure 5G shown. (B) The percentage of Tet+ cells among CD4+ T cells at d0 and d7 across age groups and cohorts as in Figure 5H. (C) The percentage of Tet+ cells within the CXCR5+ PD-1+ circulating T follicular helper (cTfh) cell population. Within-cohort age group differences were determined using the Mann–Whitney U test. (D) Correlation between Tet+ cells (d7-d0, % of CD4+) and cTfh (d7-d0, % of TET+) in both cohorts for each age group (18–36 years old n = 37, 65+ years old. n = 39). Dot colour corresponds to the cohort (black = cohort 1, grey = cohort 2). Coefficient (Rho) and p-value determined using Spearman’s correlation, and line represents linear regression fit.
Figure 6
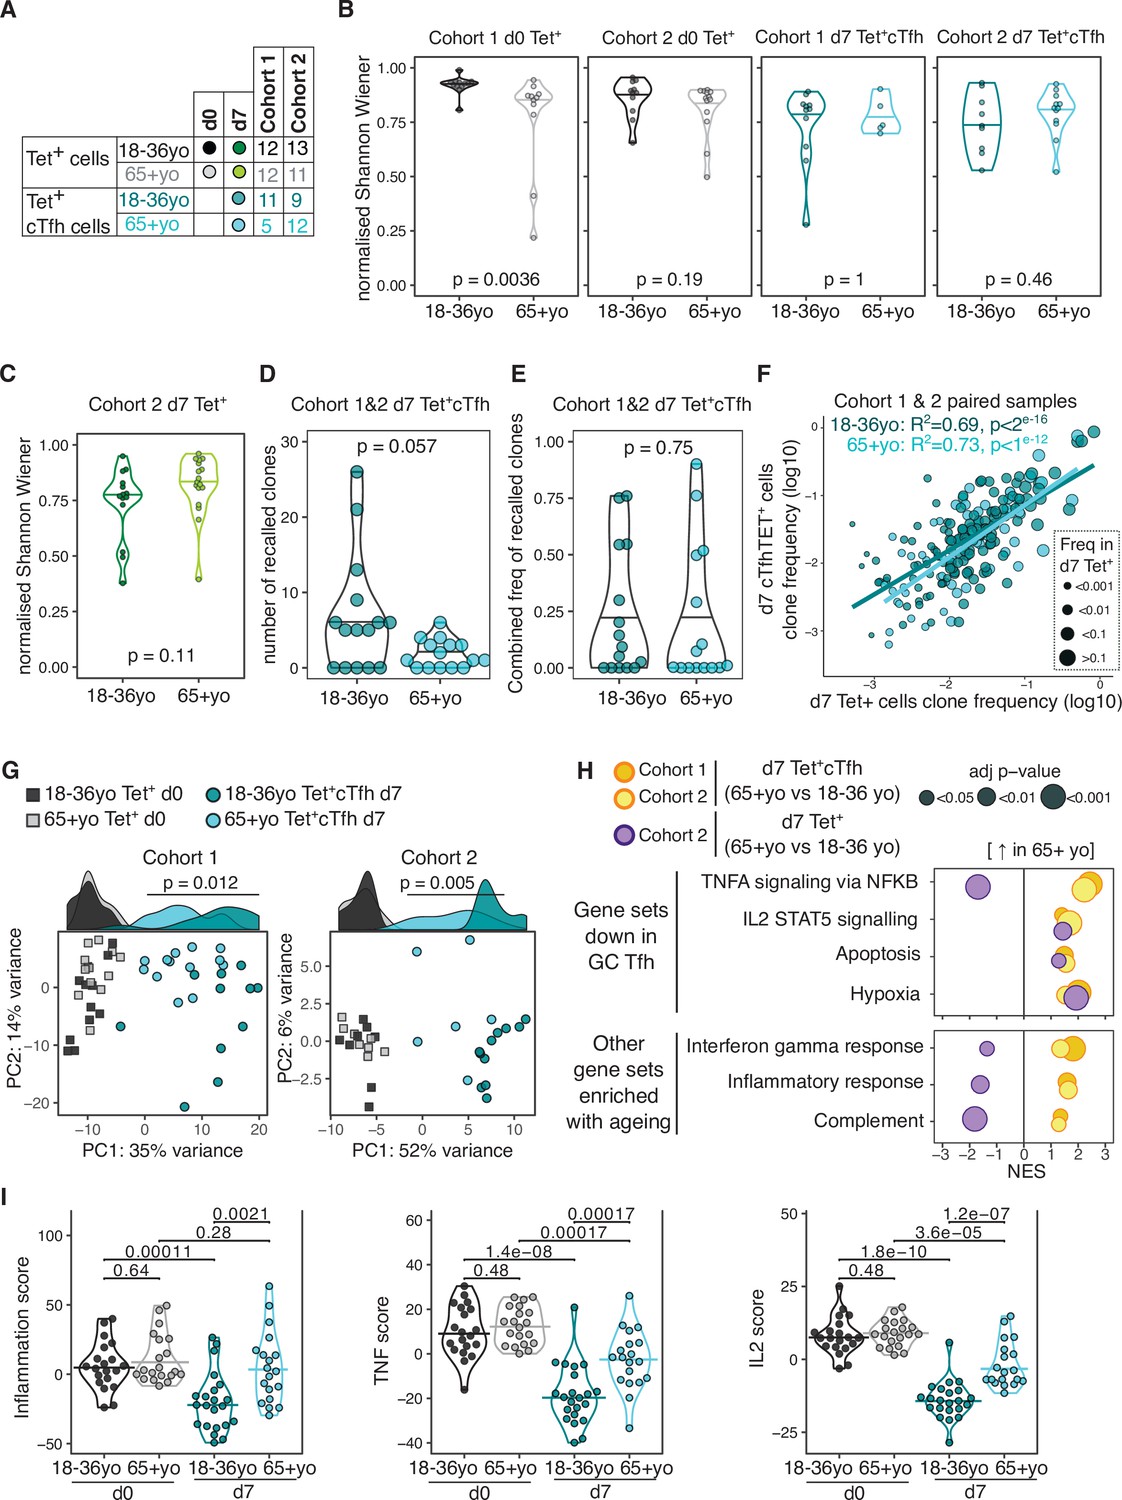
Impaired induction of T follicular helper (Tfh) transcriptional programs and aberrant inflammatory signatures in haemagglutinin (HA)-specific circulating T follicular helper (cTfh) cells from older individuals.
(A) Overview of sample numbers and cell types sequenced at d0 and d7 for each cohort and each age group. Dark and light green dots indicate d7 Tet+ cells sequenced from cohort 2 only. (B) Normalised Shannon–Wiener diversity index of T cell receptor β (TCRβ) clonotypes for each cohort, time point, and cell type. Each dot represents a sequenced sample. (C) Normalised Shannon–Wiener diversity index of TCRβ clonotypes in d7 Tet+ cells from cohort 2. (D) The number of TCRβ clones per individual in d7 Tet+ cTfh cells recalled from d0 Tet+ cells, and (E) combined frequency of the recalled clones among d7 Tet+cTfh cells for each age group (n = 15 in each age group, both cohorts combined). p-Values calculated using Mann–Whitney U test. (F) Frequency of TCRβ clones present in paired samples of d7 Tet+ and d7 Tet+cTfh cells. Each dot represents a clonotype, dot colour indicates age group, and dot size corresponds to the frequency in d7 Tet+ cells. Lines represent linear regression, and statistics determined using Pearson’s correlation. (G) Principal component (PC) analysis of the 684 genes differentially expressed (DE) between d0 and d7 in samples from 18 to 36 year olds applied to d0 and d7 samples from both age groups and cohorts. Histograms show the distribution of PC1 values for each group, with p-value calculated between age groups for d7 samples by Mann–Whitney U test. (H) Bubble plots of seven Hallmark pathways that are upregulated in d7 Tet+cTfh cells or d7 Tet + cells in samples from 65+-year-old compared to 18–36-year-old individuals, subdivided by which pathways were previously identified as negatively enriched in lymph node germinal centre Tfh cells. Positive scores indicate positive enrichment in Tet+cTfh cells from older donors. Circle colour represents the cohort, size represents the adjusted p-value. (I) Inflammation, TNF, and IL2 gene signature scores in HA-specific T cells at different time points and age groups, cohorts 1 and 2 combined (d0 18–36 year olds n = 20, d0 65+ year olds n = 20; d7 18–36 year olds n = 22; 65+ year olds n = 19). p-Value calculated using Dunn’s post hoc test.
Figure 7
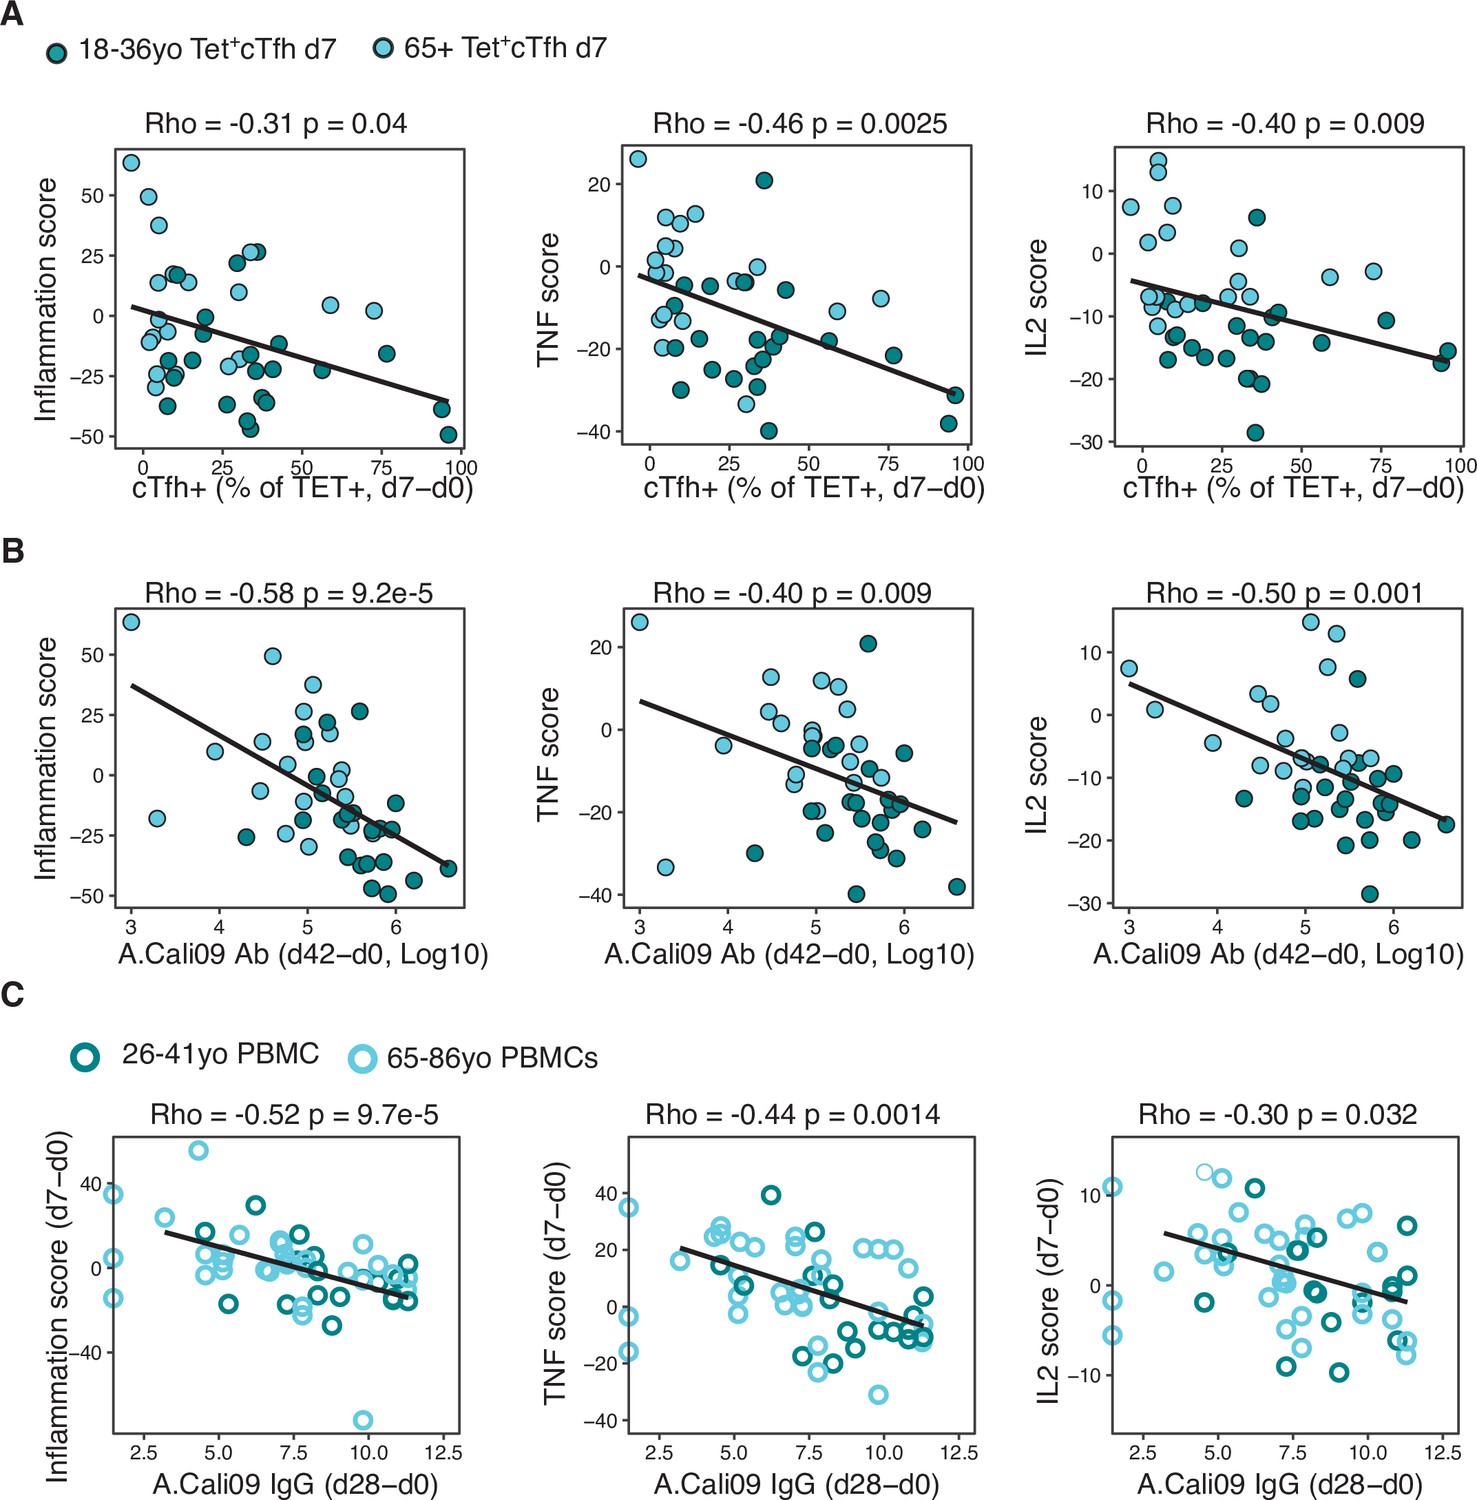
Gene signatures of TNF, IL-2, and inflammation associate with impaired antibody and T follicular helper (Tfh) cell responses to influenza vaccination.
(A) Correlation between circulating T follicular helper (cTfh) Tet+ cells and inflammation, TNF or IL2 gene signatures scores in d7 Tet+cTfh cells. (B) Correlation between A.Cali09 IgG titre (d42-d0) and inflammation, TNF or IL2 gene signatures scores in d7 Tet+cTfh cells. (C) Correlation between A.Cali09 IgG titre (d28-d0) and Inflammation, TNF or IL2 gene signatures scores determined from microarray data of peripheral blood mononuclear cells on d0 or d7 after seasonal influenza vaccination from publicly available datasets (n = 50 total; 26–41 years old n = 18, 66–86 years old = 32) (Nakaya et al., 2015). Correlation coefficients and p-values calculated using Spearman’s correlation coefficient. Solid line represents linear regression fit. Colour corresponds to age group (green = younger people; aqua = older people).
Figure 8
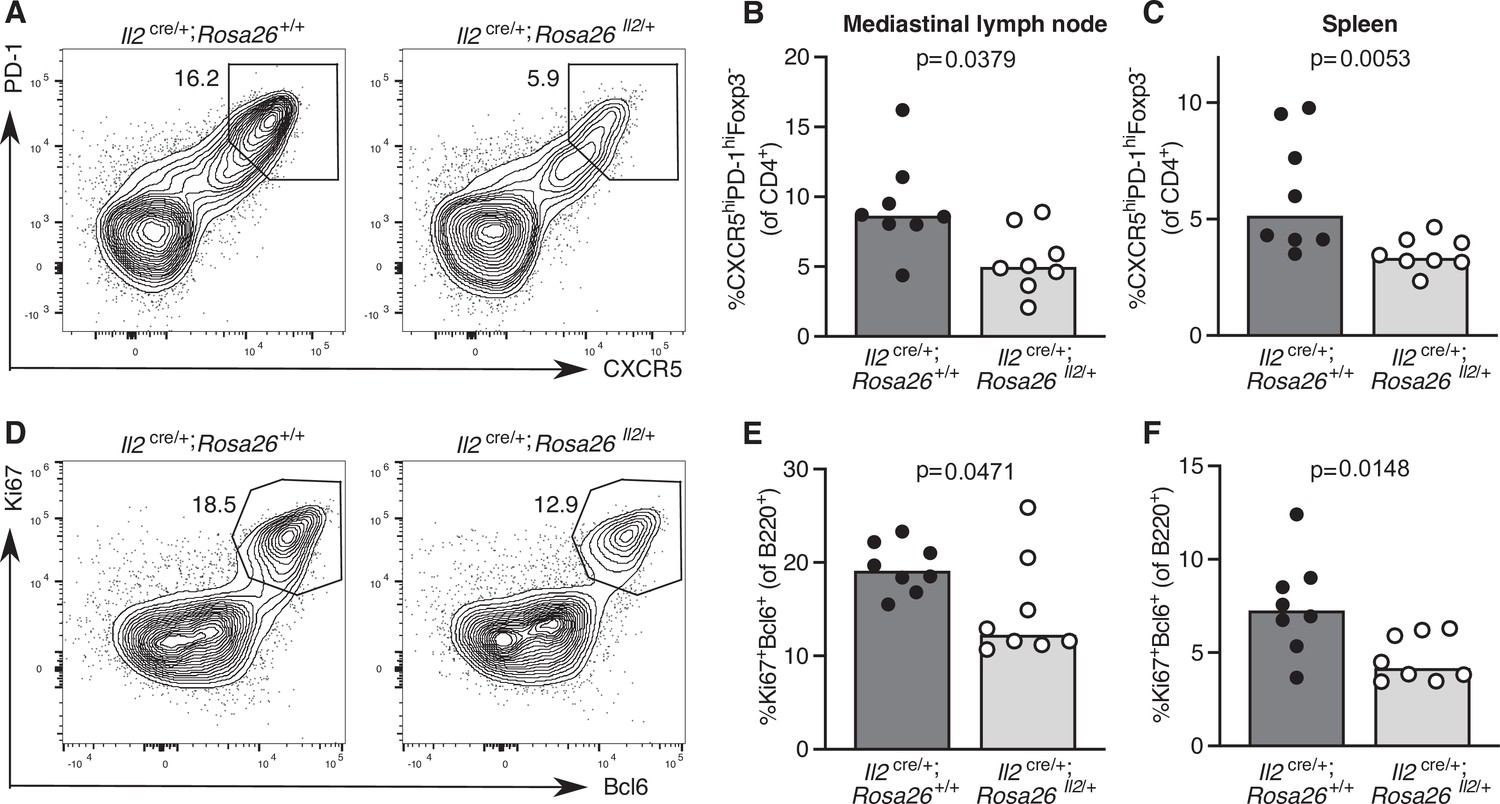
Increased IL-2 production impairs T follicular helper (Tfh) cell formation and the germinal centre response.
Assessment of the Tfh cell and germinal centre response in Il2cre/+; Rosa26stop-flox-Il2/+ transgenic mice that do not switch off IL-2 production, and Il2cre/+; Rosa26+/+ control mice 12 days after influenza A infection. Flow cytometric contour plots (A) and quantification of the percentage of CXCR5highPD-1highFoxp3-CD4+ Tfh cells in the mediastinal lymph node (B) and spleen (C). Flow cytometric contour plots (D) and quantification of the percentage of Bcl6+Ki67+B220+ germinal centre B cells in the mediastinal lymph node (E) and spleen (F). The height of the bars indicates the median, each symbol represents one mouse, data are pooled from two independent experiments. p-Values calculated between genotype groups by Mann–Whitney U test.
Tables
Key resources table
| Reagent type (species) or resource | Designation | Source or reference | Identifiers | Additional information |
|---|---|---|---|---|
| Other | Viability dye and labelling reagent | Thermo Fisher | Cat#: 65-0865-18 | Flow cytometry (1:10,000) |
| Antibody | Anti-human CD14 APC-eF780 clone: 61D3 (mouse monoclonal) | Thermo Fisher | Cat#: 47-0149-42 | Flow cytometry (0.5 μL/million cells) |
| Antibody | Anti-human CD16 APC-eF780 clone: eBioCB16 (mouse monoclonal) | Thermo Fisher | Cat#: 47-0168-42 | Flow cytometry (0.3 uL/million cells) |
| Antibody | Anti-human CD3 BV605 clone: UCHT1 (mouse monoclonal) | BioLegend | Cat#: 300460 | Flow cytometry(0.5 μL/million cells) |
| Antibody | Anti-human CD19 BB515 clone: HIB19 (mouse monoclonal) | BD Biosciences | Cat#: 564456 | Flow cytometry(1 μL/million cells) |
| Antibody | Anti-IgD BV421 clone: IA6-2 (mouse monoclonal) | BD Biosciences | Cat#: 563813 | Flow cytometry(1 μL/million cells) |
| Antibody | Anti-human CD38 APC clone: HIT2 (mouse monoclonal) | Thermo Fisher | Cat#: 17-0389-42 | Flow cytometry (0.5 μL/million cells) |
| Antibody | Anti-human CD20 PECY7 clone: 2H7 (mouse monoclonal) | BioLegend | Cat#: 302312 | Flow cytometry (0.5 μL/million cells) |
| Antibody | Anti-human CD27 BV650 clone: M-T271 (mouse monoclonal) | BD Biosciences | Cat#: 564894 | Flow cytometry(0.5 μL/million cells) |
| Antibody | Anti-human CD24 PerCP-eFluor 710 clone: eBioSN3 (mouse monoclonal) | Thermo Fisher | Cat#: 46-0247-42 | Flow cytometry(0.5 μL/million cells) |
| Antibody | Anti-human CD19 APC-eF780 clone: HIB19 (mouse monoclonal) | Thermo Fisher | Cat#: 47-0199-42 | Flow cytometry (0.3 μL/million cells) |
| Antibody | Anti-human CD3 BUV 395 clone: UCHT1 (mouse monoclonal) | Thermo Fisher | Cat#: 563546 | Flow cytometry(0.5 μL/million cells) |
| Antibody | Anti-human CD45RA BUV737 clone: HI100 (mouse monoclonal) | BD Biosciences | Cat#: 564442 | Flow cytometry(0.5 μL/million cells) |
| Antibody | Anti-human CD4 PercpCy5.5 clone: RPA-T4 (mouse monoclonal) | BD Biosciences | Cat#: 560650 | Flow cytometry(0.3 μL/million cells) |
| Antibody | Anti-human CXCR5 BB515 clone: RF8B2 (rat monoclonal) | BD Biosciences | Cat#: 564624 | Flow cytometry (0.9 μL/million cells) |
| Antibody | Anti-human PD1 APC clone: eBioJ105 (mouse monoclonal) | BD Biosciences | Cat#: 17-2799-42 | Flow cytometry (1 μL/million cells) |
| Antibody | Anti-human ICOS biotin clone: ISA-3 (mouse monoclonal) | Thermo Fisher | Cat#: 13-9948-82 | Flow cytometry(1 μL/million cells) |
| Antibody | Anti-human CXCR3 BV421 clone: 1C6/CXCR3 (mouse monoclonal) | Thermo Fisher | Cat#: 562558 | Flow cytometry(0.5 μL/million cells) |
| Antibody | Anti-human CCR6 BV786 clone: 11A9 (mouse monoclonal) | BD Biosciences | Cat#: 563704 | Flow cytometry(0.5 μL/million cells) |
| Other | Streptavidin BV650 | BD Biosciences | Cat#: 563855 | Flow cytometry (0.2 μL/million cells) |
| Antibody | Anti-mouse CXCR5 clone: L138D7 (rat monoclonal) | BioLegend | Cat#:145511; RRID:AB_2562127 | Flow cytometry (1:50) |
| Antibody | Anti-mouse PD-1 clone: 29F.1A12 (rat monoclonal) | BioLegend | Cat#: 135231; RRID:AB_2566158 | Flow cytometry (1:5000) |
| Antibody | Anti-mouse Foxp3 clone: FJK-16s (rat monoclonal) | eBioscience | Cat#: 48-5773-82; RRID:AB_1518812 | Flow cytometry (1:400) |
| Antibody | Anti-mouse B220 clone: RA3-6B2 (Rat monoclonal) | eBioscience | Cat#: 15-0452-82; RRID:AB_468755 | Flow cytometry (1:500) |
| Antibody | Anti-mouse Ki67 clone: 16A8 (rat monoclonal) | BioLegend | Cat#: 652420; RRID:AB_2564285 | Flow cytometry (1:1000) |
| Antibody | Anti-mouse/human Bcl6 mouse clone: K112-91 (mouse monoclonal) | BD Biosciences | Cat#: 561525; RRID:AB_10898007B | Flow cytometry (1:200) |
| Antibody | Anti-mouse CD4 clone: GK1.5 (rat monoclonal) | BD Biosciences | Cat#: 563790; RRID:AB_2738426 | Flow cytometry (1:400) |
Additional files
-
Supplementary file 1
Immunological variables.
Table of the immunological parameters used in this study
- https://cdn.elifesciences.org/articles/70554/elife-70554-supp1-v1.xlsx
-
Supplementary file 2
Inflammation, TNF, and IL-2 gene signatures.
Table of the gene names used for the inflammation, TNF, and IL-2 gene signatures.
- https://cdn.elifesciences.org/articles/70554/elife-70554-supp2-v1.xlsx
-
Supplementary file 3
Antibody panel for B cells.
Table of the flow cytometry staining panel used for identifying B cell subsets.
- https://cdn.elifesciences.org/articles/70554/elife-70554-supp3-v1.xlsx
-
Supplementary file 4
Antibody panel for T cells.
Table of the flow cytometry staining panel used for identifying T cell subsets.
- https://cdn.elifesciences.org/articles/70554/elife-70554-supp4-v1.xlsx
-
Transparent reporting form
- https://cdn.elifesciences.org/articles/70554/elife-70554-transrepform1-v1.docx
-
Source data 1
18–36-year-old samples d7 cTfh vs. d0 gene list.
- https://cdn.elifesciences.org/articles/70554/elife-70554-supp5-v1.csv
-
Source data 2
Lymph node germinal centre Tfh gene signature.
- https://cdn.elifesciences.org/articles/70554/elife-70554-supp6-v1.csv
-
Source data 3
d7 Tfh gene set.
- https://cdn.elifesciences.org/articles/70554/elife-70554-supp7-v1.csv
-
Source data 4
d7 vaccination genes.
- https://cdn.elifesciences.org/articles/70554/elife-70554-supp8-v1.csv
-
Source data 5
Ageing d7 cTfh vs. d0 gene list.
- https://cdn.elifesciences.org/articles/70554/elife-70554-supp9-v1.csv
Download links
A two-part list of links to download the article, or parts of the article, in various formats.
Downloads (link to download the article as PDF)
Open citations (links to open the citations from this article in various online reference manager services)
Cite this article (links to download the citations from this article in formats compatible with various reference manager tools)
Impaired HA-specific T follicular helper cell and antibody responses to influenza vaccination are linked to inflammation in humans
eLife 10:e70554.
https://doi.org/10.7554/eLife.70554


