The oxygen sensor prolyl hydroxylase domain 2 regulates the in vivo suppressive capacity of regulatory T cells
- U-CRI (ULB Center for Research in Immunology), Université Libre de Bruxelles (ULB), Belgium
- Immunobiology Laboratory, Université Libre de Bruxelles (ULB), Belgium
- Institute for Medical Immunology, Université Libre de Bruxelles (ULB), Belgium
- Department of Radiation Oncology, Institut Jules Bordet, Université Libre de Bruxelles, Belgium
- Laboratory of Clinical and Experimental Oncology (LOCE), Institut Jules Bordet, Université Libre de Bruxelles, Belgium
Figures
Figure 1 with 4 supplements
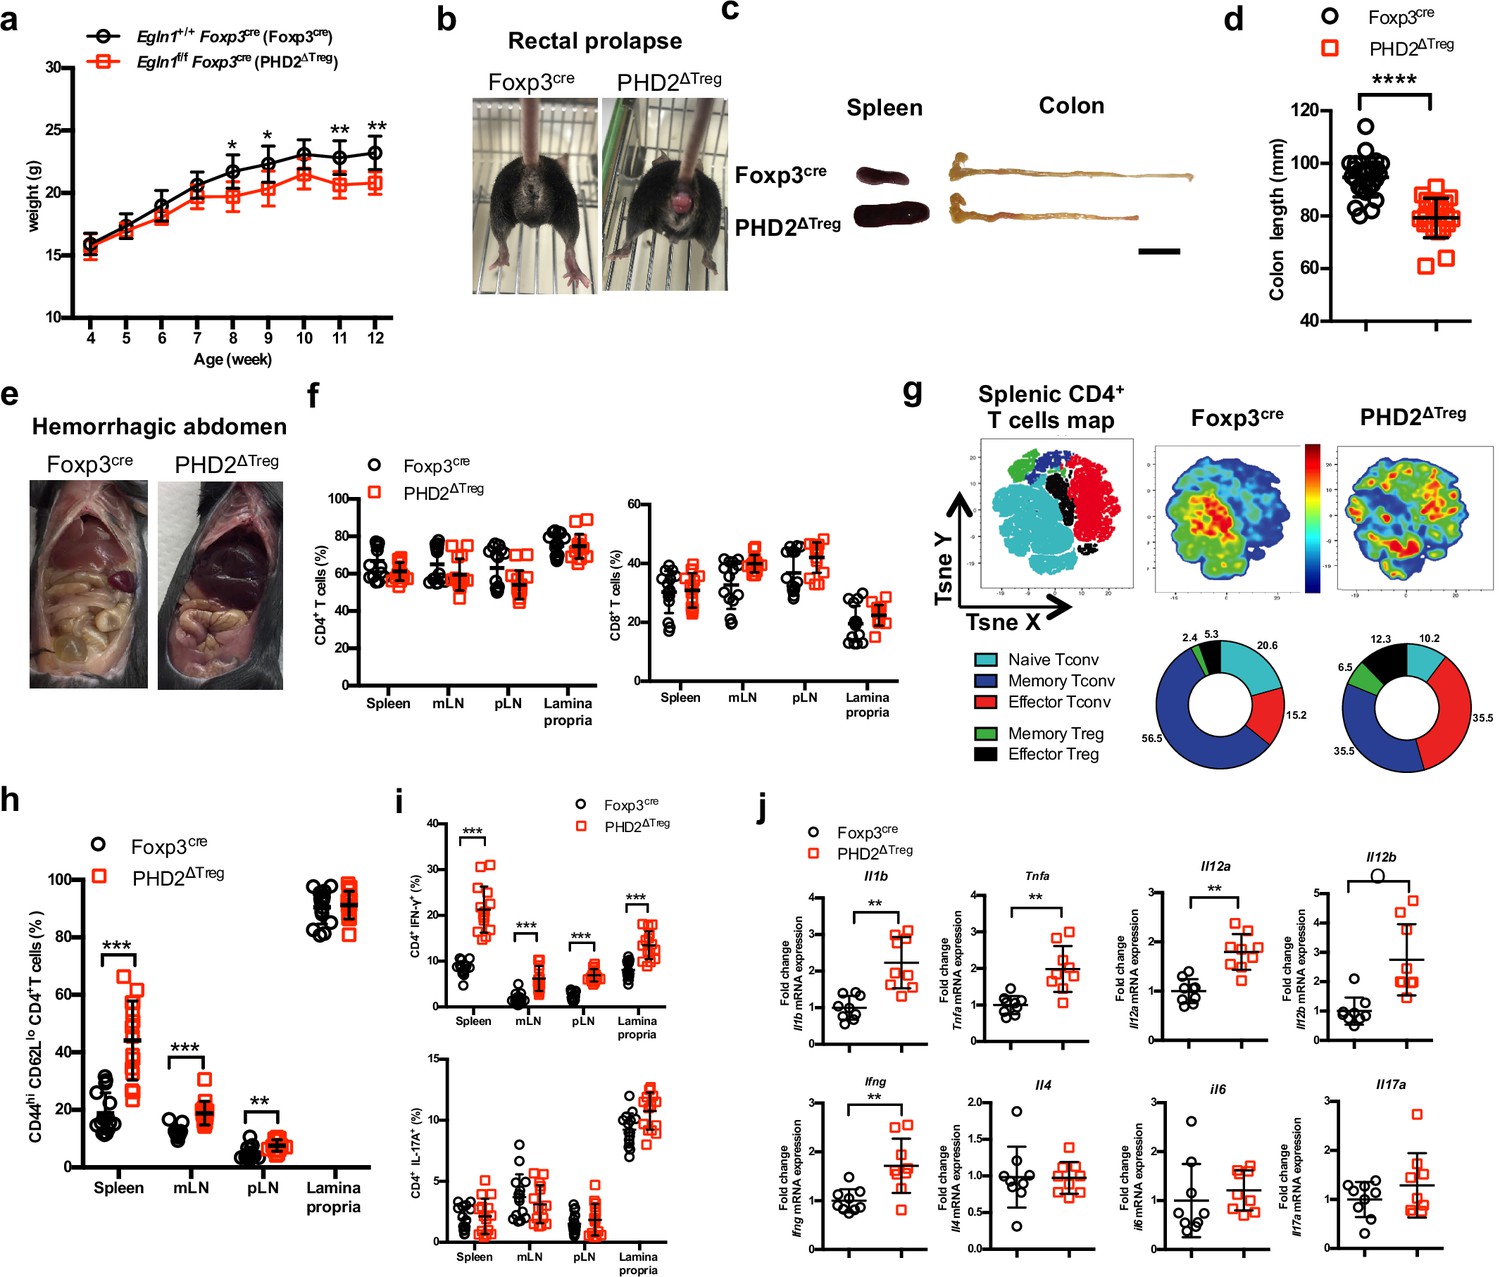
PHD2ΔTreg mice display a spontaneous Th1-like inflammatory syndrome.
(a) Body weight of naive mice was determined weekly. (b) At 12 weeks of age, male and female mice were examined for rectal prolapse. (c) Splenomegaly and colon length summarized in (d). (e) Representative gross autopsy of a hemorrhagic abdomen, (f–i) Lymphoid cells from spleen, mesenteric (mLN), peripheral (pLN) lymph nodes, or the small intestine lamina propria were collected from Foxp3cre and PHD2ΔTreg mice. (f) Frequency of conventional, Foxp3- CD4 and CD8-expressing cells among TCRβ-expressing T lymphocytes. (g) Representative merged (n = 15) t-distributed stochastic neighbor embedding (t-SNE) plot after dimensionality reduction and unsupervised clustering of flow cytometry data from CD4-expressing spleen cells. Relative distributions of CD4+ lymphocyte subsets are shown as doughnut charts. (h) Frequency of effector-like (CD44hi CD62Llo) conventional T lymphocytes in the indicated lymphoid organs. (i) Frequency of IFN-γ (top panel) and IL-17A (bottom panel) producing CD4+ T cells after in vitro stimulation. (j) Expression of inflammatory cytokines determined by qPCR on extracts from unfractionated mLNs. Data are representative of at least three independent experiments with n = 9 (a, j), n = 25 (d), and n = 15 (f–i) per group. Values are presented as the mean ± SD and were compared by two-tailed unpaired Student’s t-test. Only significant differences are indicated as follows: *p<0.05, **p<0.01, ***p<0.001, ****p<0.0001. Naive Tconv: Foxp3- CD44- CD62L+; Memory Tconv: Foxp3- CD44+ CD62L+; Effector Tconv: Foxp3- CD44+ CD62L-; Memory Treg: Foxp3+ CD44+CD62L+; Effector Treg: Foxp3+ CD44+CD62L-.
-
Figure 1—source data 1
PHD2ΔTreg mice display a spontaneous Th1-like inflammatory syndrome.
- https://cdn.elifesciences.org/articles/70555/elife-70555-fig1-data1-v2.xlsx
Figure 1—figure supplement 1
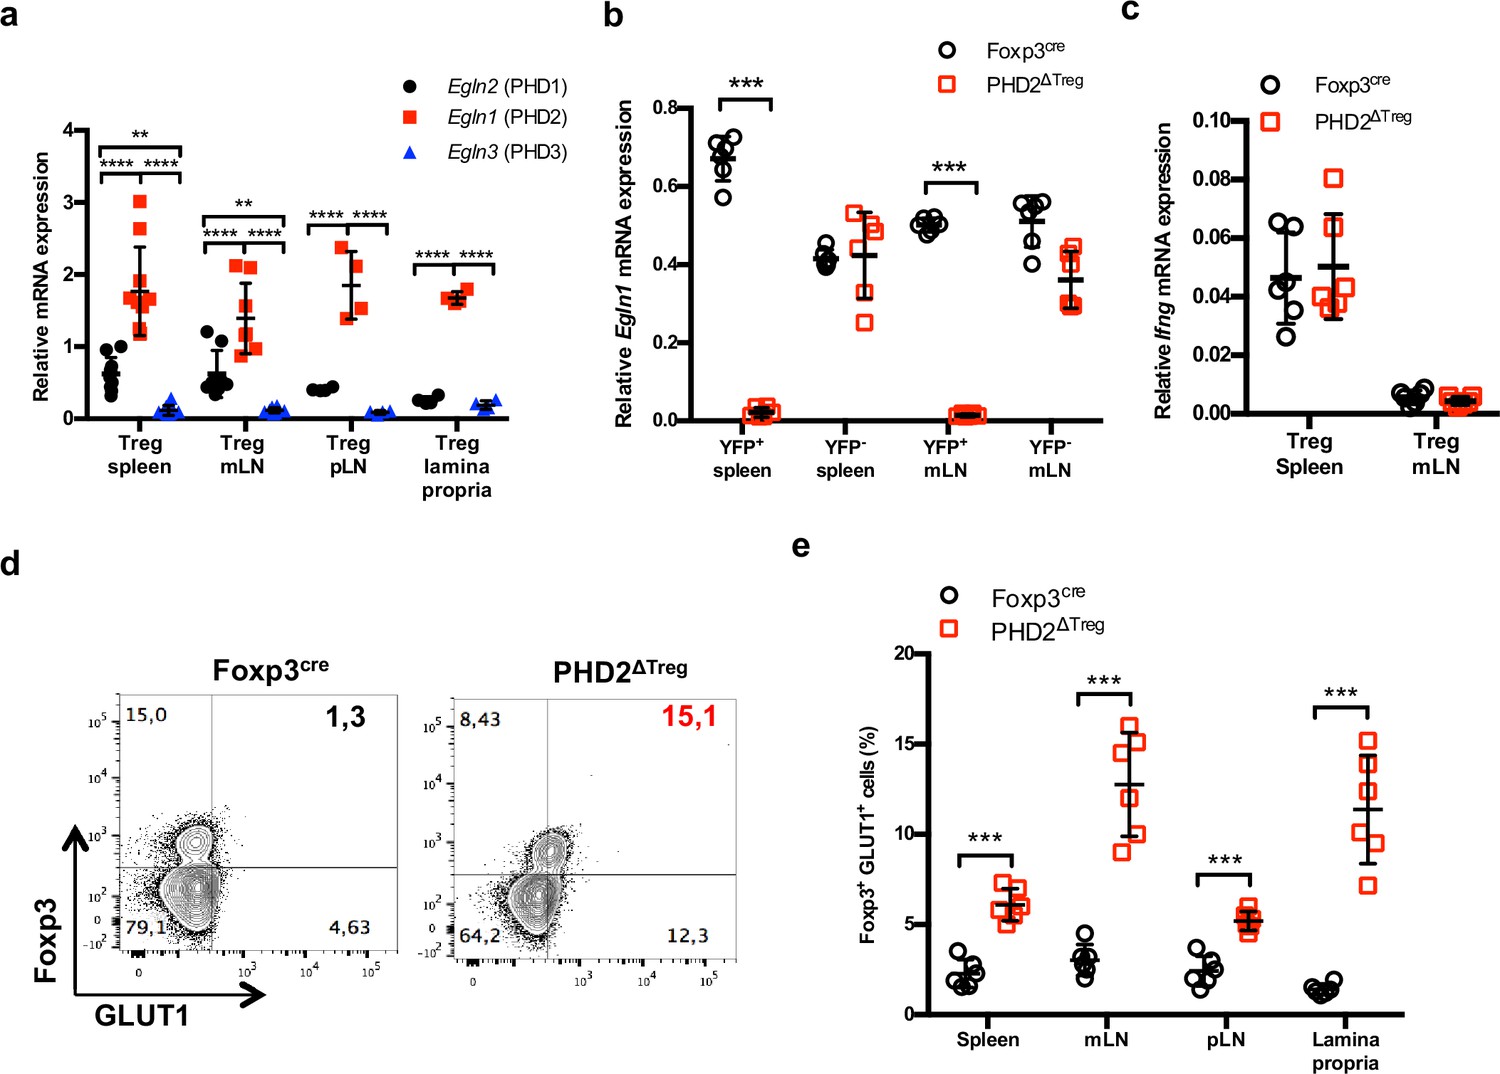
Treg-restricted loss of Egln1 gene expression in PHD2ΔTreg mice.
(a) Treg cells from Foxp3cre male and female mice were purified by cell sorting from spleen (n = 10), mesenteric (mLN) (n = 8), peripheral (pLN) lymph nodes (n = 4), or the small intestine lamina propria (n = 4) and expression of Egln2 (PHD1), Egln1 (PHD2), and Egln3 (PHD3) analyzed by qPCR. (b) YFP-positive (YFP+) and YFP-negative (YFP-) cells from PHD2-sufficient (Foxp3cre mice) and PHD2-deficient (PHD2ΔTreg mice) were purified by cell sorting from spleen and mLN and expression of Egln1 analyzed by qPCR. The graph demonstrates selective loss of Egln1 gene expression in Tregs, but not in Tconvs purified from PHD2ΔTreg mice. (c) Ifng gene expression relative to RPL32 by ex vivo-purified Tregs from spleen and mLN was determined by qPCR. (d) Representative flow cytometry expression profile of GLUT1, a specific HIF1α target gene in Foxp3-expressing or nonexpressing cells from Foxp3cre and PHD2ΔTreg mice. (e) Frequency of GLUT1-expressing Tregs in lymphoid organs from Foxp3cre and PHD2ΔTreg mice. Data are representative of two independent experiments with n = 6 per group. Values are presented as the mean ± SD and were compared by two-tailed unpaired Student’s t-test. Only significant differences are indicated as follows: *p<0.05, **p<0.01, ***p<0.001, ****p<0.0001.
-
Figure 1—figure supplement 1—source data 1
Treg-restricted loss of Egln1 gene expression in PHD2ΔTreg mice.
- https://cdn.elifesciences.org/articles/70555/elife-70555-fig1-figsupp1-data1-v2.xlsx
Figure 1—figure supplement 2
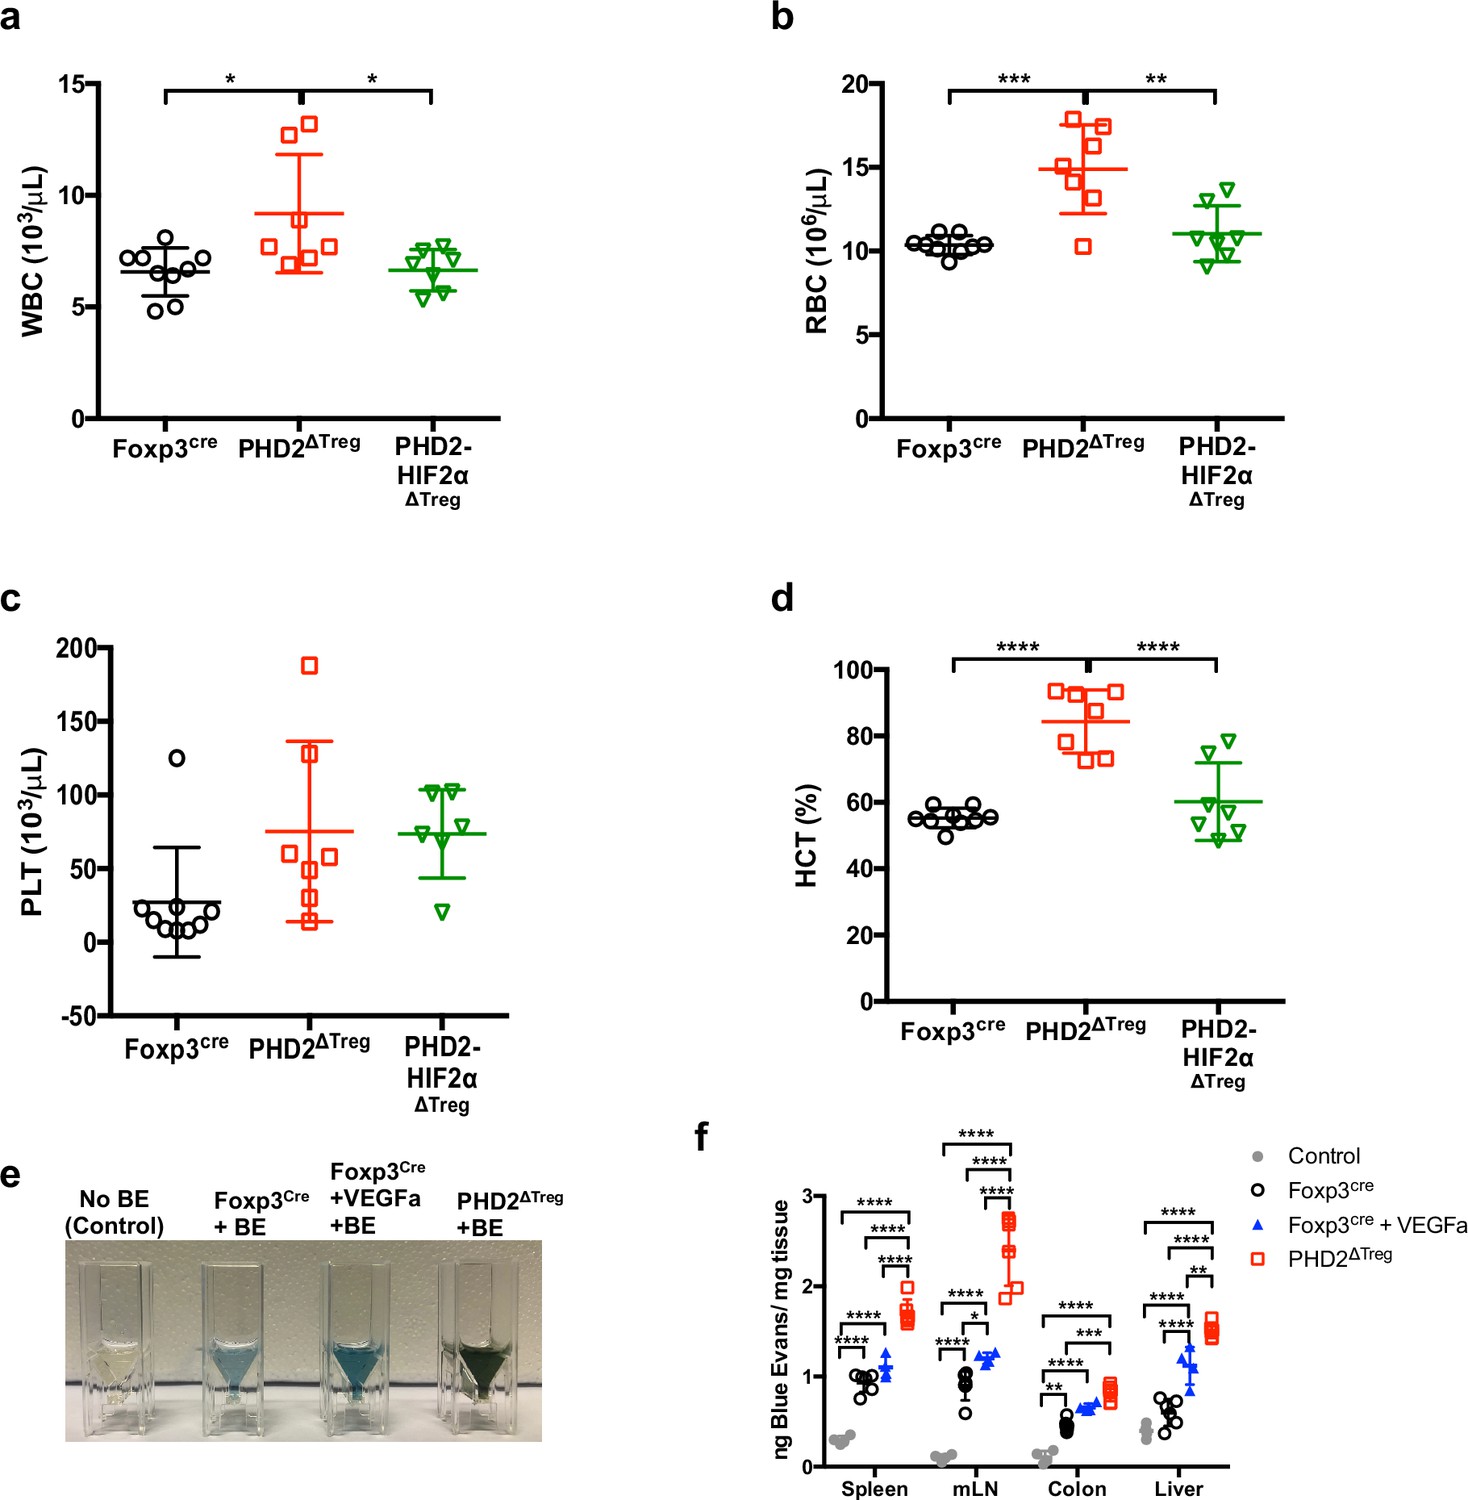
Increased blood cells counts and elevated hematocrit in PHD2ΔTreg mice associated with an increase in vascular permeability.
(a) White blood cell (WBC) counts, (b) red blood cell (RBC) counts, (c) platelet (PLT) counts, and (d) hematocrit (HCT) from Foxp3cre, PHD2ΔTreg, and PHD2-HIF2αΔTreg male mouse blood. To assess vascular permeability, mice were i.v. injected with a 0.5% Evans blue solution, and the indicated, organs collected after 30 min and placed in formamide at 55°C during 24 hr. The absorbance of supernatants was measured at 600 nm, (e) Representative image of the colon supernatant after 24 hr in formamide, (f) ng of Evans blue per mg of tissue for spleen, mesenteric lymph nodes (mLN), colon, and liver of different groups of mice injected or not with Evans blue. Data are representative of two (a–d) or three (e, f) independent experiments with n = 7–9 per group (a–d) or n = 4–6 per group (e, f). Values are presented as the mean ± SD and were compared by one-way ANOVA (a–d) or two-way ANOVA (f) with Tukey’s multiple comparisons test. Only significant differences are indicated as follows: *p<0.05, **p<0.01, ***p<0.001, ****p<0.0001.
-
Figure 1—figure supplement 2—source data 1
Increased blood cells counts and elevated hematocrit in PHD2ΔTreg mice associated with an increase in vascular permeability.
- https://cdn.elifesciences.org/articles/70555/elife-70555-fig1-figsupp2-data1-v2.xlsx
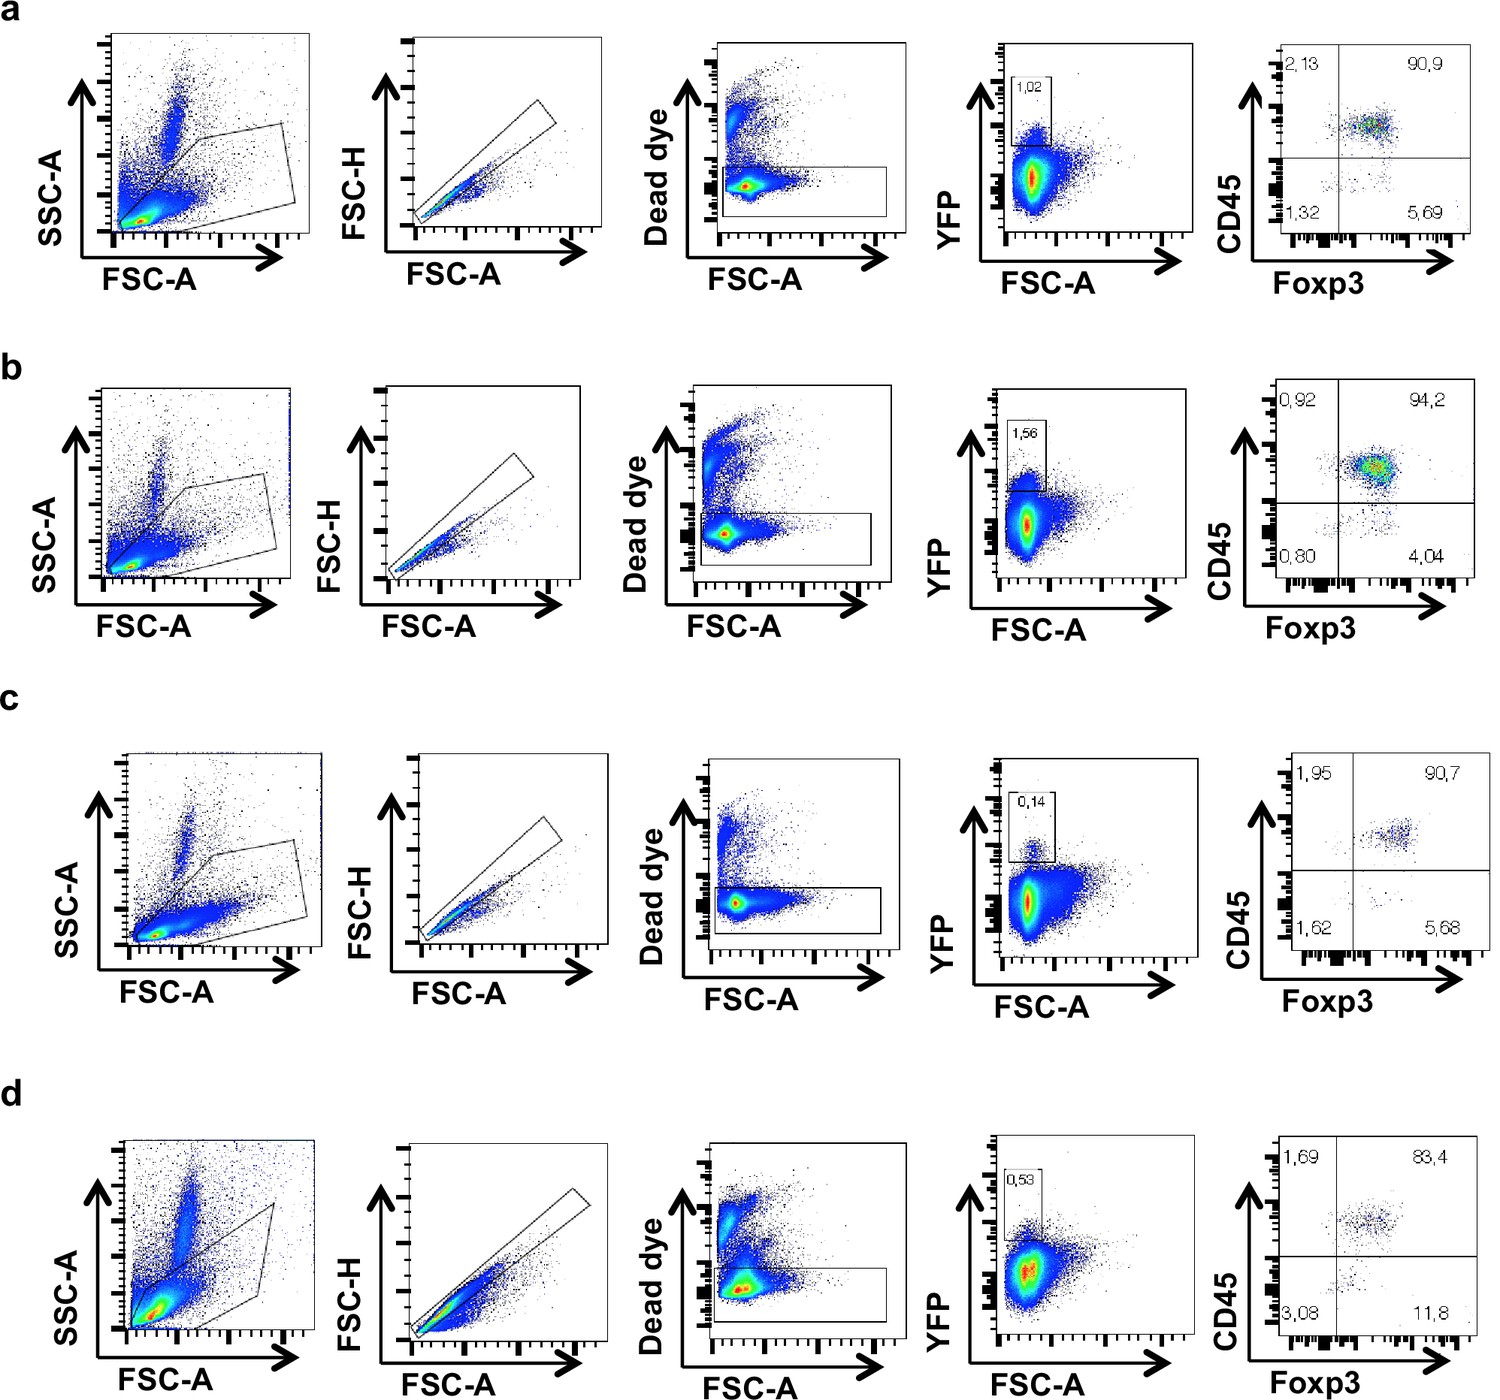
Figure 1—figure supplement 3
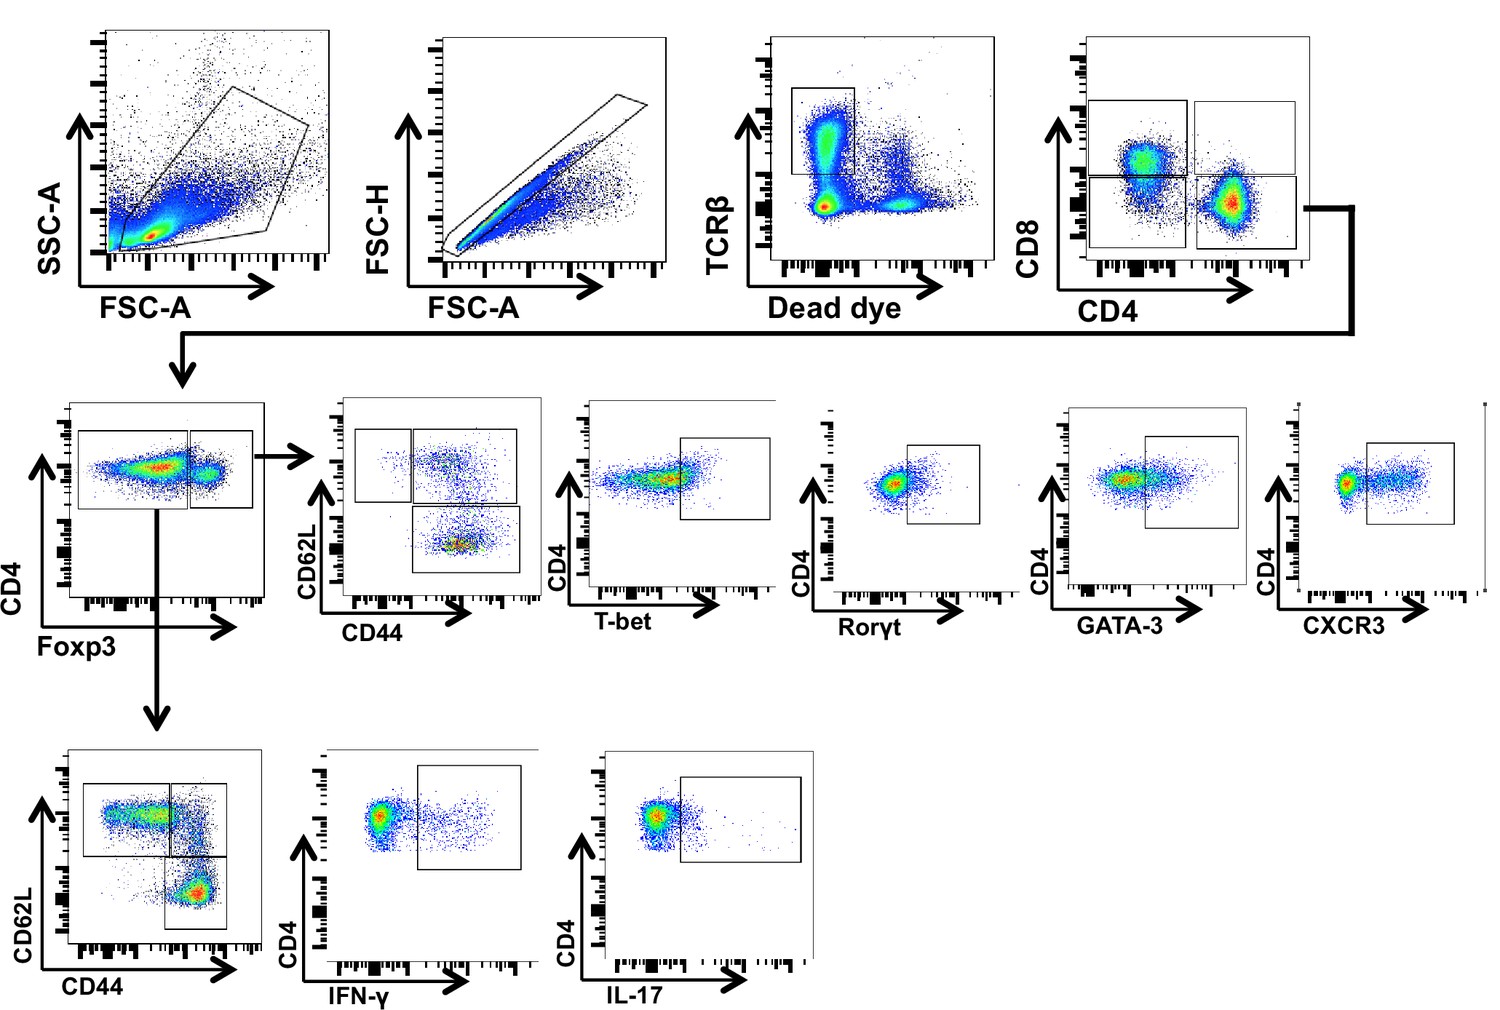
Gating strategy for flow cytometry data analysis.
Figure 1—figure supplement 4
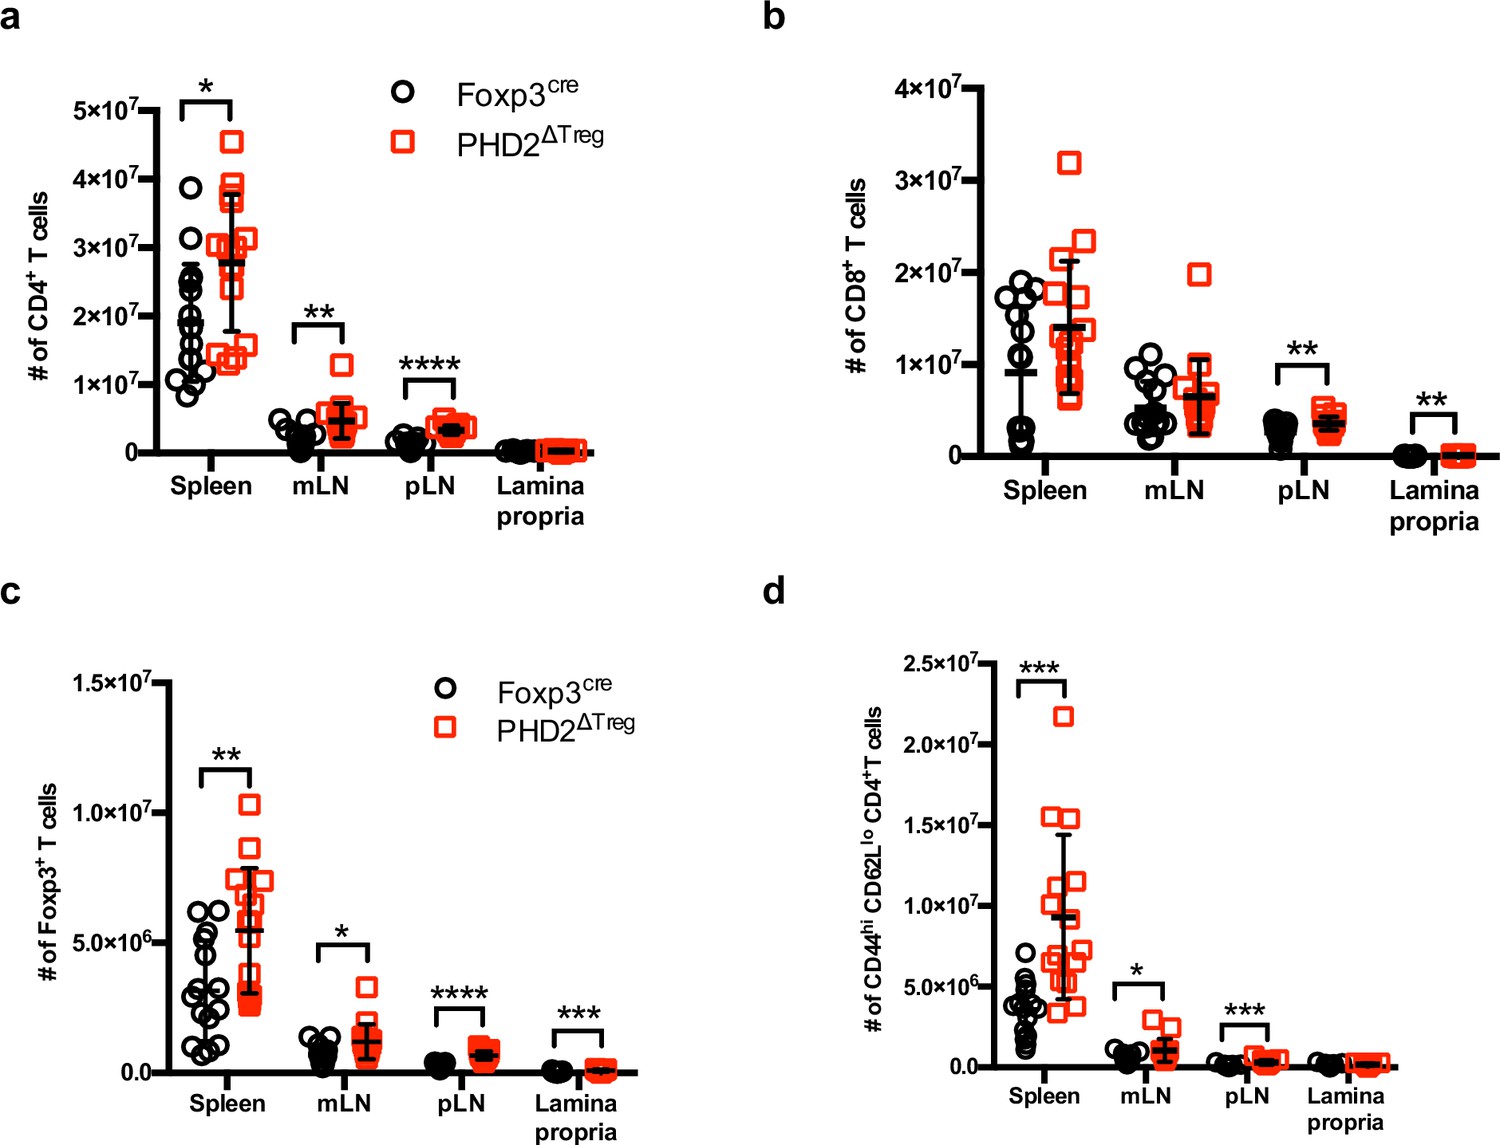
Absolute cell counts.
Absolute cell counts of (a) CD4+ T cells, (b) CD8+ T cells, (c) regulatory T cells, and (d) activated conventional T cells in the spleen, mesenteric (mLN), peripheral (pLN) lymph nodes, and the small intestine lamina propria of Foxp3cre and PHD2ΔTreg male and female mice. Data are representative of at least three independent experiments with n = 15 per group. Values are presented as the mean ± SD and were compared by two-tailed unpaired Student’s t-test. Only significant differences are indicated as follows: *p<0.05, **p<0.01, ***p<0.001, ****p<0.0001.
-
Figure 1—figure supplement 4—source data 1
Absolute cell counts.
- https://cdn.elifesciences.org/articles/70555/elife-70555-fig1-figsupp4-data1-v2.xlsx
Figure 2
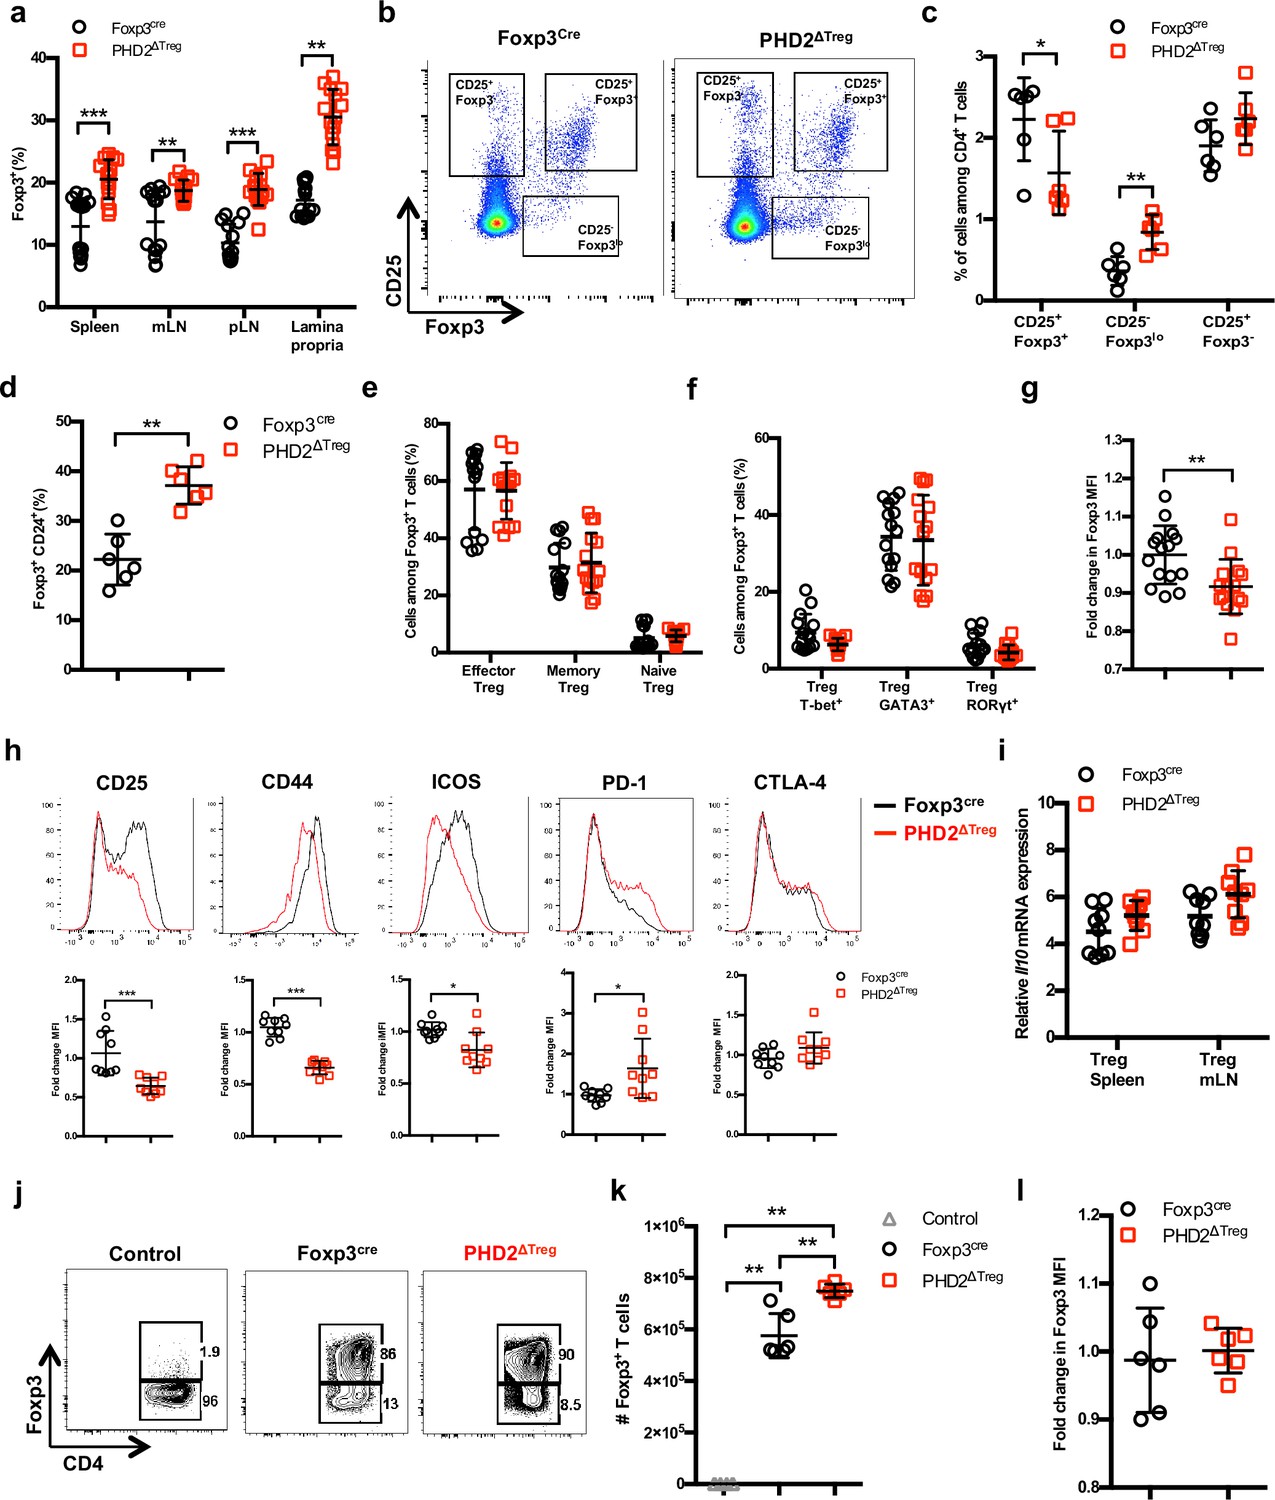
Increased number, but altered phenotype of PHD2-deficient Treg cells.
Lymphoid cells from the thymus, spleen, mesenteric (mLN), and peripheral (pLN) lymph nodes were collected at 12 weeks of age from Foxp3cre and PHD2ΔTreg male and female mice, and the relative frequency and phenotype of Foxp3-expressing cells were established by flow cytometry or qPCR. (a) Frequency of Foxp3-expressing cells among CD4-positive T lymphocytes. (b) Representative flow cytometry expression profiles of Foxp3 and CD25 expression among thymic CD4+ T cells. (c) Frequency of mature-like (CD25+ Foxp3+) and Treg precursors subsets identified respectively as CD25- Foxp3lo and CD25+ Foxp3- cells among thymic CD4+ T cells. (d) Frequency of immature-like, CD24+ Foxp3+ T cells in the thymus of adult mice. (e) Frequency of effector (CD62Llow CD44high), memory (CD62Lhigh CD44high), and naive (CD62Lhigh CD44low) splenic Foxp3-expressing cells. (f) Frequency of splenic Tregs expressing the master transcription factors T-bet, GATA3, and RORγt. (g) Ratio of the Foxp3 MFI of PHD2-KO splenic Tregs to Foxp3cre splenic Tregs. (h) Expression of CD25, CD44, ICOS, PD-1, and CTLA-4 in splenic Treg of Foxp3cre and PHD2ΔTreg mice. Top panel: representative traces of MFI. Bottom panel: ratios of the MFIs of PHD2-KO Treg to Foxp3cre Treg cells are expressed as the mean ± SD. (i) Il10 gene expression relative to RPL32 by ex vivo-purified Tregs was determined by qPCR. (j–l) CD4+ Foxp3- splenic naive T cells were stimulated in vitro with anti-CD3/CD28 (5/1 μg/ml) in the presence of TGF-β (3 μg/ml) and IL-2 (10 μg/ml) for 72 hr to induce Treg polarization. (j) Representative flow cytometry expression profiles of Foxp3 expression at the end of the culture period. The first panel represents a typical profile of cells activated in the absence of polarizing cytokines. (k) Number of Foxp3+ cells generated in the culture conditions. (l) Expression (MFI) of Foxp3 by in vitro-induced Treg cells. Data are representative of at least two independent experiments with n = 15 (a, e–g) n = 9 (h, i) or n = 6 (c, d, k, l) per group. Values are presented as the mean ± SD and were compared by two-tailed unpaired Student’s t-test. Only significant differences are indicated as follows: *p<0.05, **p<0.01, ***p<0.001.
-
Figure 2—source data 1
Increased number, but altered phenotype of PHD2-deficient Treg cells.
- https://cdn.elifesciences.org/articles/70555/elife-70555-fig2-data1-v2.xlsx
Figure 3
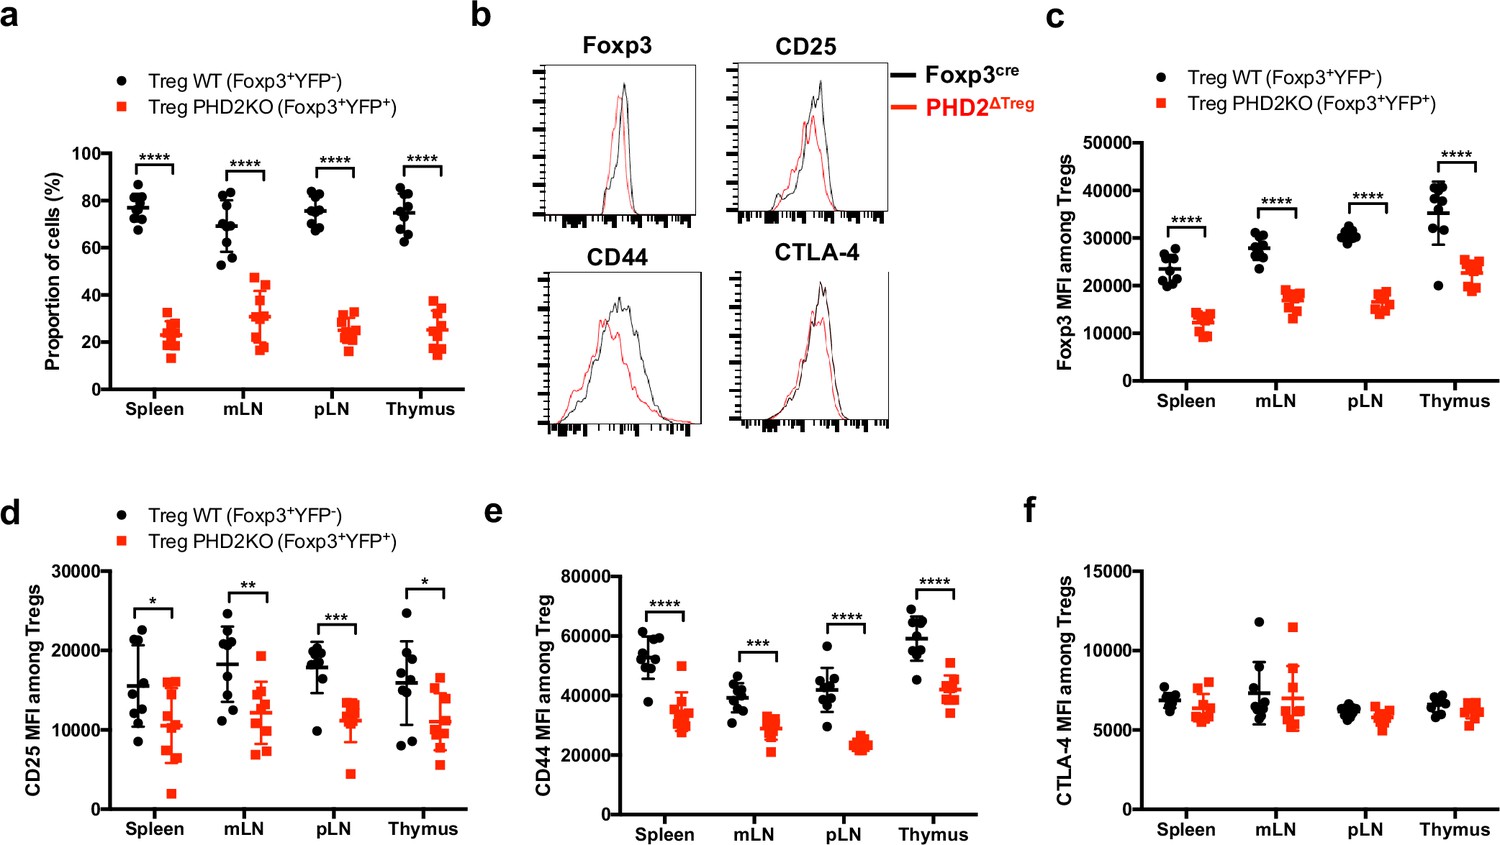
Cell-autonomous role of PHD2 in determining Treg cells phenotype.
Spleen, thymus, mesenteric (mLN), and peripheral (pLN) lymph nodes were collected at 8 weeks of age from Foxp3cre/+Egln1f/f heterozygous female mice, and the relative frequency and phenotype of Foxp3-expressing cells were established by flow cytometry. (a) Proportion of WT (YFP- cells) or PHD2-KO (YFP+ cells) Treg cells among Foxp3-expressing cells. (b) Representative histograms of Foxp3, CD25, CD44, and CTLA-4 expression in splenic WT Tregs (black lines) compared to splenic PHD2-KO Tregs (red lines). (c) Foxp3 MFI, (d) CD25 MFI, (e) CD44 MFI, and (f) CTLA-4 MFI of WT and PHD2-KO Tregs in lymphoid organs. Data are representative of two independent experiments with n = 9 per group. Values are presented as the mean ± SD and were compared by two-tailed unpaired Student’s t-test. Only significant differences are indicated as follows: *p<0.05, **p<0.01, ***p<0.001, ****p<0.0001.
-
Figure 3—source data 1
Cell-autonomous role of PHD2 in determining Treg cells phenotype.
- https://cdn.elifesciences.org/articles/70555/elife-70555-fig3-data1-v2.xlsx
Figure 4
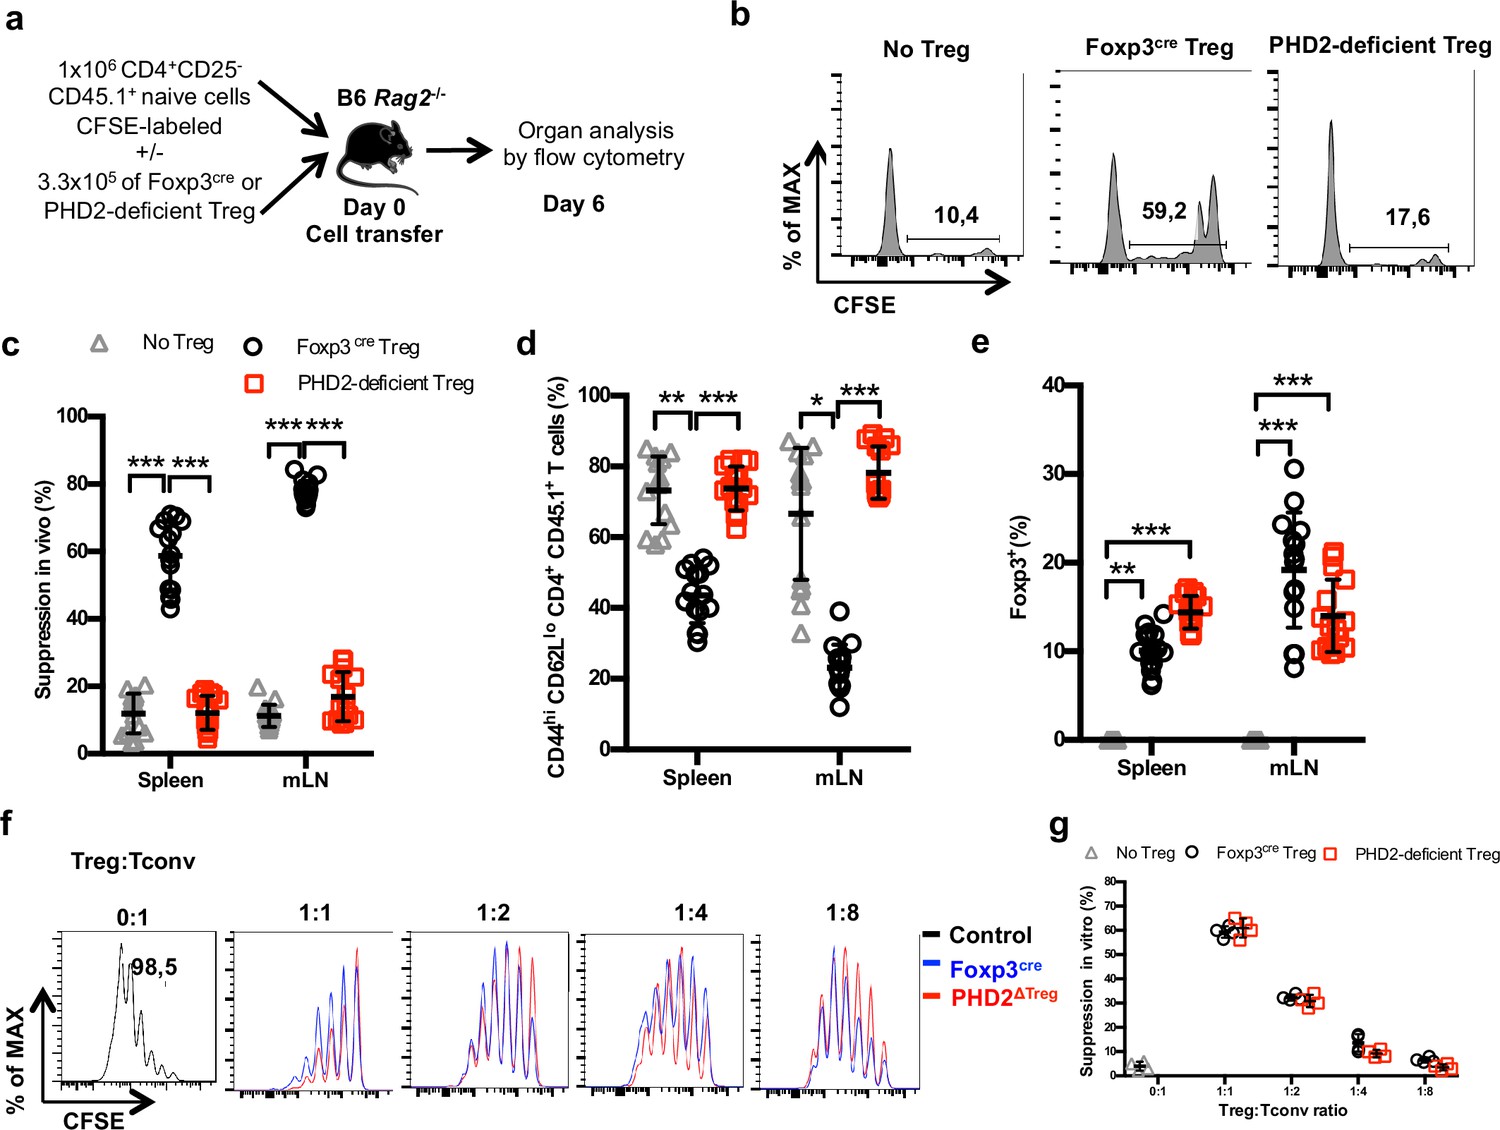
Reduced in vivo but not in vitro suppressive capacity of PHD2-deficient Treg.
(a) Treg function was assayed following adoptive co-transfer of CD45.2 Foxp3-expressing cells with naive, CFSE-labeled congenic CD45.1 CD4+ lymphocytes (Treg: Tconv ratio 1:3) into syngeneic lymphopenic male mice (Rag2-/-). Recipient mice were euthanized at day 6 post-transfer, and their spleen and mesenteric lymph node (mLN) cells analyzed by flow cytometry. (b) Representative flow cytometry expression profiles of CFSE-labeled cells (CD45.1 gate in the spleen) with or without co-transferred Foxp3+ cells from Foxp3cre or PHD2ΔTreg male mice. (c) Percentage of suppression established from CFSE staining profiles. (d) Frequency of activated (CD4+ CD45.1+ CD44hi CD62Llo) cells in the indicated lymphoid organs. (e) Frequency of Treg cells in the indicated organs 6 days post-transfer. (f, g) CFSE-labeled, naive conventional CD4+ T cells from CD54.1 mice were co-cultured with ex vivo-purified Treg cells from Foxp3cre or PHD2ΔTreg mice at the indicated ratios in the presence of anti-CD3 antibodies (0.5 μg/ml) and splenic feeder cells. (f) Representative flow cytometry profiles of CSFE staining. (g) Percent of suppression of proliferation as compared to cultures in which Treg cells were omitted. Data are representative of three independent experiments with n = 15 (b–e) or n = 4 (f, g) per group. Values are presented as the mean ± SD and were compared by two-way ANOVA with Tukey’s multiple comparisons test (c–e) or two-tailed unpaired Student’s t-test (g). Only significant differences are indicated as follows: *p<0.05, **p<0.01, ***p<0.001.
-
Figure 4—source data 1
Reduced in vivo but not in vitro suppressive capacity of PHD2-deficient Treg.
- https://cdn.elifesciences.org/articles/70555/elife-70555-fig4-data1-v2.xlsx
Figure 5 with 2 supplements
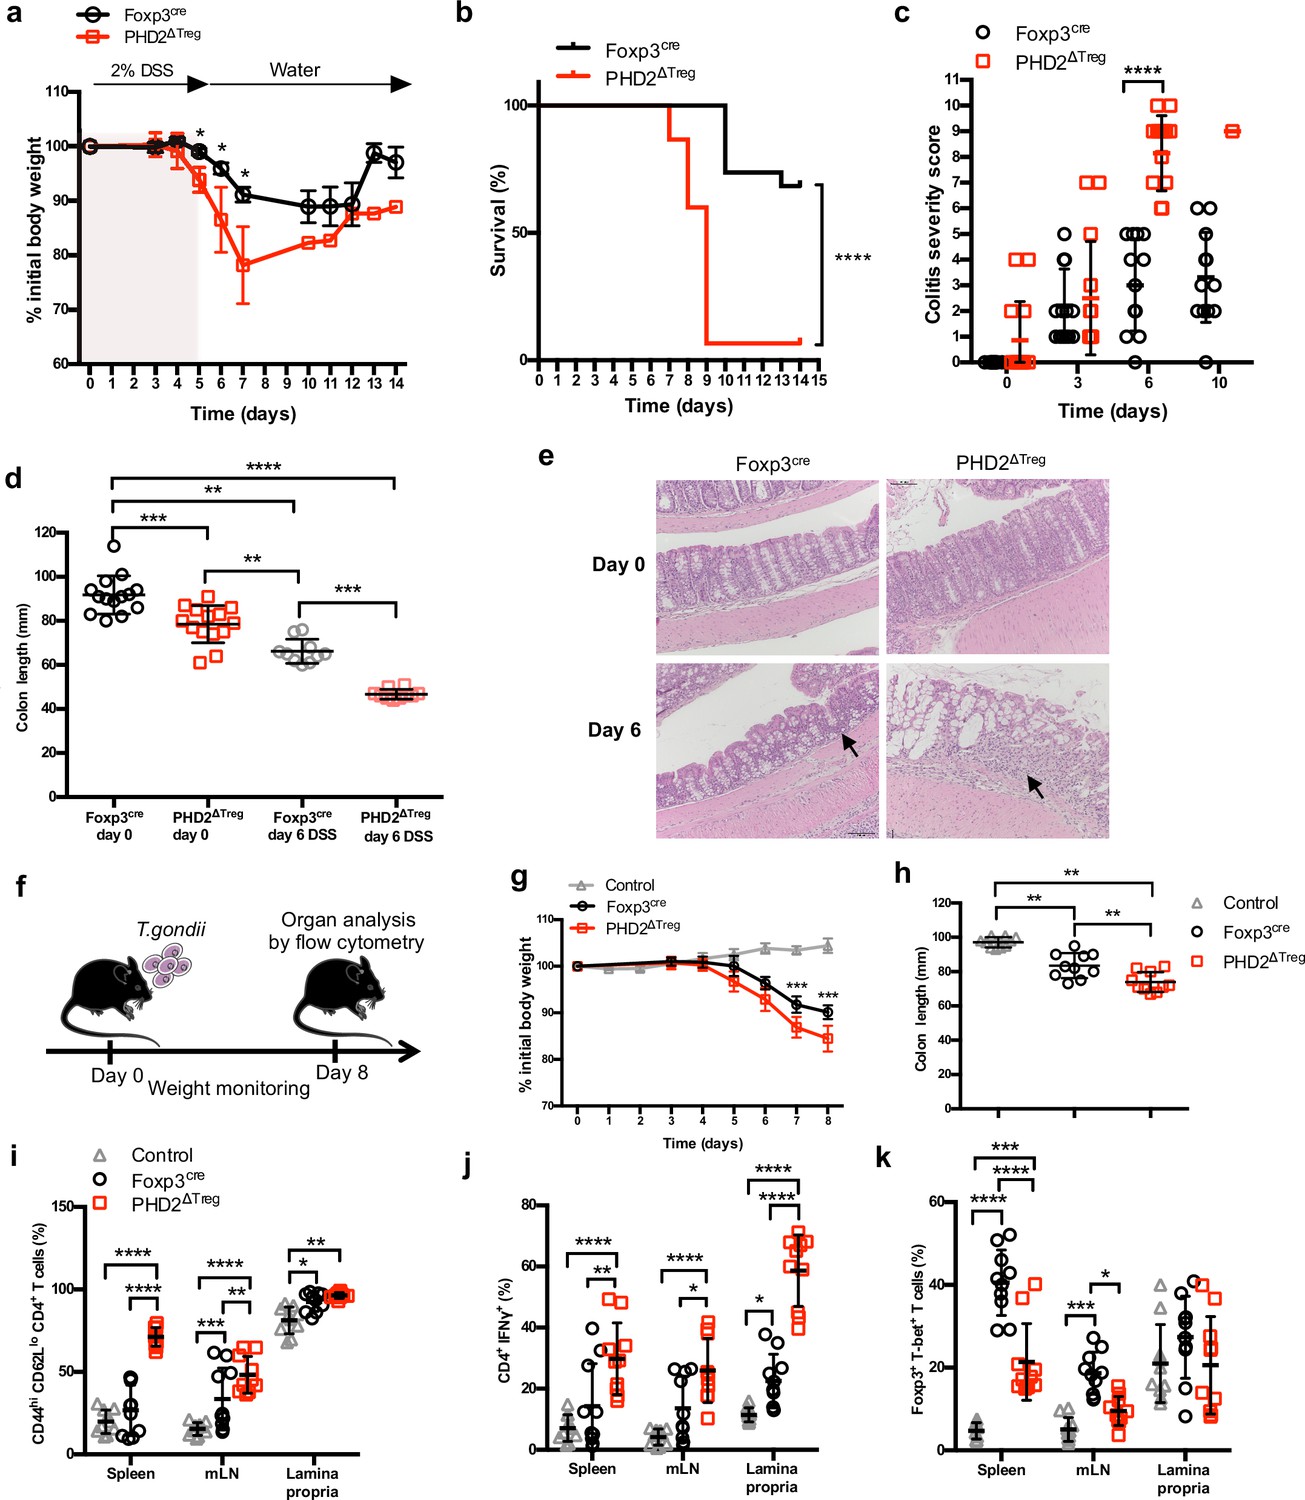
Increased sensitivity of PHD2ΔTreg mice to dextran sodium sulfate (DSS)-induced colitis and toxoplasmosis.
Foxp3cre and PHD2ΔTreg male mice were provided with 2% DSS in tap water for 5 days. On day 5, the 2% DSS water was replaced with normal drinking water and mice were followed during 14 days for (a) body weight, (b) survival, (c) colitis severity, and (d) colon length. (e) Colons were isolated from untreated mice or 6 days after colitis induction and were fixed and stained with hematoxylin and eosin (H&E); arrows indicate inflammatory cell infiltrates. (f) Foxp3cre and PHD2ΔTreg male mice were infected by intragastric gavage with 10 cysts of ME-49 type II Toxoplasma gondii (control group are Foxp3cre mice without treatment) and subsequently followed for (g) body weight. (h) Mice were sacrificed 8 days after infection to assess colon length. (i) Frequency of effector-like (CD44hi CD62Llo) conventional T lymphocytes in the indicated lymphoid organs. (j) Frequency of IFN-γ-producing CD4+ T cells after in vitro stimulation. (k) Frequency of T-bet+ among Foxp3+(Treg) cells. Data are representative of three independent experiments with n = 20 (a, b), n = 10–14 (c, d), n = 5 (e), or n = 10 (g–k) per group. Values are presented as the mean ± SD and were compared by two-tailed unpaired Student’s t-test (a, c, g), by Mantel–Cox test (b), one-way ANOVA with Tukey’s multiple comparisons test (d, h) or two-way ANOVA with Tukey’s multiple comparisons test (i–k). Only significant differences are indicated as follows: *p<0.05, **p<0.01, ***p<0.001, ****p<0.0001.
-
Figure 5—source data 1
Increased sensitivity of PHD2ΔTreg mice to dextran sodium sulfate (DSS)-induced colitis and toxoplasmosis.
- https://cdn.elifesciences.org/articles/70555/elife-70555-fig5-data1-v2.xlsx
Figure 5—figure supplement 1
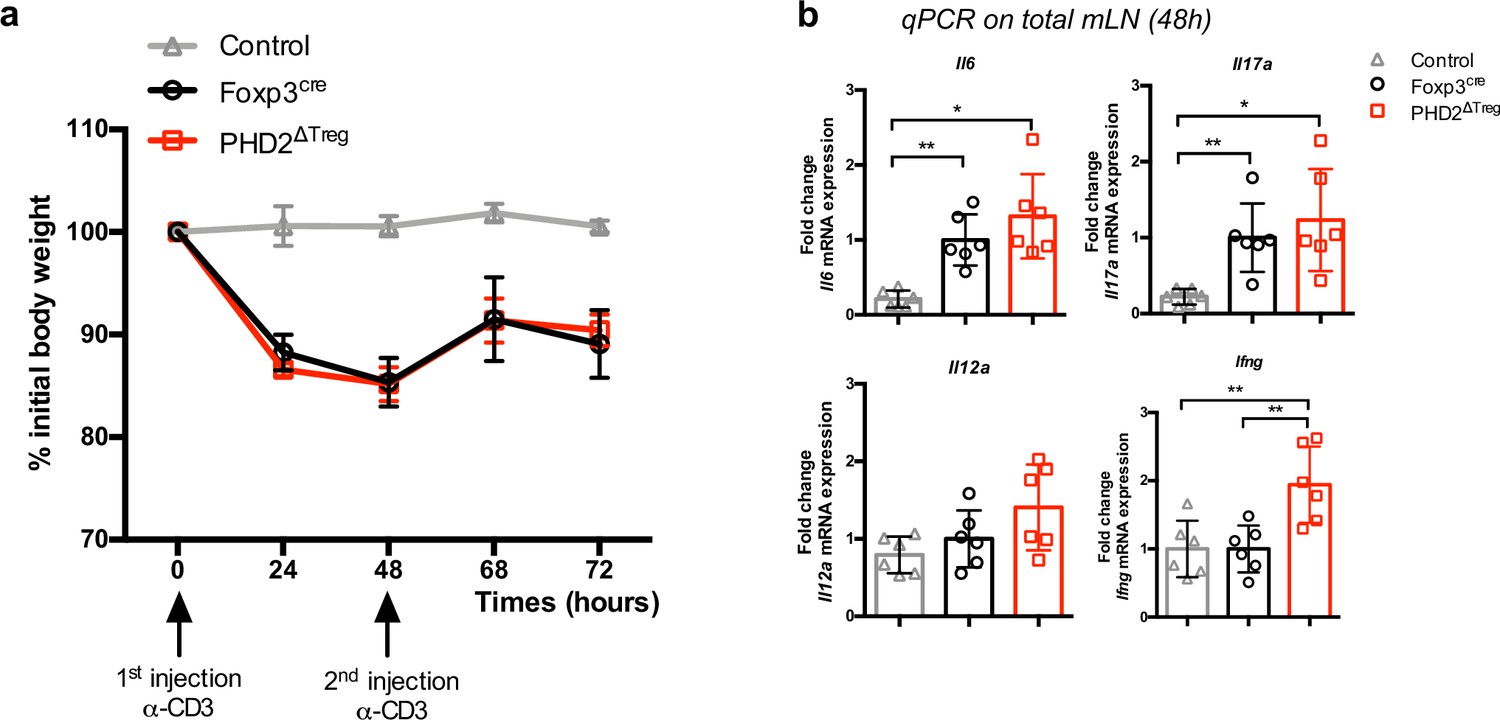
PHD2ΔTreg mice display a near-normal response to anti-CD3-induced enteritis.
Foxp3cre and PHD2ΔTreg female mice were injected twice i.p. with anti-CD3 mAbs (20 µg) at 2 days interval and weighted daily. (a) Weight loss was found similar in both mouse strains tested. (b) Relative expression of inflammatory mediators evaluated by qPCR on whole, unfractionated mesenteric lymph nodes. A similar, Th17-like response was observed in both mouse strains. Data are representative of two independent experiments with n = 6 per group. Values are presented as the mean ± SD and were compared by one-way ANOVA with Tukey’s multiple comparisons test. Only significant differences are indicated as follows: *p<0.05, **p<0.01.
-
Figure 5—figure supplement 1—source data 1
PHD2ΔTreg mice display a near-normal response to anti-CD3-induced enteritis.
- https://cdn.elifesciences.org/articles/70555/elife-70555-fig5-figsupp1-data1-v2.xlsx
Figure 5—figure supplement 2
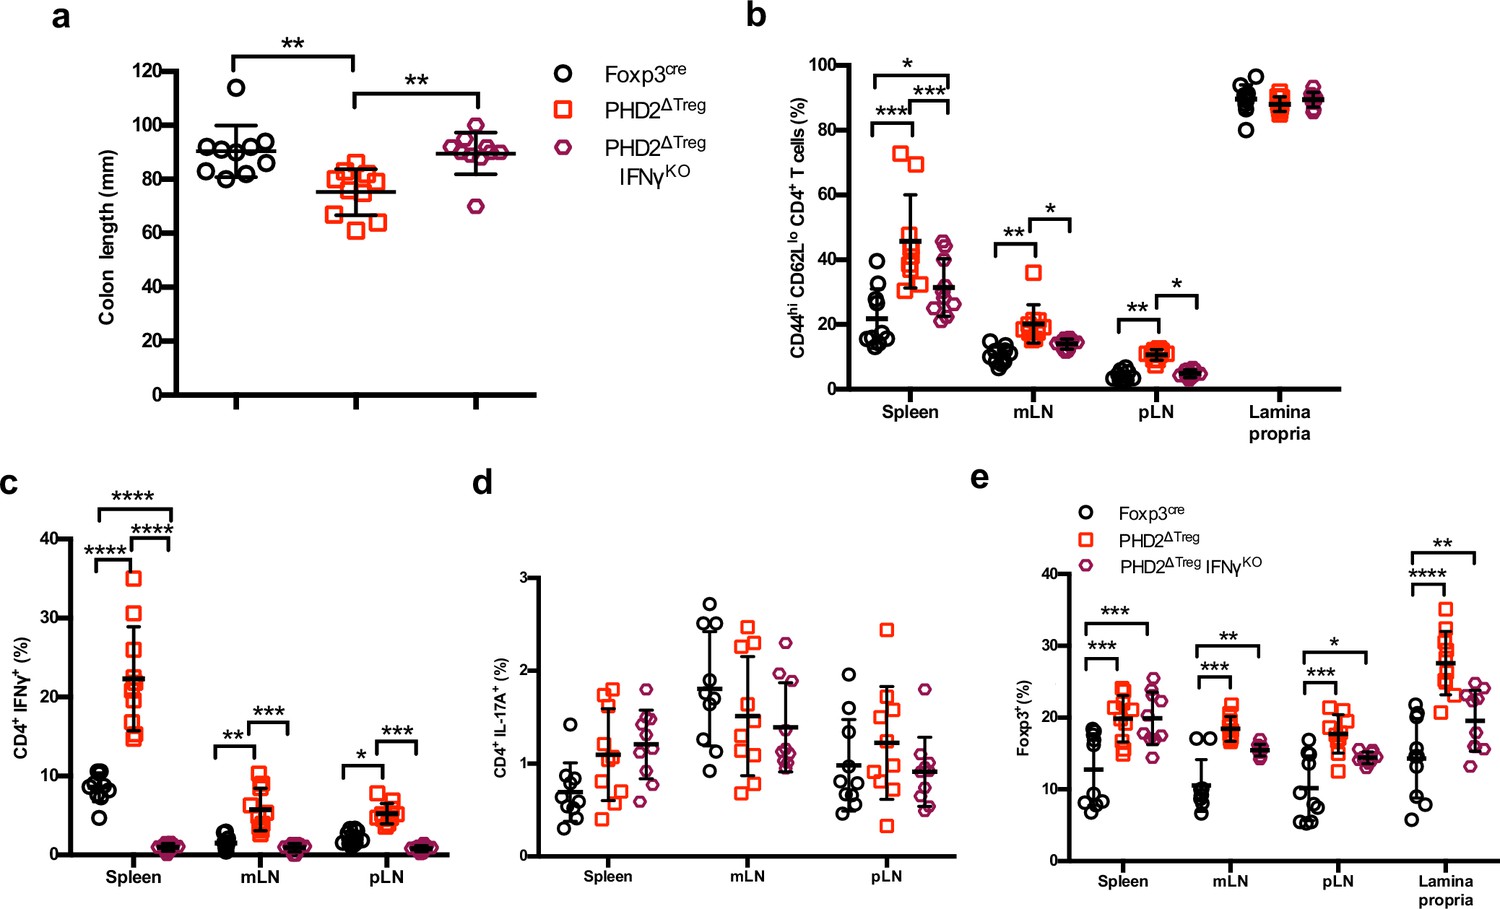
Loss of Ifng gene expression attenuates the proinflammatory phenotype of PHD2ΔTreg mice.
PHD2ΔTreg mice were crossed with IFN-γKO mice (PHD2ΔTreg IFN-γKO mice) and were compared to Foxp3cre and PHD2ΔTreg male and female mice and analyzed for (a) colon length, (b) frequency of effector-like (CD44hi CD62Llo) conventional T lymphocytes in the indicated lymphoid organs, (c) frequency of IFN-γ production after in vitro stimulation, (d) frequency of IL-17A-producing cells after in vitro stimulation, and (e) frequency of Foxp3+ cells in the indicated lymphoid organs. Data are representative of three independent experiments with n = 10 per groups. Values are expressed as the mean ± SD and were compared by one-way ANOVA with Tukey’s multiple comparisons test (a) or two-way ANOVA with Tukey’s multiple comparisons test (b–e). Only significant differences are indicated as follows: *p<0.05, **p<0.01, ***p<0.001, ****p<0.0001.
-
Figure 5—figure supplement 2—source data 1
Loss of Ifng gene expression attenuates the proinflammatory phenotype of PHD2ΔTreg mice.
- https://cdn.elifesciences.org/articles/70555/elife-70555-fig5-figsupp2-data1-v2.xlsx
Figure 6 with 1 supplement
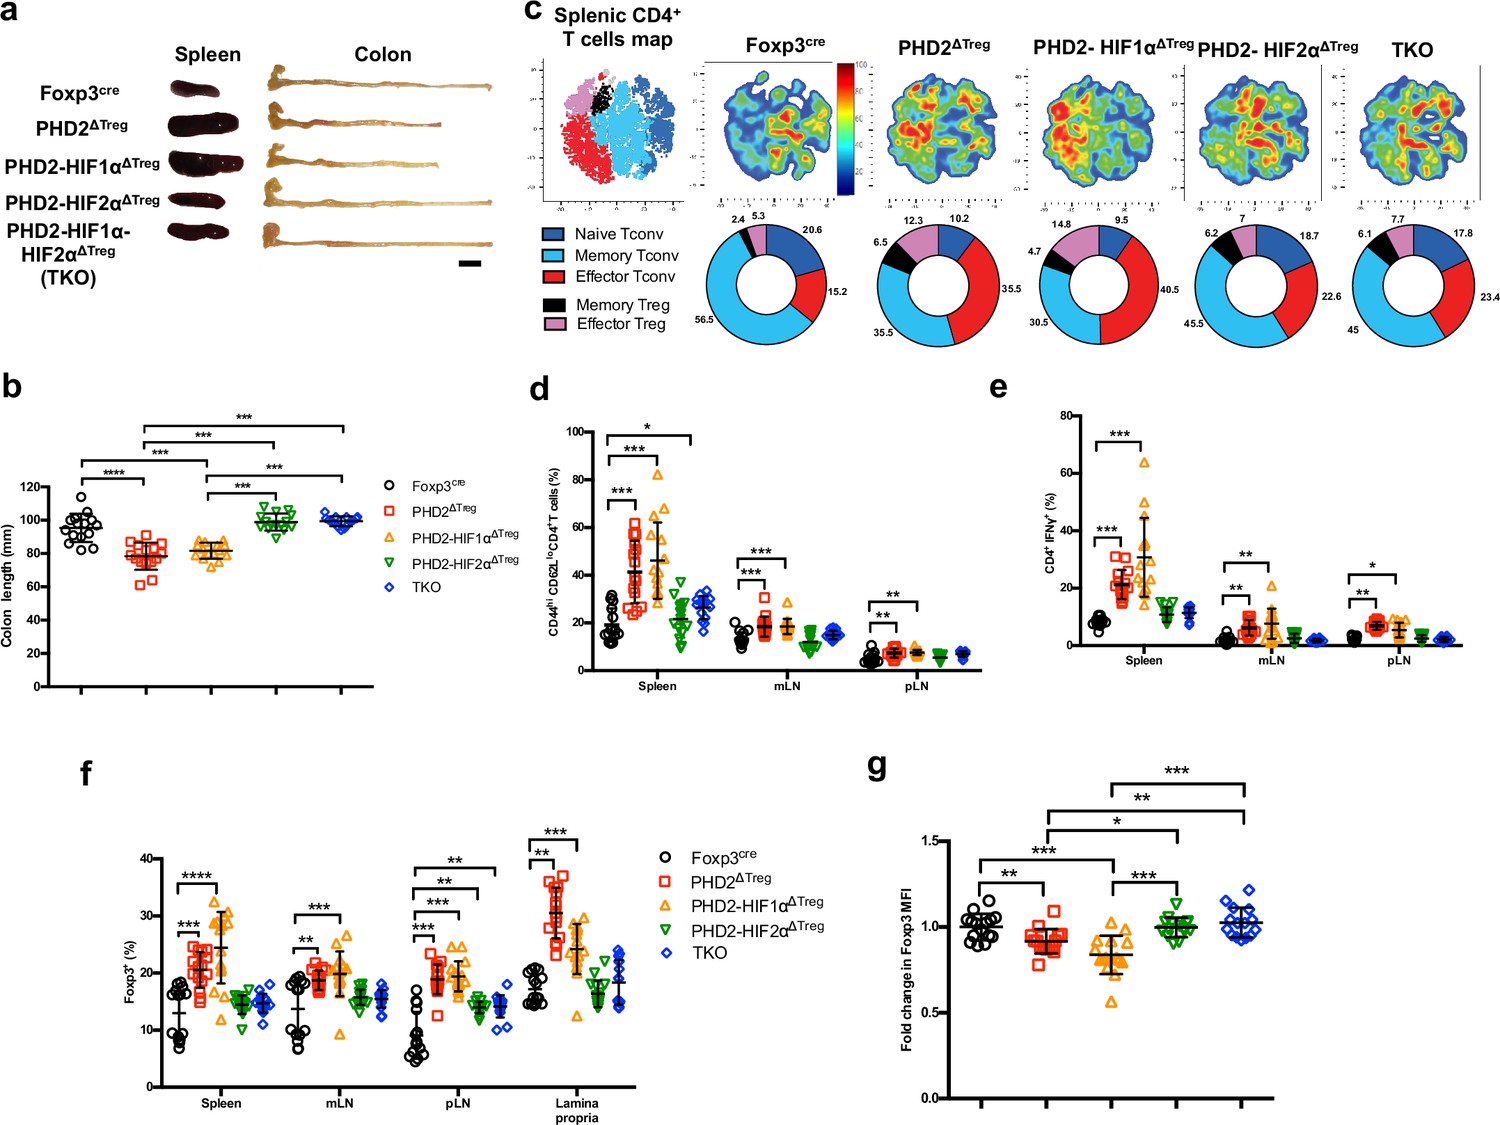
Concomitant loss of HIF2α but not HIF1α expression attenuates the proinflammatory phenotype of PHD2ΔTreg mice.
(a) Representative gross autopsy of spleens and colon length summarized in (b) of Foxp3cre, PHD2ΔTreg, PHD2-HIF1αΔTreg, PHD2-HIF2αΔTreg, and PHD2-HIF1α-HIF2αΔTreg (TKO) mice. (c) Representative merged (n = 15) t-distributed stochastic neighbor embedding (t-SNE) plot after dimensionality reduction and unsupervised clustering of flow cytometry data from CD4-expressing spleen cells. Relative distributions of CD4+ lymphocyte subsets are shown as doughnut charts. (d–g) Lymphoid cells from spleen, mesenteric (mLN), peripheral (pLN) lymph nodes, or the small intestine lamina propria were collected from Foxp3cre, PHD2ΔTreg, PHD2-HIF1αΔTreg mice, PHD2-HIF2αΔTreg and PHD2-HIF1α-HIF2αΔTreg (TKO) male and female mice and the relative frequency and phenotype of Foxp3-positive and Foxp3-negative, conventional T lymphocytes determined by flow cytometry. (d) Frequency of effector-like (CD44hi CD62Llo) conventional T lymphocytes in the indicated lymphoid organs. (e) Frequency of IFN-γ-producing CD4+ T cells after in vitro stimulation. (f) Frequency of Foxp3-expressing cells among CD4-positive T lymphocytes. (g) Ratio of the Foxp3 MFI of PHD2-KO, PHD2-HIF1αKO, PHD2-HIF2αKO, or TKO splenic Tregs to Foxp3cre splenic Tregs. Data are representative of at least three independent experiments with n = 15 per groups. Values are expressed as the mean ± SD and were compared by one-way ANOVA with Tukey’s multiple comparisons test (b, g) or two-way ANOVA with Tukey’s multiple comparisons test (d–f). Only significant differences are indicated as follows: *p<0.05, **p<0.01, ***p<0.001, ****p<0.0001.
-
Figure 6—source data 1
Concomitant loss of HIF2α but not HIF1α expression attenuates the proinflammatory phenotype of PHD2ΔTreg mice.
- https://cdn.elifesciences.org/articles/70555/elife-70555-fig6-data1-v2.xlsx
Figure 6—figure supplement 1
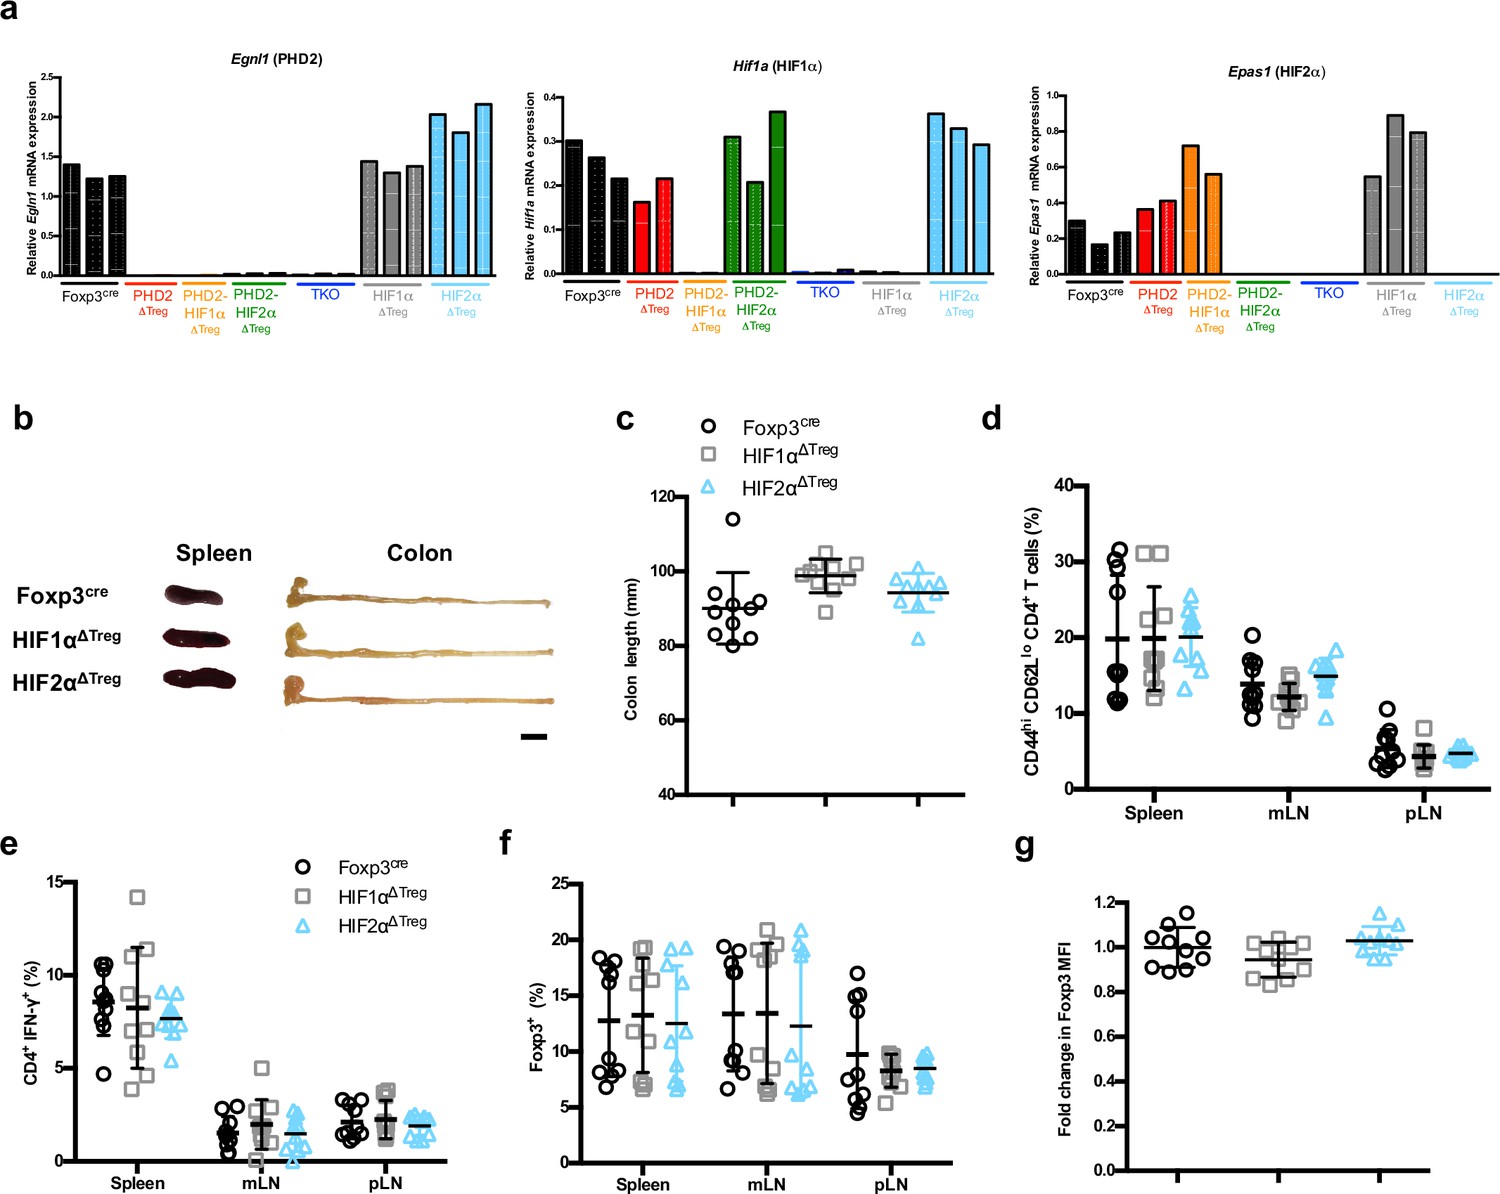
Treg-selective HIF1α or HIF2α deficiency does not affect immune homeostasis in naive mice.
(a) Splenic Treg cells were purified by cell sorting from Foxp3cre (n = 3), PHD2ΔTreg (n = 2), PHD2-HIF1αΔTreg (n = 2), PHD2-HIF2αΔTreg (n = 3), PHD2-HIF1α-HIF2αΔTreg (TKO) (n = 3), HIF1αΔTreg (n = 3), and HIF2αΔTreg (n = 3) male mice and their genotype verified by qPCR on the extracted total RNA fraction. (b) Representative gross autopsy findings revealing normal spleen and colon size (summarized in panel c) in 12-week-old male and female mice. (d) Frequency of CD4+ Foxp3- CD44hi CD62Llo cells in lymphoid organs. (e) Frequency of CD4+ lymphocytes producing IFN-γ upon in vitro stimulation. (f) Frequency of Foxp3+ cells in the indicated lymphoid organs. (g) Ratio of the Foxp3 MFI of HIF1αKO or HIF2αKO splenic Tregs to Foxp3cre splenic Tregs. Data are representative of three independent experiments with n = 10. Values are presented as the mean ± SD and were compared by one-way ANOVA with Tukey’s multiple comparisons test (c, g) or two-way ANOVA with Tukey’s multiple comparisons test (d–f). No statistical differences were found between groups.
-
Figure 6—figure supplement 1—source data 1
Treg-selective HIF1α or HIF2α deficiency does not affect immune homeostasis in naive mice.
- https://cdn.elifesciences.org/articles/70555/elife-70555-fig6-figsupp1-data1-v2.xlsx
Figure 7 with 1 supplement
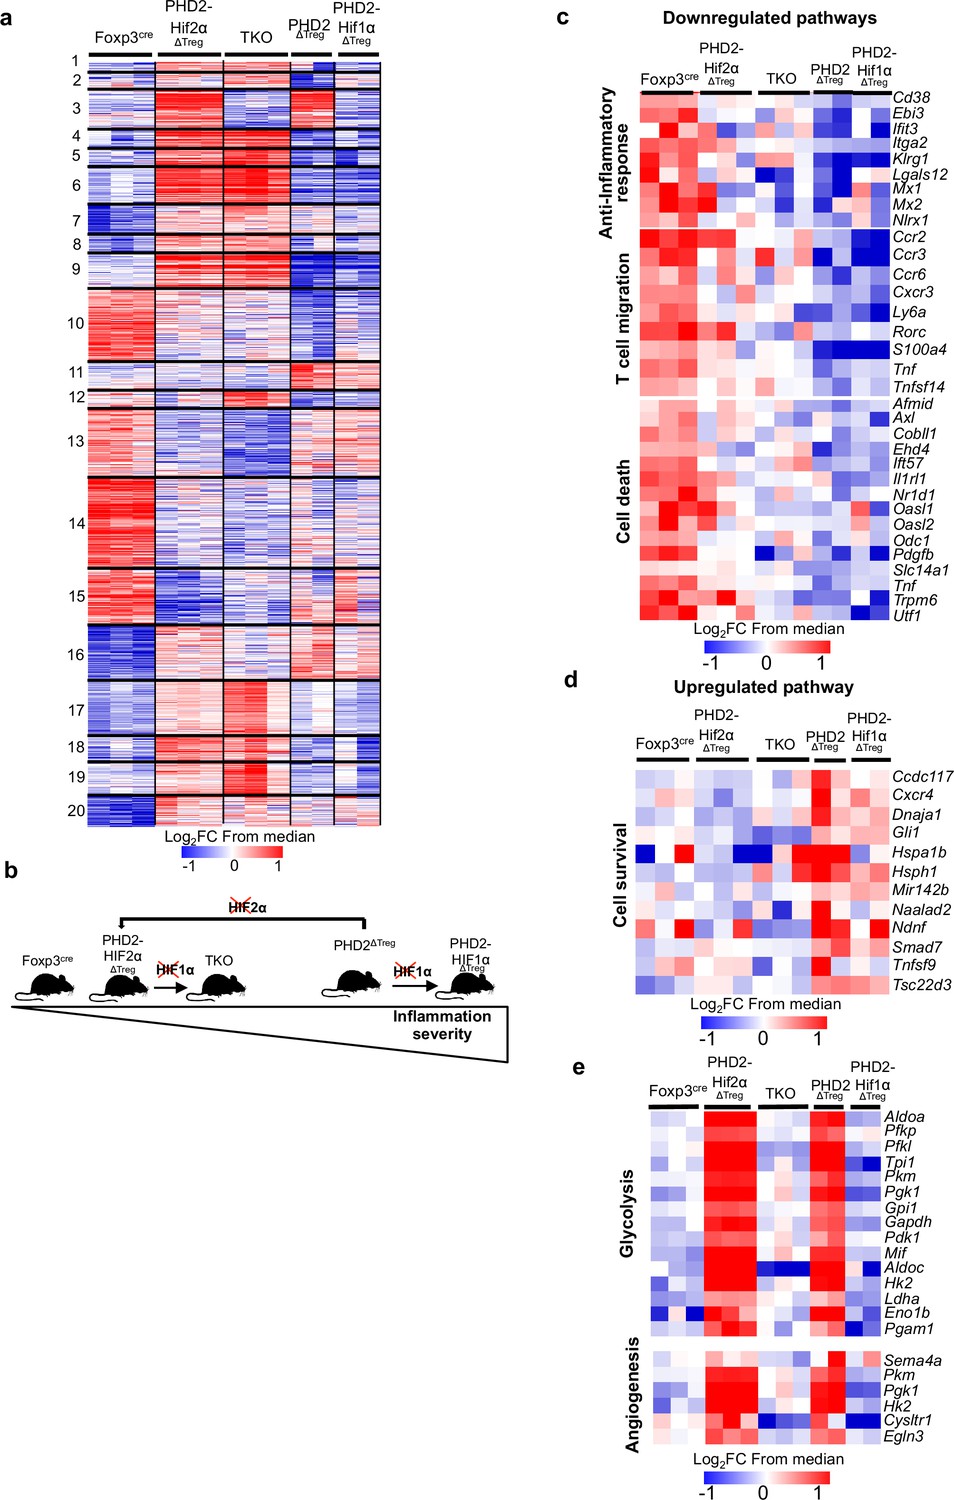
Anti-inflammatory response, response to chemokines, and cell survival pathways represent targets of the PHD2-HIF2α axis in Tregs.
Splenic Treg cells were purified by cell sorting from Foxp3cre (n = 3), PHD2ΔTreg (n = 2), PHD2-HIF1αΔTreg (n = 2), PHD2-HIF2αΔTreg (n = 3), and PHD2-HIF1α-HIF2αΔTreg (TKO) (n = 3) male mice, and total RNA was extracted and sequenced by RNA-sequencing (Illumina). (a) Heatmap of genes differentially expressed. Values are represented as log2 fold change (FC) obtained from median of each gene and are plotted in red-blue color scale with red indicating increased expression and blue indicating decreased expression. Hierarchical clustering of genes (k-means clustering) shows 20 clusters. (b) Classification of mouse strains according to their spontaneous inflammation severity. (c) Heatmap of genes downregulated when PHD2 and PHD2-HIF1α are deleted and whose expression is restored to a control level (close to Foxp3cre Treg) following deletion of HIF2α (cluster 10, 181 genes). (d) Heatmap of genes upregulated when PHD2 and PHD2-HIF1α are deleted and whose expression is restored to a control level following deletion of HIF2α (cluster 11, 66 genes). (e) Heatmap of genes upregulated when PHD2 and PHD2-HIF2α are deleted and whose expression is restored to a control level following deletion of HIF1α (cluster 3, 98 genes). Cluster 3, 10, and 11 were subjected to functional annotations and regulatory network analysis in the Ingenuity Pathway Analysis (IPA) software. Data were analyzed using DESeq2, a gene is differentially expressed when log2FC > 0.5 and false discovery rate (FDR) < 0.05.
-
Figure 7—source data 1
Anti-inflammatory response, response to chemokines, and cell survival pathways represent targets of the PHD2-HIF2α axis in Tregs.
- https://cdn.elifesciences.org/articles/70555/elife-70555-fig7-data1-v2.xlsx
Figure 7—figure supplement 1
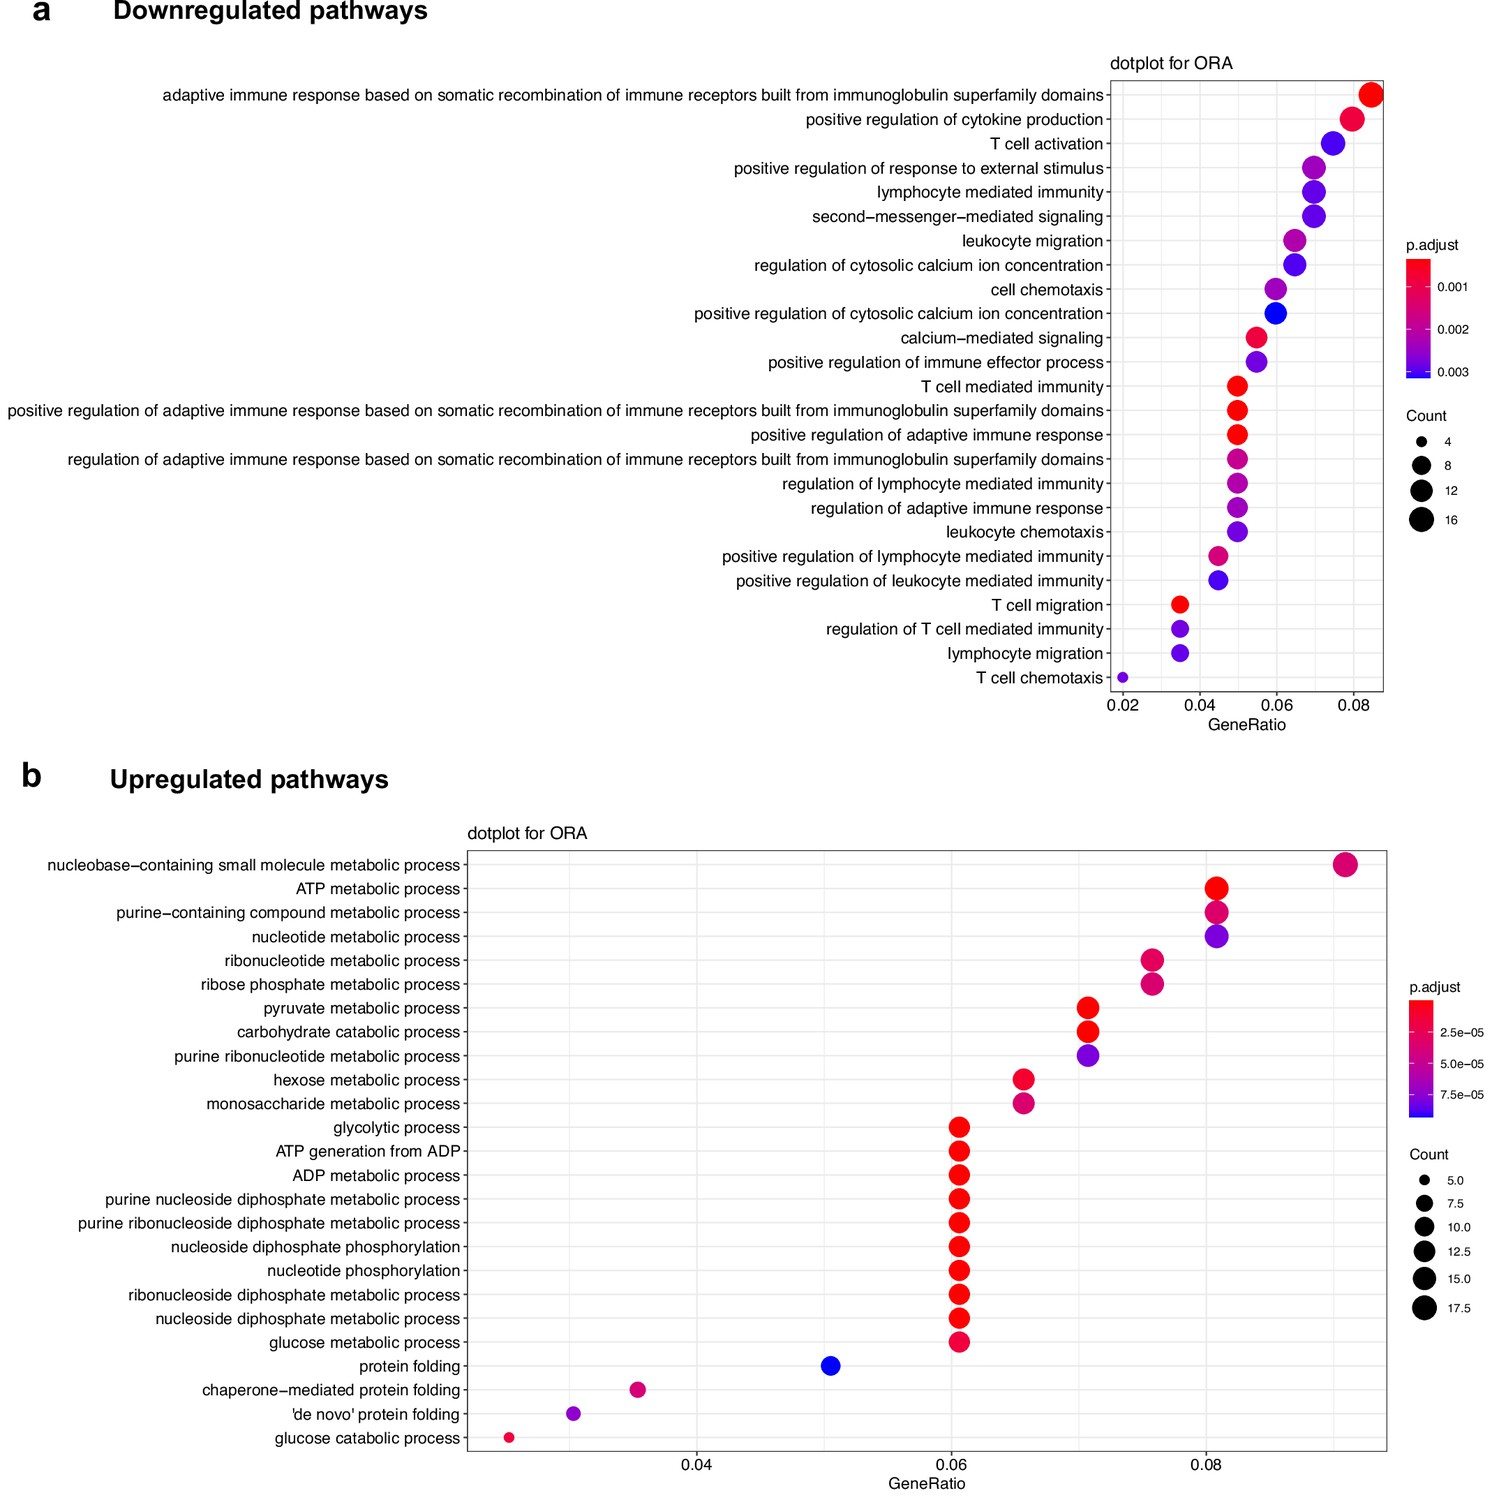
Signaling pathways affected by loss of PHD2 expression in Treg.
(a) Top: significantly downregulated pathways in PHD2-deficient Tregs compared to Tregs from Foxp3cre mice. (b) Top: significantly upregulated pathways in PHD2-deficient Tregs compared to Tregs from Foxp3cre mice. Affected pathways were determined by over-representation analysis (ORA analysis) in R program after DESeq2 analysis. Dot color and size represent respectively false discovery rate (FDR) and the number of genes affected in a given pathway.
-
Figure 7—figure supplement 1—source data 1
Signaling pathways affected by loss of PHD2 expression in Treg.
- https://cdn.elifesciences.org/articles/70555/elife-70555-fig7-figsupp1-data1-v2.xlsx
Figure 8 with 1 supplement
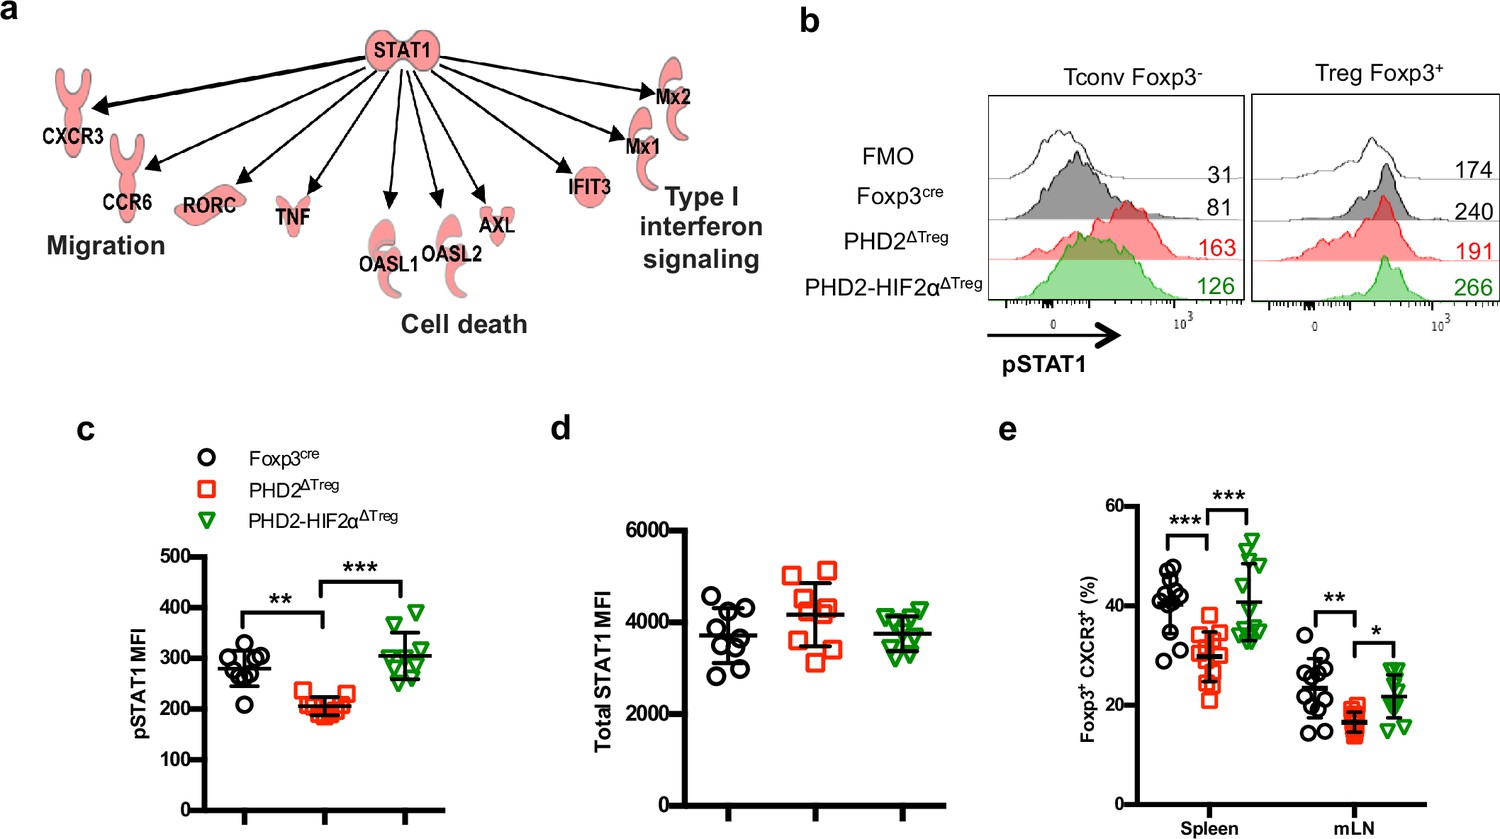
Identification of STAT1-mediated signaling as a target of the PHD2-HIF2α axis in Tregs.
(a) Upregulated and downregulated genes (clusters 10 and 11 in Figure 6c and d) were imported into the Ingenuity Pathway Analysis (IPA) software and were subjected to Upstream Regulator Analysis (URA) prediction algorithms. STAT1 was predicted as an upstream regulator of downregulated genes with a p-value=3 × 10–12. Phosphorylated form of STAT1 (pSTAT1 [Tyr701]) was assessed by flow cytometry after brief in vitro stimulation (30 min) of splenic CD4+ T lymphocytes with recombinant IFN-γ. (b) Representative histogram of pSTAT1 MFI for conventional CD4+ T cells (Tconv) and Treg cells of Foxp3cre, PHD2ΔTreg, and PHD2-HIF2αΔTreg male mice. Mean value expression (represented by MFI) of (c) pSTAT1 or (d) STAT1 total protein by splenic Treg of Foxp3cre, PHD2ΔTreg, and PHD2-HIF2αΔTreg mice. (e) Frequency of Treg cells expressing the CXCR3 receptor. Data are representative of three independent experiments with n = 9 (b–d) or n = 12 (e) per groups. Values are presented as the mean ± SD and were compared by one-way ANOVA with Tukey’s multiple comparisons. Only significant differences are indicated as follows: **p<0.01, ***p<0.001.
-
Figure 8—source data 1
Identification of STAT1-mediated signaling as a target of the PHD2-HIF2α axis in Tregs.
- https://cdn.elifesciences.org/articles/70555/elife-70555-fig8-data1-v2.xlsx
Figure 8—figure supplement 1
Gating strategy for identification of YFP+ cells.
Representative flow cytometry dot plots displaying the gating strategy for the identification of YFP-positive populations in the (a) spleen, (b) mesenteric lymph node (mLN), (c) thymus, and (d) liver. Although the majority of YFP-expressing cells also expressed Foxp3, a minor population (from 1% to 3% depending on the organ considered) of YFP cells lacked expression of both CD45 and Foxp3, suggesting a possible expression of the Cre-recombinase in nonhematopoietic cells in PHD2ΔTreg mice.
Tables
Key resources table
| Reagent type (species) or resource | Designation | Source or reference | Identifiers | Additional information |
|---|---|---|---|---|
| Genetic reagent (Mus musculus) | C57BL/6 | Envigo | RRID:MGI:5658455 | Horst, The Netherlands |
| Genetic reagent (M. musculus) | Egln1f/f | The Jackson Laboratory | RRID:IMSR_NM-CKO-2100497 | P. Carmeliet (VIB-KULeuven) |
| Genetic reagent (M. musculus) | Foxp3-Cre-YFP | PMID:18387831 | RRID:IMSR_JAX:016959 | A. Liston (KULeuven) |
| Genetic reagent (M. musculus) | Hif1af/f (Hif1atm3Rsjo/J) | The Jackson Laboratory | RRID:IMSR_JAX:007561 | F. Bureau (Liege University) |
| Genetic reagent (M. musculus) | Epasf/f (Epas1tm1Mcs/J) | The Jackson Laboratory | RRID:IMSR_JAX:008407 | J.A. Lopez (Madrid University) |
| Genetic reagent (M. musculus) | Ifng-/- | The Jackson Laboratory | RRID:IMSR_CARD:178 | Bar Harbor, ME |
| Genetic reagent (M. musculus) | CD45.1 (B6.SJL-Ptprca Pepcb/BoyJ) | The Jackson Laboratory | RRID:IMSR_JAX:002014 | Bar Harbor, ME |
| Genetic reagent (M. musculus) | Rag2-/- | The Jackson Laboratory | RRID:IMSR_JAX:008449 | Bar Harbor, ME |
| Antibody | Anti-mouse CD278 (Icos)-biotin (C398.4A, mouse monoclonal) | eBioscience | 13-9949-82 | (1:100) |
| Antibody | Anti-mouse CD27-PeCy7 (LG.7F9, mouse monoclonal) | eBioscience | 25-0271-82 | (1:250) |
| Antibody | Anti-mouse Foxp3-FITC (FJK-16s, mouse monoclonal) | eBioscience | 71-5775-40 | (1:100) |
| Antibody | Anti-mouse RORγt-PE (B2D, mouse monoclonal) | eBioscience | 12-6981-82 | (1:100) |
| Antibody | Anti-mouse T-bet-PE (4B10, mouse monoclonal) | eBioscience | 12-5825-82 | (1:100) |
| Antibody | Anti-mouse PD1-PECF594 (J43, mouse monoclonal) | BD Biosciences | 562523;RRID:AB_2737634 | (1:100) |
| Antibody | Anti-mouse CXCR3-APC (CXCR3-173, mouse monoclonal) | BD Biosciences | 562266;RRID:AB_11153500 | (3:500) |
| Antibody | Anti-mouse CD24-PECF594 (M1/69, mouse monoclonal) | BD Biosciences | 562477;RRID:AB_11151917 | (1:100) |
| Antibody | Anti-mouse CD25-BB515 (PC61, mouse monoclonal) | BD Biosciences | 564424;RRID:AB_2738803 | (1:100) |
| Antibody | Anti-mouse CD44-PECy7 (IM7, mouse monoclonal) | BD Biosciences | 560569;RRID:AB_1727484 | (1:100) |
| Antibody | Anti-mouse CD4-A700 (RM4-5, mouse monoclonal) | BD Biosciences | 557956;RRID:AB_396956 | (3:500) |
| Antibody | Anti-mouse CD8-A700 (53-6.7, mouse monoclonal) | BD Biosciences | 557959;RRID:AB_396959 | (3:500) |
| Antibody | Anti-mouse CD4-PB (RM4-5, mouse monoclonal) | BD Biosciences | 558107;RRID:AB_397030 | (1:100) |
| Antibody | Anti-mouse CD62L-A700 (MEL-14, mouse monoclonal) | BD Biosciences | 560517;RRID:AB_1645210 | (1:100) |
| Antibody | Anti-mouse GATA3-PE (L50-823, mouse monoclonal) | BD Biosciences | 560074;RRID:AB_1645330 | (1:10) |
| Antibody | Anti-mouse RORγt-PECF594 (Q31-378, mouse monoclonal) | BD Biosciences | 562684;RRID:AB_2651150 | (1:200) |
| Antibody | Anti-mouse STAT1 (pY701)-A488(4a, mouse monoclonal) | BD Biosciences | 612596;RRID:AB_399879 | (1:10) |
| Antibody | Anti-mouse IFNγ-PE (XMG1.2, mouse monoclonal) | BD Biosciences | 554412;RRID:AB_395376 | (1:100) |
| Antibody | Anti-mouse IL-10-APC (JES5-16E3, mouse monoclonal) | BD Biosciences | 554468;RRID:AB_398558 | (1:100) |
| Antibody | Anti-mouse IL-17-PerCP-Cy5.5 (N49-653, mouse monoclonal) | BD Biosciences | 560799;RRID:AB_2033981 | (1:100) |
| Antibody | Anti-CD3 antibody (2c11, mouse monoclonal) | BioXCell | 145-2c11 | 20 μg/mouse |
| peptide, recombinant protein | Streptavidin-PECy7. | BD Biosciences | 557598;RRID:AB_10049577 | (1:100) |
| peptide, recombinant protein | IFN-γ protein | PeproTech | 315-05 | 50 ng/ml |
| Chemical compound, drug | Evans blue | Sigma | 314-13-6 | 0.5% |
| Chemical compound, drug | Brefeldin-A | eBioscience | 00-4506-51 | (1:1000) |
| Chemical compound, drug | Dextran sodium sulfate, colitis grade (36,000–50,000 Da) | MP Biomedical | 160110 | 2% |
| Commercial assay or kit | LIVE/DEAD kit | Invitrogen | L10119 | (1:1000) |
| Commercial assay or kit | Anti-CD90.2 beads MACS | Miltenyi | 130-121-278 | (1:5) |
| Commercial assay or kit | Anti-CD4 beads MACS | Miltenyi | 130-117-043 | (1:3) |
| Sequence-based reagent | Egln1 (PHD2)_F | This paper | PCR primers | AGGCTATGTCCGTCACGTTG |
| Sequence-based reagent | Egln1 (PHD2)_R | This paper | PCR primers | TACCTCCACTTACCTTGGCG |
| Sequence-based reagent | Egln2 (PHD1)_F | This paper | PCR primers | TCACGTGGACGCAGTAATCC |
| Sequence-based reagent | Egln2 (PHD1)_R | This paper | PCR primers | CGCCATGCACCTTAACATCC |
| Sequence-based reagent | Egln3 (PHD3)_F | This paper | PCR primers | AGGCAATGGTGGCTTGCTAT |
| Sequence-based reagent | Egln3 (PHD3)_R | This paper | PCR primers | GACCCCTCCGTGTAACTTGG |
| Sequence-based reagent | Hif1a_F | This paper | PCR primers | CATCAGTTGCCACTTCCCCA |
| Sequence-based reagent | Hif1a_R | This paper | PCR primers | GGCATCCAGAAGTTTTCTCACAC |
| Sequence-based reagent | Epas1 (HIF2a)_F | This paper | PCR primers | ACGGAGGTCTTCTATGAGTTGGC |
| Sequence-based reagent | Epas1 (HIF2a)_R | This paper | PCR primers | GTTATCCATTTGCTGGTCGGC |
| Sequence-based reagent | Ifng_F | This paper | PCR primers | TGCCAAGTTTGAGGTCAACA |
| Sequence-based reagent | Ifng_R | This paper | PCR primers | GAATCAGCAGCGACTCCTTT |
| Sequence-based reagent | Il12a_F | This paper | PCR primers | CCTCAGTTTGGCCAGGGTC |
| Sequence-based reagent | Il12a_R | This paper | PCR primers | CAGGTTTCGGGACTGGCTAAG |
| Sequence-based reagent | Il10_F | This paper | PCR primers | CCTGGGTGAGAAGCTGAAGA |
| Sequence-based reagent | Il10_R | This paper | PCR primers | GCTCCACTGCCTTGCTCTTA |
| Sequence-based reagent | Il17a_F | This paper | PCR primers | ATCCCTCAAAGCTCAGCGTGTC |
| Sequence-based reagent | Il17a_R | This paper | PCR primers | GGGTCTTCATTGCGGTGGAGAG |
| Sequence-based reagent | Il1b_F | This paper | PCR primers | CAAGCTTCCTTGTGCAAGTG |
| Sequence-based reagent | Il1b_R | This paper | PCR primers | AGGTGGCATTTCACAGTTGA |
| Sequence-based reagent | Il4_F | This paper | PCR primers | ATGCACGGAGATGGATGTG |
| Sequence-based reagent | Il4_R | This paper | PCR primers | AATATGCGAAGCACCTTGGA |
| Sequence-based reagent | Il6_F | This paper | PCR primers | GTTCTCTGGGAAATCGTGGA |
| Sequence-based reagent | Il6_R | This paper | PCR primers | GCAAGTGCATCATCGTTGTT |
| Sequence-based reagent | Rpl32_F | This paper | PCR primers | ACATCGGTTATGGGAGCAAC |
| Sequence-based reagent | Rpl32_R | This paper | PCR primers | TCCAGCTCCTTGACATTGT |
| Sequence-based reagent | Tnfa_F | This paper | PCR primers | GCCTCCCTCTCATCAGTTCTA |
| Sequence-based reagent | Tnfa_R | This paper | PCR primers | GCTACGACGTGGGCTACAG |
| Sequence-based reagent | Il12b_F | This paper | PCR primers | ATGTGTCCTCAGAAGCTAACC |
| Sequence-based reagent | Il12b_R | This paper | PCR primers | CTAGGATCGGACCCTGCAGGGAAC |
| Software, algorithm | Prism 6 | GraphPad | RRID:SCR_002798 | Version 6.0 |
Additional files
Download links
A two-part list of links to download the article, or parts of the article, in various formats.
Downloads (link to download the article as PDF)
Open citations (links to open the citations from this article in various online reference manager services)
Cite this article (links to download the citations from this article in formats compatible with various reference manager tools)
The oxygen sensor prolyl hydroxylase domain 2 regulates the in vivo suppressive capacity of regulatory T cells
eLife 11:e70555.
https://doi.org/10.7554/eLife.70555


