PARROT is a flexible recurrent neural network framework for analysis of large protein datasets
- Department of Biochemistry and Molecular Biophysics, Washington University School of Medicine, United States
- Center for Science and Engineering Living Systems, Washington University, United States
Figures
Figure 1
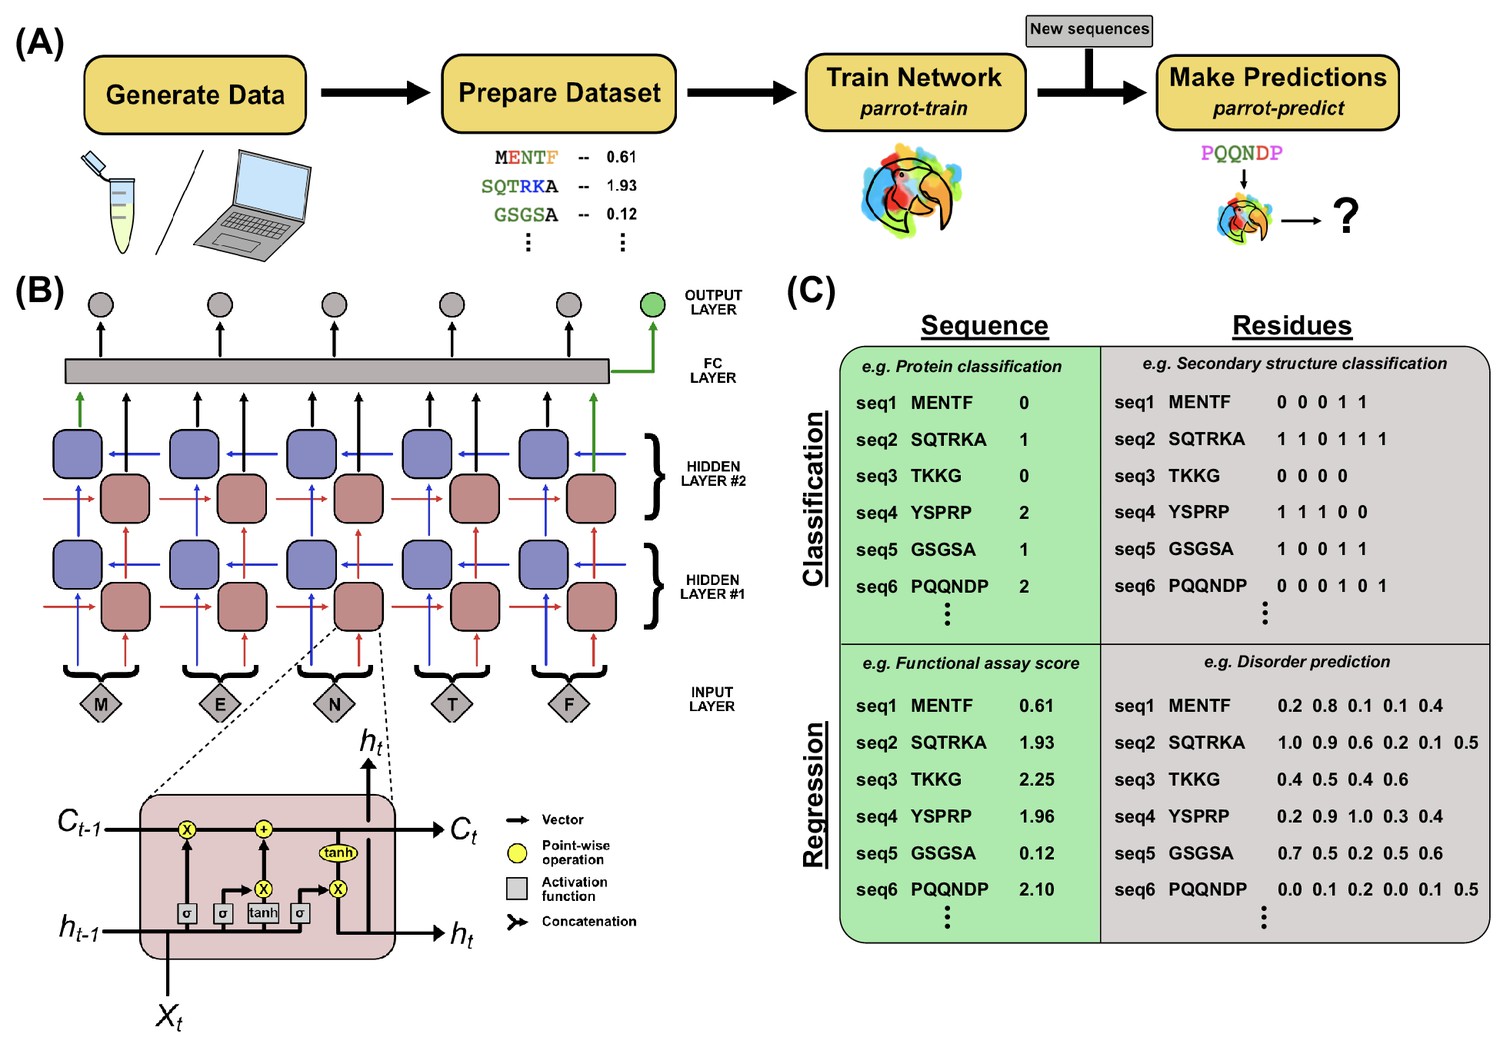
PARROT overview.
(A) A standard workflow that incorporates PARROT. Quantitative protein data is either obtained computationally or generated through experiment, then formatted such that each protein sequence or residue is linked to a particular value. PARROT allows users to train a predictor on this dataset. The trained network can then be applied on new sequences to make predictions. (B) The internal architecture of PARROT is a bidirectional long short-term memory (LSTM) network. (Top) Series of cells propagate information along the length of a protein sequence in both N-to-C and C-to-N directions and the final output is integrated from the deepest layers in each direction. (Bottom) A diagram of the LSTM cells used in PARROT. (C) Example data formats for the four kinds of machine learning problems PARROT can carry out on proteins: classification or regression tasks using per-sequence or per-residue output.
Figure 2
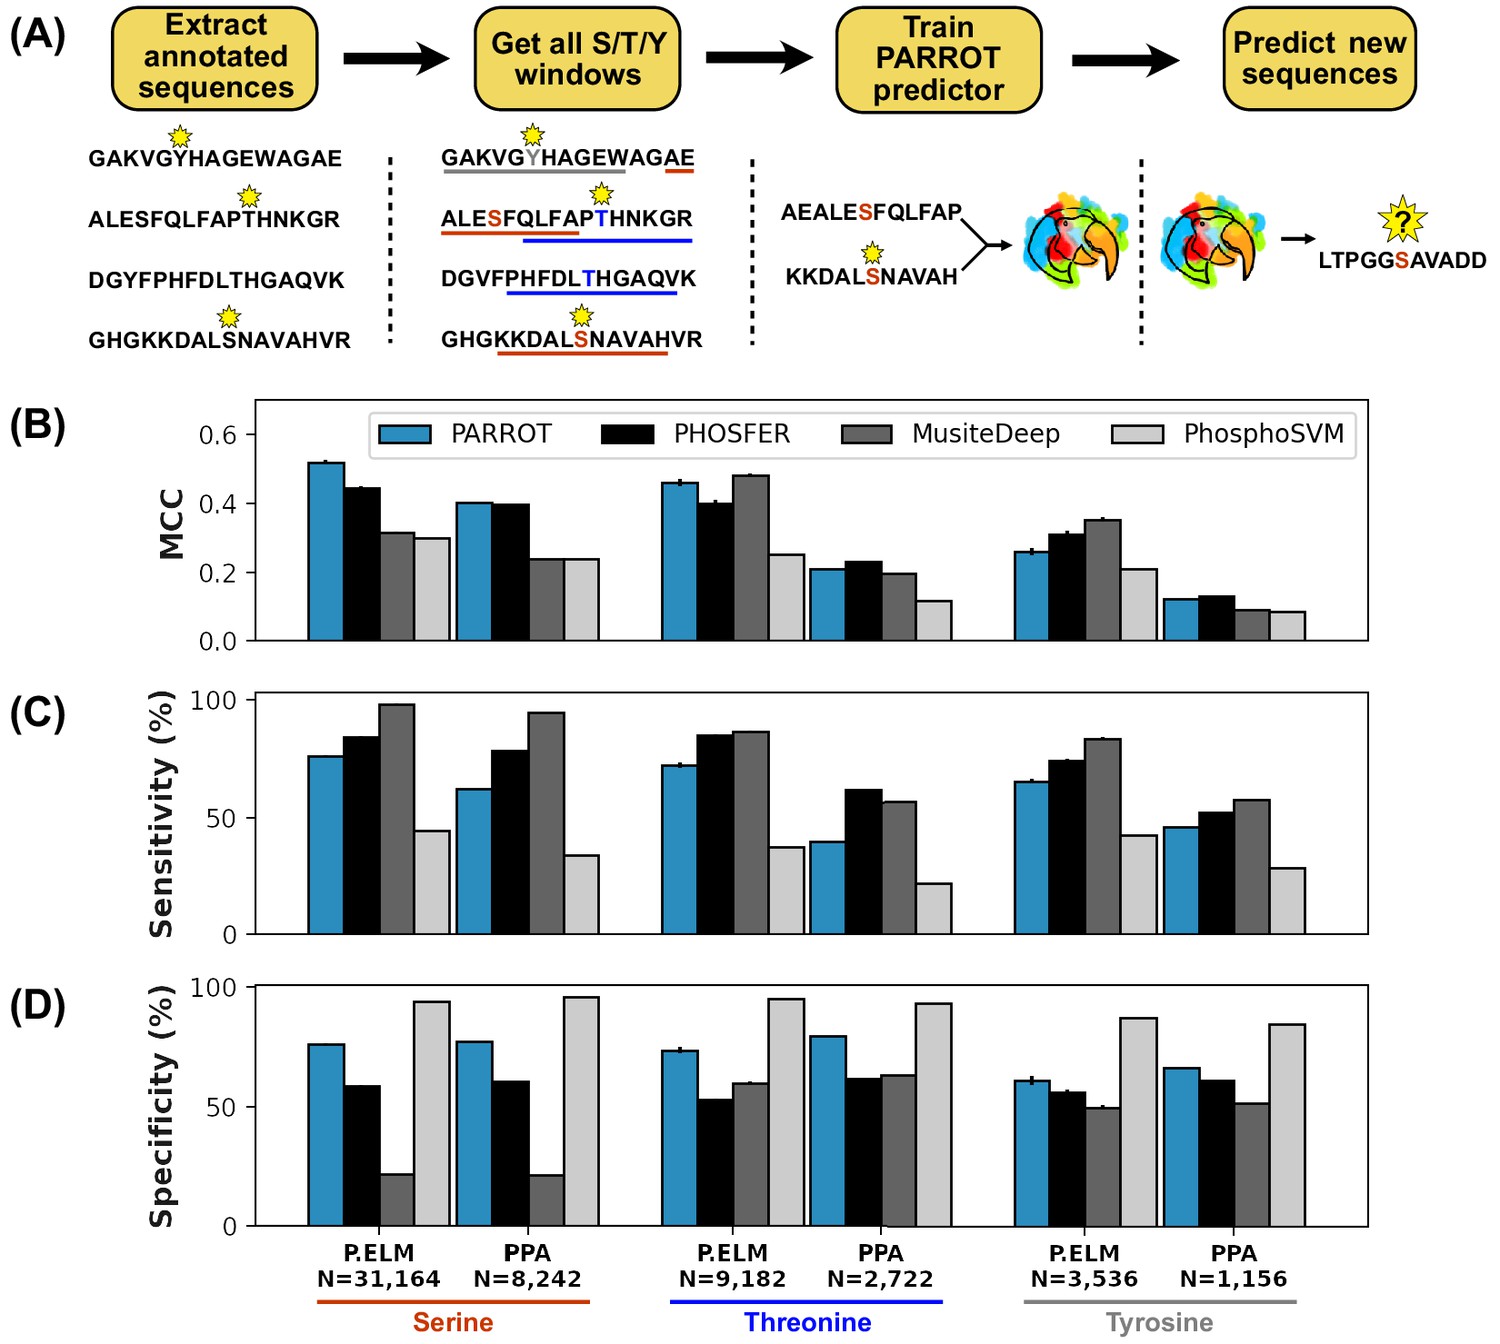
PARROT’s performance on a phosphosite prediction task.
(A) Workflow for training PARROT networks for phosphosite prediction. Full-length, annotated sequences from the Phospho.ELM (P.ELM) dataset were split into phospho-positive and phospho-negative 19aa windows (11aa windows used in figure for clarity). PARROT predictors trained on these sequence windows and were used to make predictions on held out sequences and the PhosPhAt (PPA) dataset. (B) Matthew’s correlation coefficient (MCC), (C) sensitivity (D), and specificity scores for the PARROT predictors and three external predictors on the task of phosphosite prediction on the P.ELM and PPA datasets.
Figure 3 with 2 supplements
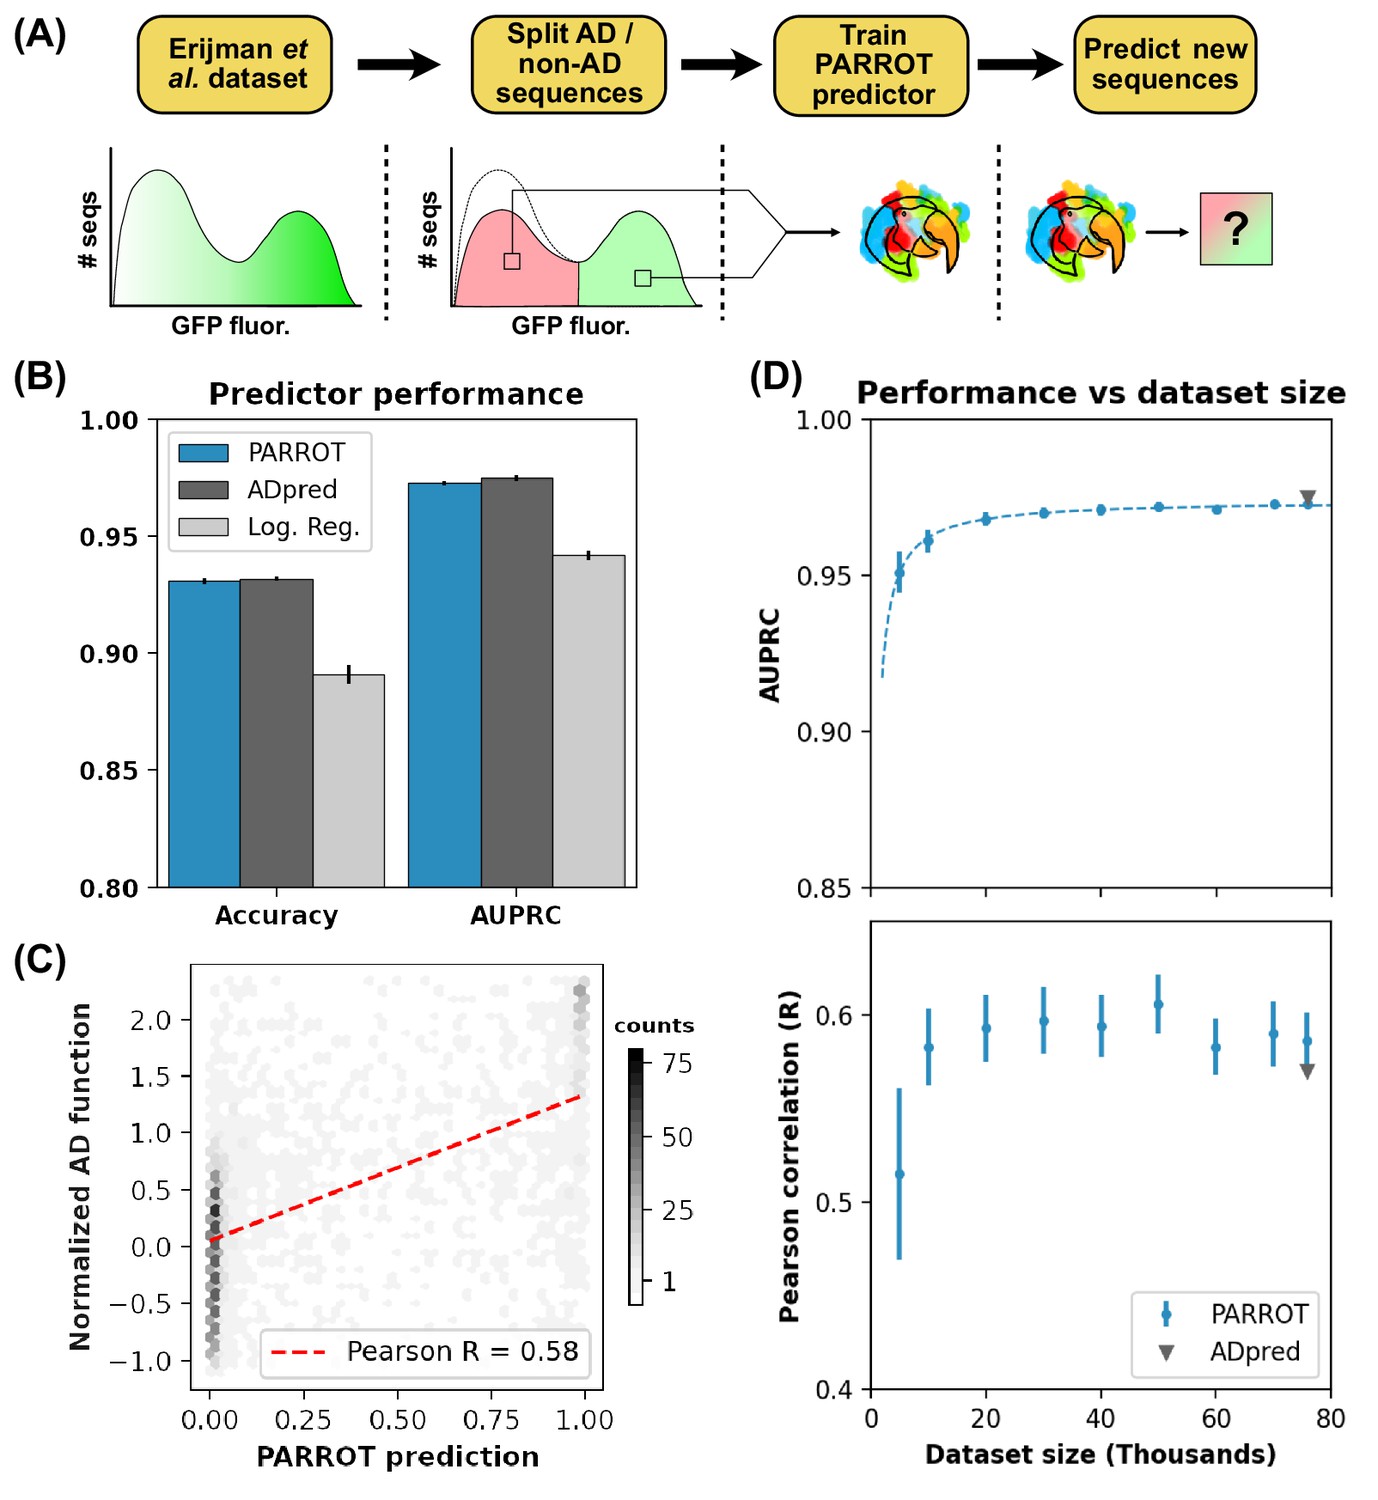
PARROT predicts functional yeast activation domains.
(A) Diagram of activation domain workflow. A PARROT network was trained on the yeast fluorescence activation assay data from Erijman et al. and used to make predictions on new protein sequences. (B) PARROT’s 10-fold cross-validation accuracy and area under the precision-recall curve (AUPRC) on the Erijman et al. dataset compared to the reported scores for two approaches employed in that paper: ADpred and a logistic regression based method. (C) Representative example of the correlation between PARROT’s predictions and the true activation scores of an independent yeast activation domain dataset. (D) PARROT’s performance on the tasks in (B) (top) and (C) (bottom) as a function of dataset size. For each specified dataset size, the actual number of sequences used for training and validation was 90% of the indicated value since networks were trained using 10-fold cross-validation. The dashed line is a hyperbola best-fit line. The reported performance of ADpred is shown for reference in gray.
Figure 3—figure supplement 1
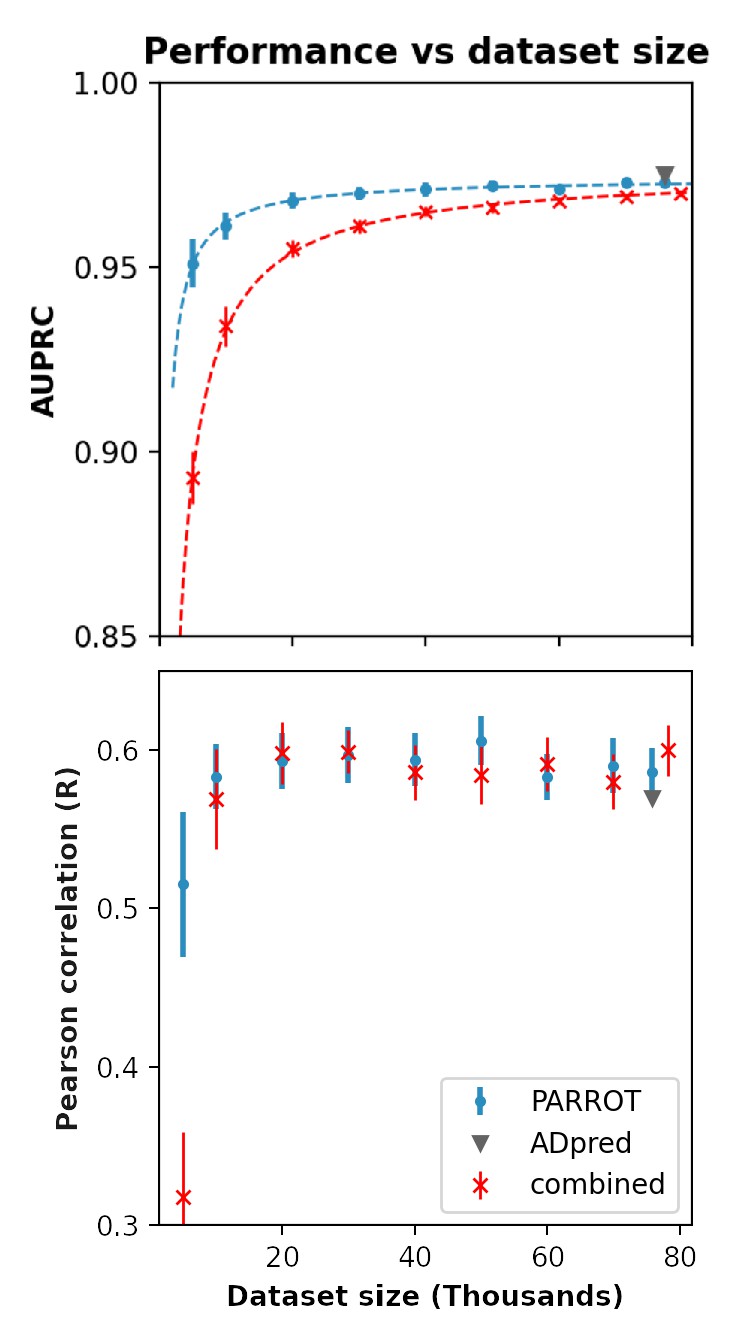
Performance of PARROT networks trained on a multi-study dataset on the activation domain prediction task.
Red indicates PARROT networks trained on the combined datasets of Erijman et al. and Ravarani et al. Blue and gray markers are identical to Figure 3D in the main text and are included for comparison.
Figure 3—figure supplement 2
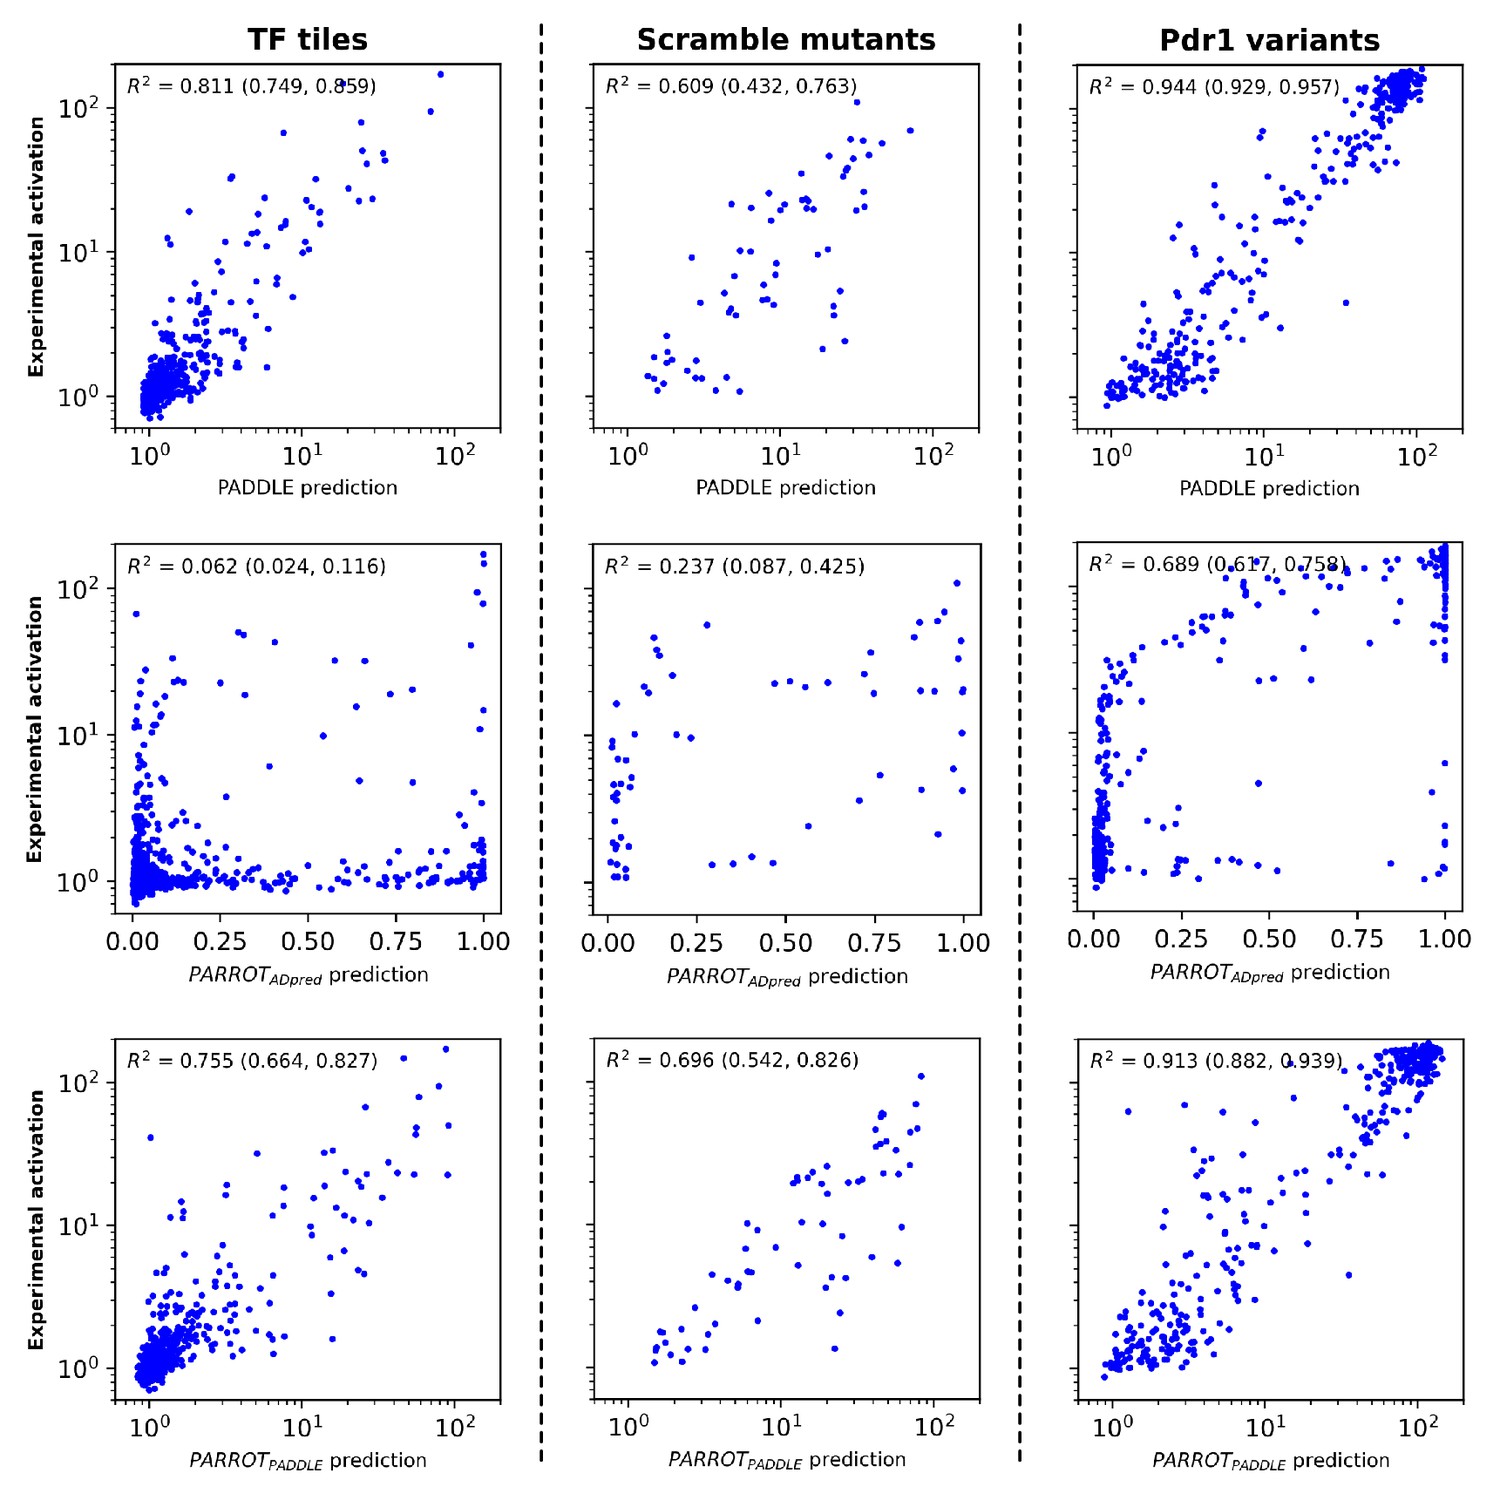
Analysis of PARROT networks on the test set data of Sanborn et al.
(Top row) Comparison of PADDLE’s predictions to the experimental values on three subsets of the sequences in the test set. PADDLE predictions and experimental values were obtained directly from Sanborn et al. and replotted in a manner similar to that study in order to facilitate side-by-side comparison. Refer to that published work for more information on the different subsets that compose the test set. (Middle row) Predictions made by a PARROT network trained on the Erijman et al. dataset. (Bottom row) Predictions made by a PARROT network trained on the Sanborn et al. training set. Denoted in parentheses are the 95% CI of the reported R2 value, determined using bootstrapping.
Figure 4 with 2 supplements

PARROT can ‘fill in the gaps’ of deep mutational scanning experiments.
(A) Depiction of the residue-wise cross-validation workflow for predicting fibril nucleation scores using the Aß42 deep mutational scanning (DMS) assay from Seuma et al. (B) Correlation between the true assay scores and predictions made by PARROT networks trained using residue-wise cross-validation for >14,000 single and double mutant variants. (C) Measurement of epistasis within the nucleation assay. (Left) Correlation between the nucleation scores of double mutants and the sum of nucleation scores of their composite single mutants. (Right) Correlation between the same double mutant nucleation scores and the predictions made by PARROT. (D) Receiver operator characteristic (ROC) curves for 12 familial Alzheimer’s disease (fAD) mutants versus all other single mutant variants in the dataset. Area under the curve (AUC) values are reported in the legend.
Figure 4—figure supplement 1
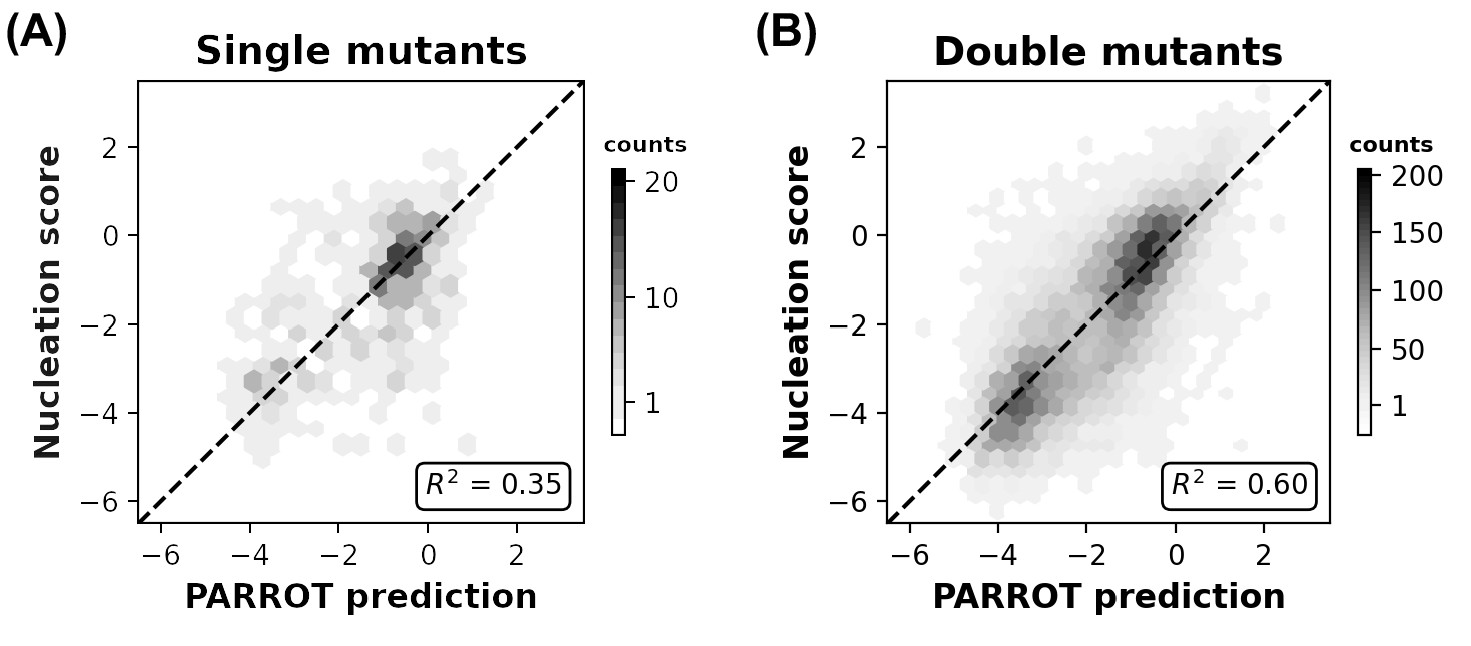
Related to Figure 4B, correlation between Aß42 nucleation scores and PARROT predictions divided into (A) single mutants and (B) double mutants.
Figure 4—figure supplement 2
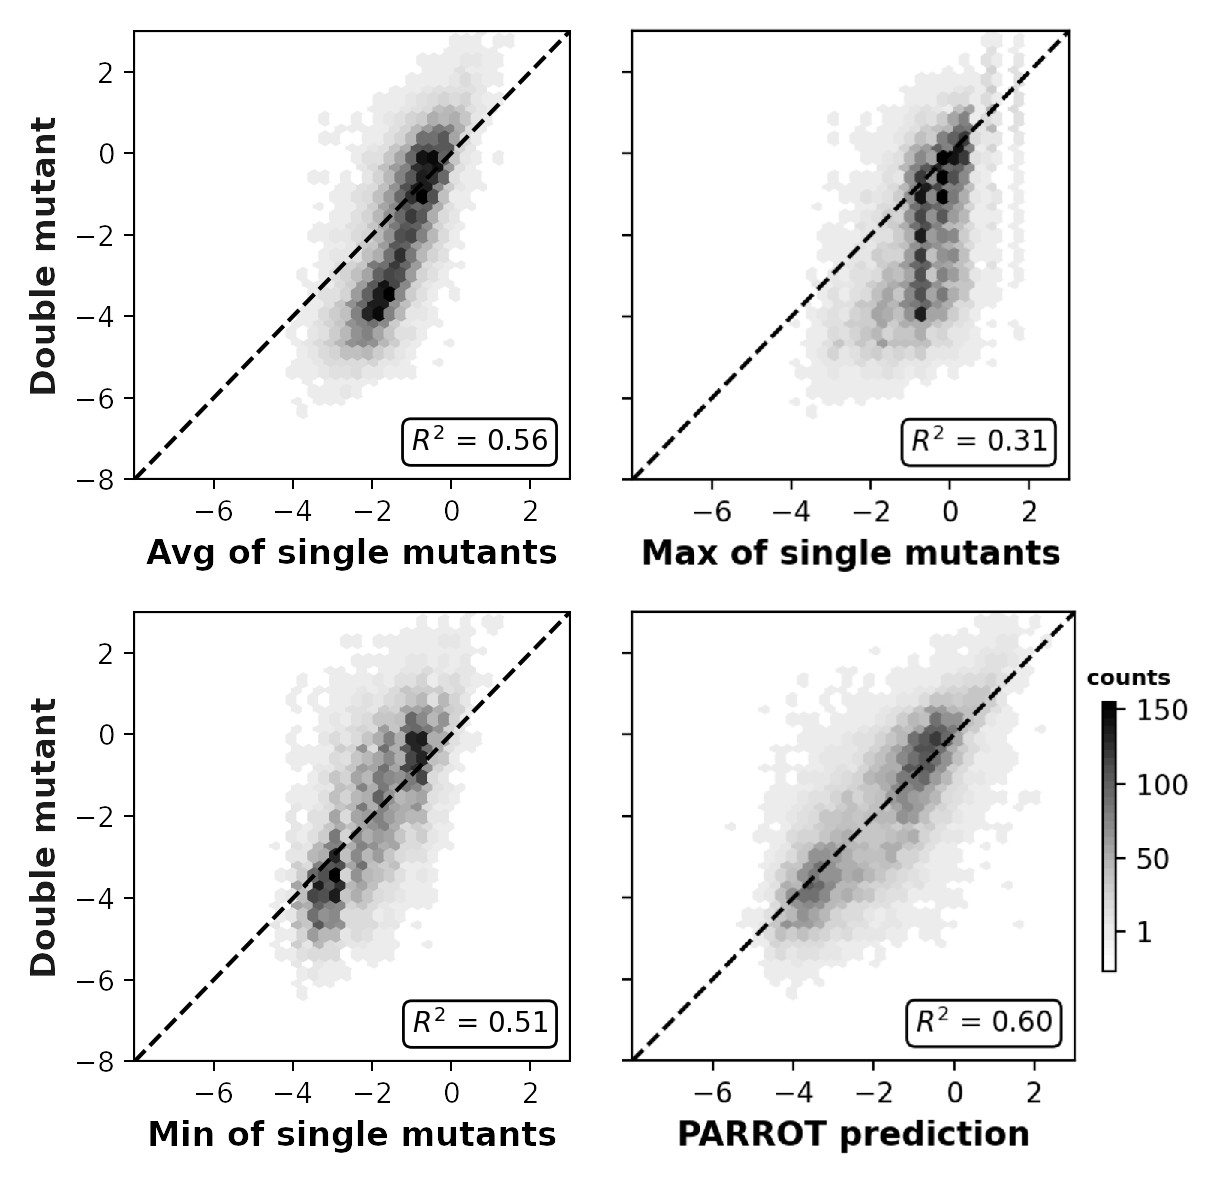
Related to Figure 4C, measured epistasis between Aß42 double mutant nucleation scores and the average (top), maximum (middle), and minimum (bottom) of their composite single mutant scores.
The PARROT predictions have significantly tighter correlation than any of the other methods (p<0.01).
Additional files
-
Supplementary file 1
Complete table of performance metrics for phosphosite predictions on the Phospho.ELM (P.ELM) dataset.
Standard error, whenever possible, is reported in parentheses.
- https://cdn.elifesciences.org/articles/70576/elife-70576-supp1-v1.docx
-
Supplementary file 2
Complete table of performance metrics for phosphosite predictions on the PhosPhAt (PPA) datasets.
Standard error, whenever possible, is reported in parentheses.
- https://cdn.elifesciences.org/articles/70576/elife-70576-supp2-v1.docx
-
Supplementary file 3
Average PARROT network training times on different sizes of datasets and with variable hyperparameters.
Datasets were created by assigning random values in [–5, 5] to randomly generated protein sequences ~25–35 residues in length. Networks were trained using a NVIDIA TU116 GPU. Three replicate PARROT networks were trained for each specified set of hyperparameters and dataset.
- https://cdn.elifesciences.org/articles/70576/elife-70576-supp3-v1.docx
-
Transparent reporting form
- https://cdn.elifesciences.org/articles/70576/elife-70576-transrepform1-v1.docx
Download links
A two-part list of links to download the article, or parts of the article, in various formats.
Downloads (link to download the article as PDF)
Open citations (links to open the citations from this article in various online reference manager services)
Cite this article (links to download the citations from this article in formats compatible with various reference manager tools)
PARROT is a flexible recurrent neural network framework for analysis of large protein datasets
eLife 10:e70576.
https://doi.org/10.7554/eLife.70576


