A dentate gyrus-CA3 inhibitory circuit promotes evolution of hippocampal-cortical ensembles during memory consolidation
- Center for Regenerative Medicine, Massachusetts General Hospital, United States
- Harvard Stem Cell Institute, United States
- Department of Psychiatry, Massachusetts General Hospital, Harvard Medical School, United States
- BROAD Institute of Harvard and MIT, United States
Figures
Figure 1
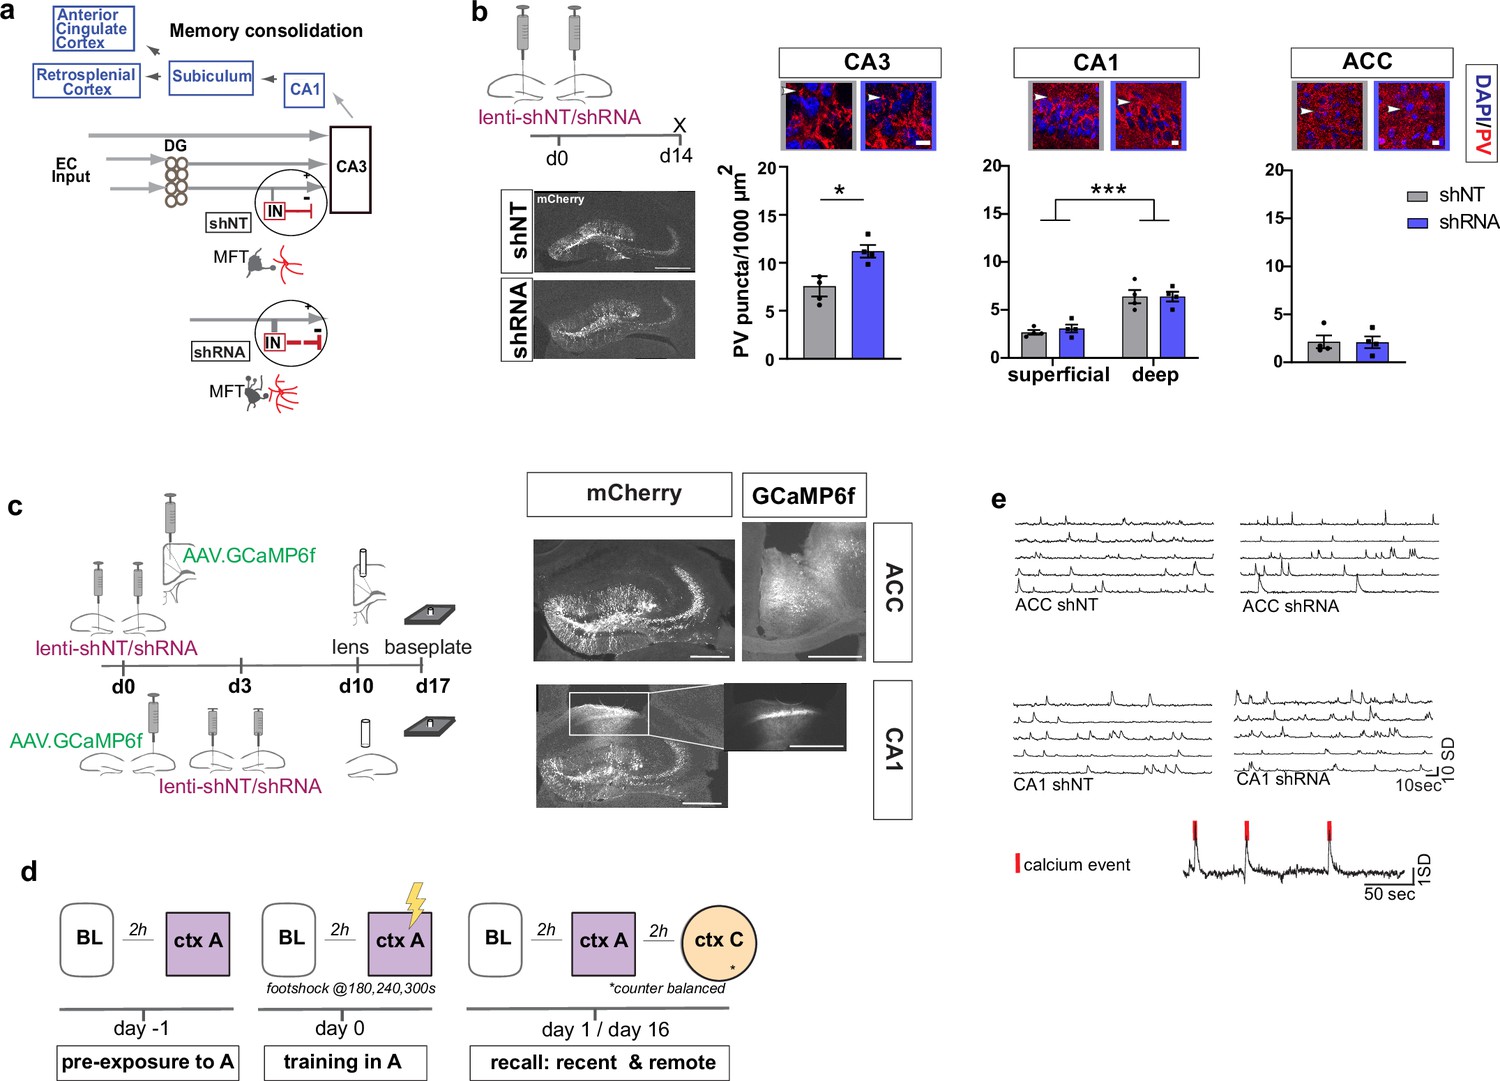
Anatomical characterization of PV IN contacts and in vivo calcium imaging platform for recording neural activity.
(a) Simplified wiring diagram of hippocampal-cortical circuits supporting memory consolidation. Highlighted is the DG-PV IN-CA3 inhibitory microcircuit. Dentate granule cell (DGC) projections (Mossy fibers, MF) synapse onto pyramidal neurons in CA3 and also release glutamate directly onto stratum lucidum PV-positive interneurons (PV INs, red) through filopodia that emanate from mossy fiber terminals (MFTs, gray). Injection of lenti-shRNA into dentate gyrus (DG) increased MFT filopodia onto PV INs. In response to increased DGC excitatory drive PV INs elaborate inhibitory synaptic contacts in CA3 and feed-forward inhibition onto CA3 neurons (feed-forward inhibition, FFI). Pyramidal neurons in CA3 project to CA1 that sends projections to multiple brain regions such as the anterior cingulate cortex (ACC). (b) Quantification and representative images of PV puncta (white arrows) in CA3 (left), the deeper and superficial layer of CA1 (middle) and ACC (right) per ROI (1000 μm2, scale bar: 10 µm) in behaviorally naïve mice 2 weeks post injection (left panel, scale bar: 500 µm). Images show representative examples of ROIs from shNT (left) and shRNA (right) injected mice. Arrows indicate PV puncta example. Bar graphs represent mean ± SEM. Scatter represent individual mice. Injection of lenti-shRNA significantly increased PV puncta in CA3 [Two-tailed Mann-Whitney: p = 0.029, n = 4] but not in CA1 [Two-way repeated measures ANOVA, layer x virus effect p = 0.583: virus main effect p = 0.752, layer main effect: p < 0.0001]; or ACC [Two-tailed Mann-Whitney test: p = 0.886, n = 4]. In CA1, a significant difference was found between layers. (c) Schematic workflow and example of virus injection and lens implantation for calcium imaging. Mice received unilateral injection of AAV1.CaMKII.GCaMP6f.WPRES.SV40 (GCaMP6f, left panel) in the region of interest and bilateral injection of lenti-shNT or lenti-shRNA virus (mCherry, right panel) in the hilus of dorsal DG. In CA1 implanted mice, the injections were separated by 3 days to allow for best targeting and expression. Scale bar: 500 µm. (d) Sketch of behavior paradigm. Prior to behavioral testing and calcium imaging, mice were handled and habituated to the microscope and baseline (BL) environment. Each recording day began with a BL recording followed by a test with at least 2 hr between each session. On days with multiple test sessions (recall), the order of context (context A or context C) was counterbalanced. BL = Baseline, ctx A = context A, ctx C = context C. (e) Example raw traces of changes is calcium extracted with CNMF-E. Each line represents one neuron in the field of view. The lower trace shows examples of calcium events (red line) extracted from a raw trace.
Figure 2 with 1 supplement

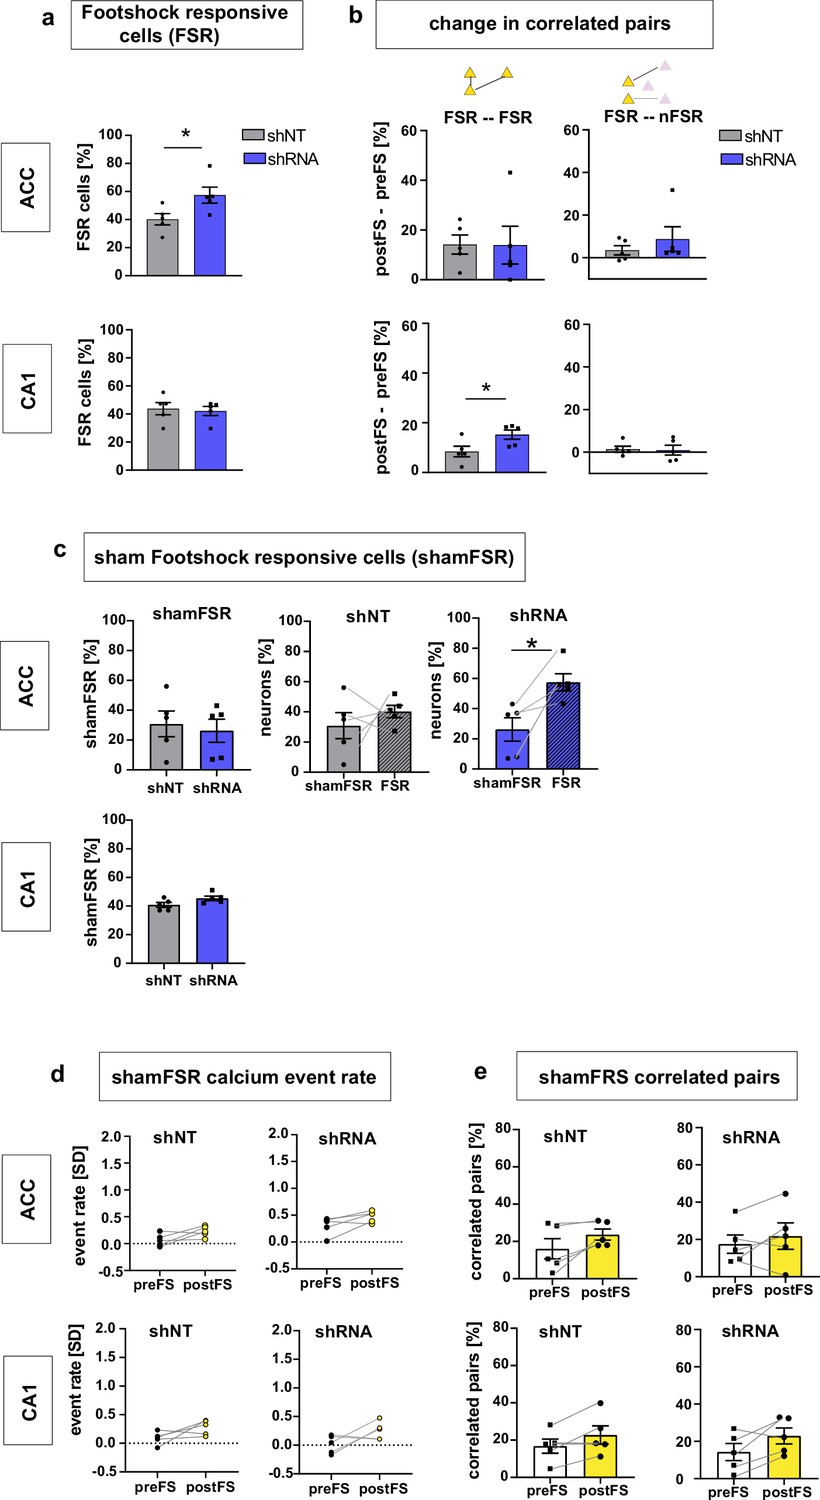
Increasing FFI promotes neuronal responses in CA1 and ACC during encoding of foot-shock.
(a) Schematic of time point in behavioral paradigm of the presented data (context A on training day with three foot-shocks (FS) applied at 180, 240, and 360 s). (b) schematic of analysis window for neuronal activity before FS (preFS) and after FS (postFS) presented in panels e, g and h. (c) Quantification of FS response behavior measured as freezing in percentage of one minute time bins. All experimental groups showed a similar increase in freezing upon the FS training in context A with no main treatment effect [upper panel, ACC: Two-way repeated measures ANOVA, time x treatment effect p = 0.702: time main effect p < 0.0001, treatment main effect = 0.796, n = 5; lower panel CA1: time x treatment effect p = 0.838, time main effect p < 0.0001, treatment main effect = 0.49, n = 5 shNT, n = 6 shRNA]. (d) Example heatmap of z-scored neuronal activity (calcium events) in CA1 (shNT) across time in context A grouped by neuronal activity (foot-shock responsive, FSR; non-foot-shock responsive, nFSR). Colorbar represents SD (z-scored to first 180 s of the recording). (e) Neuronal activity of FSR neurons increased significantly after the FS was applied in all experimental groups. Neuronal activity was z-scored (over the first 180 s in context A) and averaged over the three foot-shocks using a 30 s window as preFS or postFS condition (see sketch in panel b) [Two-tailed paired t-test, ACC shNT preFS vs postFS: p = 0.004 (upper left); ACC shRNA preFS vs postFS: p = 0.013 (upper right), CA1 shNT preFS vs postFS: p = 0.007 (lower left), CA1 shRNA preFS vs postFS: p = 0.024 (lower right), n = 5]. (f) Number of FSR and nFSR neurons in each experimental group. In ACC, lenti-shRNA injection increased the number of FSR neurons (ACC, shNT, FSR, mean = 40.24, SEM = 4.06, nFSR, mean = 59.77, SEM = 4.06; ACC shRNA, FSR, mean = 57.43, SEM = 5.73, nFSR, mean = 42.57, SEM = 5.73; CA1, shNT, FSR, mean = 43.79, SEM = 4.35; nFSR, mean = 56.21, SEM = 4.35; shRNA, FSR, mean = 41.90, SEM = 3.47, nFSR, mean = 58.10, SEM = 3.47) (see also Figure 2—figure supplement 1 for bar graphs of FSR and statistical analysis. (g) Example heatmap of pairwise correlation between neuronal pairs in CA1 before the FS (preFS, lower triangle) and after the FS (postFS, upper triangle) from one shNT injected mouse.). Colorbar represents correlation coefficient. (h) Number of correlated pairs (> mean + 2 SD from a shuffled control) among FSR neurons as percentage of all possible pairs of FSR neurons. All experimental groups, except ACC shRNA, showed an increase in the percentage of correlated pairs after the foot-shock. [Two-tailed paired t-test, ACC shNT: p = 0.021 (upper left), ACC shRNA: p = 0.141 (upper right), CA1 shNT: p = 0.021 (lower left), CA1 shRNA: p = 0.001 (lower right), n = 5]. (i) Graphic summary of findings presented in this panel. In both ACC and CA1, learning, in form of experiencing a foot-shock in context A, induced the formation of a neural ensemble among FSR neurons by increasing co-activity. Increased FFI facilitated this effect in both brain regions with a higher number of FSR neurons in ACC and a stronger increase in correlated pairs in CA1 (see also Figure 2—figure supplement 1). Throughout, statistical data are represented as mean ± SEM, *p < 0.05, **p < 0.01, ***p < 0.001, n represents number of mice.
Figure 2—figure supplement 1
Supporting data for Figure 2.
(a) Quantification of FSR neurons in ACC (upper panel) and CA1 (lower panel). In ACC, shRNA mice showed significantly more FSR compared to shNT mice [Two-tailed unpaired t-test with Welch’s correction, p = 0.043, n = 5] while there was no difference in CA1 [Two-tailed unpaired t-test with Welch’s correction p = 0.743, n = 5]. (b) Change in correlated pairs [postFS – preFS] within FSR neurons (left panels) and across FSR and nFSR neurons. In CA1, the increase of correlated pairs within FSR neurons was significantly higher in shRNA mice compared to shNT mice [Two-tailed unpaired t-test with Welch’s correction, p = 0.044, n = 5] while there was no difference in ACC [Two-tailed unpaired t-test with Welch’s correction p = 0.980, n = 5]. In both brain regions, there is no change in correlation between pairs of FSR and nFSR neurons (upper and lower right panel) [One-sample t-test against 0; ACC shNT: p = 0.186; ACC shRNA: p = 0.204 (upper right), CA1 shNT: p = 0.382, CA1 shRNA: p = 0.698, (lower right), n = 5]. Throughout, statistical data are represented as mean ± SEM, *p < 0.05, **p < 0.01, ***p < 0.001, n represents number of mice. (c) Number of shamFSR neurons found in baseline recording on the training day. shamFSRs were identified using the same approach as training day (activity change around foot-shock time points). Number of shamFSRs did not differ between treatment groups. [Unpaired t-test with Welch’s correction, ACC, p = 0.702, n = 5; CA1, p = 0.09, n = 5]. middle and right panel: comparison of numbers of shamFSR neurons during baseline and FSR neurons during training. In ACC, shRNA mice showed significantly more FSR neurons compared to shamFSR neurons [paired t-test with Welch’s correction, shNT, p = 0.473, n = 5; shRNA, p = 0.021, n = 5]. (d-e) Analysis of shamFSR neurons for change in event rate (d) and correlated pairs (e) upon time points similar to foot-shock time points. No change in event rate or correlated pairs for detected in shamFSR neurons in any group [Paired t-test, event rate (d), ACC, shNT, p = 0.089, p = 5, shRNA, p = 0.075, n = 5; CA1, shNT, p = 0.118, n = 5; shRNA, p = 0.122, n = 5; correlated pairs (e), CA1, shNT, p = 0.063, n = 5, shRNA, p = 0.38, n = 5; CA1, shNT, p = 0.088, n = 5, shRNA, p = 0.086, n = 5].
Figure 3 with 3 supplements
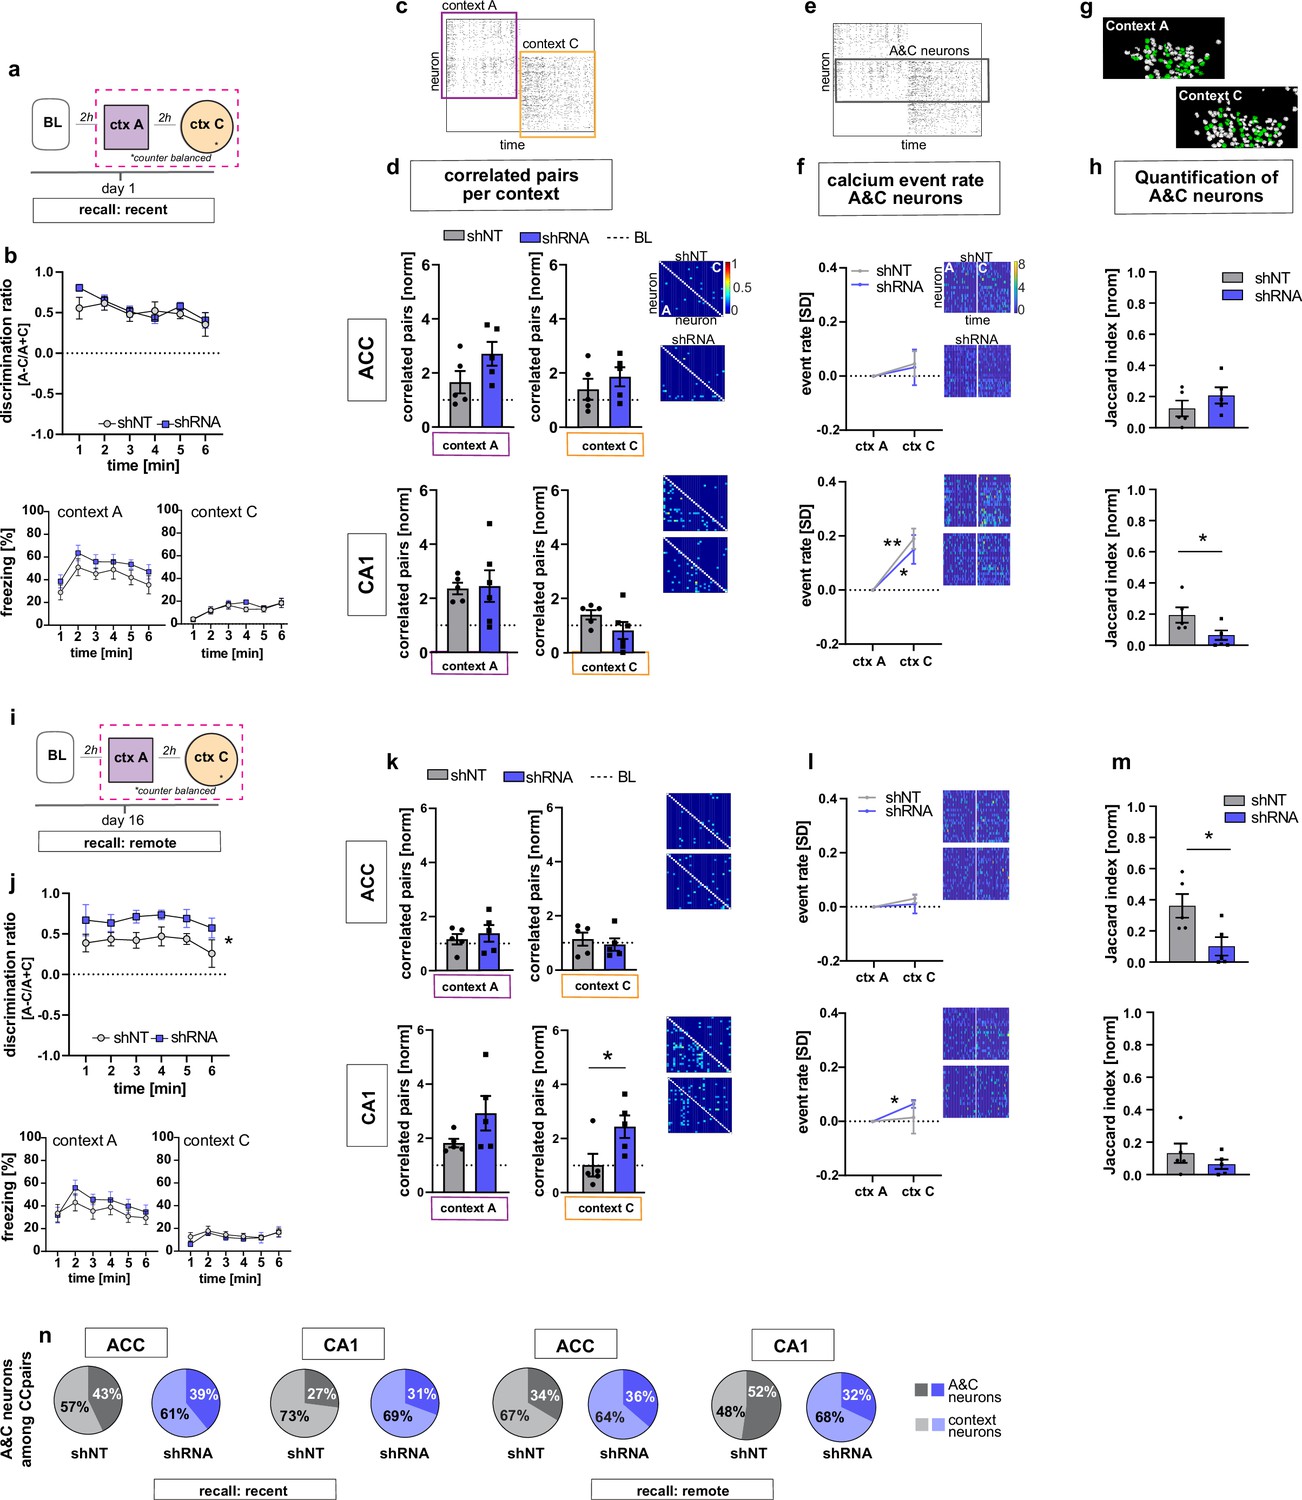
FFI in DG-CA3 dictates strength and specificity of CA1-ACC ensembles during memory consolidation.
(a) Schematic of time point in behavioral paradigm of the presented data. (b) Quantification of discrimination ratio as relative difference in freezing in context A and context C (upper panel) and freezing time in context A (lower left) and context C (lower right). ACC and CA1 mice were grouped together by virus. One day after training, all mice discriminated between context A and C with no difference between treatment groups [Two-way repeated measures ANOVA, treatment x time effect p = 0.434, time main effect p = 0.014; treatment main effect p = 0.232; n = 10]. (c) Raster plot of calcium events over time in context A and context C after registering neurons across sessions. Each row corresponds to a neuron, x-axis corresponds to time in each context. Colored squares indicate the context the recording was acquired in. Empty rows in one context mean that the neuron was not active in this context. (d) Quantification of number of correlated pairs across all neurons per context. Context-specific neuronal pairs were analyzed by normalizing the correlated pairs to the baseline level recorded in the same day baseline recording (dotted line in graph). Heatmaps right to the graph show correlation values of example neurons in context A (lower triangle) and context C (upper triangle). In each graph, the upper heatmap shows an example of a lenti-shNT injected, the lower heatmap of a lenti-shRNA injected mouse. In CA1, lenti-shNT and lenti-shRNA injected mice showed a higher number of correlated pairs compared to baseline in context A (yet non-significant in shRNA mice) but not in the new context C [one sample t-test against 1, context A, shNT: p = 0.003, shRNA: p = 0.055, context C: shNT: p = 0.089, shRNA: p = 0.574, n = 5] with no difference between groups [Unpaired t-test with Welch’s correction, context A: p = 0.889, n = 5, context C: p = 0.147, n = 5]. In ACC, lenti-shRNA injected mice showed a significantly higher number of correlated pairs in context A compared to baseline [one sample t-test against 1, context A, shNT: p = 0.188, shRNA: p = 0.018; context C: shNT: p = 0.368, shRNA: p = 0.073, n = 5] yet no difference was found between groups [Unpaired t-test with Welch’s correction, context A: p = 0.120, n = 5, context C: p = 0.403, n = 5]. (e) Raster plot of calcium events over time in context A and context C after registering neurons across sessions (same as in panel c). Each row corresponds to a neuron. The square marks neurons that were active in both contexts (A&C neurons). (f) Normalized activity of A&C neurons. Heatmaps show activity of example neurons in context A (left side) and context C (right side) in the first 180 s per context for better visualization. In each graph, the upper heatmap shows an example of a lenti-shNT injected, the lower heatmap of a lenti-shRNA injected mouse. A&C neurons showed a significantly higher activity in context C compared to context A in CA1 but not in ACC [one sample t-test against 0, ACC, shNT: p = 0.399, shRNA: p = 0.65; CA1, shNT: p = 0.007, shRNA: p = 0.048, n = 5]. (g) Example spatial maps of neurons (white circles) in context A and context C with green circles indicating neurons that were registered to be active in both sessions (A&C neurons). (h) Quantification of A&C neurons using normalized jaccard similarity index. In CA1, lenti-shRNA injected mice showed significantly less A&C neurons compared to lenti-shNT injected mice [Unpaired t-test with Welch’s correction, p = 0.048, n = 5]. No difference was found in ACC [Unpaired t-test with Welch’s correction, p = 0.284, n = 5]. (i) Schematic of time point in behavioral paradigm of the presented data. (j) Quantification of discrimination ratio (see b for details). Sixteen days after foot-shock training in context A, both treatment groups discriminated between A and C. Lenti-shRNA injected mice showed a significantly higher discrimination ratio compared to lenti-shNT injected mice [Two-way repeated measures ANOVA, treatment x time effect p = 0.993, time main effect p = 0.412, treatment main effect: p = 0.028, n = 10, pooled CA1 and ACC mice]. (k) Quantification of number of correlated pairs across all neurons at day 16. Same presentation as in panel d. In CA1, both virus groups maintained an increased number of correlated neurons in context A compared to baseline [One-sample t-test against 1, context A, shNT, p = 0.006; shRNA, p = 0.04; n = 5]. Lenti-shNT mice showed a significantly lower number of correlated pairs compared to day 1 [comparison not shown, paired t-test with Welch’s correction, p = 0.041, n = 5]. In context C, shRNA mice showed a similarly increased number of correlated neurons compared to baseline as in context A [One-sample t-test against 1, context C, shNT, p = 0.973; shRNA, p = 0.026; n = 5] with a significant difference between groups [Unpaired t-test with Welch’s correction, p = 0.0423, n = 5]. In ACC, no difference was found between contexts [One-sample t-test against 1, context A, shNT, p = 0.444; shRNA, p = 0.285; context C, shNT, p = 0.609, shRNA, p = 0.803, n = 5]. (l) Normalized activity of A&C neurons (see f). In CA1, A&C neurons showed a significantly higher activity in context C compared to context A in shRNA mice [one sample t-test against 0, shNT: p = 0.824, shRNA: p = 0.012, n = 5]. No difference was found in ACC [one sample t-test against 0, shNT: p = 0.148, shRNA: p = 0.784, n = 5]. (m) Quantification of A&C neurons (see h). In ACC, lenti-shRNA injected mice showed significantly less A&C neurons compared to lenti-shNT injected mice [Unpaired t-test with Welch’s correction, p = 0.028, n = 5]. No difference was found in CA1 [Unpaired t-test with Welch’s correction, p = 0.340, n = 5]. (n) Quantification of A&C neurons that formed correlated pairs with any other neurons in shNT (grey graphs) and shRNA (blue graphs) injected mice during recent (left panel) and remote (right panel) recall. In CA1, lenti-shRNA injected mice showed fewer A&C neurons among the correlated pairs compared to lenti-shNT injected mice during remote recall [A&C neurons, recent, ACC, shNT 42.97 ± 8.37, shRNA 39.07 ± 5.93,CA1, shNT, 27.03 ± 8.23, shRNA, 30.64 ± 4.65; remote, ACC, shNT 33.59 ± 11.82, shRNA, 36.34 ± 12.14, CA1, shNT, 52.26 ± 4.80, shRNA, 28.55 ± 6.17; mean ± SEM] (see Figure 3—figure supplement 1 for statistical analysis).
Figure 3—figure supplement 1
Supporting data for Figure 3.
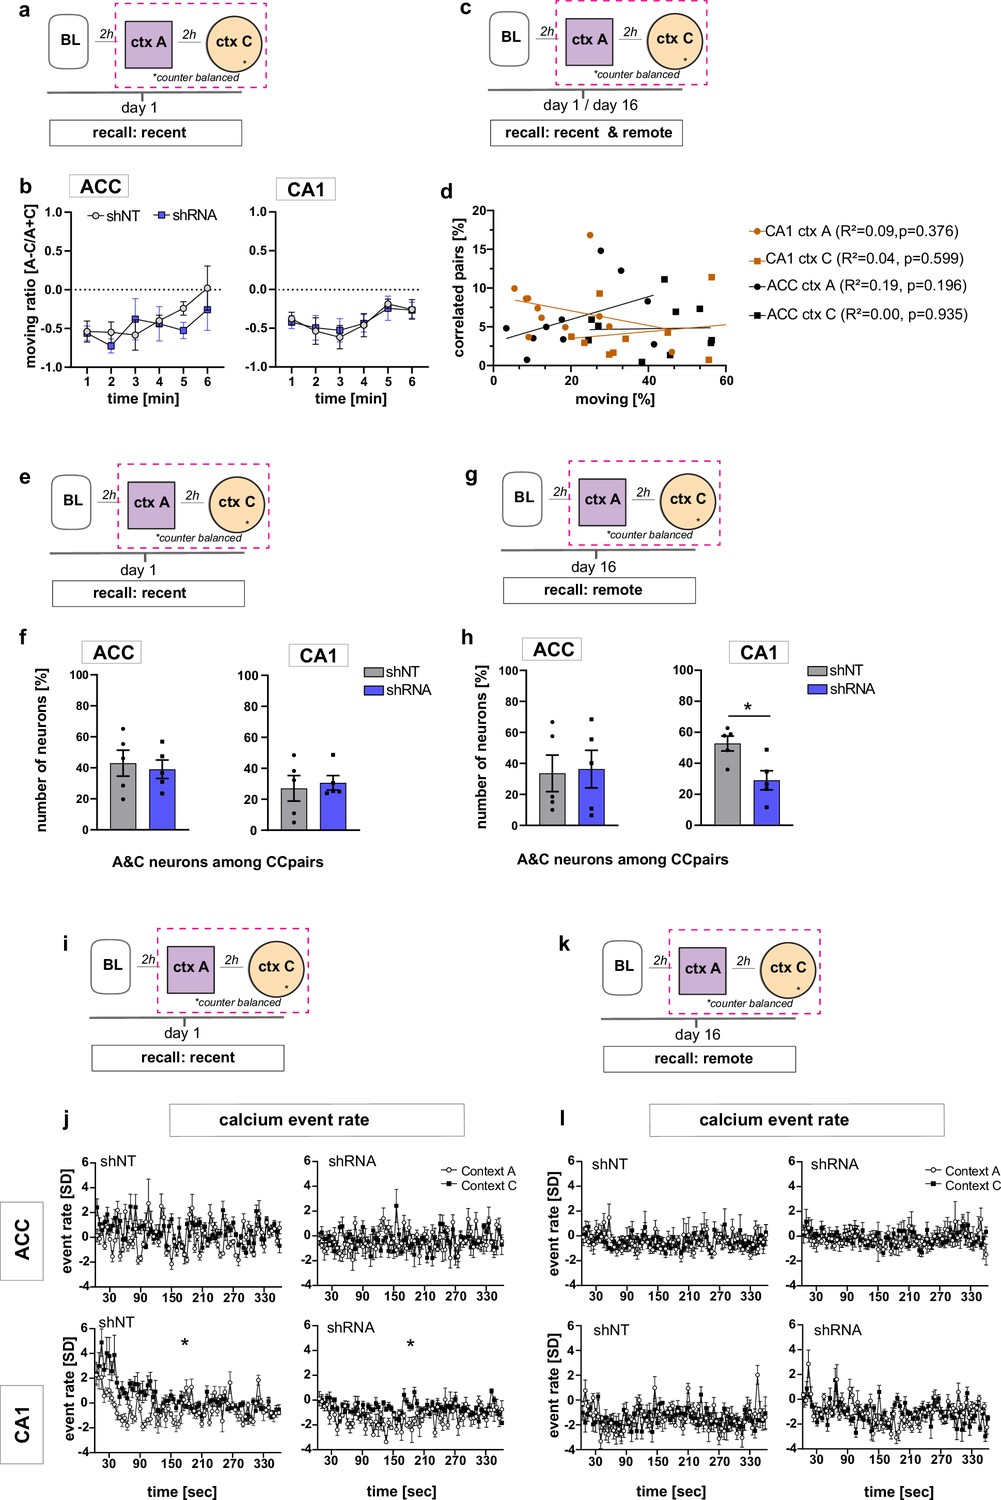
(a) Schematic of time point in behavioral paradigm of the presented data (context A and context C on day one after foot-shock training in context A). (b) Quantification of moving ratio as relative time in percentage of one minute time bins. In both ACC and CA1, no difference was found between virus groups [Two-way repeated measures ANOVA, ACC: virus x time effect p = 0.554, time main effect p = 0.08, virus main effect p = 0.571; CA1: virus x time effect p = 0.958, time main effect p = 0.142, virus main effect p = 0.856, n = 5]. (c) Schematic of time point in behavioral paradigm of the presented data (context A and context C on day 1 and day 16 after foot-shock training in context A). (d) Number of correlated pairs in percentage of all possible pairs (all neurons active in the context) against the time mice were moving in the respective context. We found no correlation between the number of correlated pairs and the time mice were moving. Pearson’s R2 and p-values are noted in brackets. (e,g) Schematic of time point in behavioral paradigm of the presented data (context A and context C on day 16 after foot-shock training in context A). (f,h) Quantification of A&C neurons that formed correlated pairs with other neurons (A&C neurons or context neurons) in ACC and CA1 (see also Figure 3n) during recent (f) and remote (h) recall. In CA1, lenti-shRNA injected mice showed significantly less A&C neurons among the correlated pairs than shNT injected mice [Unpaired t-test with Welch’s correction, p = 0.017, n = 5] at the remote time point. (i) Schematic of time point in behavioral paradigm of the presented data (context A and context C on day one after foot-shock training in context A). (j) Neuronal activity in form of normalized (to same day baseline) calcium event rate on day one after foot-shock training (in context A) in both context A and context C. All neurons active in the respective context were included in this dataset. In CA1, the average event rate was higher in context C compared to context A in both virus groups (left and right lower panel) [Two-way ANOVA with repeated measures, CA1, shNT: context x time effect p < 0.0001, time main effect p = 0.007, context main effect p = 0.028, n = 5, shRNA,: context x time effect p < 0.0001, time main effect p = 0.012, context main effect p = 0.029, n = 5]. No difference between contexts was found in ACC [Two-way ANOVA with repeated measures, shNT: context x time effect p < 0.0001, time main effect p = 0.001, context main effect p = 0.216, shRNA: context x time p < 0.0001, time main effect p = 0.156, context main effect p = 0.957 n = 5]. (k) Schematic of time point in behavioral paradigm of the presented data (context A and context C on day 16 after foot-shock training in context A). (l) Neuronal activity in form of normalized (to same day baseline) calcium event rate on day 16 after foot-shock training (in context A) in both context A and context C. All neurons active in the respective context were included in this dataset. There was no context effect in any experimental group [Two-way ANOVA with repeated measures, ACC, shNT: context x time effect p = 0.456, time main effect p = 0.321, context main effect p = 0.839; shRNA: context x time effect p = 0.863, time main effect p = 0.446, context main effect p = 0.73, n = 5; CA1, shNT: context x time effect p < 0.0001, time main effect p = 0.0004, context main effect p = 0.953, shRNA: context x time effect p < 0.0001, time main effect p = 0.005, context main effect p = 0.603, n = 5].
Figure 3—figure supplement 2
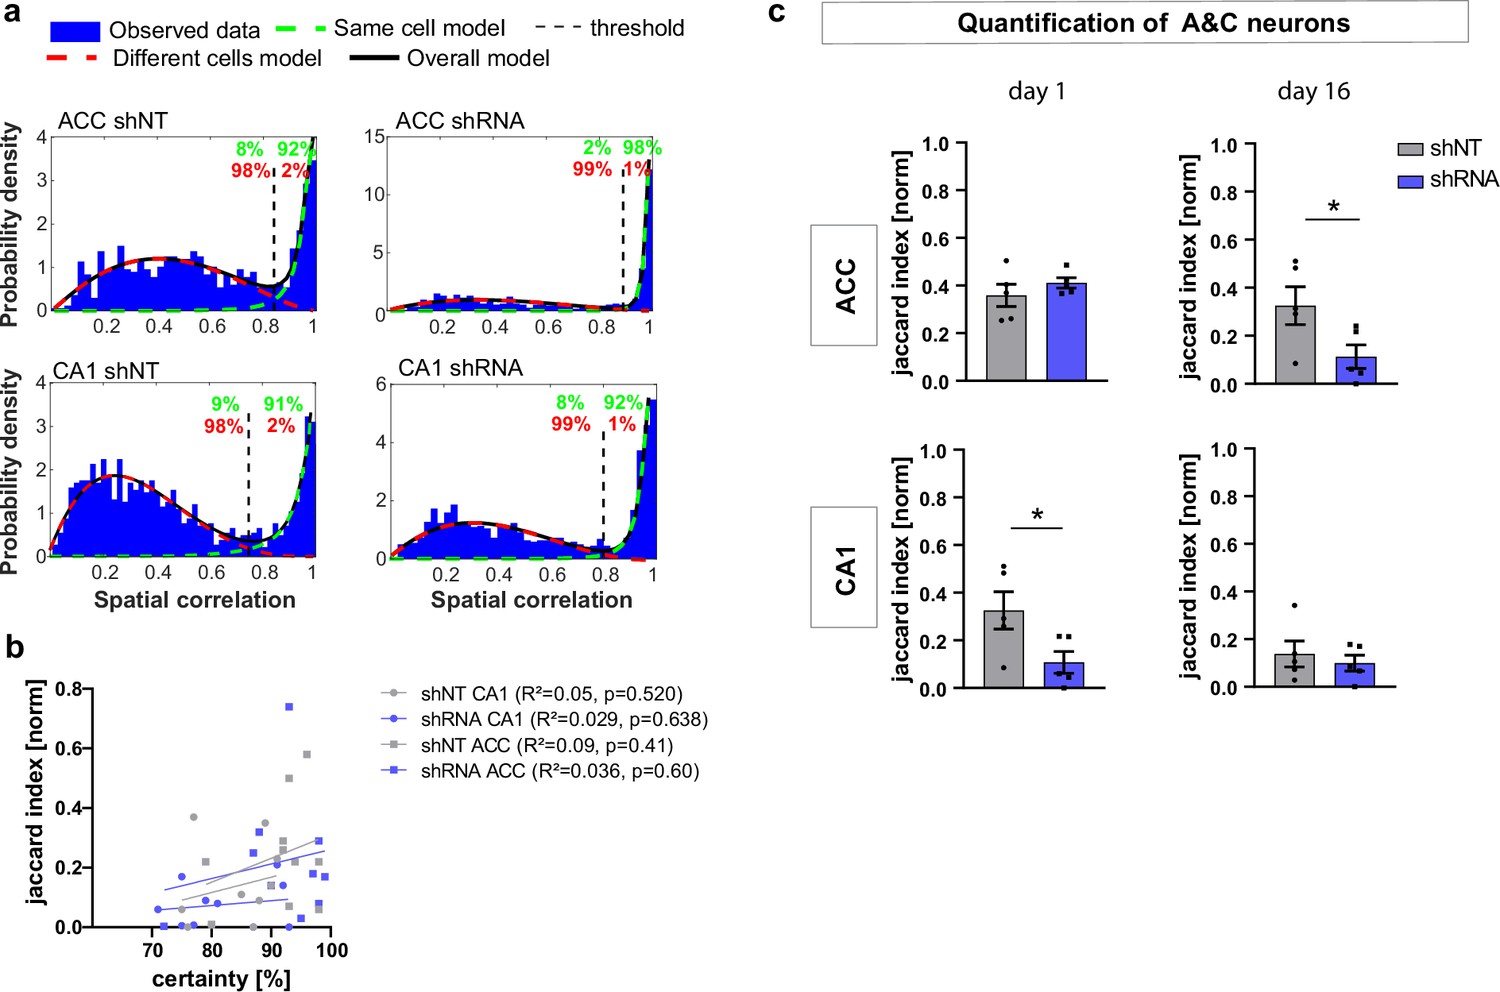
Supporting data for Figure 3 (cell registration).
(a) Example distributions of spatial correlation generated with CellReg (Sheintuch et al., 2017) on spatial maps from each experimental group using probabilistic modeling. The green and red numbers indicate the certainty of each model (same cell model, green; different cell model, red). All groups showed a bimodal distribution though the distributions and thresholds differed between ACC (upper panels) and CA1 (lower panels) but not between treatment groups within each brain region (left and right panels). (b) Plot of registration certainty (green numbers in example a) against the normalized number of A&C neurons (normalized jaccard similarity index) on day 1 and day 16. There was no significant correlation between the certainty of cell registration and the number of A&C neurons (Pearson’s R2 and p-values are noted in brackets). (c) Quantification of A&C neurons using a fixed threshold for spatial correlation of 0.85. The effects found in Figure 3 were similar to those found using a fixed threshold [Unpaired t-test with Welch’s correction, day 1, ACC: p = 0.35, CA1 p = 0.05; day 16, ACC p = 0.044, CA1 p = 0.567; n = 5].
Figure 3—figure supplement 3
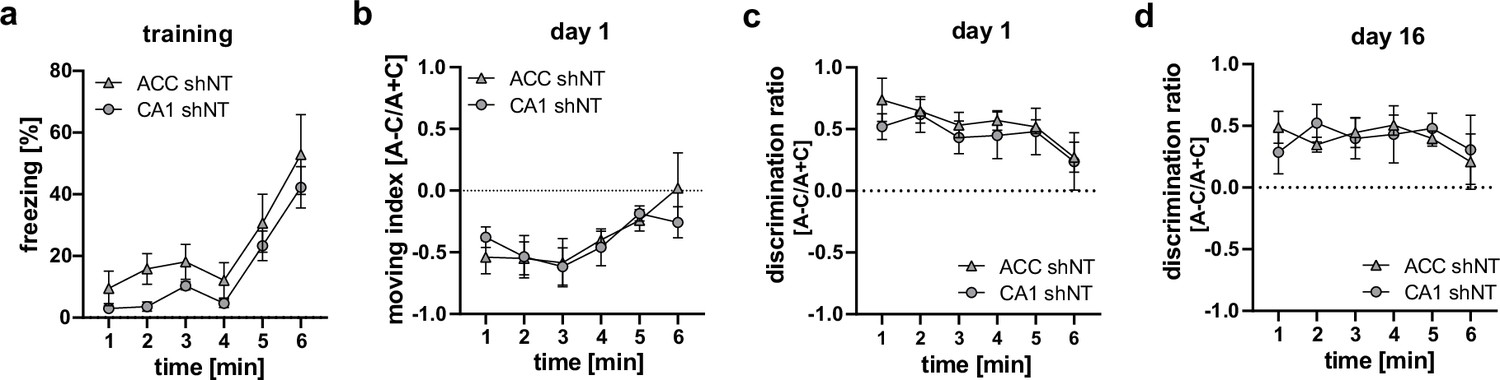
Analysis of behavioral data during training (a, time freezing) or recall (b–d) to test for difference between control groups (ACC shNT vs CA1 shNT).
No difference between groups was found in any analysis [Two-way repeated measures ANOVA; (a) time x brain region effect, p = 0.995, main brain region effect, p = 0.109, main time effect: p = 0.002, n = 5; (b) time x brain region effect, p = 0.647, main brain region effect, p = 0.868, main time effect: p = 0.019, n = 5; (c) time x brain region effect, p = 0.978, main brain region effect, p = 0.443, main time effect: 0.443, n = 5; (d) time x brain region effect, p = 0.849, main brain region effect, p = 0.969, main time effect: p = 0.68; n = 5;].
Figure 4

Activity of A&C neurons in CA1 conveys contextual information.
(a) A support vector machine was trained to classify the context based on neuronal activity of CA1 A&C neurons. A distribution of prediction accuracy was created with 1,000 randomized datasets of shuffled event times (shuffled). Graphs show an example distribution of an shNT-injected (left) and an shRNA-injected mouse (right) recent recall (day 1). Lines in graph indicate the mean (solid, gray) and two standard deviations from the mean (dashed, gray). The solid line (black) indicates the decoder accuracy of the true data from the respective mouse. (b) Summary of prediction accuracy (within subject) for day 1 and day 16. On day 1, the accuracy to predict the context based on A&C neuron’s activity was above chance (also see shuffled data in panel a) [One-sample t-test against 50 (chance level)], shNT, p = 0.012, shRNA, p = 0.005, n = 4 (only mice with >50 A&C neurons were included to avoid overfitting) with no difference between the treatment groups [Mann Whitney test, p = 0.486, n = 4]. This was maintained on day 16 [One-sample t-test against 50 (chance level), shNT, p = 0.003, shRNA, p = 0.008, n = 4] with a significantly higher accuracy in lenti-shRNA injected mice [Mann Whitney test, p = 0.029, n = 4]. (c) Accuracy of the decoder correlates positively with the discrimination ratio found in mice during recall (day 1 and day 16) in both groups. Pearson’s R2 value is shown in brackets. [Pearson’s correlation, shNT p = 0.028, shRNA = 0.028, n = 4 per group].
Figure 5 with 1 supplement
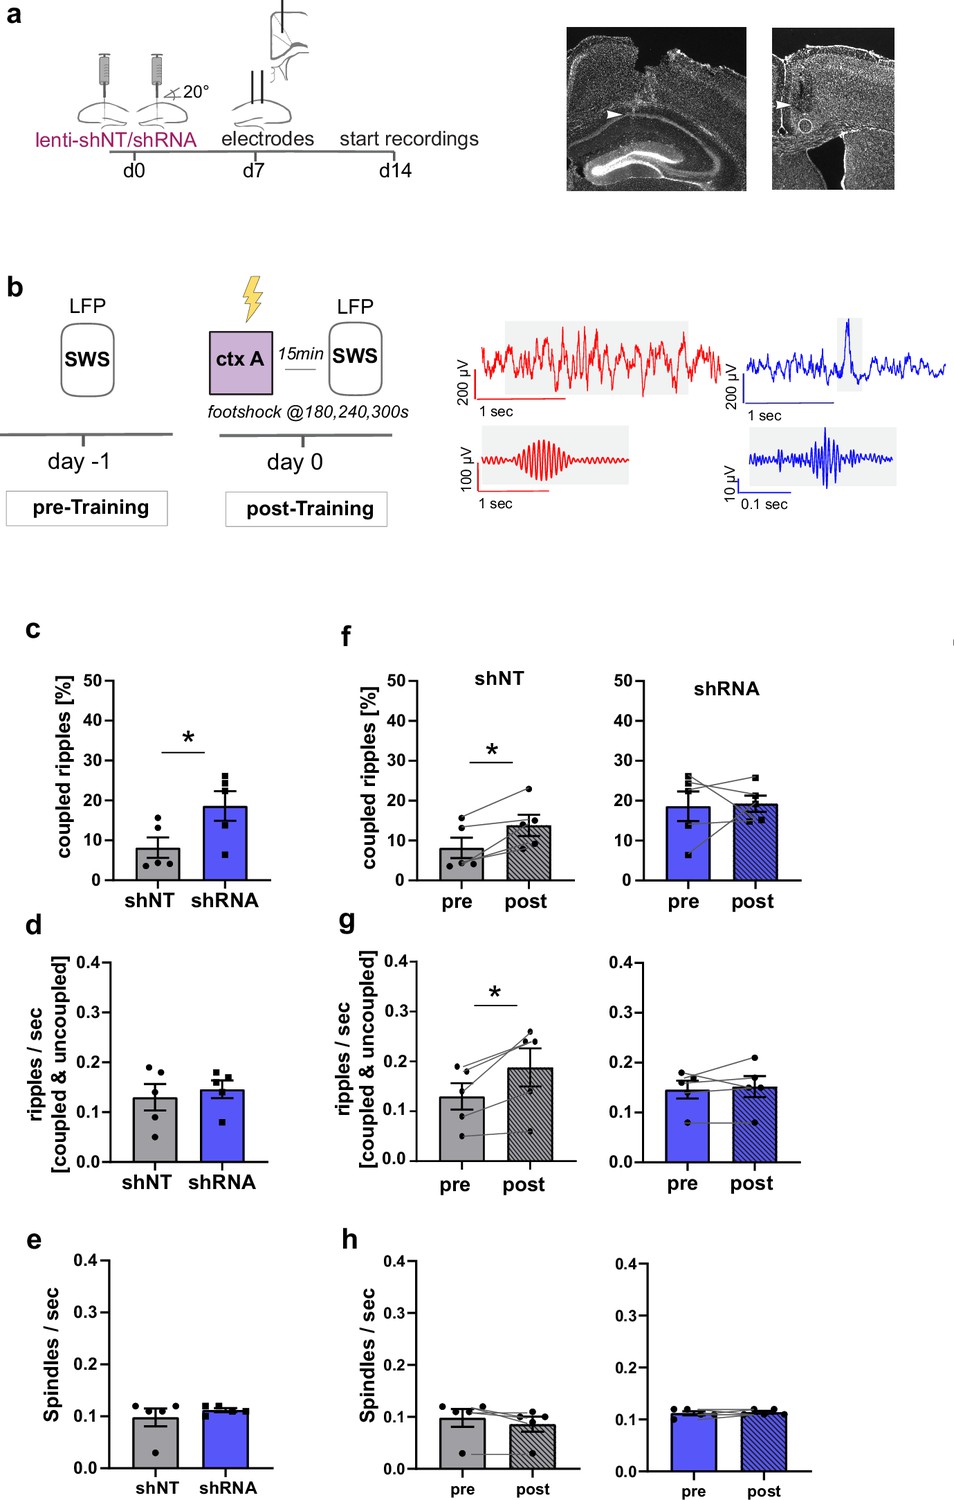
Increased FFI in DG ‒ CA3 enhances CA1 ripple ‒ ACC spindle coupling.
(a) Schematic of surgical procedure and histology of tetrodes in CA1 and ACC (white arrows). (b) Recording paradigm and example traces. Local field potentials (LFPs) were recorded before and after mice were trained in context A. Raw traces obtained from LFP recordings from ACC (red) and CA1 (blue). Gray boxes indicate time points magnified in filtered examples below. Magnified signals were filtered for ripples (CA1, blue) and spindles (ACC, red) during slow-wave sleep (SWS). Magnified examples are not aligned temporally. (c) Coupled ripples (% of all ripples) during pre-Training recordings. shRNA mice showed significantly more coupled ripples compared to shNT mice [Unpaired Student’s t-test, p = 0.049, n = 5 per group]. (d-e) Ripple occurrence (ripples/sec) and spindle occurrence (Spindles/sec) during pre-Training recordings. No difference was found between virus groups. [Unpaired Student’s t-test, ripples/sec: p = 0.633, n = 5 per group; spindles/sec: p = 0.466, n = 5 per group]. (f–h) Effect of training on coupled ripples, ripple occurrence and spindle occurrence. Plots show pairwise comparison of pre-Training (same data as c-e) with post-Training recordings. shNT mice (left panel) show increased coupled ripples (f) following learning [Paired Student’s t-test, p = 0.019, n = 5; shRNA mice: p = 0.881, n = 5] and increased couple occurrence (g) [Paired Student’s t-test, p = 0.031, n = 5; shRNA mice: p = 0.621, n = 5]. No difference is found in spindle occurrence following learning (h) in either group [Paired Student’s t-test, p = 0.109, n = 5; shRNA mice: p = 0.623, n = 5].
Figure 5—figure supplement 1
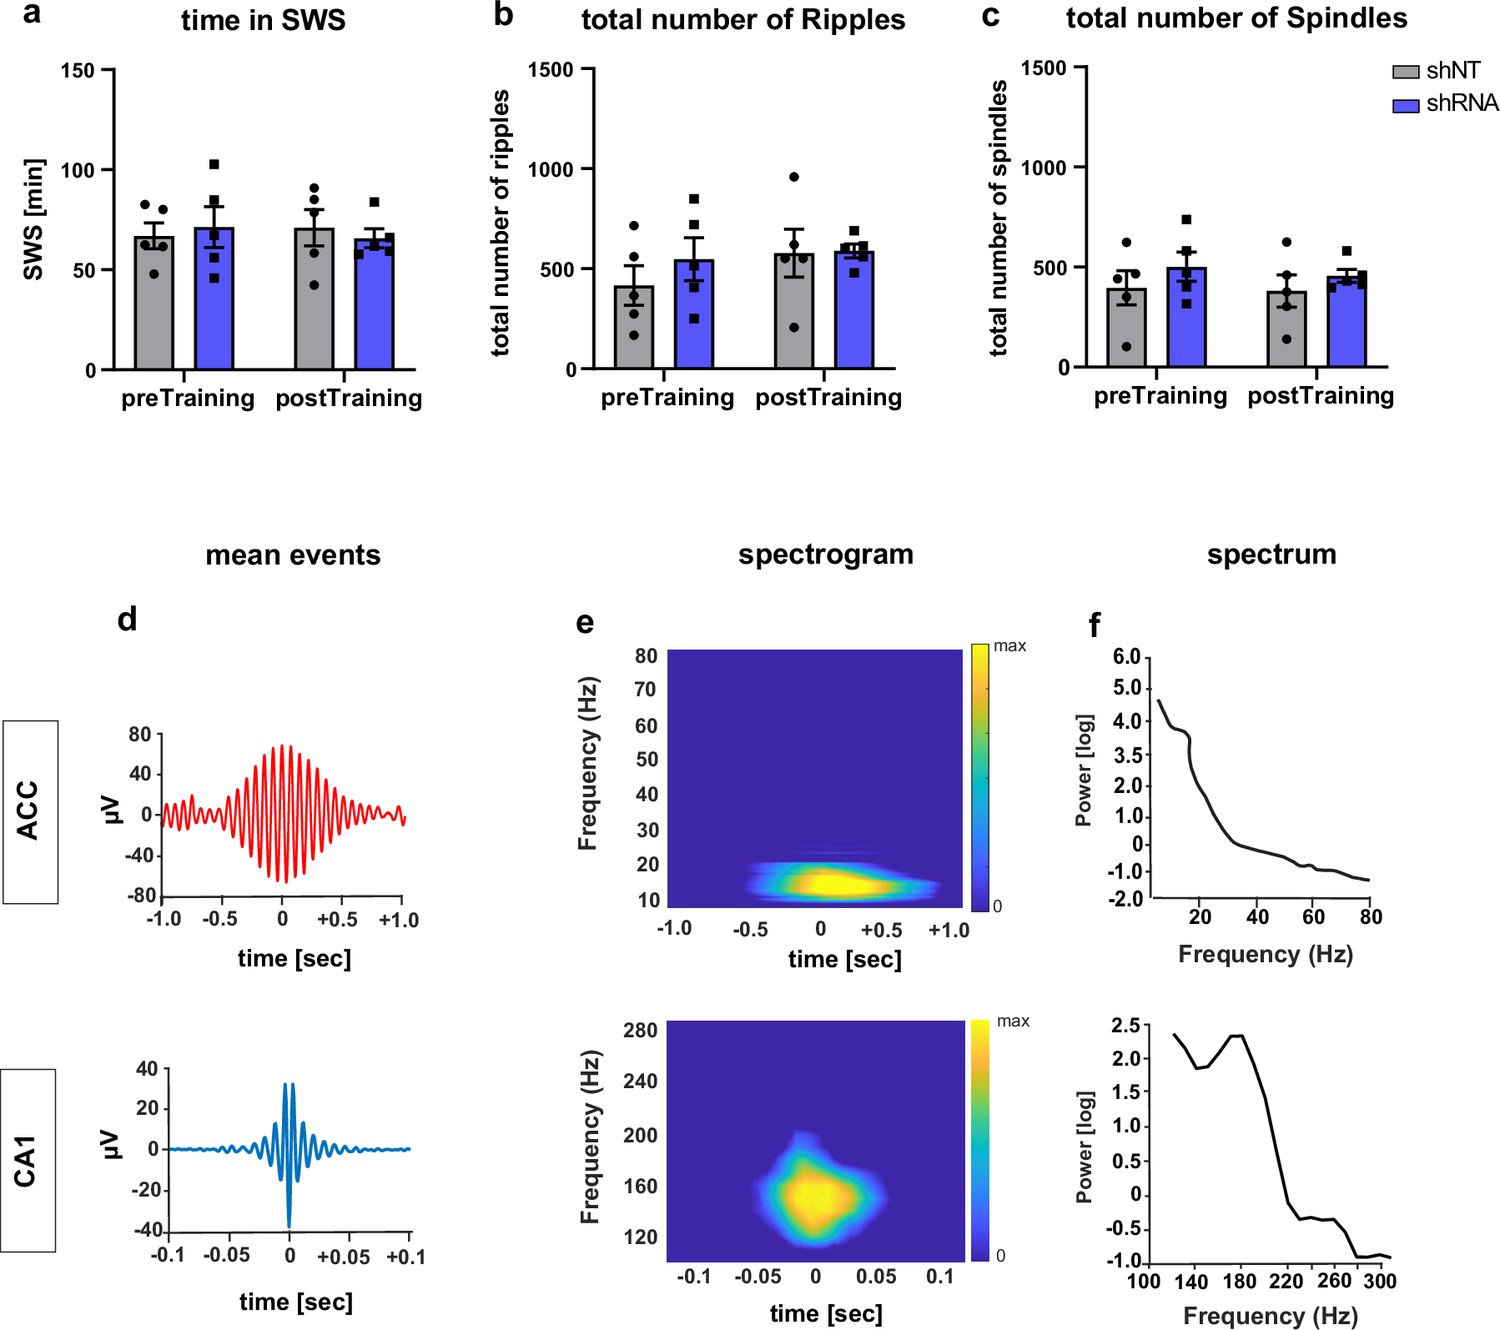
Supporting data for Figure 5.
(a) Time in SWS during LFP recordings. [Two-way ANOVA with repeated measures, virus x time effect, p = 0.505, main virus effect, p = 0.959, main time effect, p = 0.917, n = 5 per group]. (b) Total number of ripples detected per recording [Two-way ANOVA with repeated measures, virus x time effect, p = 0.247, main virus effect, p = 0.589, main time effect, p = 0.069, n = 5 per group]. (c) total number of spindles detected per recording [Two-way ANOVA with repeated measures, virus x time effect, p = 0.774, main virus effect, p = 0.335, main time effect, p = 0.548, n = 5 per group]. (d) Example of mean traces of filtered spindle (upper) and ripple (lower) aligned to event peak. (e) Spectrogram of unfiltered mean spindles (upper) and ripples (lower) calculated within the relevant frequencies and time windows. (f) Spectrum of unfiltered mean spindles (upper) and ripples (lower).
Figure 6
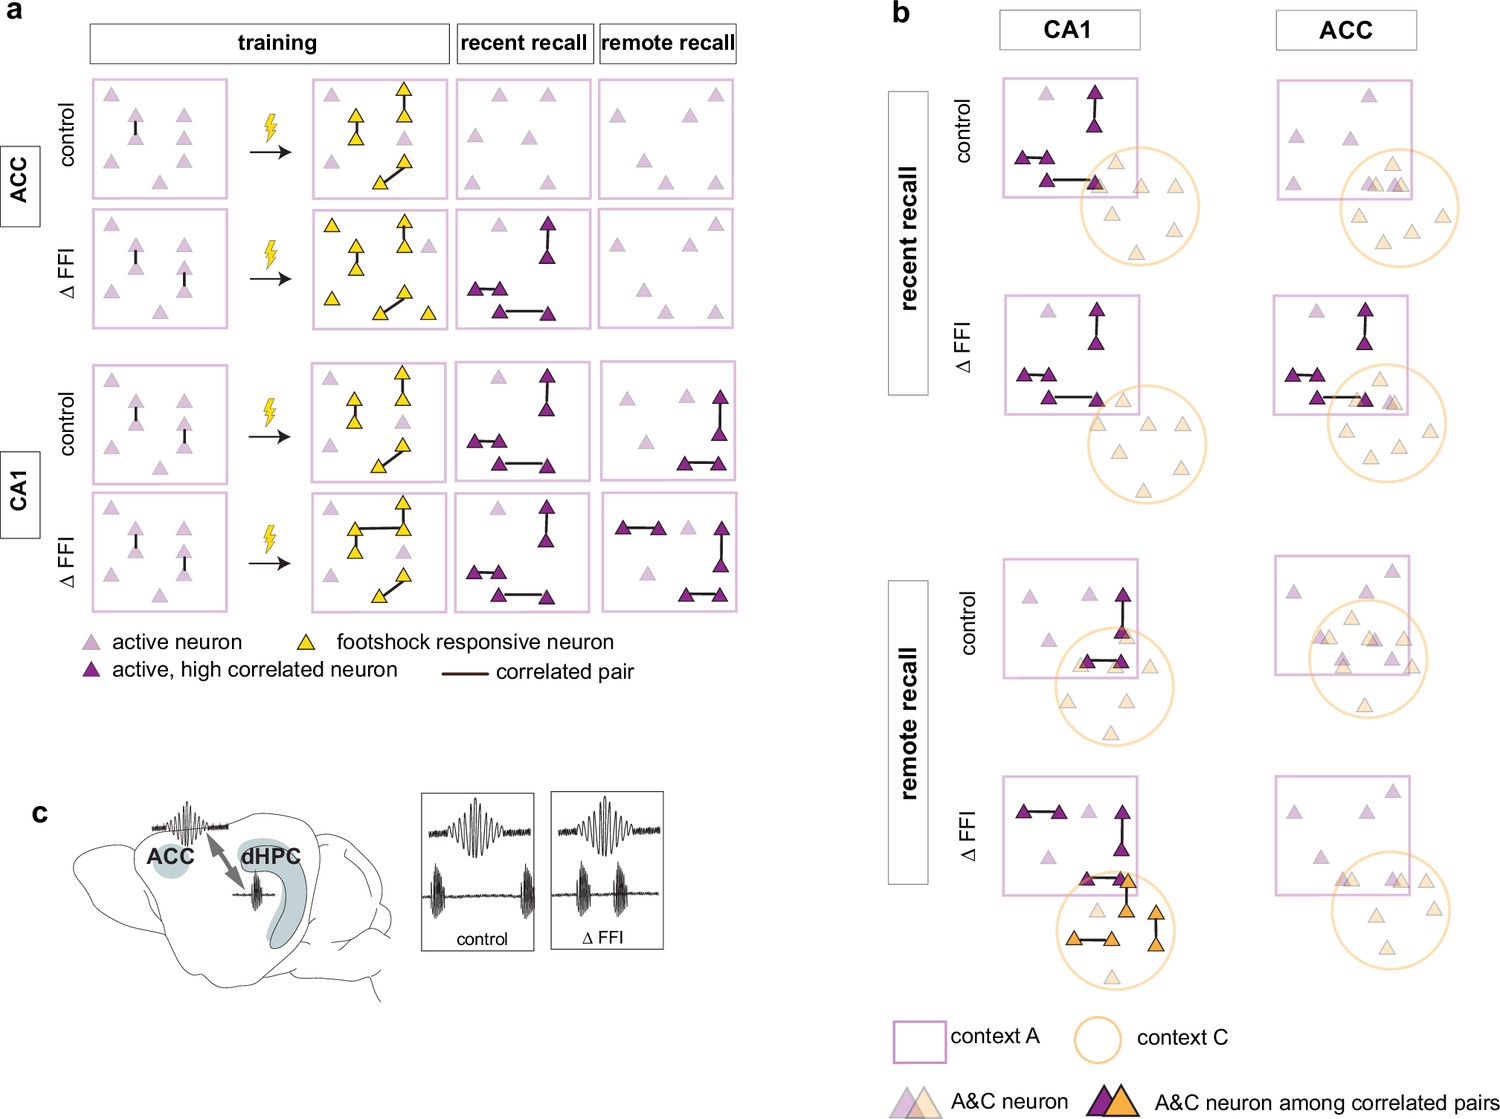
Increased FFI in DG-CA3 promotes systems consolidation in hippocampal-cortical networks.
(a–b) Graphic summary of current findings. Learning induced the formation of neuronal ensembles of foot-shock-responsive neurons in both ACC and CA1 and FFI potentiated this property in CA1. During early stages of memory consolidation (recall of recent memory), we observed the emergence of training context-associated ensembles (increased numbers of co-active neurons) in both CA1 and ACC. Increasing FFI in DG-CA3 promoted emergence of training context-associated ensemble in ACC and increased CA1-ACC communication (c). Additionally, we observed a FFI dependent reduction in the number of neurons active in both training and neutral contexts in CA1 (a, top) reflecting increased specificity of neuronal ensembles. At remote recall, we observed that FFI in DG-CA3 prevented time-dependent decay of the training context-associated ensemble and promoted acquisition (or maintenance since it may have emerged prior to test at remote timepoint) of a neutral context specific ensemble in CA1 (a, b). Within the ACC, and not evident at the recent timepoint, we observed a FFI dependent reduction in the number of neurons active in both training and neutral contexts (b, bottom).
Author response image 1
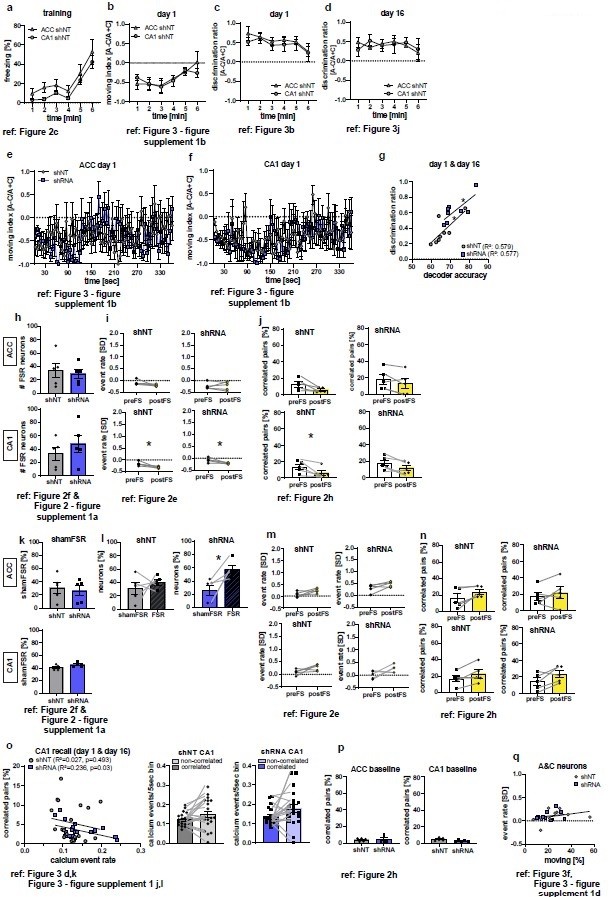
Additional analyses of calcium imaging and behavioral data as suggested by the reviewers.
Figure references indicate the corresponding figure in the main, revised manuscript. (a-d) Analysis of behavioral data during training (a, time freezing) or recall (b-d) to test for difference between control groups (ACC shNT vs CA1 shNT). No difference between groups was found in any analysis [2-Way repeated measures ANOVA; (a) time x brain region effect, p=0.995, main brain region effect, p=0.109, main time effect: p=0.002, n=5; (b) time x brain region effect, p=0.647, main brain region effect, p=0.868, main time effect: p=0.019, n=5; (c) time x brain region effect, p=0.978, main brain region effect, p=0.443 , main time effect: 0.443 , n=5; (d) time x brain region effect, p=0.849, main brain region effect, p=0.969, main time effect: p=0.68; n=5;]. (e-f) Moving index during recall day 1 in one second time bins. No group difference was detected [2-Way repeated measures ANOVA; (e) time x virus effect, p=0.011, main virus region effect, p=0.749, main time effect: p=0.372, n=5; Sidak’s posthoc, N.S; (f) time x virus region effect, p=0.435, main virus effect, p=0.695, main time effect: 0.16, n=5]. (g) Correlation of decoder accuracy and behavioral discrimination ratio during both recall sessions [Pearson’s correlation, shNT: R2=0.579, p=0.028, n=8; shRNA: R2=0.577, p=0.029, n=8]. (h) Absolute numbers of FSR neurons [Unpaired t-test with Welch’s correction, ACC, p=0.705, n=5; CA1, p=0.393, n=5]. (i-j) Analysis of randomly picked nonFSR neurons for change in event rate (i) and correlated pairs (j) upon foot-shocks. In ACC, no difference in either measure was found [Paired t-test, event rate (i), shNT, p=0.123, n=5; shRNA, p=0.924, n=5; correlated pairs (j): shNT, p=0.052, n=5; shRNA, p=0.112, n=5]. In CA1 neurons showed a significant decrease in event rate in both groups [Paired t-test, event rate (i), shNT, p=0.034, n=5; shRNA, p=0.033, n=5] and a decrease in correlated pairs in the shNT group [Paired t-test, correlated pairs (j), shNT, p=0.044, n=5; shRNA, p=0.055, n=5]. (k) Number of shamFSR neurons found in baseline recording on the training day. shamFSRs were identified using the same approach as training day (activity change around foot-shock). Number of shamFSRs did not differ between treatment groups. [Unpaired t-test with Welch’s correction, ACC, p=0.702, n=5; CA1, p=0.09, n=5]. (l) Comparison of numbers of shamFSR neurons during baseline and FSR neurons during training. In ACC, shRNA mice show significantly more FSR neurons compared to shamFSR neurons [paired t-test with Welch’s correction, shNT, p=0.473, n=5; shRNA, p=0.021, n=5]. (m-n) Analysis of shamFSR neurons for change in event rate (m) and correlated pairs (n) upon time points similar to foot-shock time points. No change in event rate or correlated pairs for detected in shamFSR neurons in any group [Paired t-test, event rate (m), ACC, shNT, p=0.089, p=5, shRNA, p=0.075, n=5; CA1, shNT, p=0.118, n=5; shRNA, p=0.122, n=5; correlated pairs (n), CA1, shNT, p=0.063, n=5, shRNA, p=0.38, n=5; CA1, shNT, p=0.088, n=5, shRNA, p=0.086, n=5]. (o) Correlation of activity of correlated pairs and number of correlated pairs during recall (left) and comparison of activity between correlated and uncorrelated neurons (middle-right) in CA1. A negative correlation was found between the number of correlated pairs and activity of correlated neurons in shRNA mice. [Pearson’s correlation, shNT, R2=0.027, p=0.493, n=20, shRNA, R2=0.236, p=0.03, n=20]. No significant difference was found between activity in correlated and uncorrelated neurons [Paired t-test, shNT, p=0.06, n=20, shRNA, p=0.085, n=20]. (p) Number of correlated pairs during baseline recording on training day [Unpaired t-test with Welch’s correction, ACC, p=0.774, n=5; CA1, p=0.108, n=5]. (q) Correlation between event rate of A&C neurons in CA1 and time moving in context C during recall sessions day1 and day 16. No correlation is found in either group [Pearson’s correlation, shNT, R2=0.113, p=0.344, n=10, shRNA, R2=0.043, p=0.563, n=10].
Author response image 2

Viral expression of lenti-shNT/ shRNA construct in the dorsal DG in all mice included in this study.
Representative images are shown for each mouse.
Videos
Video 1
Example recording of calcium activity in ACC neurons in lenti-shNT injected mice.
Normalized (dF/F) calcium signals acquired during a 6-min baseline recording. This example video was spatially (4 x) and temporally (2 x) downsampled.
Video 2
Example recording of calcium activity in ACC neurons in lenti-shRNA injected mice.
Normalized (dF/F) calcium signals acquired during a 6-min baseline recording. This example video was spatially (4 x) and temporally (2 x) downsampled.
Video 3
example recording of calcium activity in CA1 neurons in lenti-shNT injected mice.
Normalized (dF/F) calcium signals acquired during a 6-min baseline recording. This example video was spatially (4 x) and temporally (2 x) downsampled.
Video 4
example recording of calcium activity in CA1 neurons in lenti-shRNA injected mice.
Normalized (dF/F) calcium signals acquired during a 6-min baseline recording. This example video was spatially (4 x) and temporally (2 x) downsampled.
Additional files
-
Transparent reporting form
- https://cdn.elifesciences.org/articles/70586/elife-70586-transrepform1-v3.pdf
-
Supplementary file 1
Complete Statistics Table.
- https://cdn.elifesciences.org/articles/70586/elife-70586-supp1-v3.xlsx
Download links
A two-part list of links to download the article, or parts of the article, in various formats.
Downloads (link to download the article as PDF)
Open citations (links to open the citations from this article in various online reference manager services)
Cite this article (links to download the citations from this article in formats compatible with various reference manager tools)
A dentate gyrus-CA3 inhibitory circuit promotes evolution of hippocampal-cortical ensembles during memory consolidation
eLife 11:e70586.
https://doi.org/10.7554/eLife.70586


