Selective dephosphorylation by PP2A-B55 directs the meiosis I-meiosis II transition in oocytes
- Whitehead Institute for Biomedical Research, United States
- Department of Biology, Massachusetts Institute of Technology, United States
- Department of Biochemistry and Cell Biology, Geisel School of Medicine at Dartmouth, United States
- Norris Cotton Cancer Center, Geisel School of Medicine at Dartmouth, United States
Figures
Figure 1 with 3 supplements
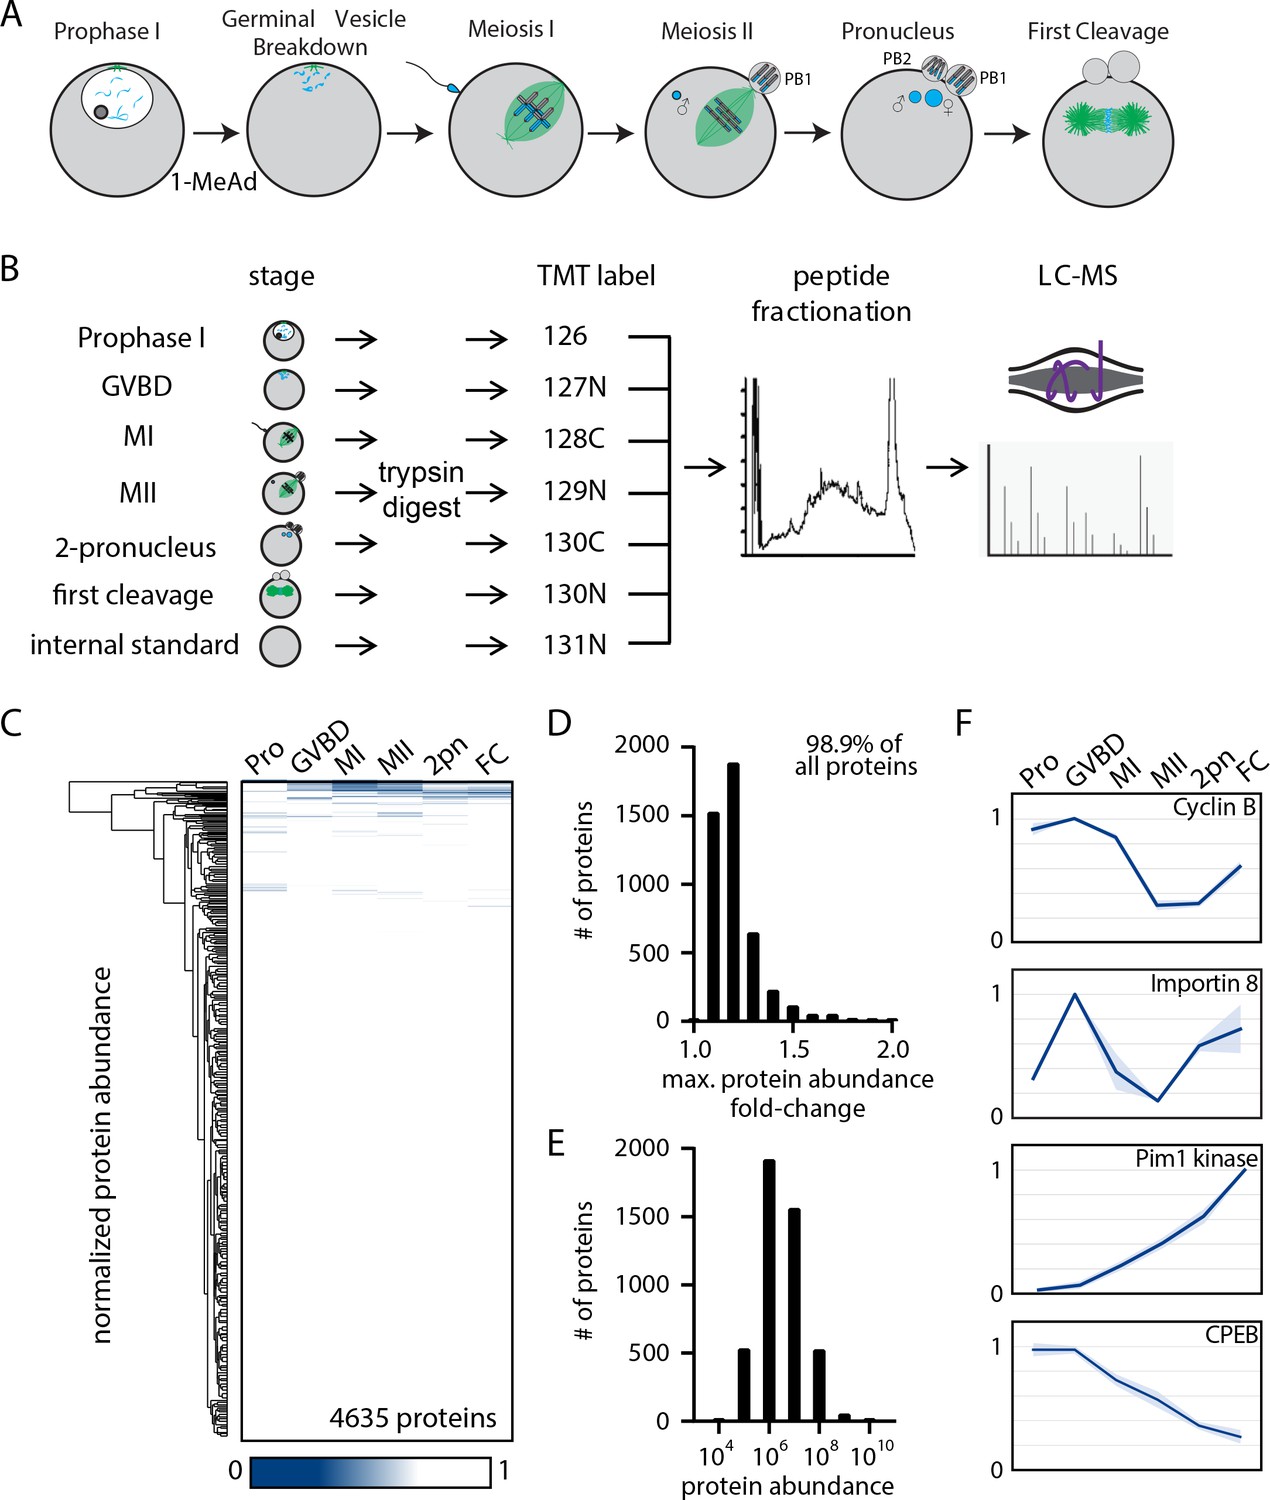
The proteome during the oocyte-to-embryo transition is broadly stable.
(A) Schematic of meiotic progression in sea star oocytes, representing the six stages collected for mass spectrometry analysis. (B) Proteomics workflow diagram, in which protein samples were collected in biological triplicates, digested, tandem mass tag (TMT) labeled, fractionated, and analyzed by liquid chromatography with mass spectrometry (LC-MS). (C) Hierarchical clustering of the relative abundance of 4635 proteins detected across three replicates. Individual proteins are clustered (vertically) by the six isolated meiotic stages (horizontally). (D) Histogram of proteins binned by their maximum fold change in abundance, indicating 98.99% of all proteins undergo a fold change of less than 2. (E) Abundance histogram of proteins identified in our analysis reveals a normal distribution. (F) Relative abundances of selected proteins across stages (Pro, prophase I; GVBD, germinal vesicle breakdown; MI, meiosis I; MII, meiosis II; 2-PN, two pronucleus; FC, first cleavage). Light blue shading represents standard deviation.
Figure 1—figure supplement 1
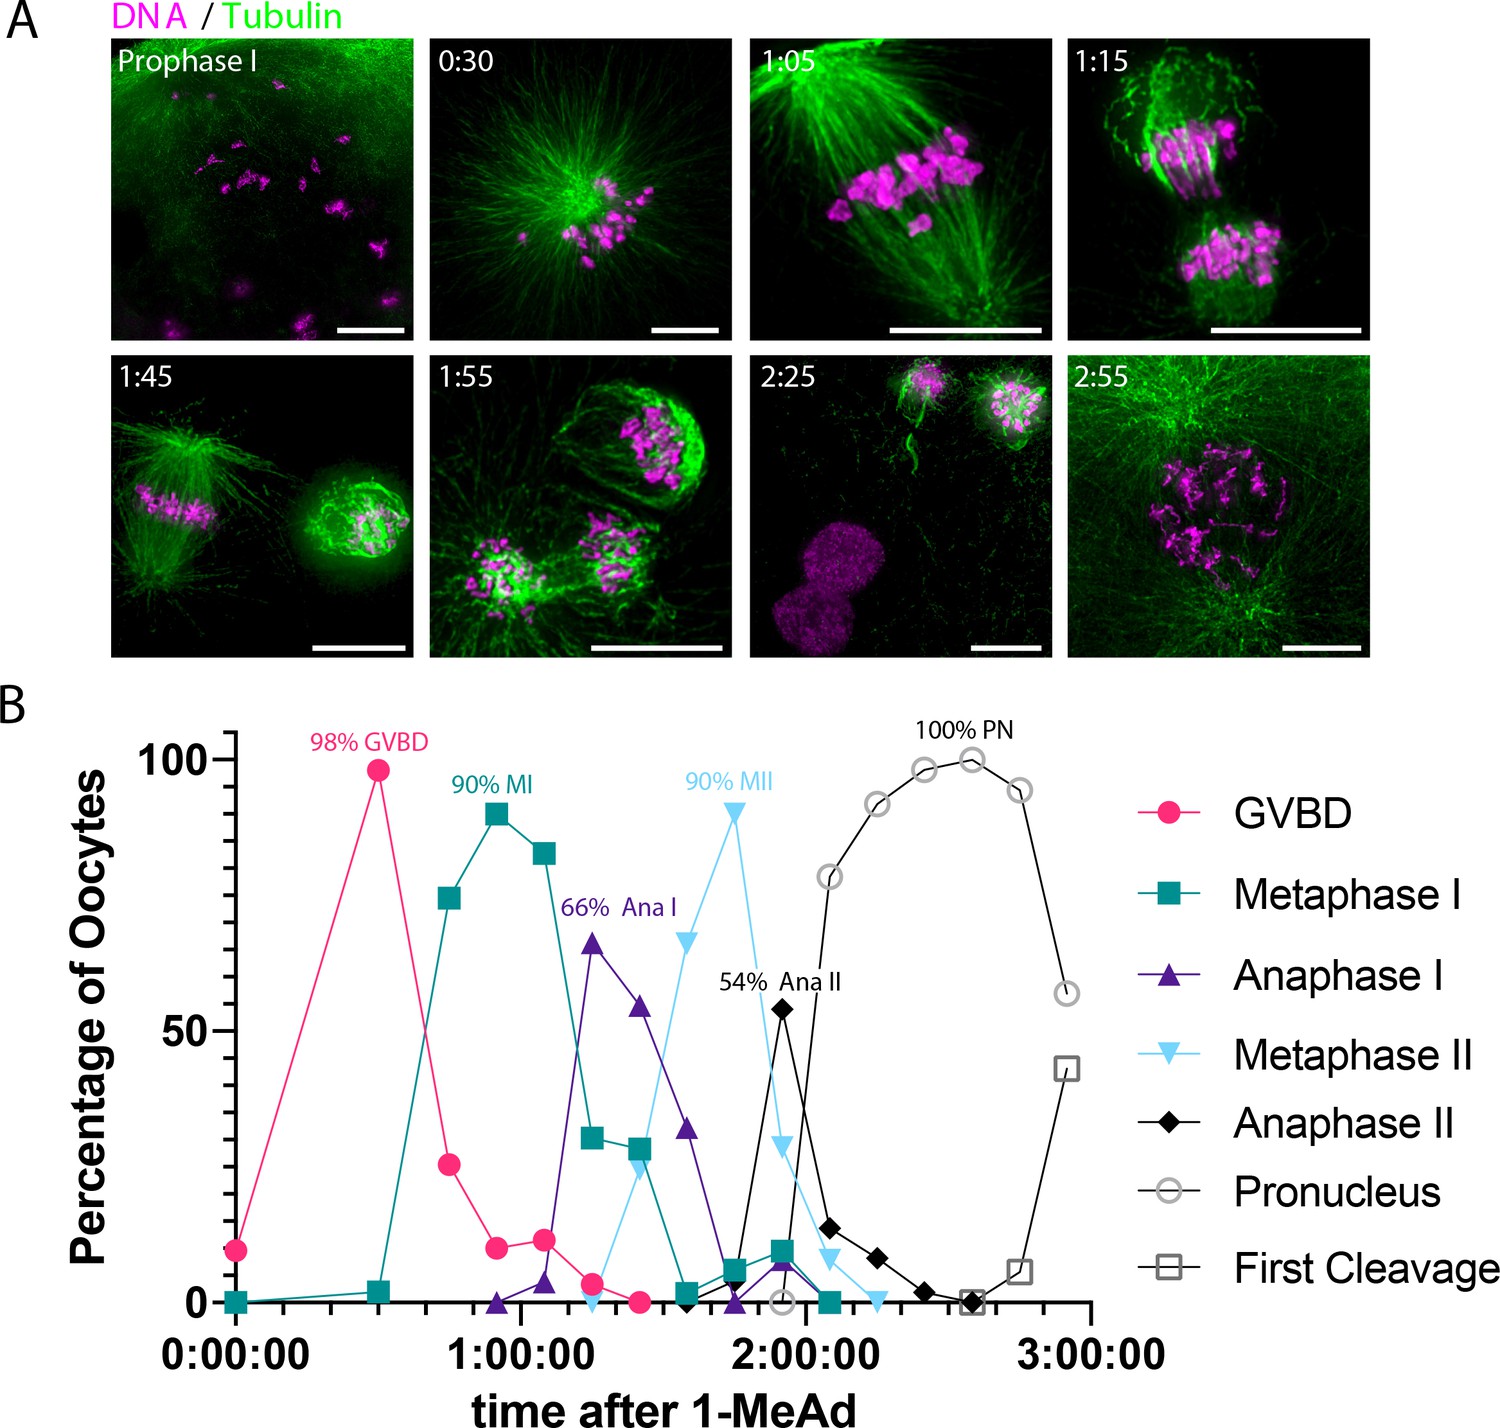
Oocyte synchrony analysis.
(A) Representative time-course immunofluorescence images of oocytes collected to assess synchrony. Images were scaled individually and nonlinearly to facilitate visualization of cellular events. Scale bars = 10 μm. (B) Quantification of oocytes in the indicated cell cycle stage over time after addition of 1-methyladenine (1-MeAd). Each time point represents at least 49 oocytes.
Figure 1—figure supplement 2
Mass spectrometry analysis of protein abundance.
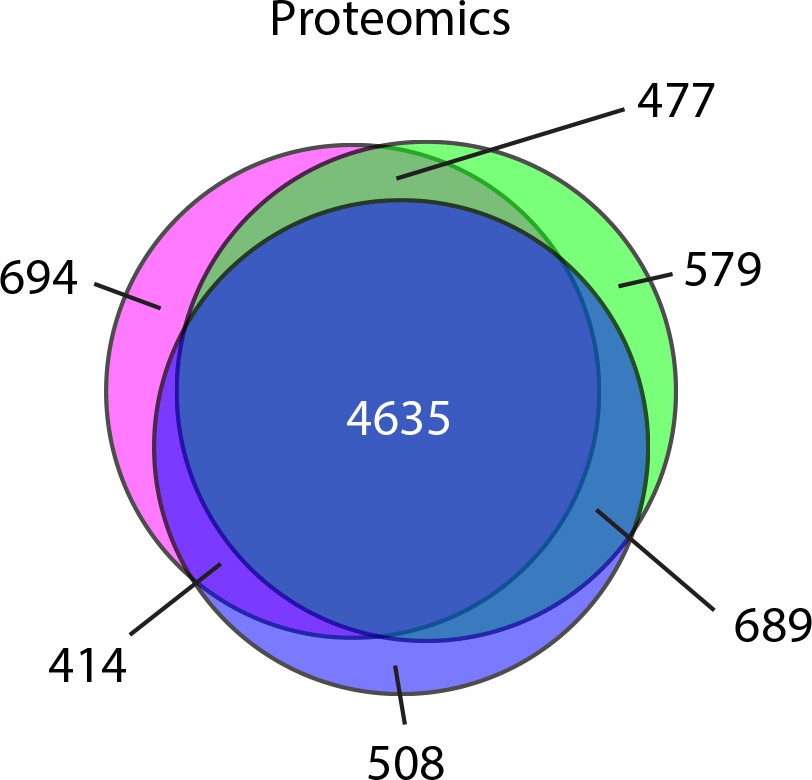
Venn diagram representation of the proteins identified in three biological replicates.
Figure 1—video 1
Time-lapse imaging of sea star oocytes progressing through meiosis.
A zoomed-in view of a single oocyte is provided on the left.
Figure 2 with 2 supplements
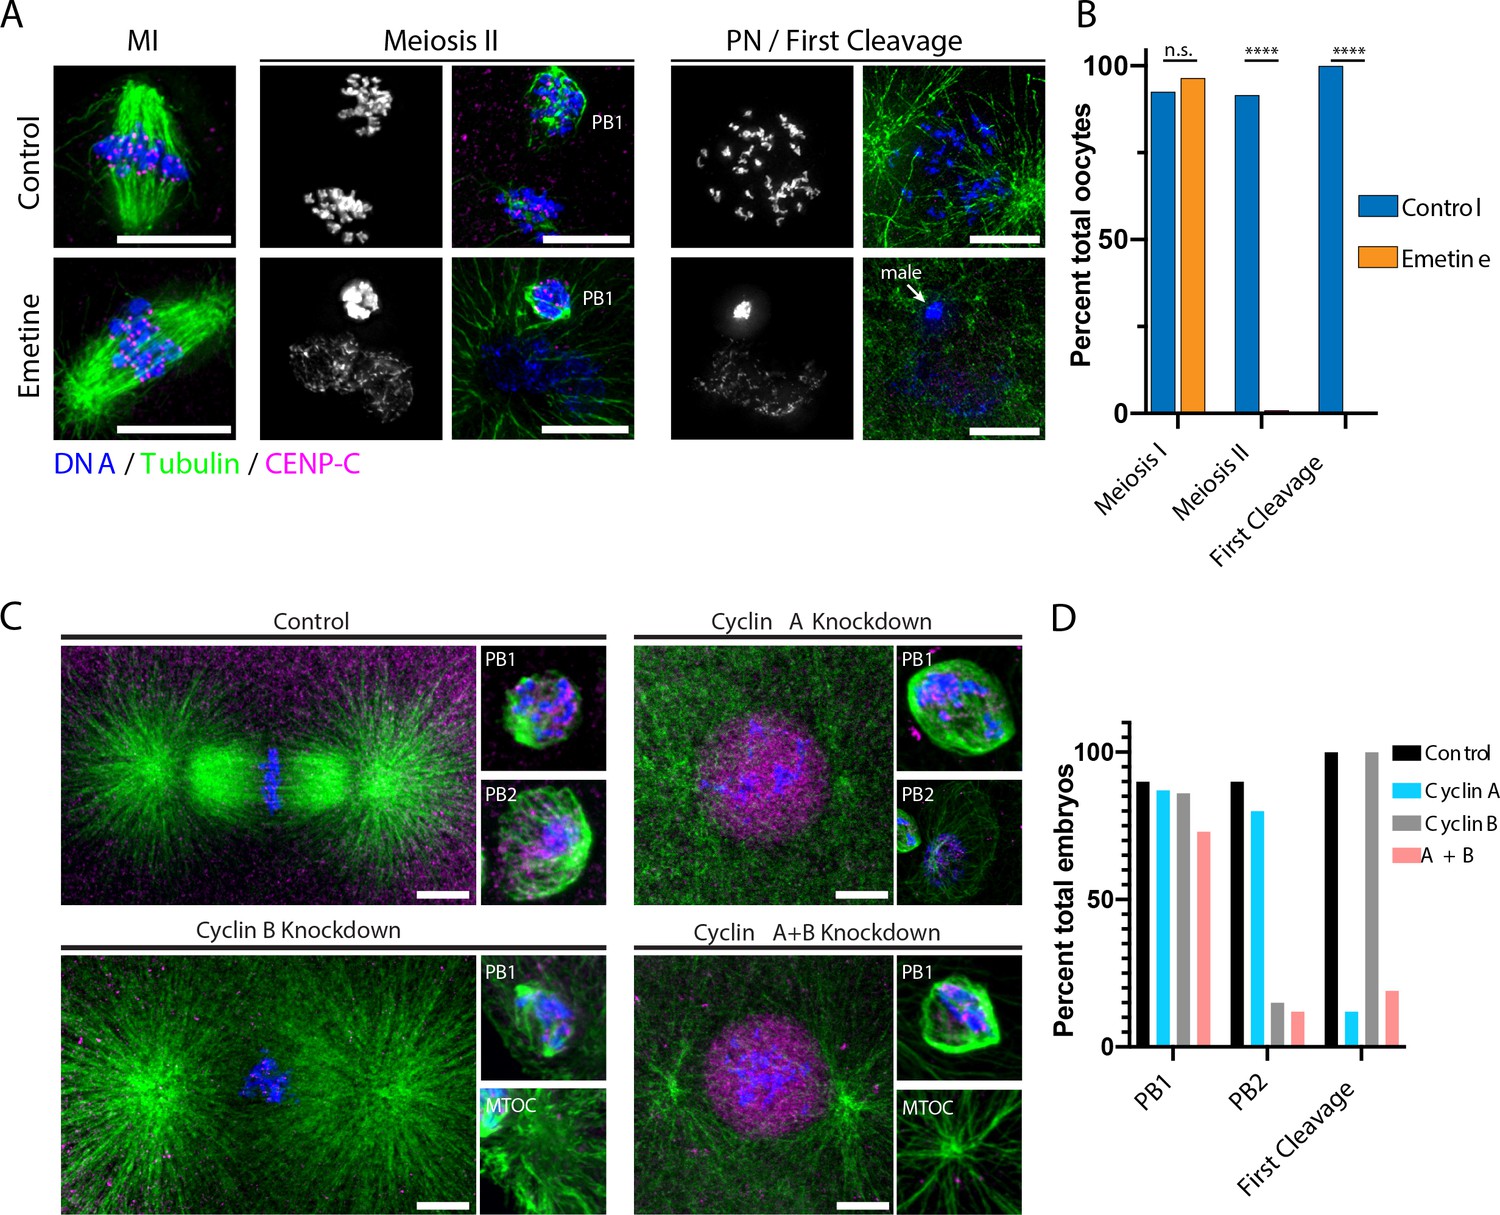
Protein synthesis is required for the MI/MII transition.
(A) Immunofluorescence of control or emetine-treated oocytes, with DNA provided in single-channel grayscale images. While controls proceed to meiosis II (MII) and first cleavage, emetine-treated oocytes decondense DNA after meiosis I (MI), arrest in a pronuclear state, and fail to incorporate the male DNA. Microtubules were scaled nonlinearly. Scale bars = 10 μm. (B) Fraction of oocytes that successfully extruded both polar bodies and underwent first cleavage (MI: control n = 107, emetine n = 113; MII: control n = 107, emetine n = 114; first cleavage: control n = 31, emetine n = 47 oocytes; ****p<0.0001 by Fisher’s exact test). (C) Immunofluorescence of oocytes in which nascent synthesis of cyclin A, cyclin B, or both was blocked. Control oocytes extruded both polar bodies and initiated first cleavage. Blocking cyclin A synthesis did not affect the meiotic divisions but caused an arrest prior to the first cleavage. Blocking cyclin B instead selectively disrupted the second mitotic division, but the first meiosis and initiation of first cleavage proceeded normally. Combined translational inhibition of both cyclin A and cyclin B resulted in an interphase arrest following the first meiotic division. Microtubules were scaled nonlinearly. Scale bars = 10 μm. (D) Fraction of oocytes that successfully extruded polar bodies and underwent first cleavage (cyclin A n = 82, cyclin B n = 66, cyclin A + B n = 52 oocytes).
Figure 2—figure supplement 1
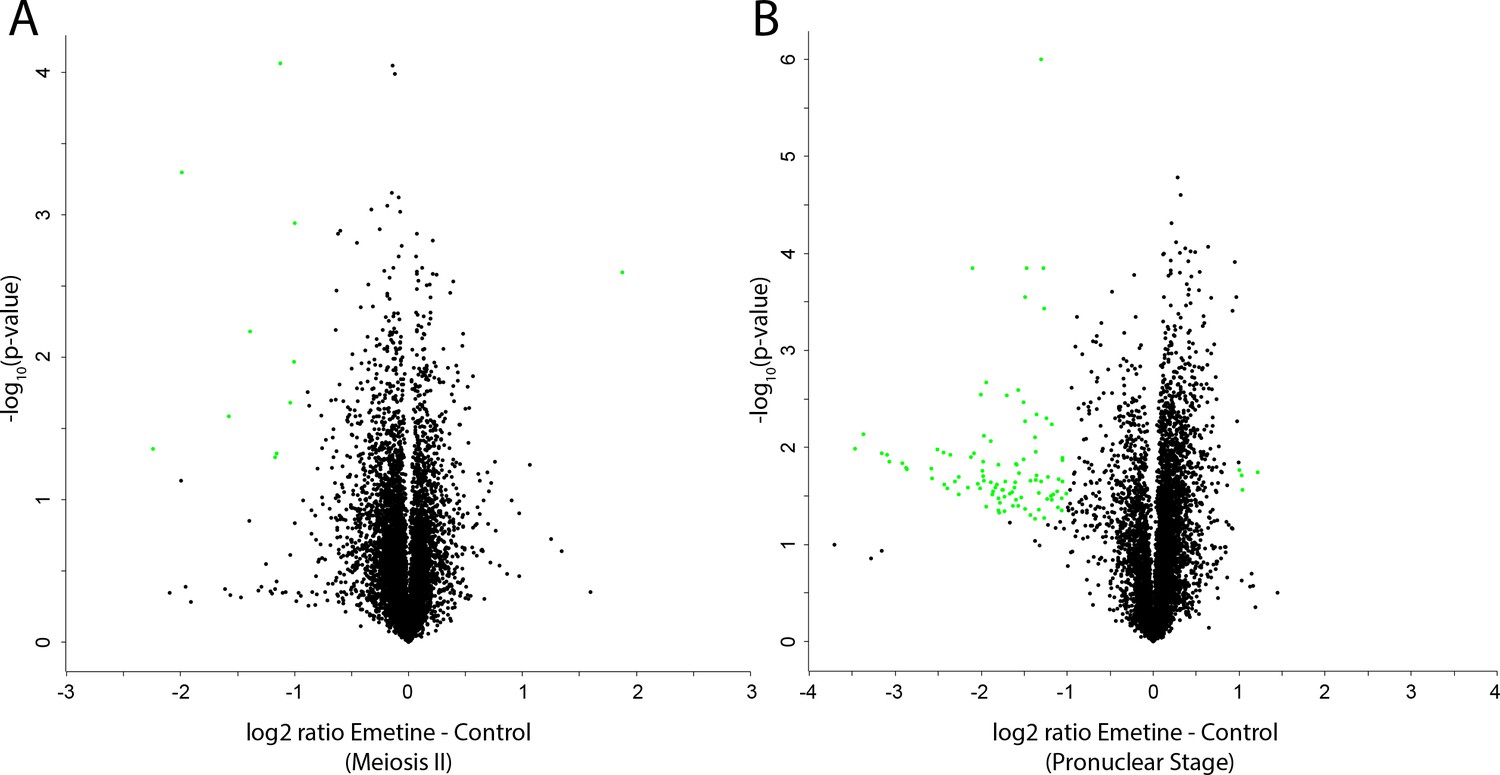
Mass spectrometry analysis of nascent protein synthesis.
(A, B) Volcano plots of protein abundance changes in emetine-treated oocytes vs controls when control oocytes were in meiosis II (A) or the pronuclear stage (B). Proteins with abundance changes of greater than 2 fold change and a p-value of less than 0.05 are colored green (108 out of 7609 proteins).
Figure 2—figure supplement 2
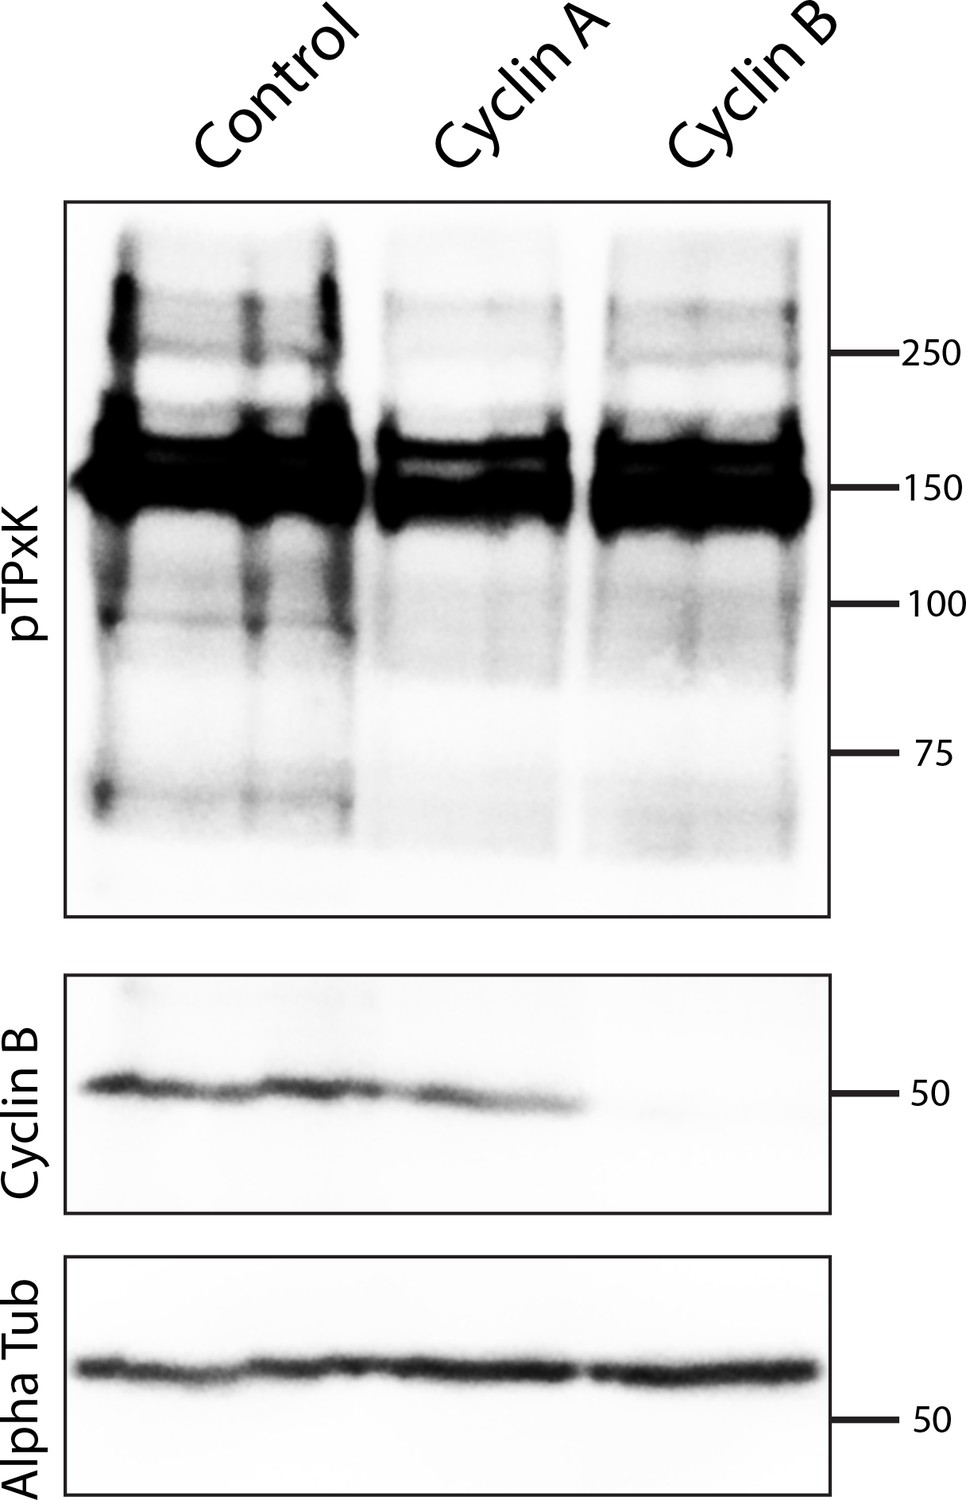
Specificity of cyclin morpholino knockdowns.
Embryos in metaphase of first cleavage (75 embryos per lane) were analyzed by western blot using antibodies against pTPxK CDK consensus antibodies, cyclin B, or alpha-tubulin, following injection of nontargeting control, cyclin A, or cyclin B morpholinos.
-
Figure 2—figure supplement 2—source data 1
Western blots following cyclin morpholino knockdown.
Western blots of embryos at metaphase of first cleavage (collected at 3 hr and 3 hr 10 min after hormone addition) using antibodies against pTPxK consensus, cyclin B (the specific band indicated with an asterisk), or alpha-tubulin.
- https://cdn.elifesciences.org/articles/70588/elife-70588-fig2-figsupp2-data1-v2.pdf
Figure 3 with 7 supplements
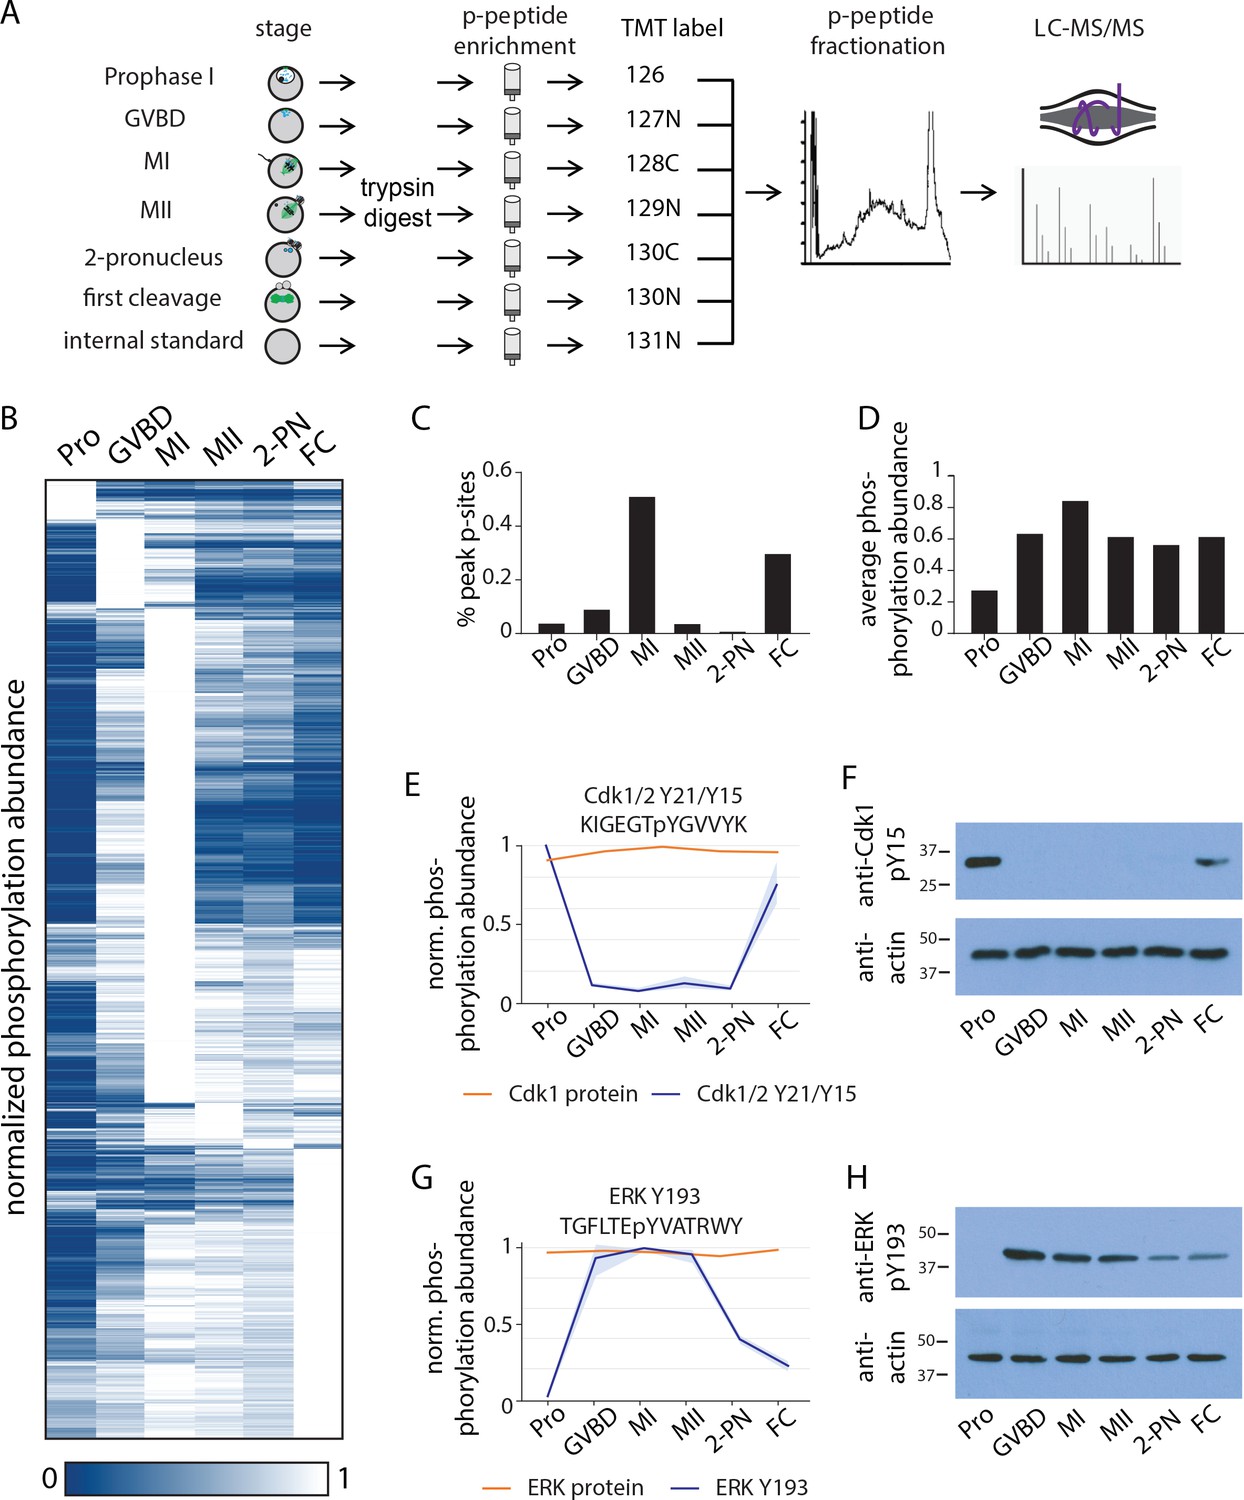
Identification of dynamic phosphorylation changes during the oocyte-to-embryo transition.
(A) Proteomics workflow diagram, in which a phosphopeptide enrichment step was performed prior to tandem mass tag (TMT) labeling. (B) Hierarchical clustering of 10,645 phosphorylation events (a localization score of 0.9 or higher, a p-value of 0.05 or less, and stage-specific peak phosphorylation) clustered by phosphosite (rows) and meiotic stage (columns). (C) Percentage of sites that reach their peak phosphorylation levels across stages, revealing peaks at meiosis I (MI) and first cleavage. (D) Average abundance of all phosphorylation events per stage. (E, G) Temporal phosphorylation levels of conserved sites on the kinase Cdk1/2 and the MAP kinase Erk (blue trace, light blue areas are standard deviations; orange trace represents total relative protein abundance). (H, F) Western blots with antibodies recognizing the inhibitory phosphorylation on Cdk1Y15 and activating phosphorylation on ERK Y193, respectively.
-
Figure 3—source data 1
Identification of dynamic phosphorylation changes during the oocyte-to-embryo transition.
Western blots with antibodies recognizing the inhibitory phosphorylation on Cdk1Y15 and activating phosphorylation on ERK Y193, respectively.
- https://cdn.elifesciences.org/articles/70588/elife-70588-fig3-data1-v2.pdf
Figure 3—figure supplement 1
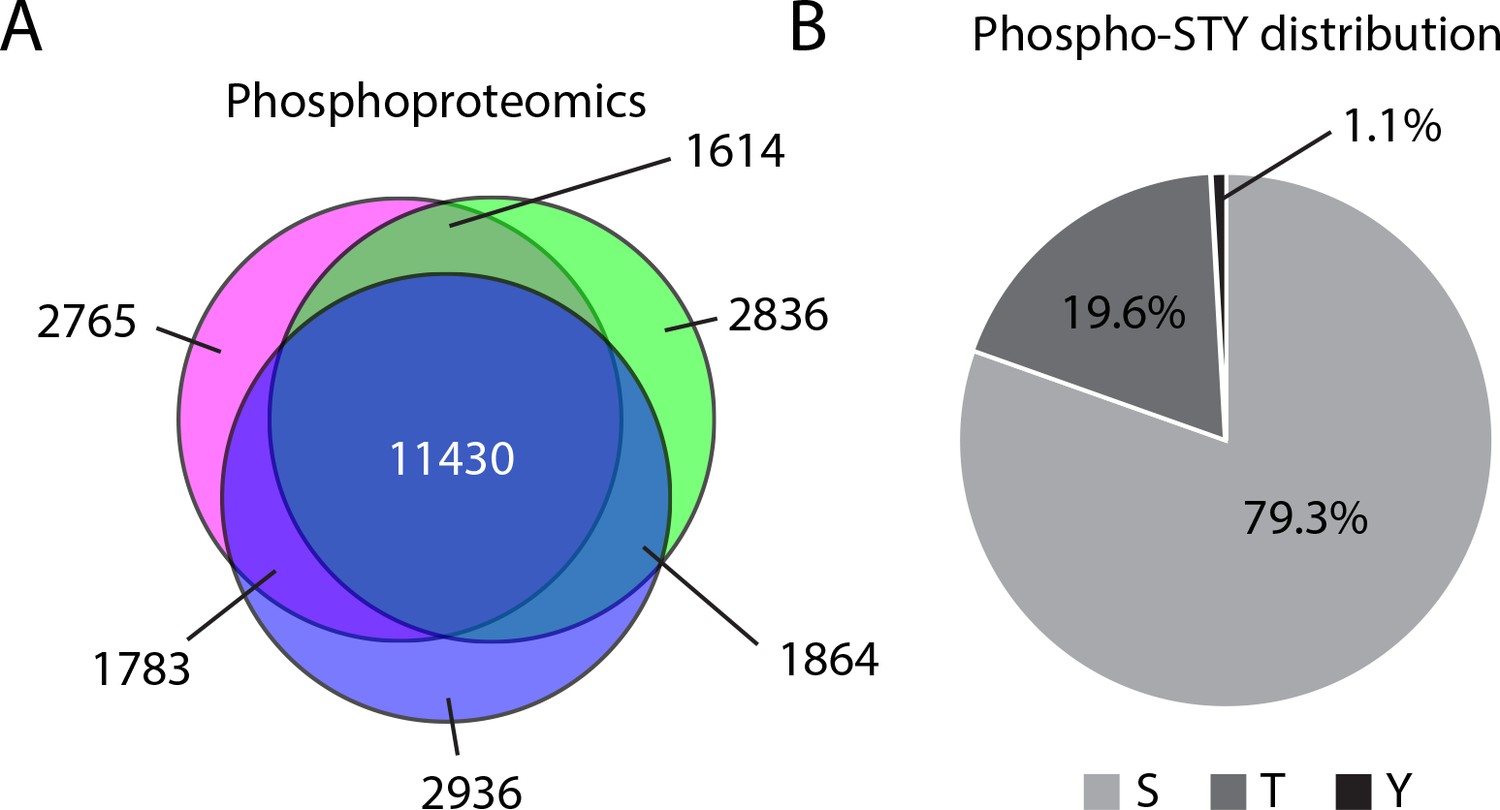
Mass spectrometry analysis of phosphorylation abundance.
(A) Venn diagram representation of the phosphorylation events identified across three biological replicates. (B) Distribution of phosphorylation sites identified by phosophoproteomics on serine, threonine, and tyrosine.
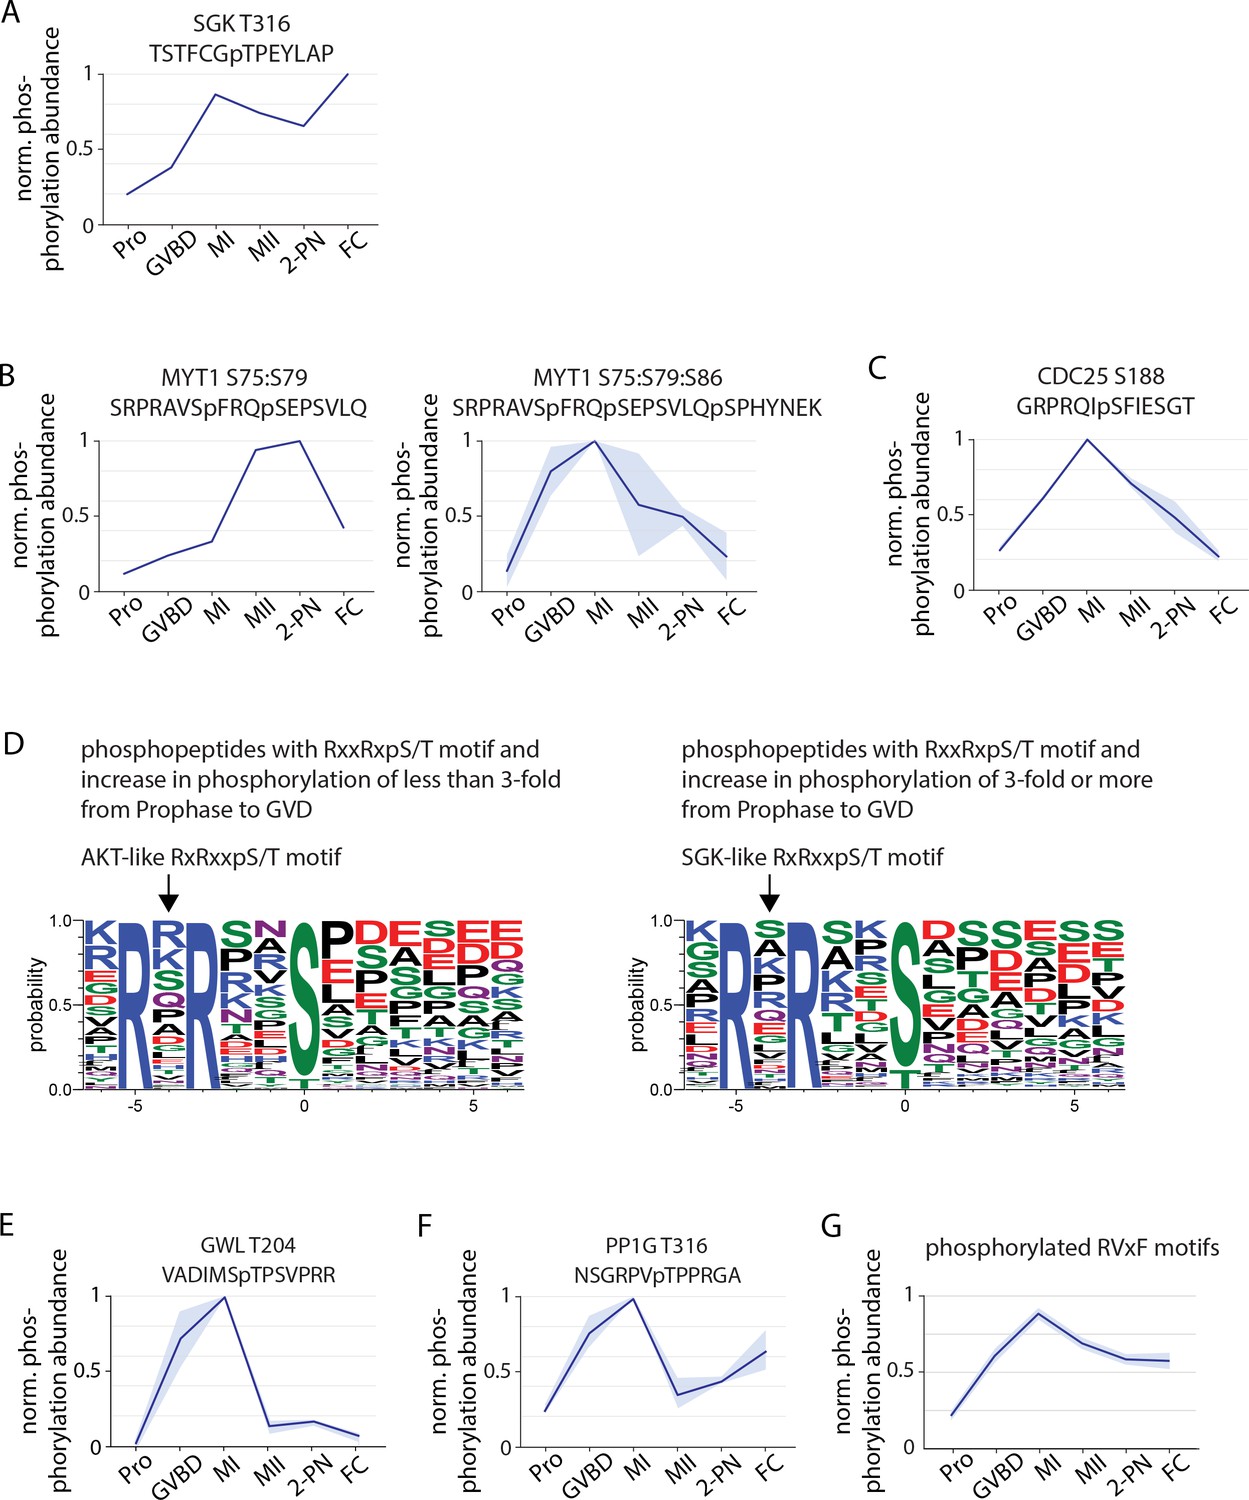
Figure 3—figure supplement 2
Phosphorylation behavior of cell cycle regulators.
(A) Phosphorylation profile of T316 within the activation segment of Serum- and Glucocorticoid-inducible Kinase (SGK). (B) Phosphorylation of double and triple phosphopeptides of Myt1 including S75, an SGK consensus site. (C) Phosphorylation of the SGK consensus site S188 on Cdc25. (D) Motif analysis of phosphopeptides with RxxRxpS/T motifs that undergo a greater than or less than threefold increase following germinal vesicle breakdown (GVBD). The more substantially changing sites more closely resemble an SGK-like consensus. (E) Phosphorylation profile of Greatwall kinase at T204, within its activation segment. (F) Phosphorylation of the conserved inhibitory site T316 on PP1G. (G) Average phosphorylation profile of RVxF motifs with a phosphorylated S or T at the ‘x’ position or within two amino acids before and after the RVxF motif. Light blue represents the standard deviation.
Figure 3—figure supplement 3
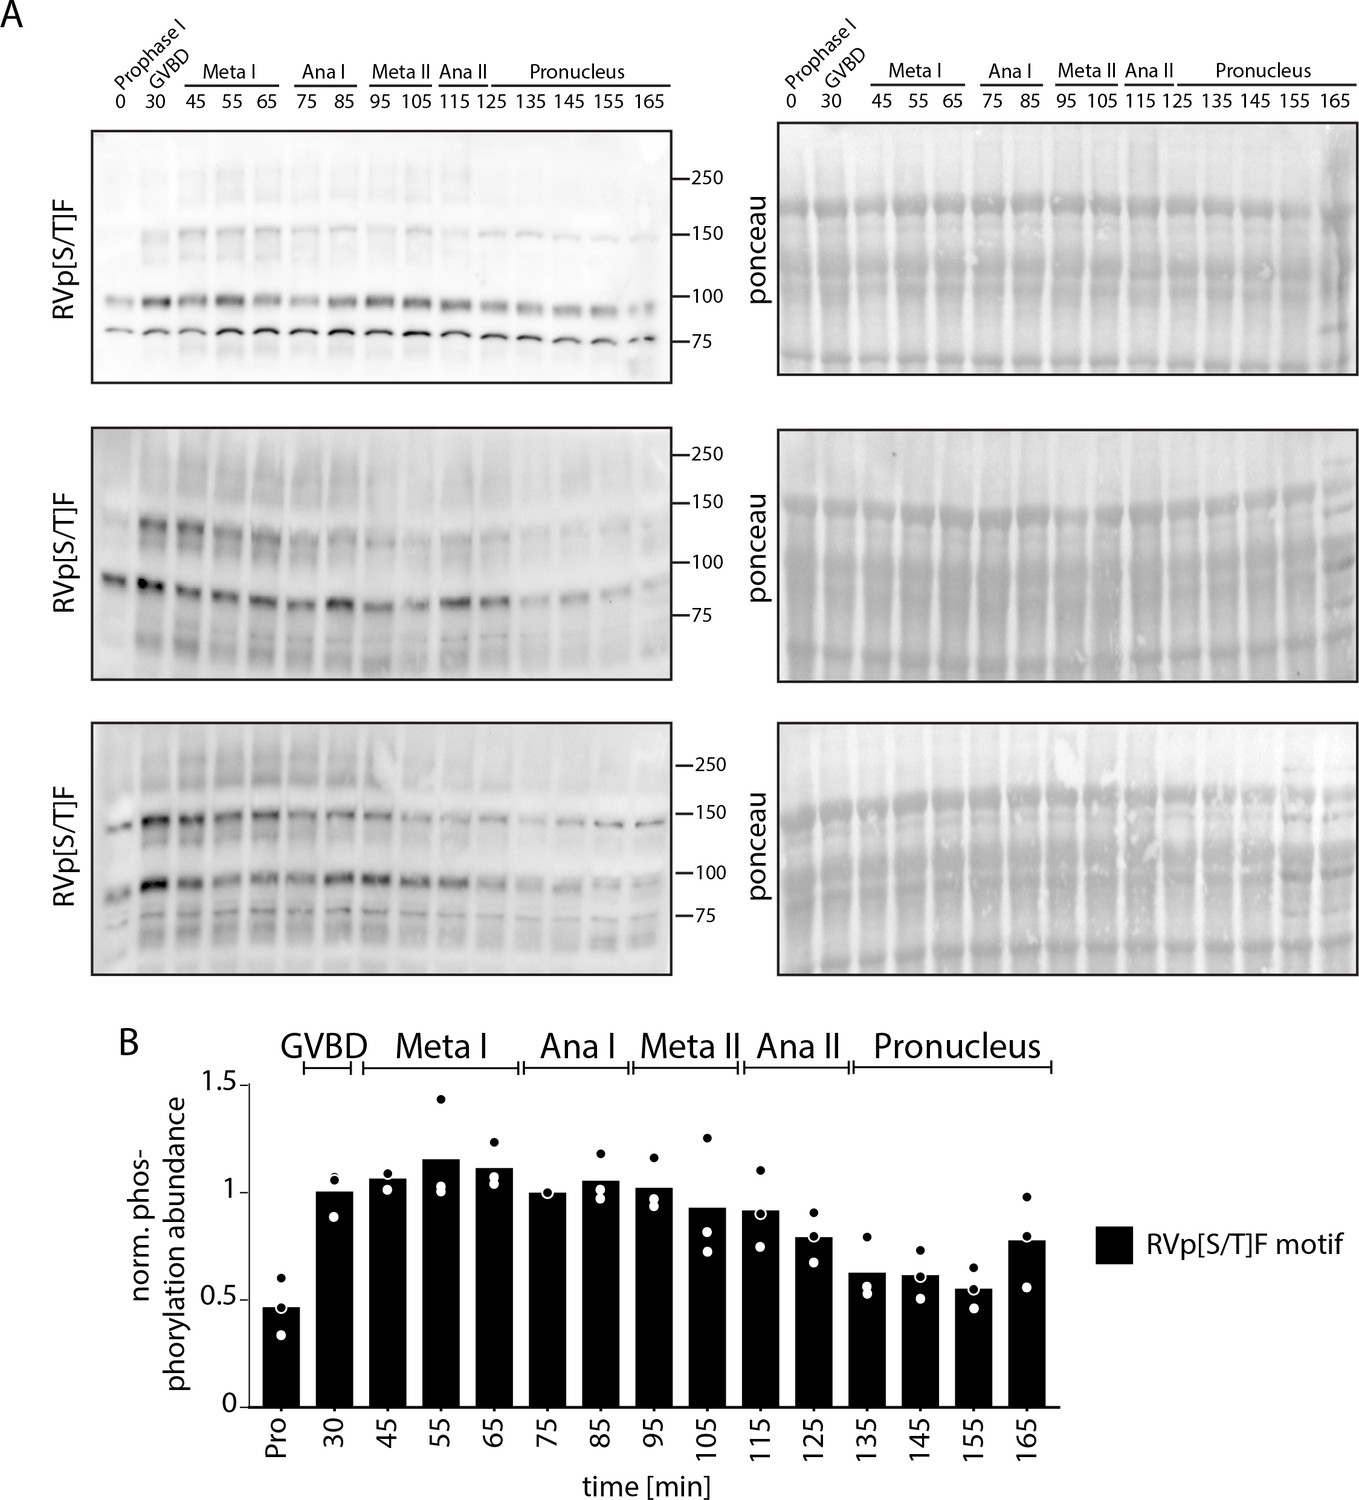
RVp[S/T]F motif phosphorylation.
(A) Time-course western blots of meiotic oocytes using antibodies against RVp[S/T]F motif. Ponceau staining is provided for loading control. (B) Quantification of western blots in (A).
-
Figure 3—figure supplement 3—source data 1
RVp[S/T]F western blots.
(A) Time-course western blots of meiotic oocytes using antibodies against RVp[S/T]F motif. Ponceau staining is provided for loading control.
- https://cdn.elifesciences.org/articles/70588/elife-70588-fig3-figsupp3-data1-v2.pdf
Figure 3—figure supplement 4
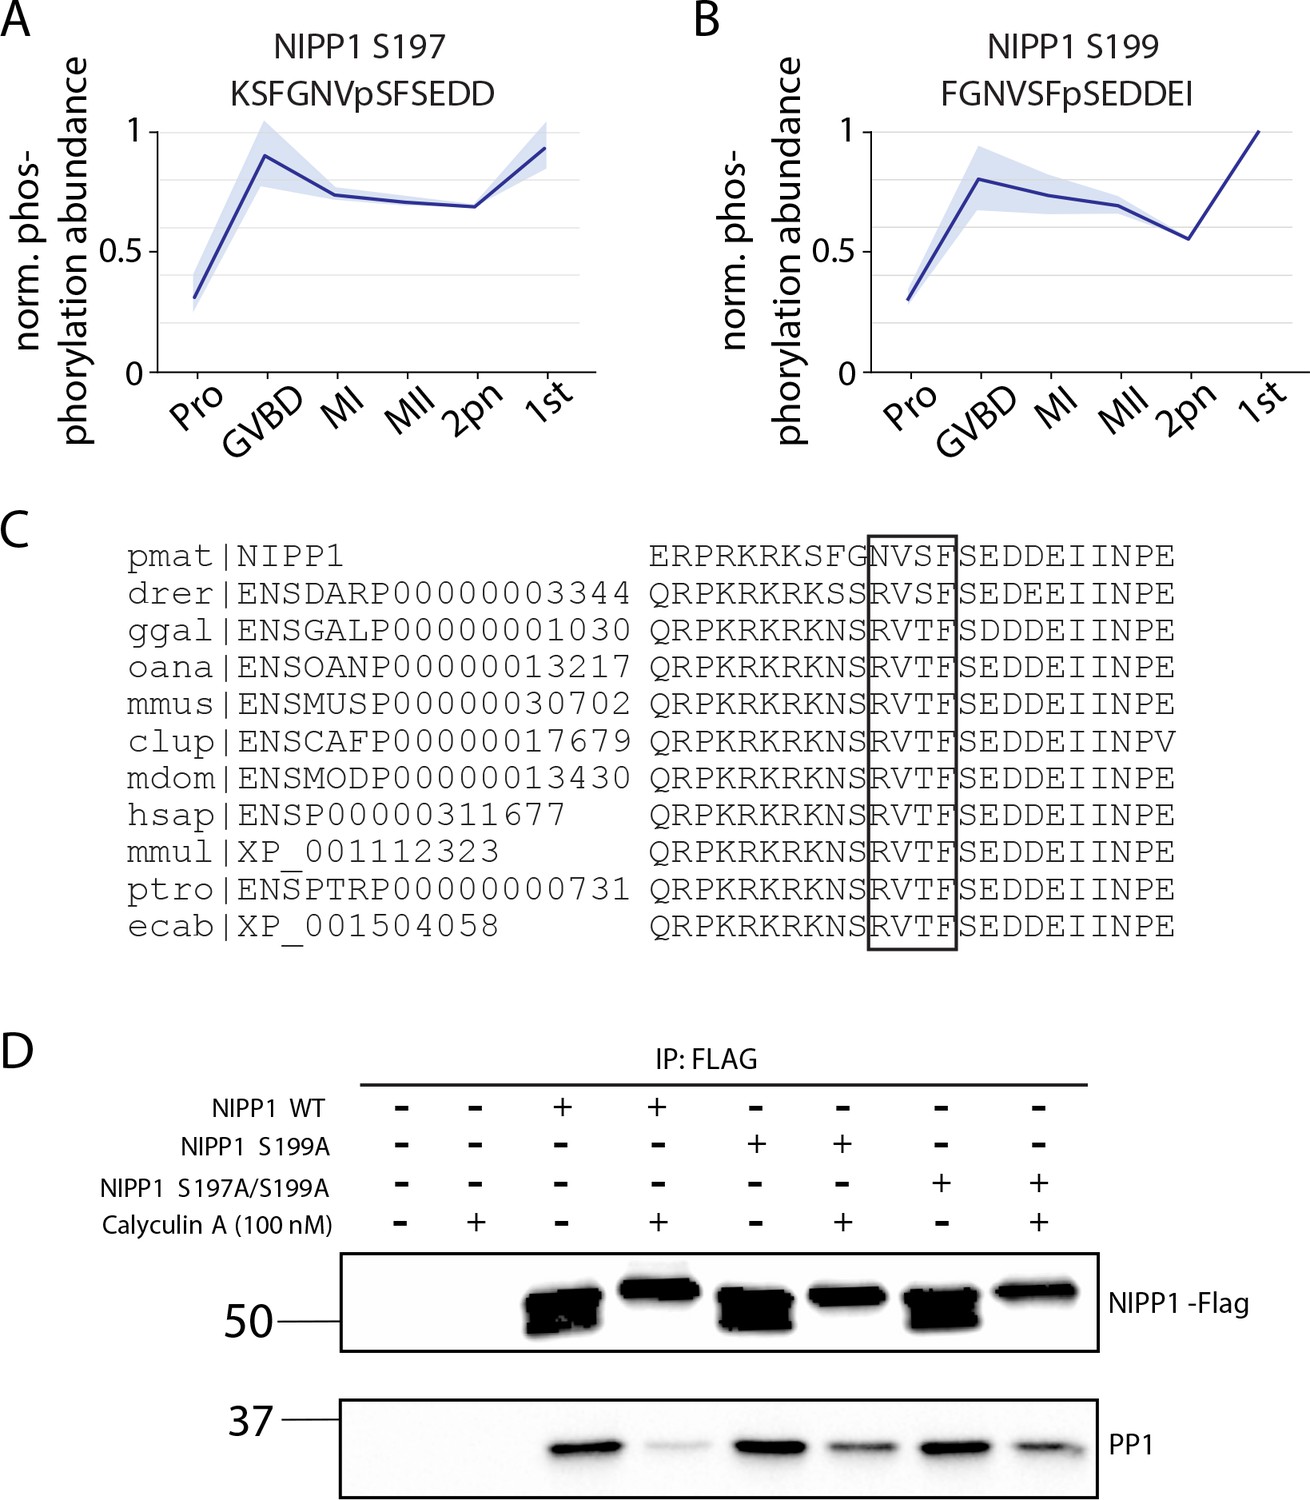
NIPP1 activity in arrest and meiosis.
(A, B) Phosphorylation of conserved nuclear inhibitor of PP1 (NIPP1) sites that disrupts their interaction with PP1. Light blue represents the standard deviation. (C) Sequence alignment of sea star NIPP1 with orthologs in Danio rerior (drer), Canis lupus (clup), Equus caballus (ecab), Homo sapiens (hsap), Monodelphis domestica (mdom), Macaca mulatta (mmul), Mus musculus (mmus), Ornithorhynchus anatinus (oana), Pan troglodytes (ptro), and Gallus gallus (ggal). (D) Immunoprecipitation of wild-type or phosphonull NIPP1 mutants tagged with FLAG, followed by western blot to test PP1 association. Calyculin treatment was performed to increase phosphorylation on NIPP1 that decreases association with PP1 (lane 4), but phosphonull mutations (S197A, S199A) increases the association with PP1 (compare lanes 6 and 8 to lane 4).
-
Figure 3—figure supplement 4—source data 1
NIPP1 and PP1 western blots.
Immunoprecipitation of wild-type or phosphonull nuclear inhibitor of PP1 (NIPP1) mutants tagged with FLAG, followed by western blot to test PP1 association.
- https://cdn.elifesciences.org/articles/70588/elife-70588-fig3-figsupp4-data1-v2.pdf
Figure 3—figure supplement 5
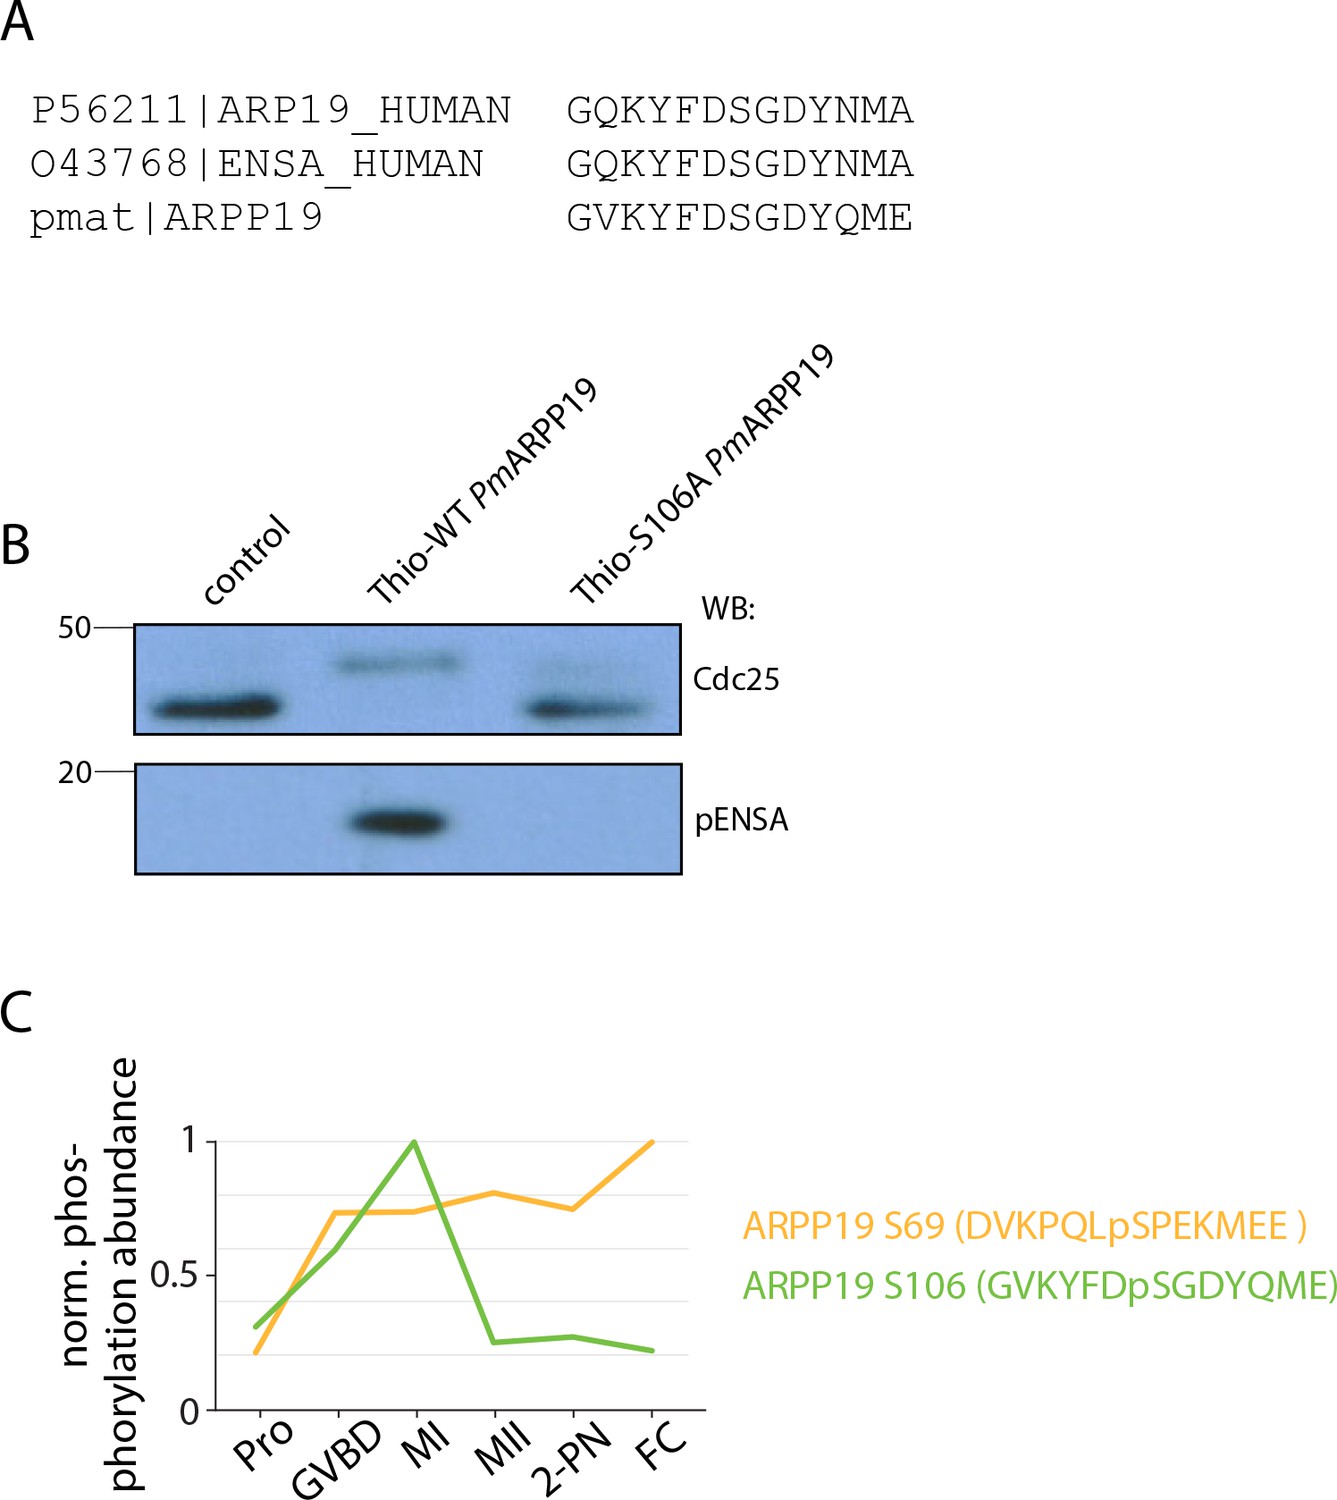
ARPP19 activity in arrest and meiosis.
(A) Sequence alignment of amino acids surrounding the Greatwall phosphorylation site on human ARPP19 and α-endosulfine (ENSA) and sea star ARPP19. (B) Western blot of Cdc25 and pENSA in control cell lysate (lane 1) or lysate to which thiophosphorylated PmArpp19WT (lane 2) or PmArpp19S106A (lane 3) was added. Thiophosphorylation of Arpp19WTresults in a phosphorylation shift of the band for PP2A-B55 substrate Cdc25, indicating inhibition of the phosphatase. (C) Temporal phosphorylation profile of the Greatwall phosphorylation on S106 and the Cdk phosphorylation on S69.
-
Figure 3—figure supplement 5—source data 1
ARPP19 activity in arrest and meiosis.
Western blot of Cdc25 and pENSA in control cell lysate (lane 1) or lysate to which thiophosphorylated PmArpp19WT (lanes 2, 4) or PmArpp19S106A (lanes 3, 5) was added.
- https://cdn.elifesciences.org/articles/70588/elife-70588-fig3-figsupp5-data1-v2.pdf
Figure 3—figure supplement 6
Phosphoprotein phosphatase function in arrested oocytes and meiosis.
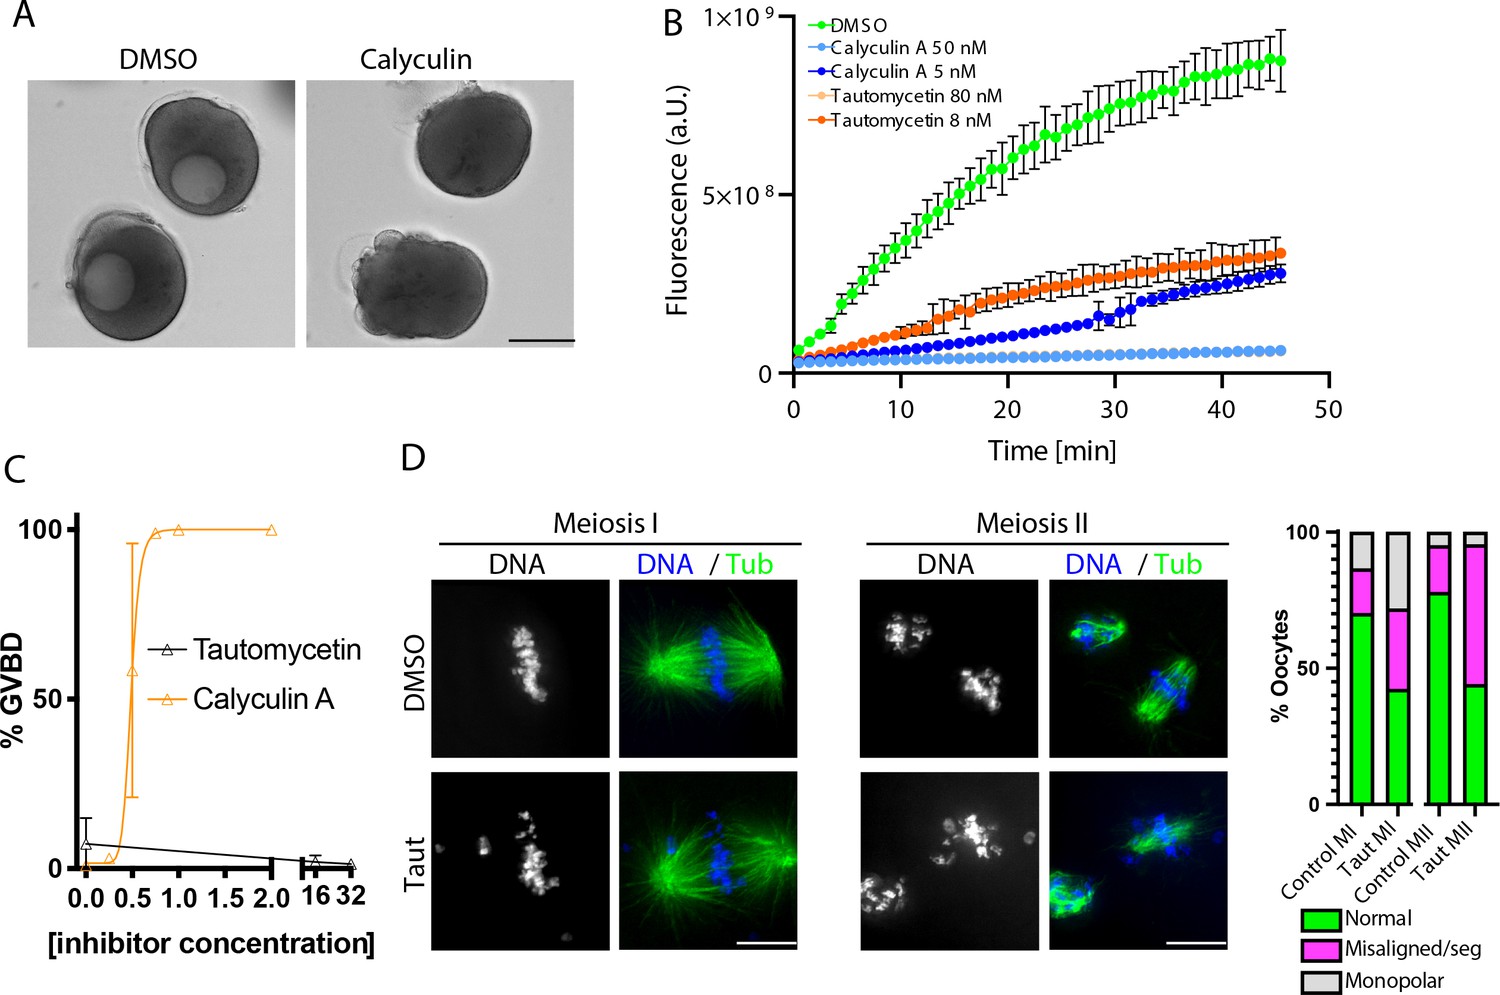
(A) Differential interference contrast (DIC) images of oocytes treated with dimethyl sulfoxide (DMSO) control or 1 μM calyculin A. (B) In vitro phosphatase assay using PP1c in the presence of the indicated concentrations of calyculin A and tautomycetin. (C) Dose responsivity curve of percentage of oocytes undergoing germinal vesicle breakdown (GVBD) in response to different concentrations of calyculin. Error bars represent the standard error of the mean of three experiments containing at least 50 oocytes per condition. (D) Immunofluorescence of oocytes in meiosis I (MI) or meiosis II (MII) treated with DMSO or 16 μM tautomycetin. Phenotypes are summarized with bar graphs to the left (MI: control n = 67, tautomycetin n = 78; MII: control n = 122, tautomycetin n = 109 oocytes).
Figure 3—figure supplement 7
Effect of phosphatase inhibition on phosphorylation, meiotic arrest, and resumption.
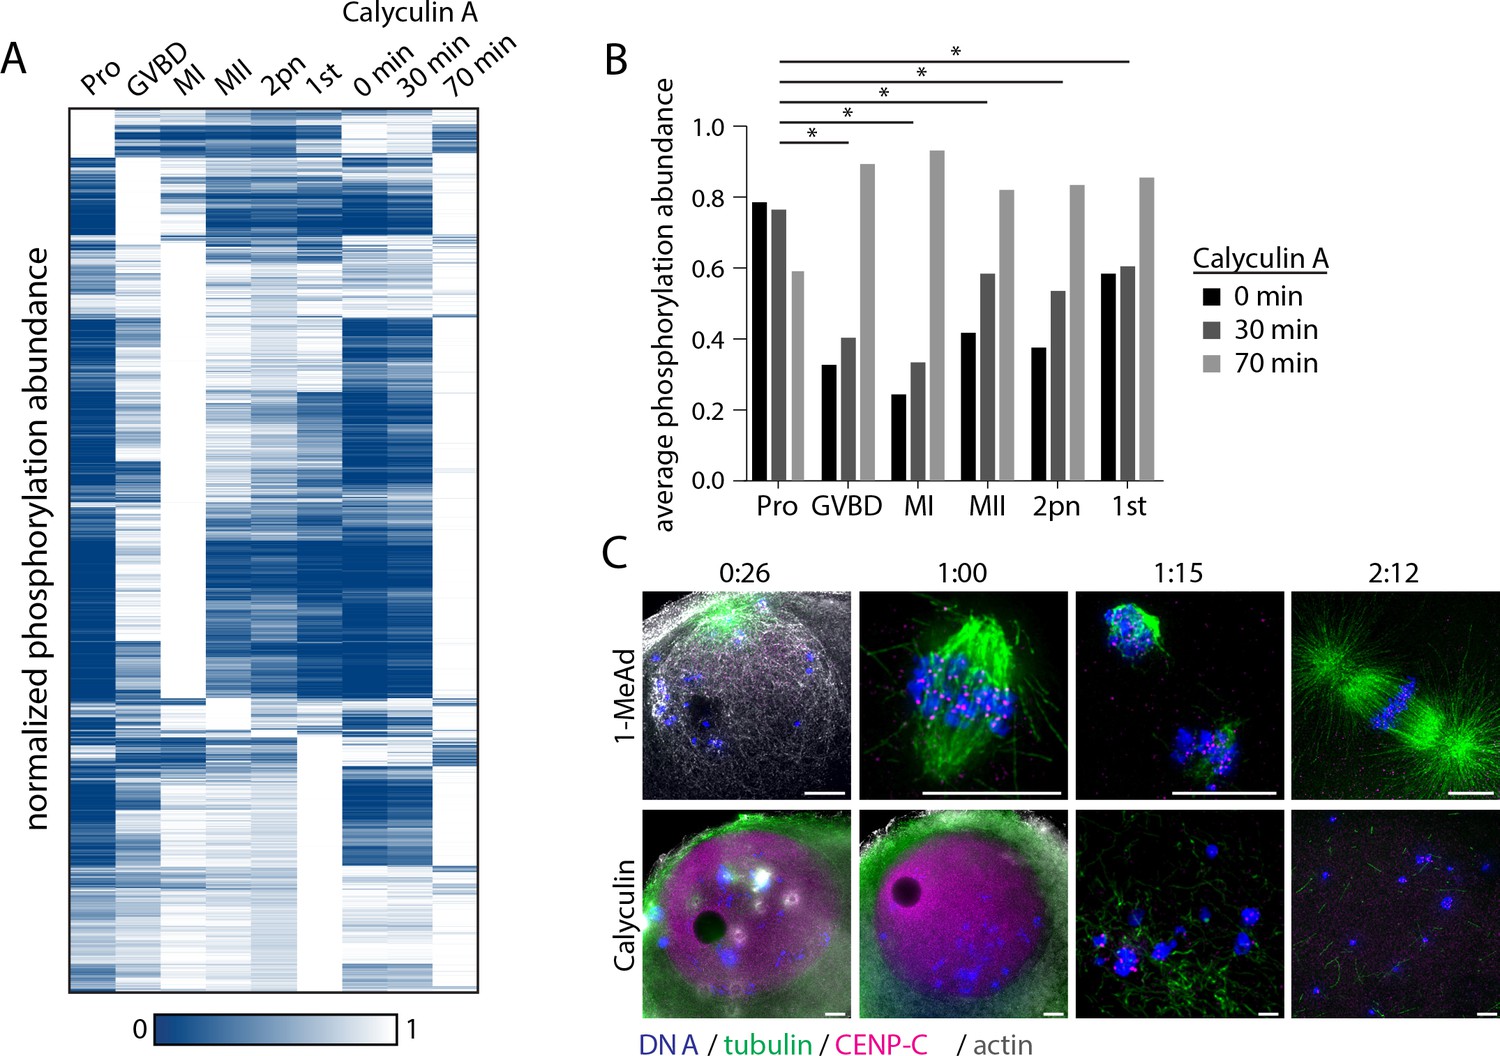
(A) Hierarchical clustering of phosphorylation events (a localization score of 0.9 or higher, a p-value of 0.05 or less, and stage-specific peak phosphorylation) clustered by phosphosite (vertically) and meiotic stage (columns) as in Figure 3B with phosphorylation changes upon calyculin A treatment. (B) Comparison of average phosphorylation abundance changes upon calyculin A treatment for 0 min, 30 min, or 70 min in a stage-specific manner. Statistical comparison was performed by Fisher’s exact test (*p-value<0.05). (C) Immunofluorescence images for tubulin, centromere protein C (CENP-C), and phalloidin staining for actin following stimulation with 1-methyladenine or calyculin. Scale bars = 10 μm.
Figure 4 with 2 supplements
Serine and threonine display distinct phosphorylation behaviors.
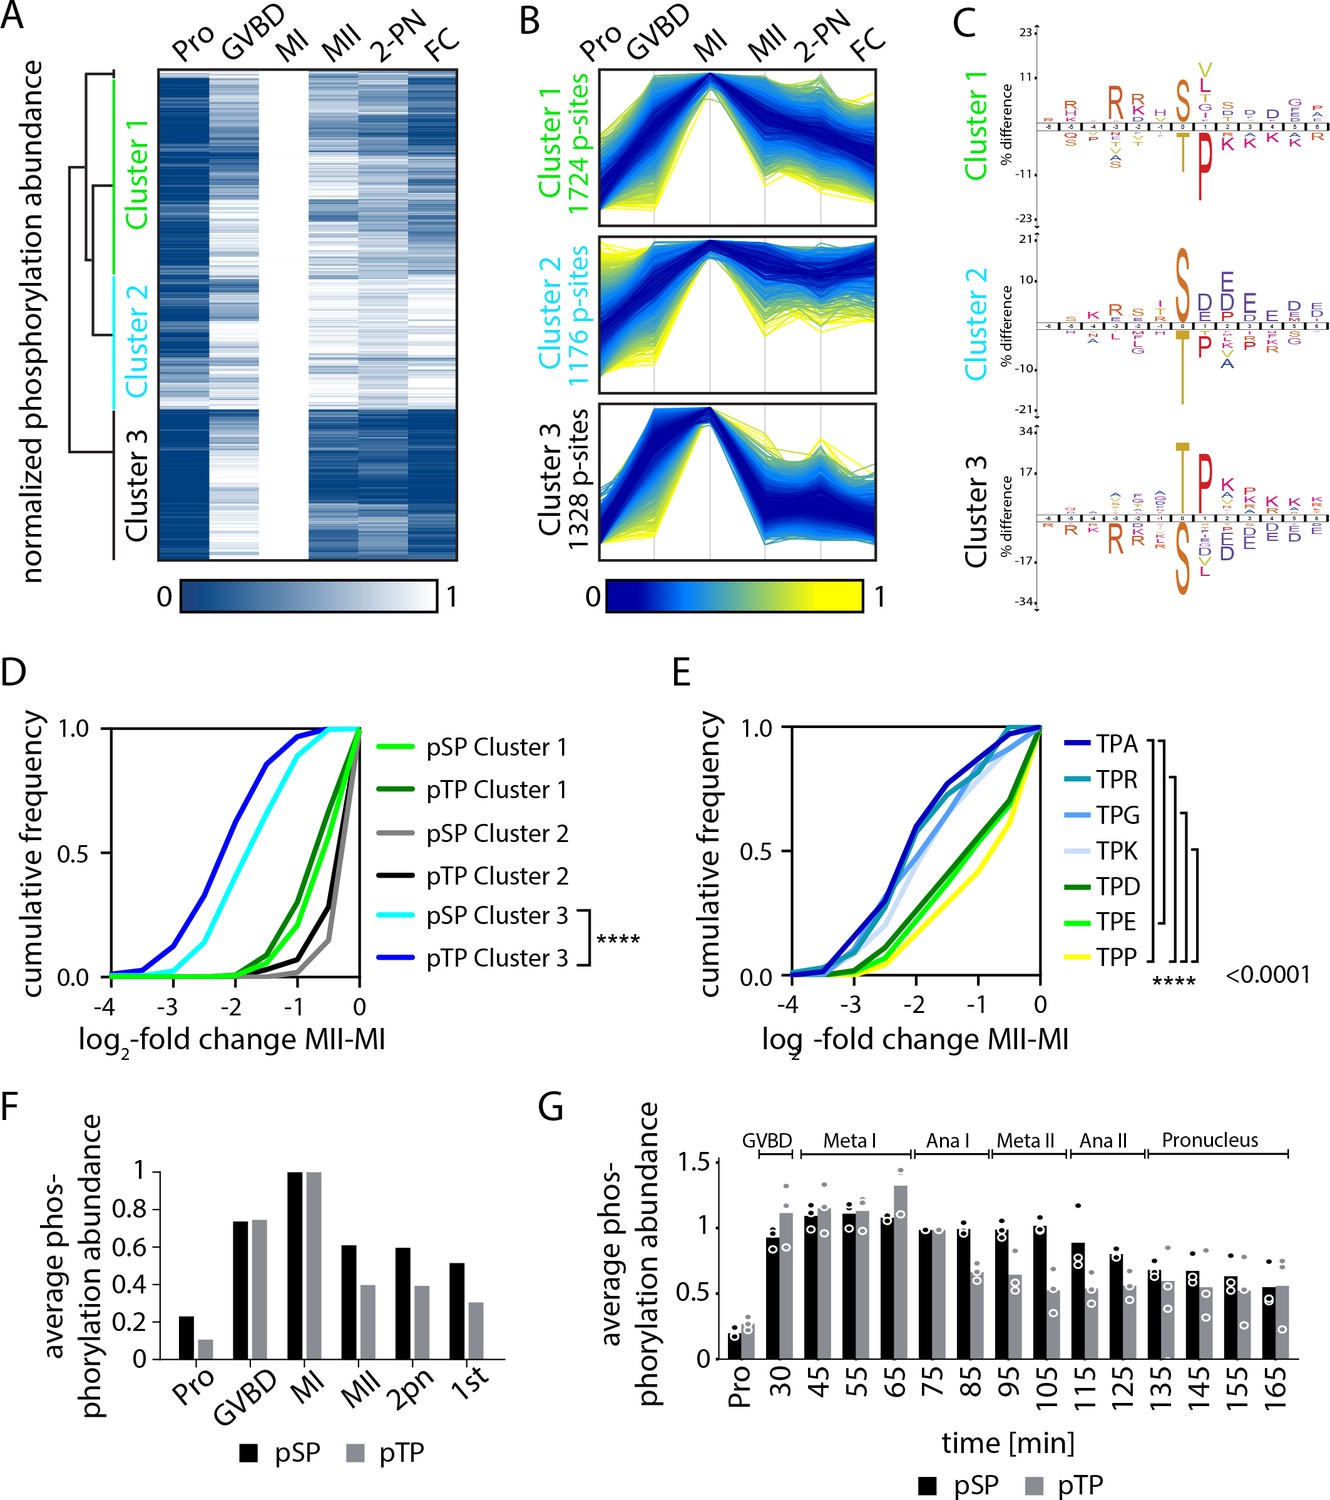
(A) Heatmap representation of a subset of sites that peak in phosphorylation in meiosis I (MI). Hierarchical clustering identifies three phosphorylation clusters with distinct temporal behaviors, indicated by green (cluster 1), cyan (cluster 2), and black (cluster 3) vertical lines. (B) Line graphs of temporal phosphorylation levels of sites within each of the three clusters. Color scale represents the distance from the mean. The number of single phosphorylation sites is indicated. (C) Sequence logos for over and underrepresented motifs within the three clusters. Threonine with proline in the +1 position followed by basic amino acids is overrepresented in cluster 3, which is dephosphorylated after MI. In contrast, cluster 3 is depleted for serine followed by acidic amino acids. Instead, cluster 1, which is more stably phosphorylated, is enriched for serine but depleted for threonine as the phosphoacceptor. (D) Cumulative frequency distribution of phosphopeptides with proline-directed serine or threonine phosphorylation. Significant differences in the population distribution as determined by Kolmogorov-Smirnov (KS) statistics (****p<0.0001). Only cluster 2 shows a significant difference in the dephosphorylation of SP vs TP phosphorylation sites. (E) Cumulative frequency distribution of phosphopeptides with proline-directed threonine phosphorylation with different amino acids in the +2 position. Only the most significant differences are indicated (****p<0.0001). (F) The average phosphorylation abundance of sites that peak in MI, comparing threonine (black bar) vs serine (gray bars) phosphorylation sites across stages as determined by phosphoproteomics. (G) Quantification of western blots with an antibody recognizing phosphorylated TPxK vs K/HpSP, revealing distinct behaviors at the meiosis I/meiosis II (MI/MII) transition for these phosphorylation sites.
Figure 4—figure supplement 1
Differential behavior of serine and threonine phosphorylation sites.
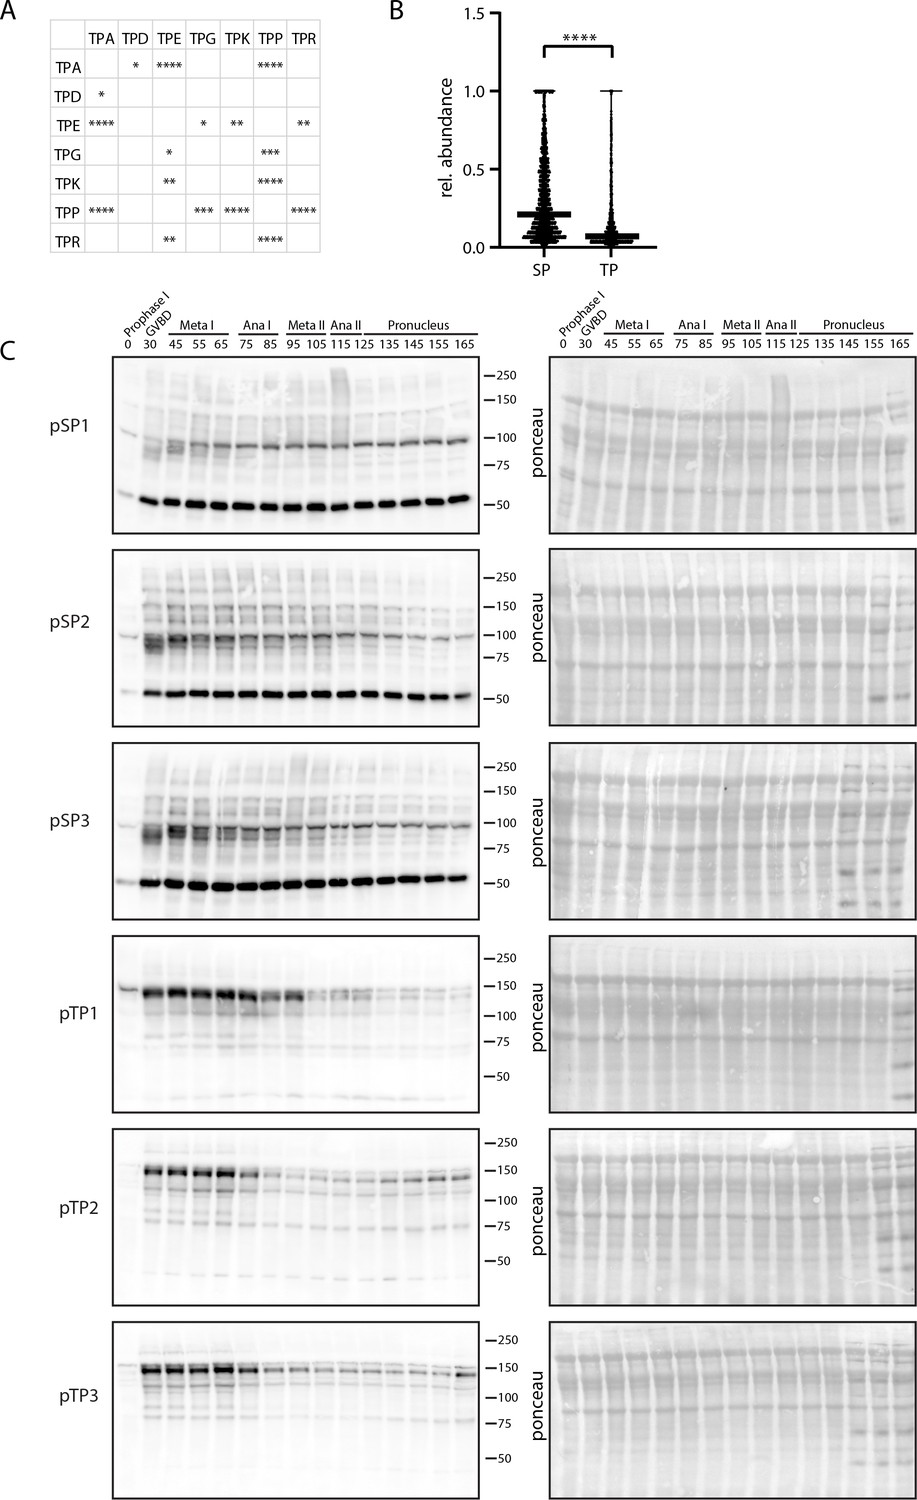
(A) Table depicting all significant differences in the population distribution as determined by Kolmogorov-Smirnov (KS) statistics in Figure 4E (*p<0.05, **p<0.01, ***p<0.001, ****p<0.0001). (B) Relative abundance of single, localized SP vs TP phosphorylation sites in prophase I arrest. TP site abundances are significantly lower on average, suggesting these sites are more readily opposed by phosphatase activity. (C) Time-course western blots of meiotic oocytes using antibodies against pTPxK or (H/K)pSP. Ponceau staining is provided for loading control.
-
Figure 4—figure supplement 1—source data 1
Differential behavior of serine and threonine phosphorylation sites.
Time-course western blots of meiotic oocytes using antibodies against (H/K)pSP or pTPxK, respectively. Ponceau staining is provided for loading control.
- https://cdn.elifesciences.org/articles/70588/elife-70588-fig4-figsupp1-data1-v2.zip
Figure 4—figure supplement 2
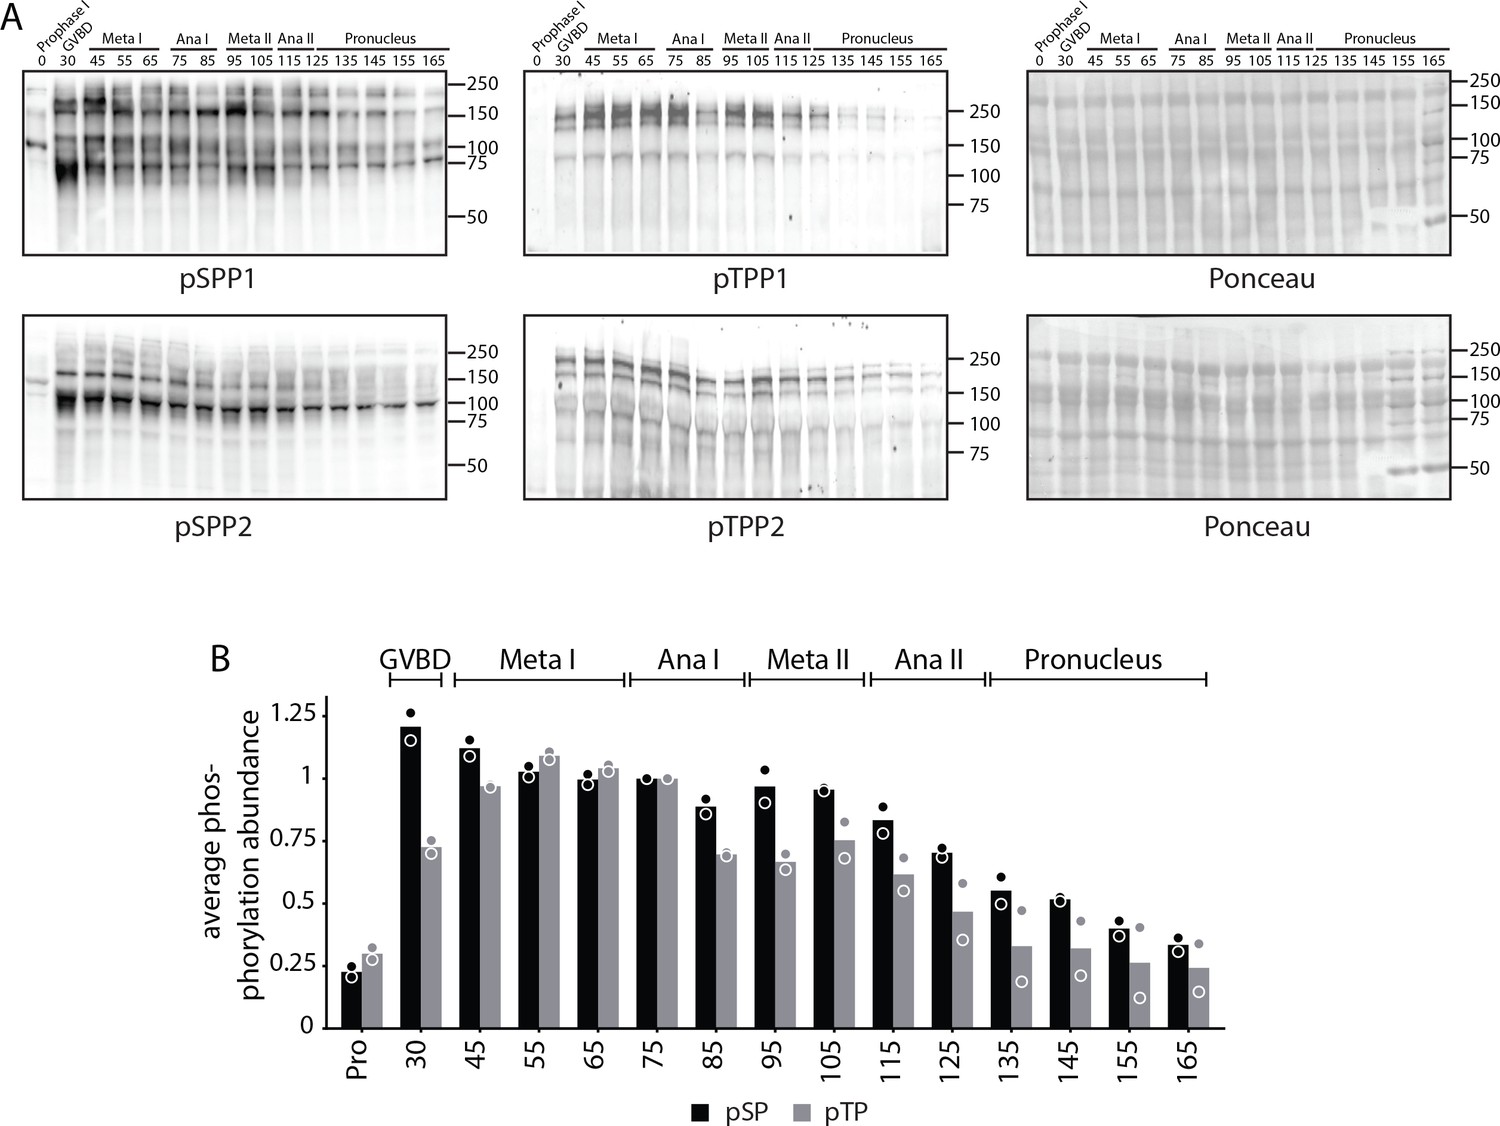
Analysis of pSPP and pTPP phosphorylation site motifs.
(A) Time-course western blots of meiotic oocytes using antibodies against pSPP or pTPP. Ponceau staining is provided for loading control. (B) Quantification of western blots in (A).
-
Figure 4—figure supplement 2—source data 1
Analysis of pSPP and pTPP phosphorylation site motifs.
Time-course western blots of meiotic oocytes using antibodies against pSPP or pTPP. Ponceau staining is provided for loading control.
- https://cdn.elifesciences.org/articles/70588/elife-70588-fig4-figsupp2-data1-v2.pdf
Figure 5 with 3 supplements
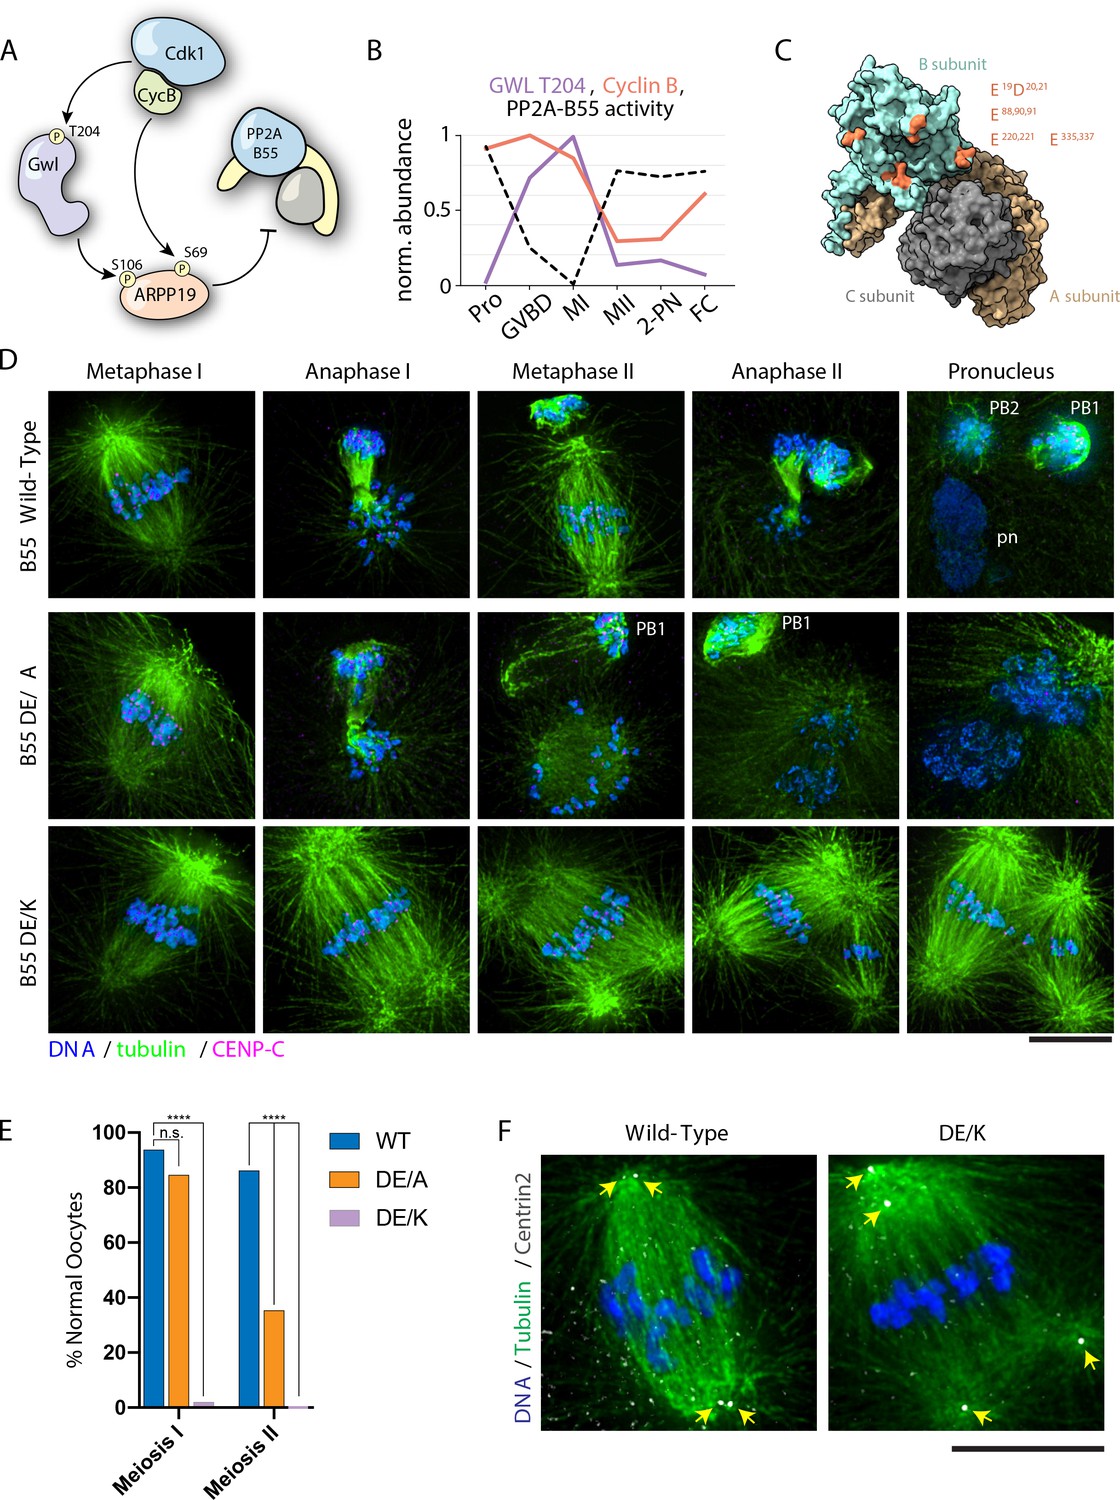
PP2A-B55 substrate specificity is required for the MI/MII transition.
(A) Schematic of the Cdk-Gwl-ARPP19 pathway regulating PP2A-B55. (B) Relative phosphorylation levels of Gwl T204 and protein abundance of cyclin B. PP2A-B55 activity trace values are derived from the substrates in Figure 5—figure supplement 3A–C (1-mean phosphorylation levels). (C) Crystal structure of PP2A holoenzyme with the B subunit colored cyan. Mutated residues within the acidic surface are indicated in orange. (D) Immunofluorescence of meiotic time course of oocytes expressing wild-type or mutant B55 constructs. In contrast to wild-type oocytes, DE/A mutants successfully complete MI but fail in MII. The DE/K mutant oocytes successfully form the first meiotic spindle but fail to undergo homologous chromosome or sister centromere separation. The spindle poles do separate, ultimately resulting in two semi-distinct spindles. Microtubules were scaled nonlinearly. (E) Percentage of oocytes successfully completing MI and MII (control n = 65, DE/A n = 65, DE/K n = 49 oocytes; ****p<0.0001 by Fisher’s exact test). (F) Centrin2 staining of B55 wild-type- and DE/K mutant-expressing oocytes stained for Centrin2 reveals centriole separation at the spindle poles. Scale bars = 10 μm.
Figure 5—figure supplement 1
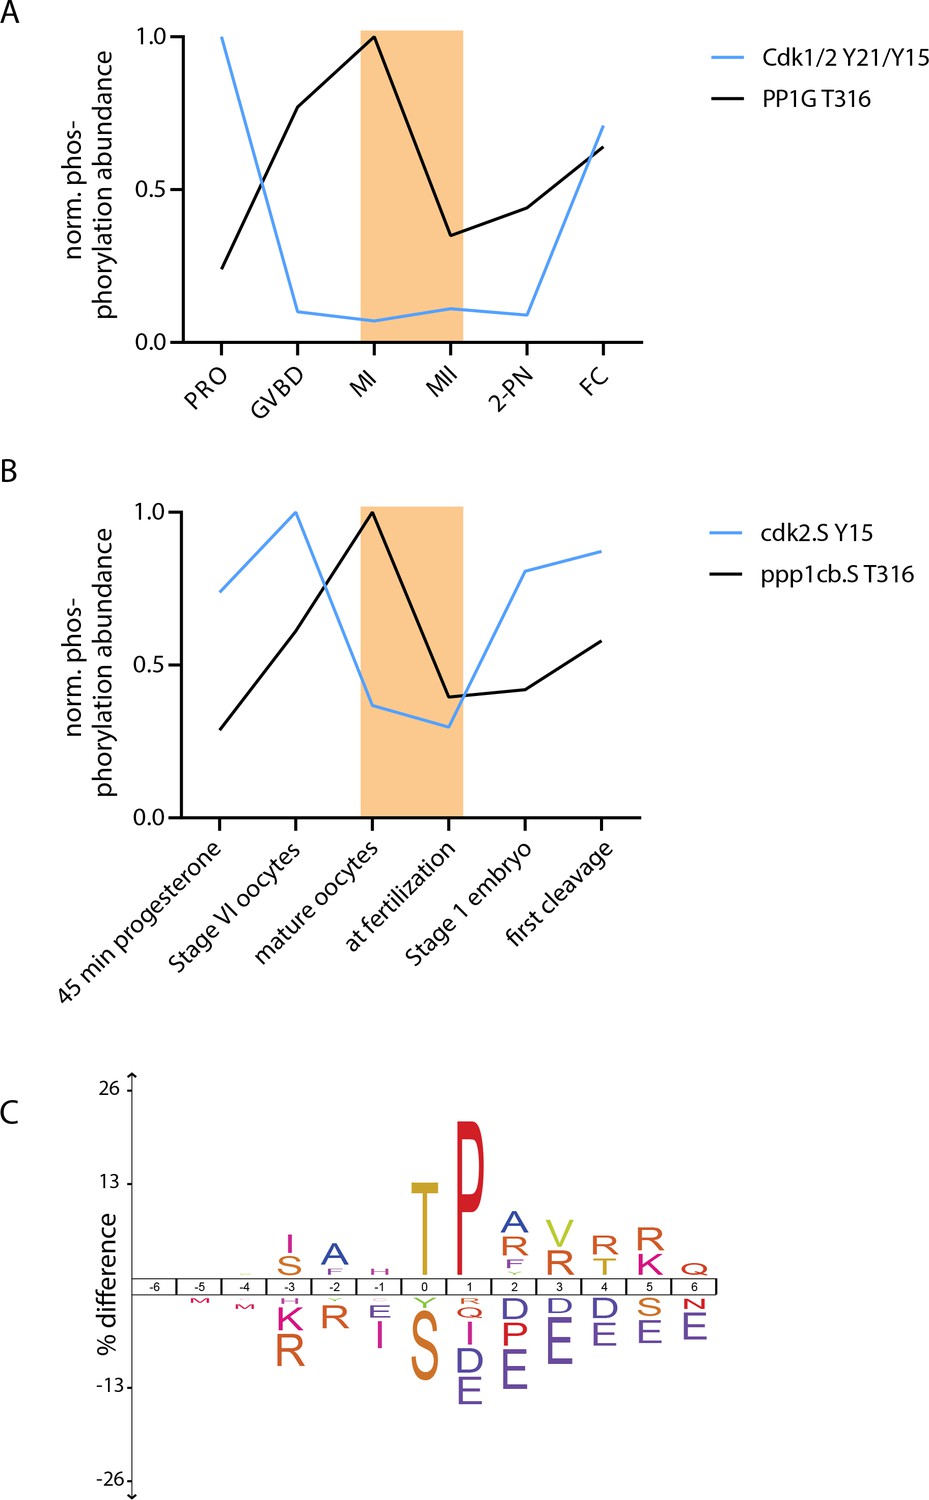
Conservation of threonine-serine behaviors in Xenopus laevis.
(A, B) Regulatory phosphorylations on Cdk1/2 and PP1 were used to determine the temporal correspondence between our sea star time course (A) and a previously published Xenopus laevis dataset (Peuchen et al., 2017). Using these phosphorylation signatures, we chose to compare the ‘mature oocyte’ and ‘at fertilization’ samples from X. laevis, indicated with orange rectangles. (C) Motif analysis of phosphorylation events that decrease by at least threefold in levels from ‘mature oocyte’ to ‘at fertilization’ time points revealed an enrichment for TP-basic sequences and depletion for SP-acidic sequences compared to all other phosphorylation sites identified in this analysis. This is in striking similarity to the MI/MII transition in sea stars.
Figure 5—figure supplement 2
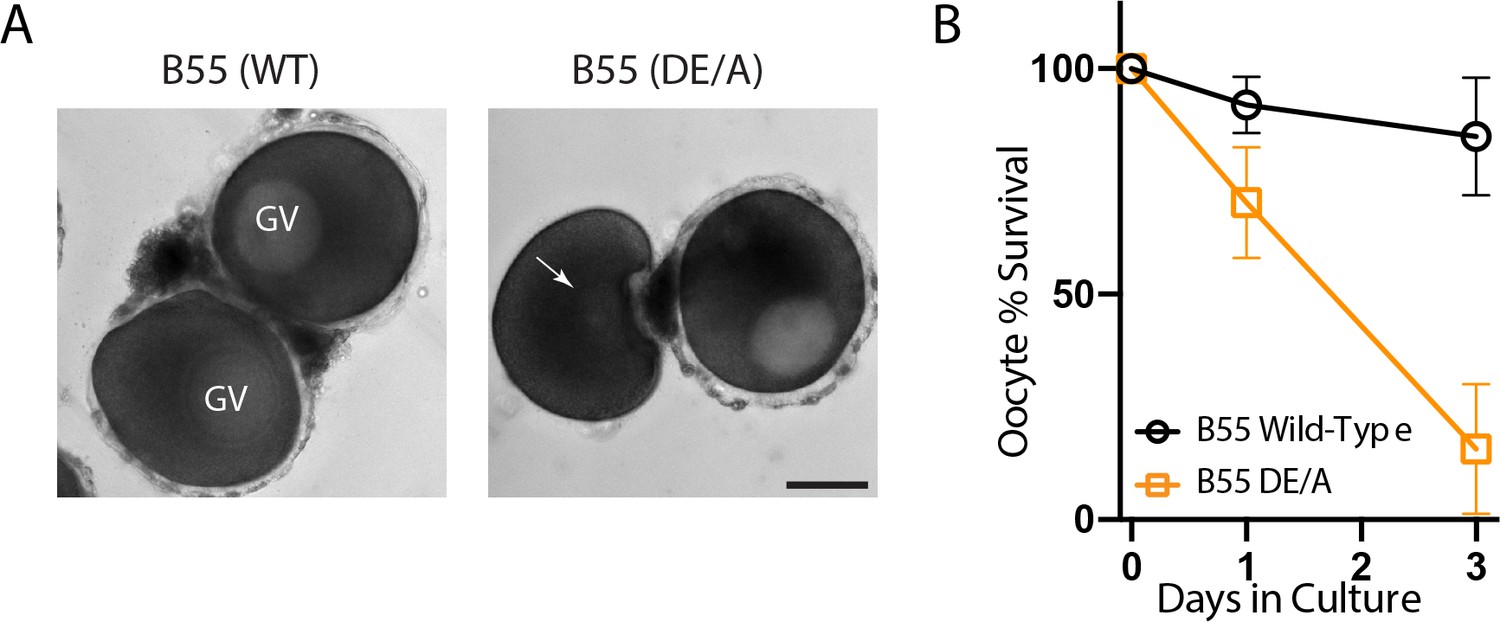
Mutant PP2A-B55 expression disrupts prophase I arrest.
(A) Oocytes expressing wild-type B55 or B55DE/A following 24 hr of in vitro culture. Scale bars = 100 μm. (B) Percentage of surviving arrested oocytes with intact germinal vesicles over 3 days of in vitro culture.
Figure 5—figure supplement 3
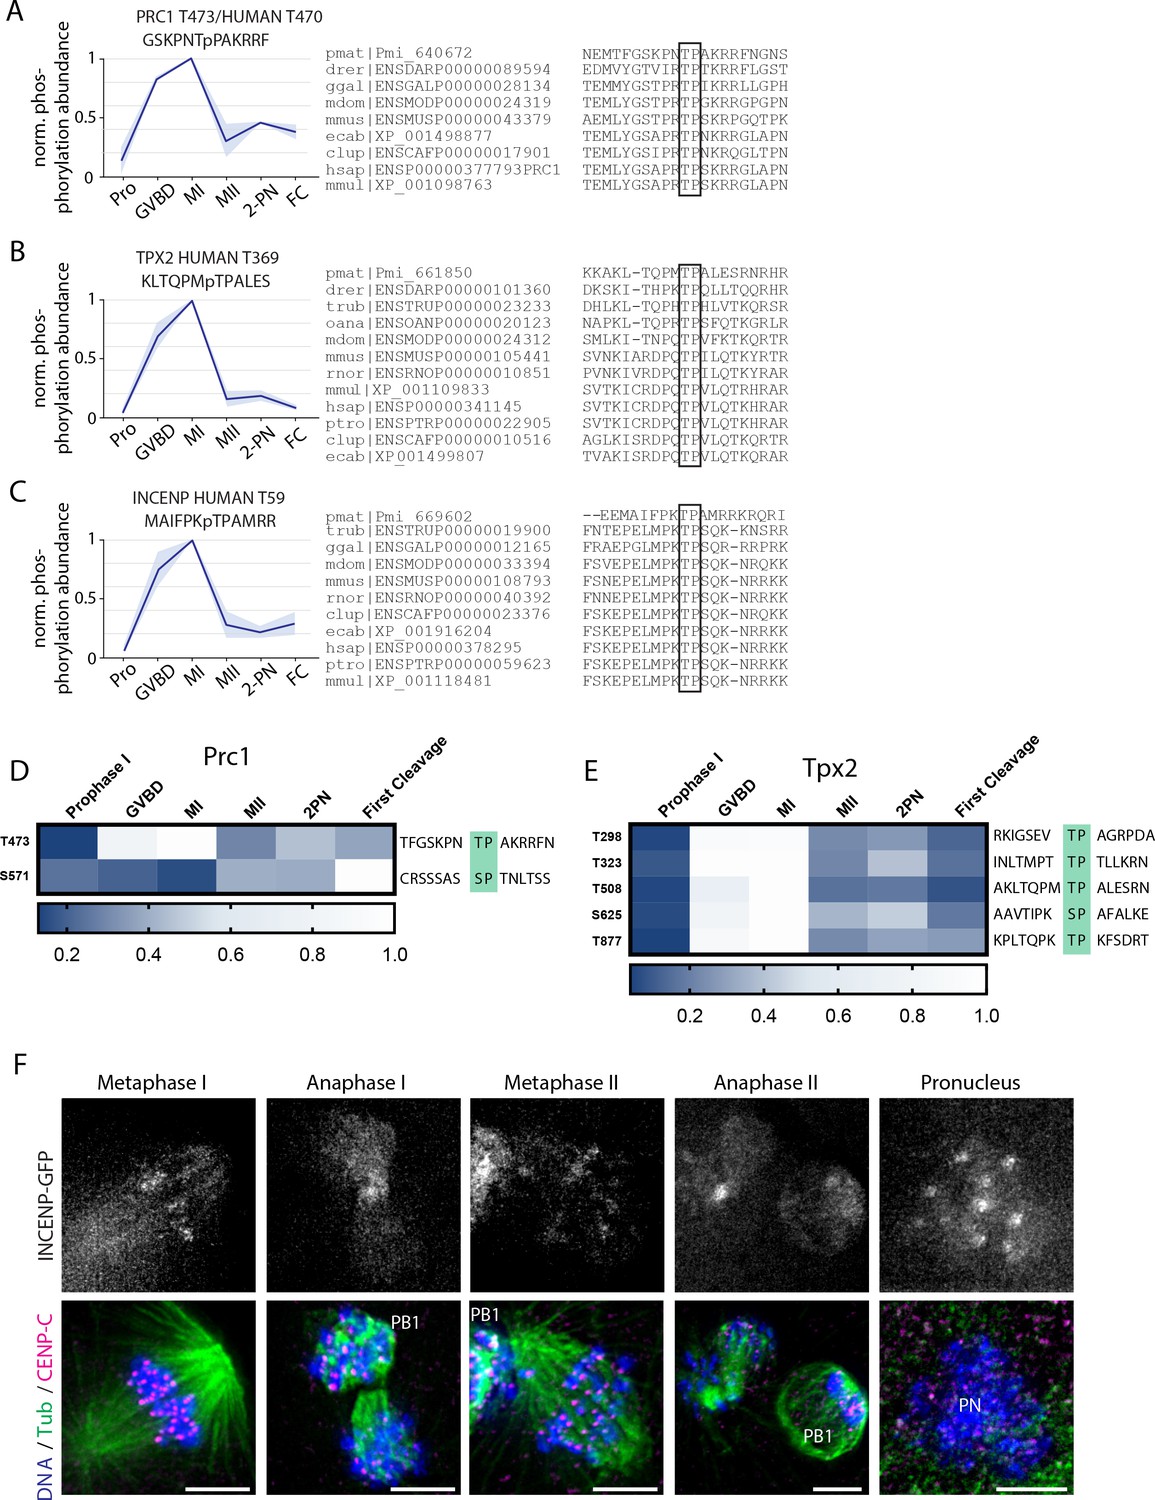
Phosphorylation behavior of conserved PP2A-B55 substrates.
(A–C) Relative phosphorylation levels and sequence alignment of PP2A-B55-dependent sites on PRC1, TPX2, and INCENP with orthologs in Danio rerior (drer), Canis lupus (clup), Equus caballus (ecab), Homo sapiens (hsap), Monodelphis domestica (mdom), Macaca mulatta (mmul), Mus musculus (mmus), Ornithorhynchus anatinus (oana), Pan troglodytes (ptro), Gallus gallus (ggal), Takifugu rubripes (trub), and Rattus norvegicus (rnor). Light blue shading represents standard deviation. (D, E) Heat map representation of TP and SP sites on Prc1 (D) and Tpx2 (E). (F) Immunofluorescence of INCENP-GFP during meiosis I and meiosis II. Scale bars = 5 μm.
Figure 6

Dephosphorylation of a conserved threonine is necessary for INCENP localization.
(A) Heatmap representation of relative phosphorylation levels of sites identified by phosphoproteomics. Phospho-centered amino acid sequences are provided on the right. (B) Immunofluorescence images of oocytes expressing INCENP-GFP in meiosis I along with either wild-type B55 or the DE/A mutant. DE/A expression reduces translocation of INCENP-GFP to the central spindle. Images are scaled individually to aid in visualization of localization changes. (C) Pixel intensity quantification of the unscaled midzone INCENP signal with wild-type or DE/A B55 expression (control n = 22, DE/A n = 13 oocytes; error bars represent mean and standard deviation; **p = 0.0014, Mann-Whitney test). (D) Immunofluorescence images of oocytes expressing wild-type INCENP-GFP or INCENPT61S. Wild-type INCENP translocates from centromeres to the central spindle in anaphase, whereas INCENPT61S increases at centromere localization but not at the central spindle. Images are scaled individually to aid in visualization of localization changes. (E) Pixel intensity quantitation of unscaled oocyte images at centromeres or central spindles in anaphase of meiosis I (WT n = 16, T61S n = 10 oocytes; error bars represent mean and standard deviation; *p = 0.0122, ****p<0.0001, Mann-Whitney test).
Author response image 1
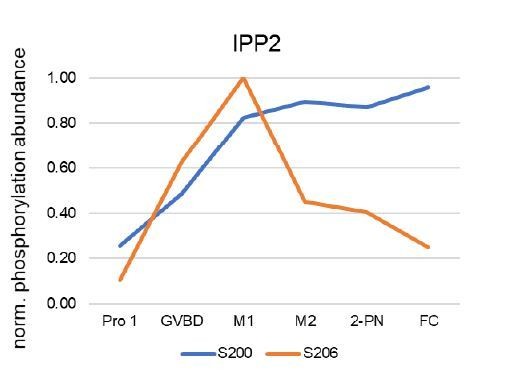
IPP2 phosphorylation sites.
Author response image 2
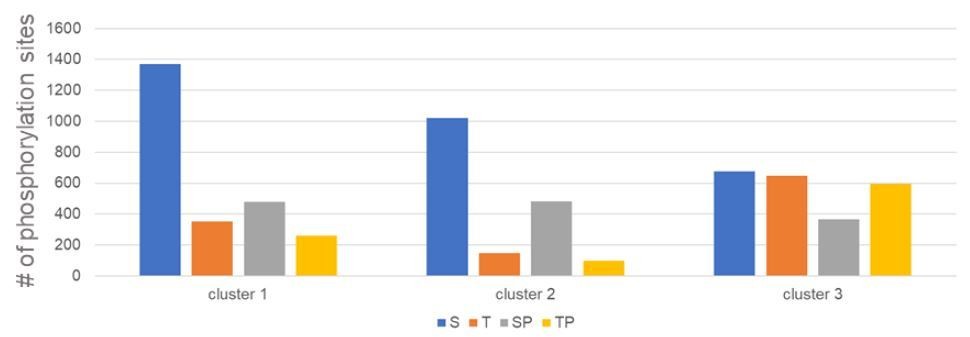
Distribution of S and T residues, and SP and TP motifs in Cluster 1 3.
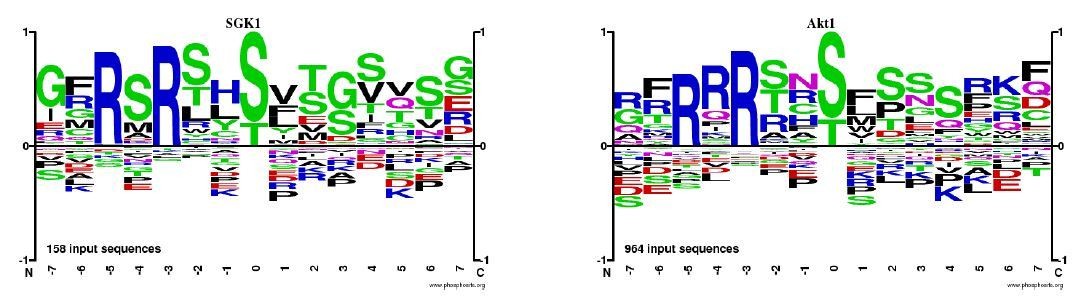
Author response image 3
Tables
Key resources table
| Reagent type (species) or resource | Designation | Source or reference | Identifiers | Additional information |
|---|---|---|---|---|
| Strain, strain background (Patiria miniata) | South Coast Bio, LLC | Wild-caught animals | ||
| Antibody | Anti-CENP-C (rabbit polyclonal) | Swartz et al., 2019 | IF(1:5000) | |
| Antibody | Anti-cyclin B (rabbit polyclonal) | Ookata et al., 1992 | WB(1:1000) | |
| Antibody | Anti-alpha tubulin, DM1alpha (mouse monoclonal) | Sigma-Aldrich | Cat# T9026, RRID:AB_477593 | IF(1:5000) |
| Antibody | Anti-phoshpo-Cdk1 Y15 | Cell Signaling Technologies | Cat# 4539 | WB(1:3000) |
| Antibody | Anti-phospho ERK1/2 T202/Y204 | Cell Signaling Technologies | Cat# 9101 | WB(1:3000) |
| Antibody | Anti-pTPxK CDK consensus | Cell Signaling Technologies | Cat# 14371 | WB(1:3000) |
| Antibody | Anti-(K/H)pSP CDK consensus | Cell Signaling Technologies | Cat# 9477 | WB(1:3000) |
| Antibody | Anti-pTPP CDK consensus | Cell Signaling Technologies | Cat# 5757 | WB(1:3000) |
| Antibody | GFP booster | Chromotek | gba488-100, RRID:AB_2631386 | IF(1:500) |
| Recombinant DNA reagent | pZS281 (plasmid) | This paper | To be deposited to Addgene | Wild-type B55-GFP (pCS2+eight backbone) |
| Recombinant DNA reagent | pZS282 (plasmid) | This paper | To be deposited to Addgene | DE/A mutant B55-GFP (pCS2+eight backbone) |
| Recombinant DNA reagent | pZS283 (plasmid) | This paper | To be deposited to Addgene | DE/K mutant B55-GFP (pCS2+eight backbone) |
| Recombinant DNA reagent | pZS294 (plasmid) | This paper | To be deposited to Addgene | B55-mCherry (pCS2+eight backbone) |
| Recombinant DNA reagent | pZS295 (plasmid) | This paper | To be deposited to Addgene | DE/A mutant B55-mCherry (pCS2+eight backbone) |
| Recombinant DNA reagent | pZS13 (plasmid) | This paper | To be deposited to Addgene | INCENP-GFP (pCS2+eight backbone) |
| Recombinant DNA reagent | pZS259 (plasmid) | This paper | To be deposited to Addgene | INCENP-GFP T61S mutant (pCS2+eight backbone) |
| Recombinant DNA reagent | GST-ARPP19 | This paper | To be deposited to Addgene | For protein expression |
| Recombinant DNA reagent | pCS2+eight backbone | Gökirmak et al., 2012 | RRID:Addgene_34952 | Pol III-based shRNA backbone |
| Sequence-based reagent | Standard Control Morpholino | Gene-Tools, LLC | CCT CTT ACC TCA GTT ACA ATT TAT | |
| Sequence-based reagent | Cyclin A morpholino | Gene-Tools, LLC | Morpholino antisense oligo | TTCACTTTGTTCCCGAGATTAAC |
| Sequence-based reagent | Cyclin B morpholino | Gene-Tools, LLC | Morpholino antisense oligo | TAACCAATGCGAGTTCCGAGGAG |
| Commercial assay or kit | mMessage mMachine SP6 in vitro transcription kit | Invitrogen | Cat# AM1340 | |
| Commercial assay or kit | Poly(A) tailing kit | Invitrogen | Cat# AM1350 | |
| Commercial assay or kit | Can Get Signal Immunoreaction Enhancer Solution | Cosmo Bio USA | Cat# TYB-NKB-101T | |
| Chemical compound, drug | 1-Methyladenine | Acros Organics | AC20131-1000 | |
| Chemical compound, drug | Calyculin A | Santa Cruz Biotechnology | SC-24000A | PP1 and PP2A inhibitor |
| Chemical compound, drug | Emetine | Sigma Aldrich | E2375-500MG | Translation inhibitor |
| Chemical compound, drug | Tautomycetin | Gift from Dr. Richard Honkanen | PP1 inhibitor | |
| Software, algorithm | SPSS | SPSS | RRID:SCR_002865 | |
| Other | Hoechst 33342 stain | Life Technologies | Cat# H1399 | (2 µg/ml) |
| Other | Prolong Gold Antifade Reagent | Life Technologies | P36930 | |
| Commercial assay or kit | TMT10plex Isobaric Label Reagent Set plus TMT11-131C Label Reagent | Thermo Scientific | A34808 | |
| Commercial assay or kit | High-Select Fe-NTA Phosphopeptide Enrichment Kit | Thermo Scientific | A32992 |
Additional files
-
Supplementary file 1
Protein abundances quantified across time-course proteomics from prophase I arrest to the first embryonic cleavage.
- https://cdn.elifesciences.org/articles/70588/elife-70588-supp1-v2.xlsx
-
Supplementary file 2
Results of gene ontology analysis of proteins with significant changes in abundances from prophase I arrest to the first embryonic cleavage.
BP - biological processes, CC - cellular components, MF – molecular function.
- https://cdn.elifesciences.org/articles/70588/elife-70588-supp2-v2.xlsx
-
Supplementary file 3
Proteomics results of oocytes treated with emetine revealing translationally regulated factors.
- https://cdn.elifesciences.org/articles/70588/elife-70588-supp3-v2.xlsx
-
Supplementary file 4
Results of gene ontology analysis of proteins affected by emetine treatment.
BP - biological processes, CC - cellular components, MF – molecular function.
- https://cdn.elifesciences.org/articles/70588/elife-70588-supp4-v2.xlsx
-
Supplementary file 5
Phosphorylation abundances quantified across time-course proteomics from prophase I arrest to the first embryonic cleavage and upon calyculin A treatment.
- https://cdn.elifesciences.org/articles/70588/elife-70588-supp5-v2.xlsx
-
Transparent reporting form
- https://cdn.elifesciences.org/articles/70588/elife-70588-transrepform-v2.pdf
Download links
A two-part list of links to download the article, or parts of the article, in various formats.
Downloads (link to download the article as PDF)
Open citations (links to open the citations from this article in various online reference manager services)
Cite this article (links to download the citations from this article in formats compatible with various reference manager tools)
Selective dephosphorylation by PP2A-B55 directs the meiosis I-meiosis II transition in oocytes
eLife 10:e70588.
https://doi.org/10.7554/eLife.70588


