Mutual interaction between visual homeostatic plasticity and sleep in adult humans
- Department of Surgical, Medical and Molecular Pathology and Critical Care Medicine, University of Pisa, Italy
- Laboratoire des Systèmes Perceptifs, Département d'études Cognitives, École Normale Supérieure, France
- Department of Translational Research and New Technologies in Medicine and Surgery, University of Pisa, Italy
- IRCCS Fondazione Stella Maris, Italy
Figures
Figure 1

Experimental paradigm and monocular deprivation (MD) effect before and after sleep.
(A) Diagram of the experimental paradigm for the MD night (MDnight) condition. Ocular dominance was measured by means of binocular rivalry (BR) before and after 2 hr of MD. Afterwards, participants went to sleep while their EEG activity was recorded with a 128-electrodes system. BR was measured after 2 hr of sleep and in the morning, after 4 additional hours of sleep. (B) Same as A, but for the control night (Cnight). The experimental procedure was the same as the MDnight, except that participants did not underwent MD. (C) The MD effect (deprivation index) measured before, after 2 hr of sleep and at morning awakening, occurring after 4 additional hours of sleep, in the MDnight (red symbols) and Cnight (black symbols). N=19. Error bars represent 1 ± SEM. Asterisks indicate the significance level (t-test of individual time-points against the value 1) after correction for multiple comparisons: ***p<0.001, **p<0.01, *p<0.05 or non-significant (n.s.).
-
Figure 1—source data 1
Source data for the monocular deprivation effect before and after sleep.
- https://cdn.elifesciences.org/articles/70633/elife-70633-fig1-data1-v2.xlsx
Figure 2 with 1 supplement
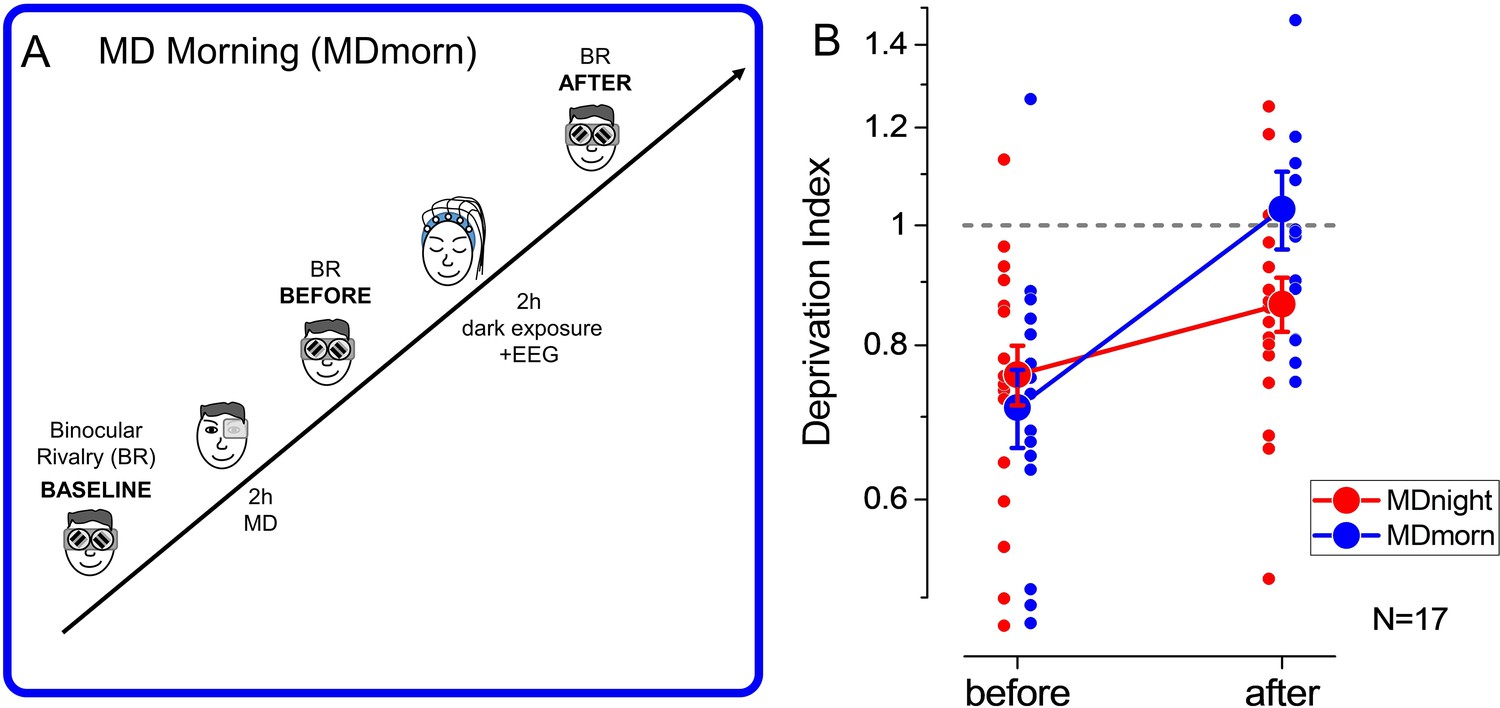
Experimental paradigm and results of the dark exposure (monocular deprivation morning [MDmorn]) condition.
(A) Diagram of the experimental paradigm for the monocular deprivation (MD) morning condition. After 2 hr of MD, participants spent 2 hr in total darkness, while their EEG activity was recorded. Following the 2 hr of dark exposure, ocular dominance was assessed by binocular rivalry. (B) The deprivation index measured before and after 2 hr of dark exposure without sleep performed in the MD morning session (blue symbols) and before and after 2 hr of sleep in the MD night session (red symbols), for the 17 participants who performed both conditions. Error bars represent 1 ± SEM, the small dots represent individual subjects, the big dots represent the average.
-
Figure 2—source data 1
Source data for the monocular deprivation effect before and after sleep/dark exposure.
- https://cdn.elifesciences.org/articles/70633/elife-70633-fig2-data1-v2.xlsx
Figure 2—figure supplement 1
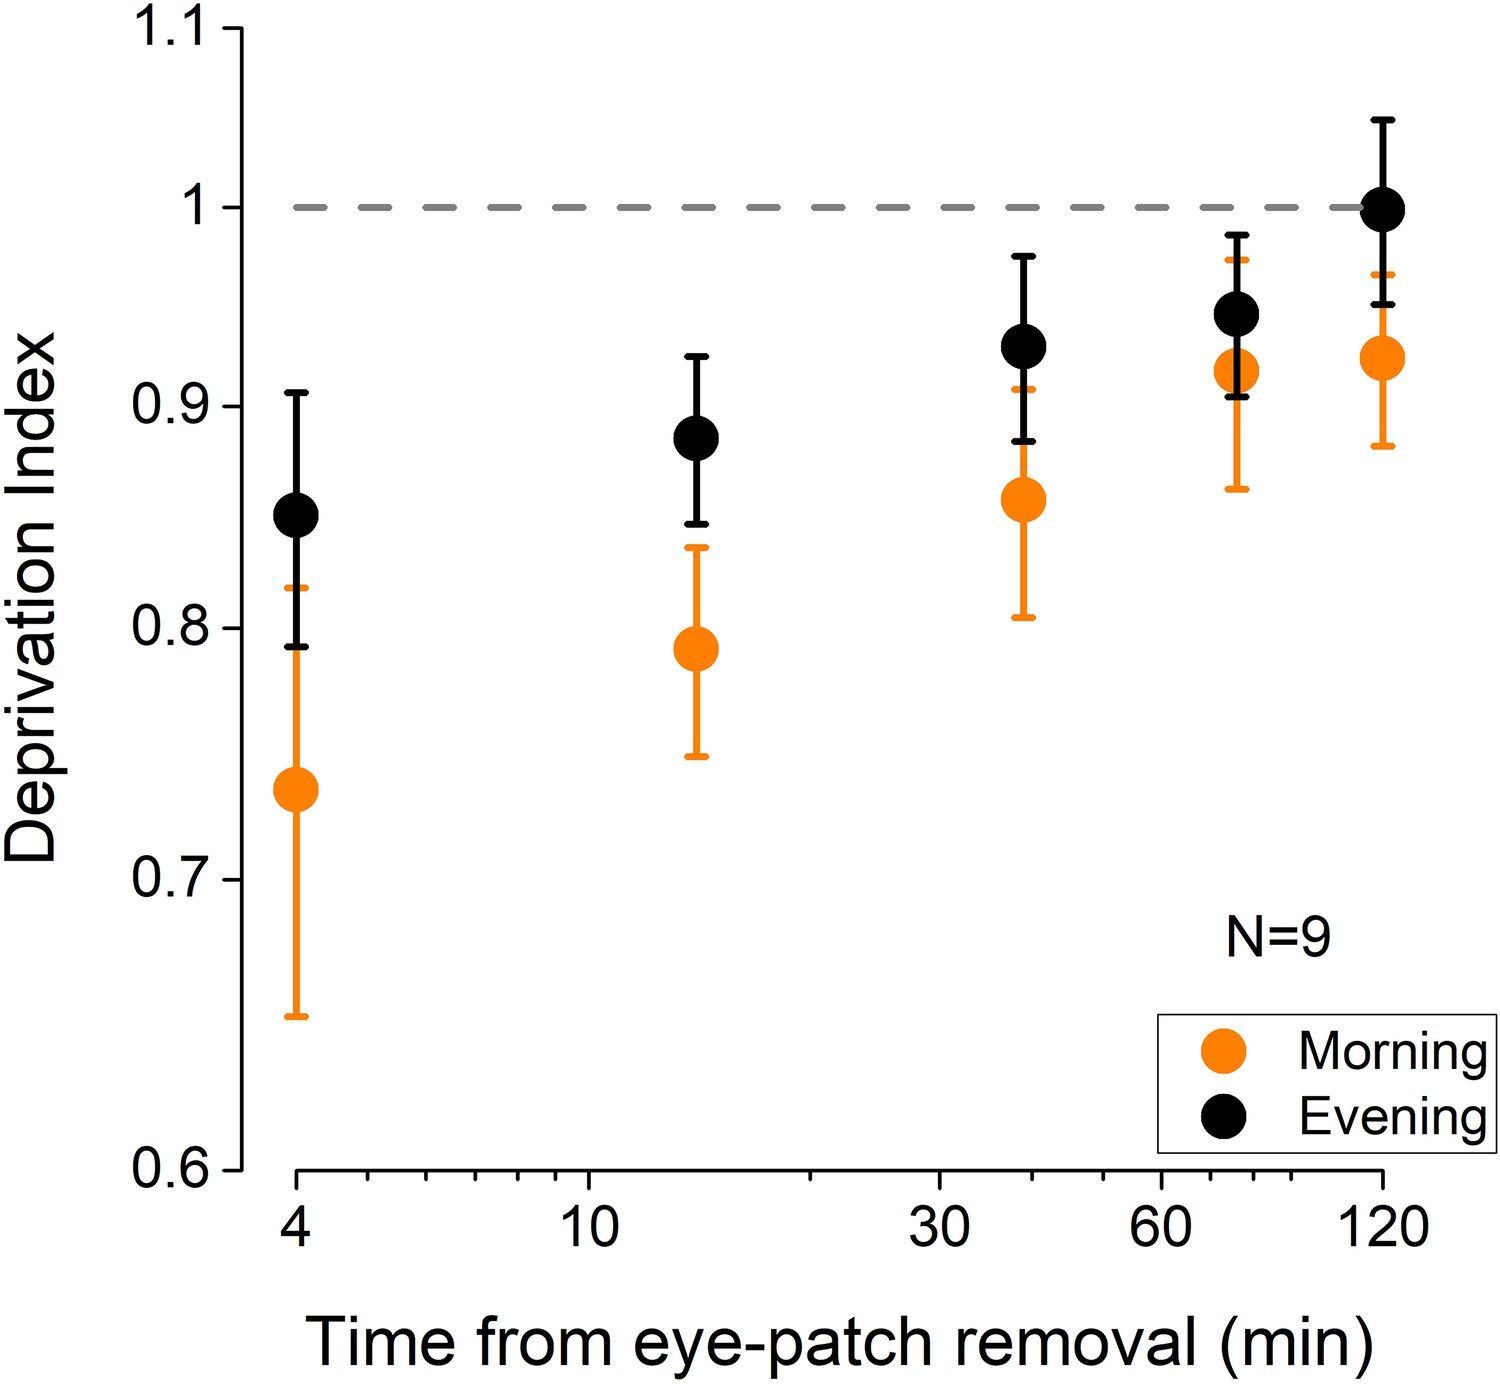
Control experiment results.
The effect of 2 hr of monocular deprivation (MD) (deprivation index) on ocular dominance measured either early in the morning (orange symbols) or late in the evening (black symbols). The MD effect was significantly larger when deprivation was performed in the morning (repeated-measures ANOVA, CONDITION: F(1,8)=6.87, p=0.031, η2=0.46), indicating a lower plastic potential of the visual cortex in the evening. Error bars represent 1 ± SEM, N=9.
-
Figure 2—figure supplement 1—source data 1
Source data for the control experiment.
- https://cdn.elifesciences.org/articles/70633/elife-70633-fig2-figsupp1-data1-v2.xlsx
Figure 3 with 4 supplements
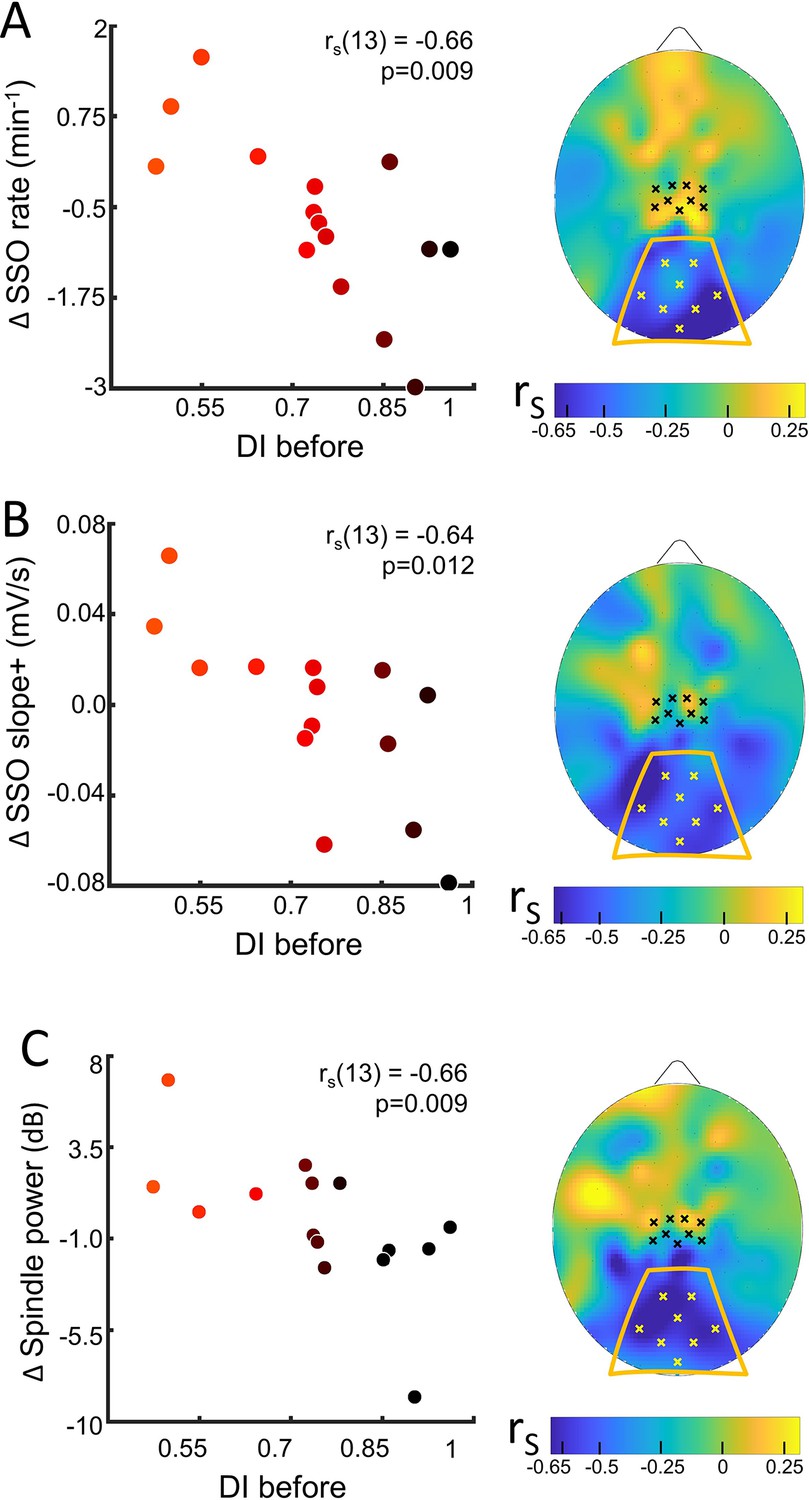
Sleep slow oscillation (SSO) and spindle modulation with the eye dominance induced by monocular deprivation.
(A) The changes from control to MD night of the rate of SSOs was correlated (N=15) with the deprivation index measured before sleep (DI before). Scatterplot shows individual values averaged within the occipital ROI (Spearman’s r with the p-value shown as an inset in the scatterplot). Colour of dots spans from black to red as a function of individual plasticity. No significant correlation appeared when considering the control ROI defined in the sensory-motor cortex. The scalp map shows the spatial distribution of correlation as estimated electrode by electrode; within the map, yellow and black dots mark electrodes belonging to the occipital and sensory-motor ROIs, respectively. (B) Same as A for the steepness of slope+ of SSOs; (C) same as A for the spindle power.
-
Figure 3—source data 1
Source data for the scatterplot of the sleep slow oscillations (SSOs) rate averaged over the occipital ROI versus the deprivation index (DI before).
- https://cdn.elifesciences.org/articles/70633/elife-70633-fig3-data1-v2.zip
-
Figure 3—source data 2
Source data for the scatterplot of the sleep slow oscillation (SSO) slope+ averaged over the occipital ROI versus the deprivation index (DI before).
- https://cdn.elifesciences.org/articles/70633/elife-70633-fig3-data2-v2.zip
-
Figure 3—source data 3
Source data for the scatterplot of the spindle power averaged over the occipital ROI versus the deprivation index (DI before).
- https://cdn.elifesciences.org/articles/70633/elife-70633-fig3-data3-v2.zip
-
Figure 3—source data 4
Source data for the scalp map of the correlations between sleep slow oscillations (SSOs) rate and the deprivation index (DI before).
- https://cdn.elifesciences.org/articles/70633/elife-70633-fig3-data4-v2.zip
-
Figure 3—source data 5
Source data for the scalp map of the correlations between sleep slow oscillation (SSO) slope+ and the deprivation index (DI before).
- https://cdn.elifesciences.org/articles/70633/elife-70633-fig3-data5-v2.zip
-
Figure 3—source data 6
Source data for the scalp map of the correlations between spindle power and the deprivation index (DI before).
- https://cdn.elifesciences.org/articles/70633/elife-70633-fig3-data6-v2.zip
Figure 3—figure supplement 1
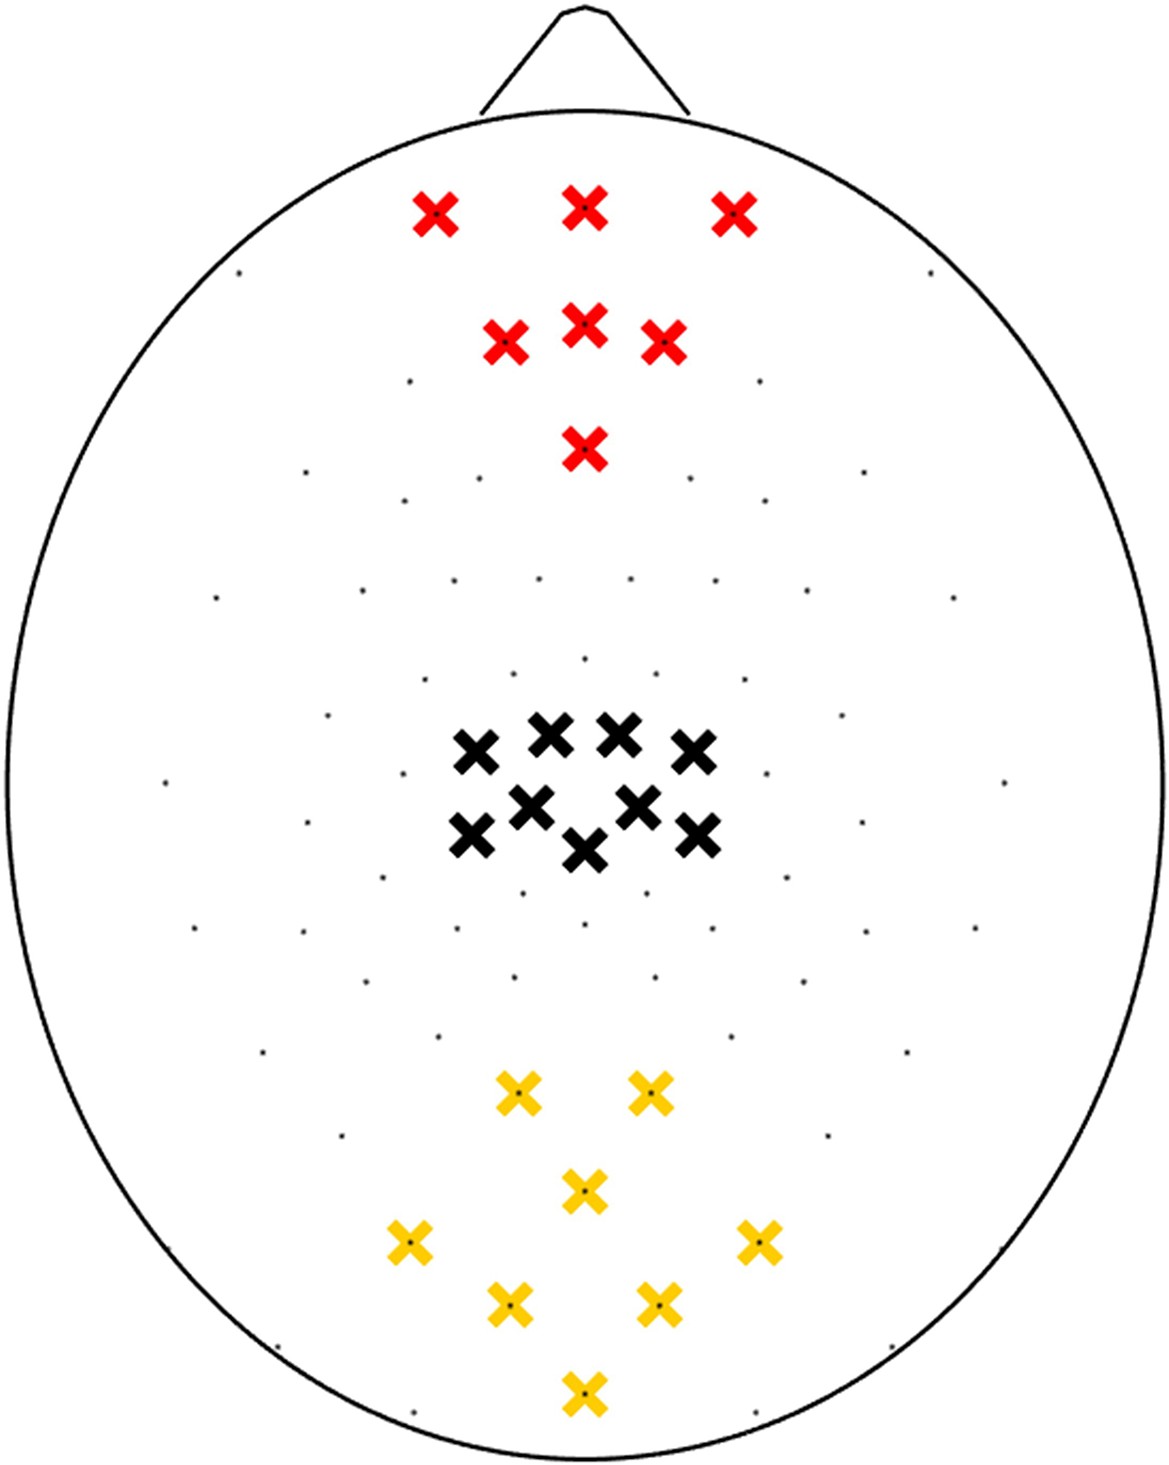
Electrodes in the HydroCel Geodesic Sensor Net belonging to each ROI.
Yellow crosses mark electrodes belonging to the occipital ROI, red crosses mark electrodes belonging to the prefrontal ROI, and black crosses mark electrodes belonging to the sensory-motor control ROI.
-
Figure 3—figure supplement 1—source data 1
Source data for the EEG electrode coordinates.
- https://cdn.elifesciences.org/articles/70633/elife-70633-fig3-figsupp1-data1-v2.zip
Figure 3—figure supplement 2

Correlations (N=15) with deprivation index (DI) before sleep.
Coherence between electrodes within each ROIs for the features in Figure 3. Each dot corresponds to an electrode within the indicated ROI. Only electrodes belonging to the occipital ROI showed significant Spearman correlations with DI measured before sleep. Two statistical significance levels are shown.(p<0.01, p<0.05).
-
Figure 3—figure supplement 2—source data 1
Source data for the single electrode correlations within each ROI between sleep slow oscillation (SSO) rate and the deprivation index (DI) before sleep.
- https://cdn.elifesciences.org/articles/70633/elife-70633-fig3-figsupp2-data1-v2.zip
-
Figure 3—figure supplement 2—source data 2
Source data for the single electrode correlations within each ROI between sleep slow oscillation (SSO) slope+ and the deprivation index (DI) before sleep.
- https://cdn.elifesciences.org/articles/70633/elife-70633-fig3-figsupp2-data2-v2.zip
-
Figure 3—figure supplement 2—source data 3
Source data for the single electrode correlations within each ROI between spindle power and the deprivation index (DI) before sleep.
- https://cdn.elifesciences.org/articles/70633/elife-70633-fig3-figsupp2-data3-v2.zip
Figure 3—figure supplement 3
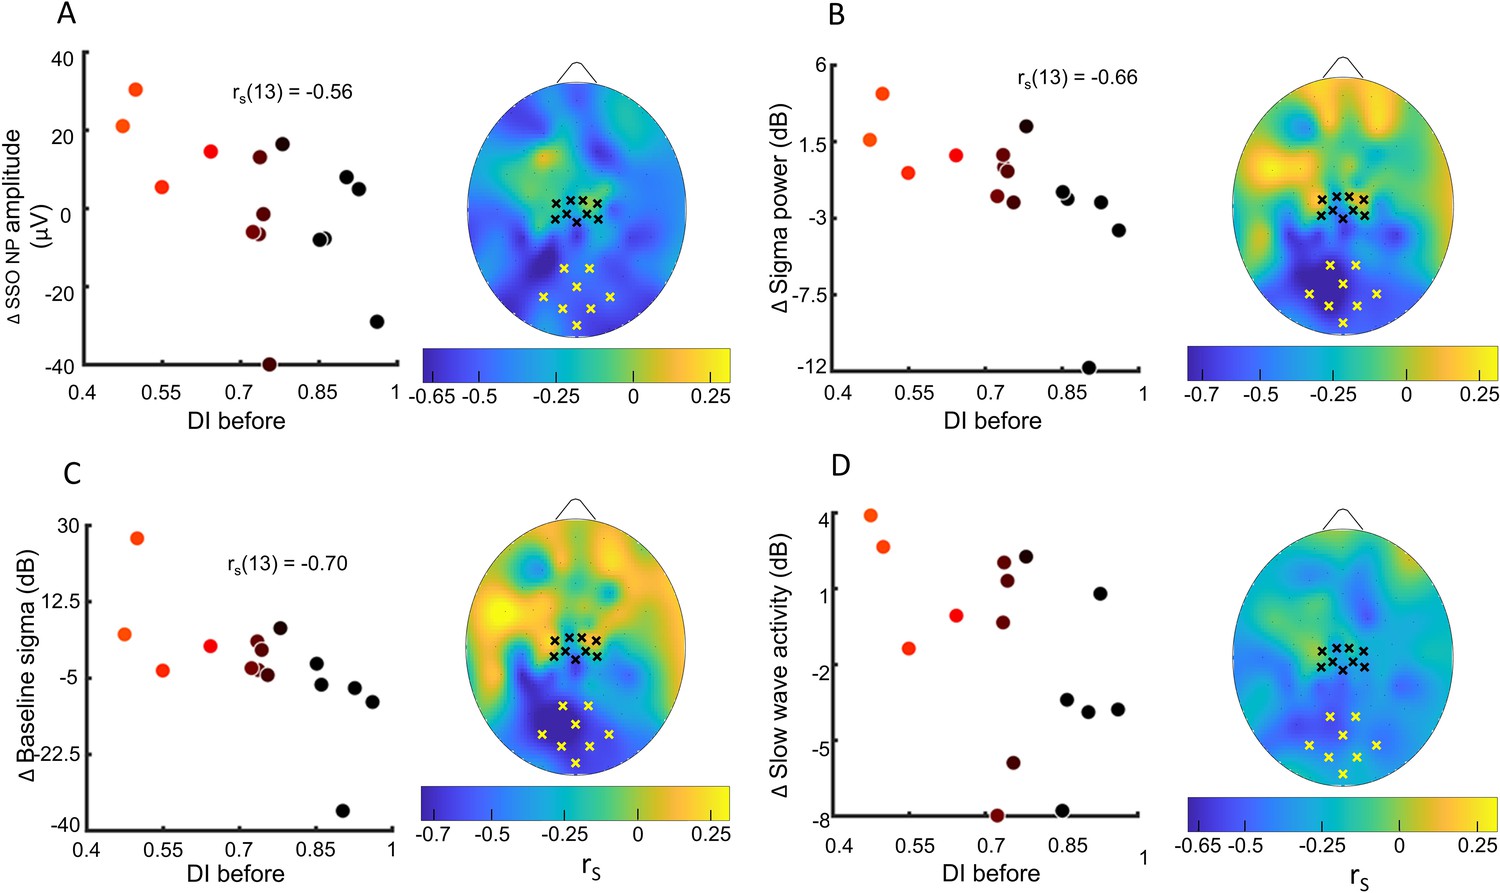
Sleep slow oscillation (SSO) and sigma power modulation with the eye dominance induced by monocular deprivation.
(A) Correlation (N=15) between the deprivation index measured before sleep (DI before) and the changes from the control night to the MD night of the mean sleep slow oscillations (SSOs) amplitude. Scatterplot of the SSOs amplitude averaged over the occipital ROI (yellow crosses mark electrodes belonging to the ROI) with the DI. Dot’s colour changes from black to red as a function of DI. Spearman correlation (rs) is shown when significant (p<0.05, FDR-corrected). The control ROI defined in the sensory-motor cortex (black crosses) shows no significant correlation with DI. The scalp map shows the spatial distribution of correlation; (B) same as A for the sigma activity power; (C) same as A for the baseline sigma rhythm expressed before SSO events; (D) same as A for the power of slow wave activity. For (D) no significant correlation was observed when averaging over both ROIs.
-
Figure 3—figure supplement 3—source data 1
Source data for the scatterplot of the sleep slow oscillations (SSOs) amplitude averaged over the occipital ROI versus the deprivation index (DI before).
- https://cdn.elifesciences.org/articles/70633/elife-70633-fig3-figsupp3-data1-v2.zip
-
Figure 3—figure supplement 3—source data 2
Source data for the scatterplot of the sigma activity power averaged over the occipital ROI versus the deprivation index (DI before).
- https://cdn.elifesciences.org/articles/70633/elife-70633-fig3-figsupp3-data2-v2.zip
-
Figure 3—figure supplement 3—source data 3
Source data for the scatterplot of the sigma rhythm expressed before sleep slow oscillation (SSO) events averaged over the occipital ROI versus the deprivation index (DI before).
- https://cdn.elifesciences.org/articles/70633/elife-70633-fig3-figsupp3-data3-v2.zip
-
Figure 3—figure supplement 3—source data 4
Source data for the scatterplot of the power of slow wave activity averaged over the occipital ROI versus the deprivation index (DI before).
- https://cdn.elifesciences.org/articles/70633/elife-70633-fig3-figsupp3-data4-v2.zip
-
Figure 3—figure supplement 3—source data 5
Source data for the scalp map of the correlations between sleep slow oscillations (SSOs) amplitude and the deprivation index (DI before).
- https://cdn.elifesciences.org/articles/70633/elife-70633-fig3-figsupp3-data5-v2.zip
-
Figure 3—figure supplement 3—source data 6
Source data for the scalp map of the correlations between sigma activity power and the deprivation index (DI before).
- https://cdn.elifesciences.org/articles/70633/elife-70633-fig3-figsupp3-data6-v2.zip
-
Figure 3—figure supplement 3—source data 7
Source data for the scalp map of the correlations between sigma rhythm expressed before sleep slow oscillation (SSO) events and the deprivation index (DI before).
- https://cdn.elifesciences.org/articles/70633/elife-70633-fig3-figsupp3-data7-v2.zip
-
Figure 3—figure supplement 3—source data 8
Source data for the scalp map of the correlations between slow wave activity and the deprivation index (DI before).
- https://cdn.elifesciences.org/articles/70633/elife-70633-fig3-figsupp3-data8-v2.zip
Figure 3—figure supplement 4
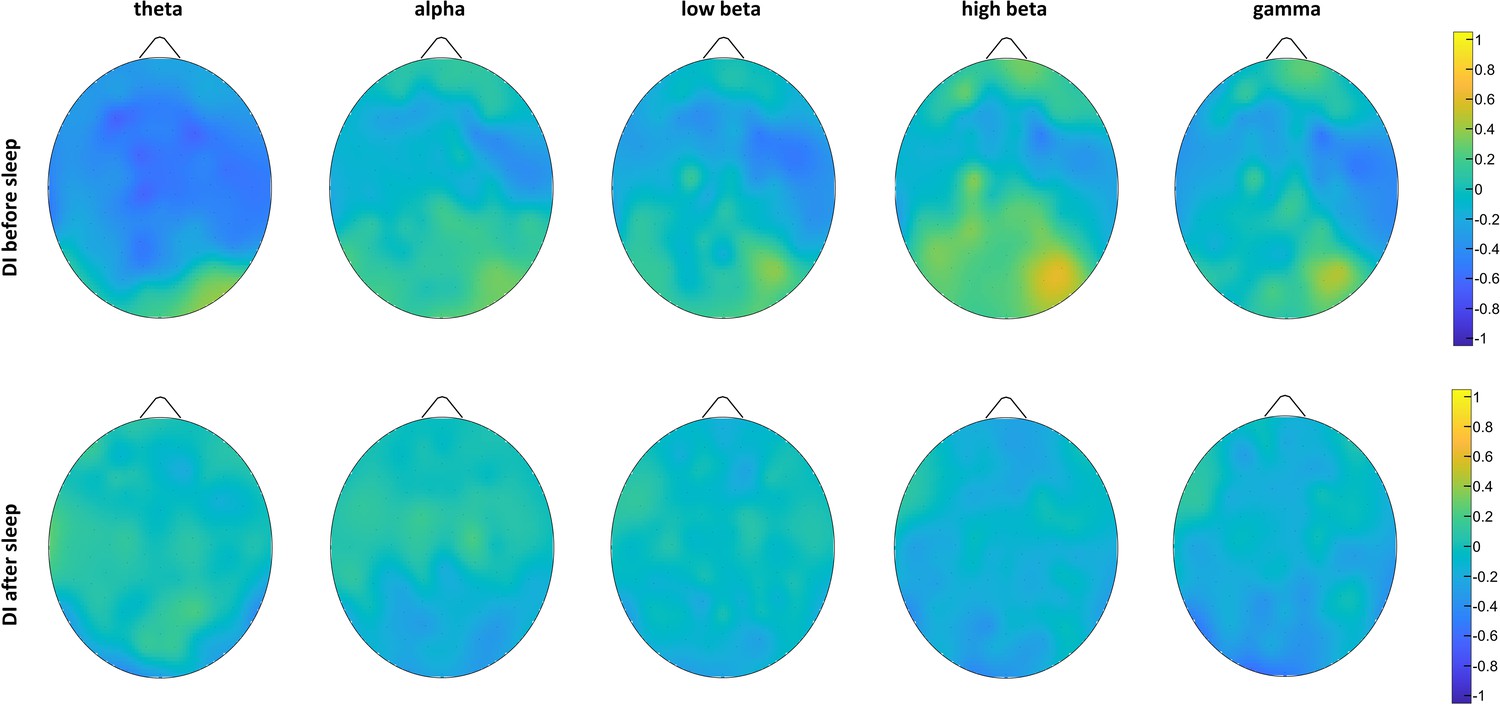
Monocular deprivation in the morning session (MDmorn): maps of Spearman’s correlations (N=15) calculated between EEG power band content and deprivation index before and after 2 hr of dark exposure.
No significant correlations (p<0.05, FDR-corrected) between EEG rhythms power and visual plasticity indices were observed.
-
Figure 3—figure supplement 4—source data 1
Source data for the scalp maps of the correlations between bands power and the deprivation index before the 2 hr of dark exposure (DI before).
- https://cdn.elifesciences.org/articles/70633/elife-70633-fig3-figsupp4-data1-v2.zip
-
Figure 3—figure supplement 4—source data 2
Source data for the scalp maps of the correlations between bands power and the deprivation index after 2 hr of dark exposure (DI after).
- https://cdn.elifesciences.org/articles/70633/elife-70633-fig3-figsupp4-data2-v2.zip
Figure 4 with 3 supplements

Spindle density modulation with the residual plasticity after 2 hr of sleep.
The changes from control to MD night of the spindle density were correlated (N=15, p<0.05, FDR-corrected) with the deprivation index measured after sleep (DI after). Scatterplot shows individual values averaged within the prefrontal ROI (Spearman’s r with the p-value shown as an inset in the scatterplot). Colour of dots spans from black to red as a function of individual DI after. No significant correlation appeared when considering ROIs defined in the occipital and in sensory-motor cortex. The scalp map shows the spatial distribution of correlation as estimated electrode by electrode over the scalp; within the map yellow, black, and red dots mark electrodes belonging to the occipital, sensory-motor, and prefrontal ROIs, respectively.
-
Figure 4—source data 1
Source data for the scatterplot of spindle density averaged over the prefrontal ROI versus the deprivation index (DI after).
- https://cdn.elifesciences.org/articles/70633/elife-70633-fig4-data1-v2.zip
-
Figure 4—source data 2
Source data for the scalp map of the correlations between spindle density and the deprivation index (DI after).
- https://cdn.elifesciences.org/articles/70633/elife-70633-fig4-data2-v2.zip
Figure 4—figure supplement 1
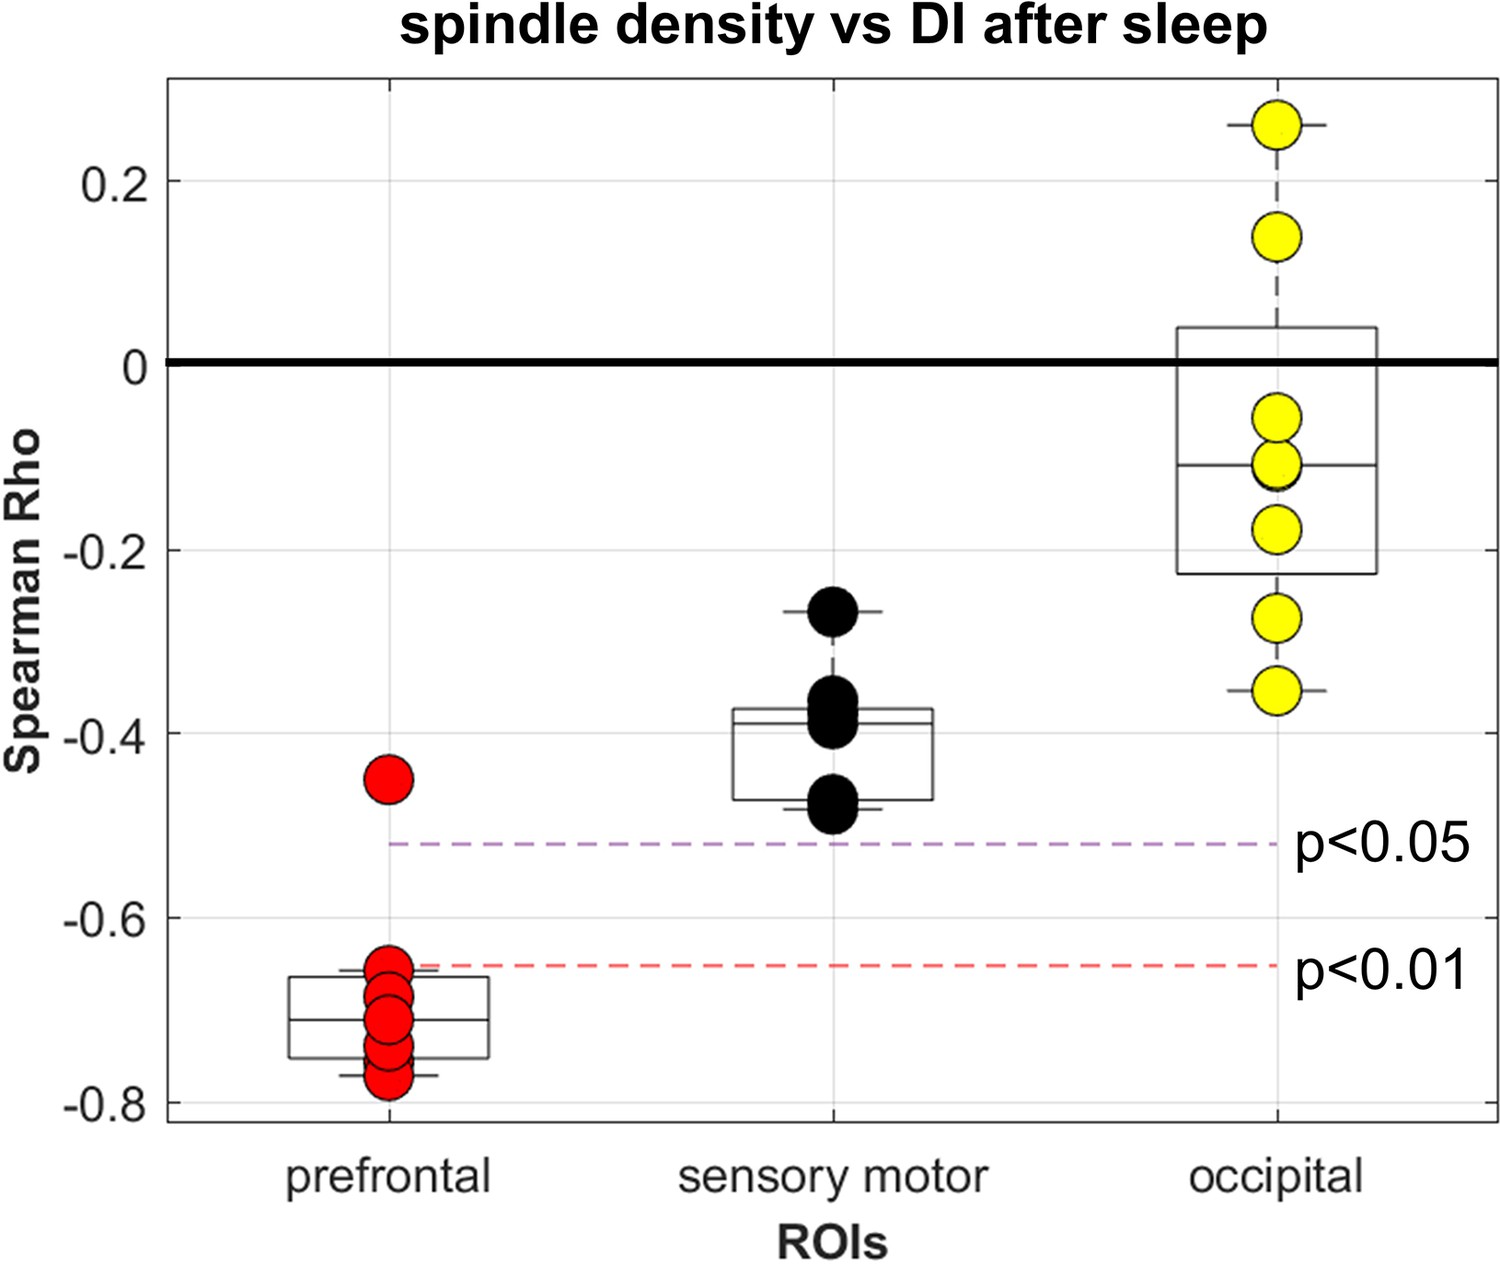
Correlations with deprivation index (DI) after sleep.
Coherence between electrodes within each ROIs for spindle density (Figure 4). All but one of the electrodes belonging to the prefrontal ROI showed a significant (p>0.01) Spearman correlation (N=15) with DI measured after sleep. Two statistical significance levels are shown.(p<0.01, p<0.05).
-
Figure 4—figure supplement 1—source data 1
Source data for the single electrode correlations within each ROI and the deprivation index (DI) after sleep.
- https://cdn.elifesciences.org/articles/70633/elife-70633-fig4-figsupp1-data1-v2.zip
Figure 4—figure supplement 2
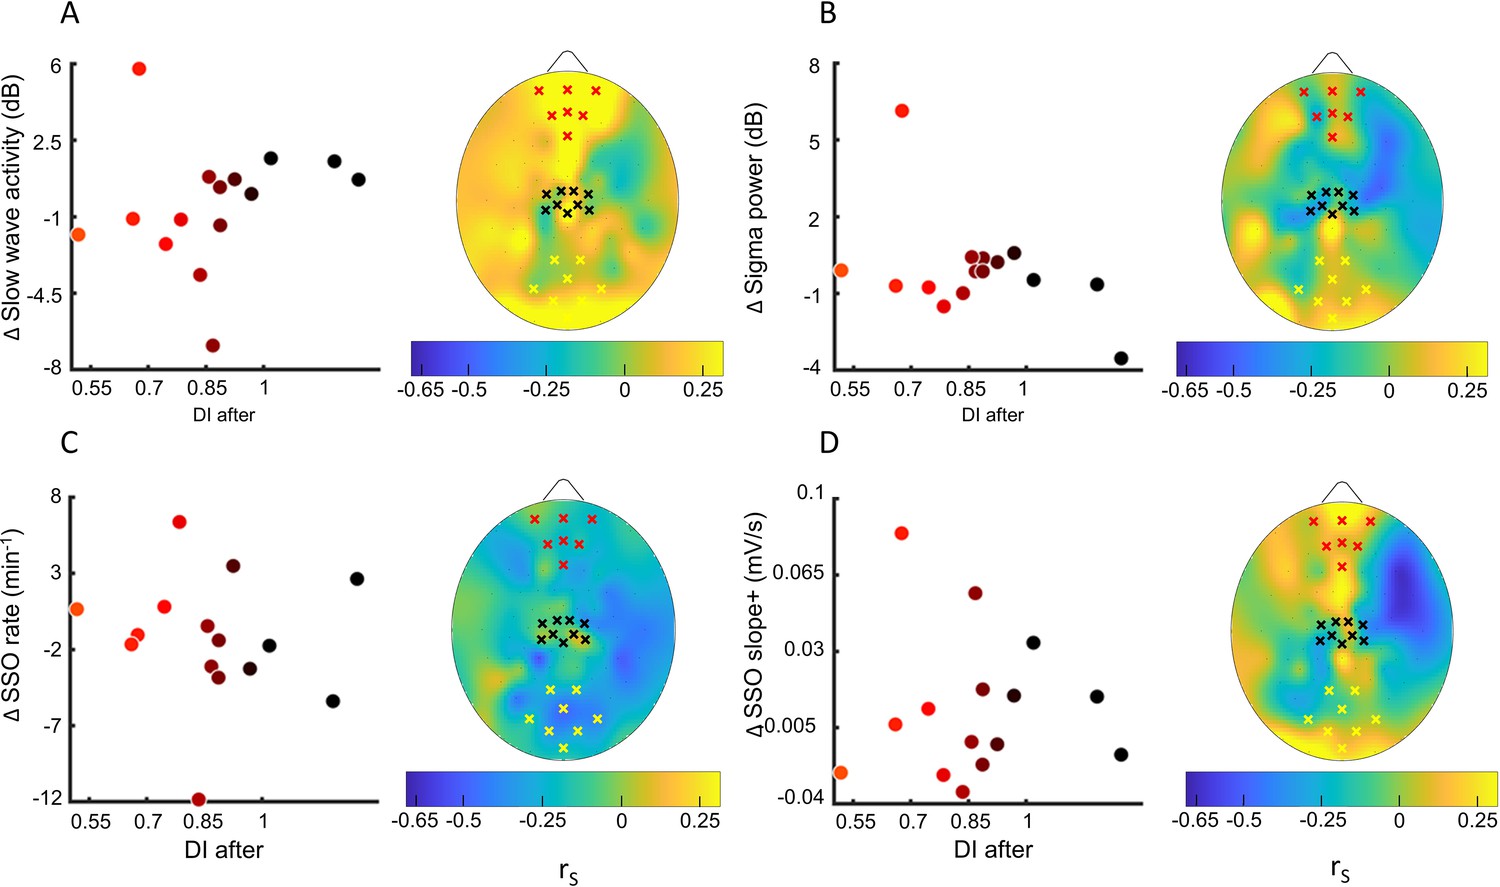
Sleep slow oscillation (SSO) and sigma power modulation with the residual plasticity after 2h of sleep.
(A) Correlation (N=15) between the deprivation index measured after sleep (DI after) and the changes from the control night to the MD night of the slow wave activity power averaged over the prefrontal ROI. No electrodes in the defined ROIs (black crosses: sensory-motor control ROI, yellow crosses: occipital ROI, red crosses: prefrontal ROI) show significant correlation with the DI. Dot’s colour changes from black to red as a function of DI. The scalp map shows the spatial distribution of correlation. (B) same as A for the sigma activity power; (C) same as A for the occurrence of sleep slow oscillations (SSOs); (D) same as A for the steepness of slope+ of SSOs.
-
Figure 4—figure supplement 2—source data 1
Source data for the scatterplot of the power of slow wave activity averaged over the prefrontal ROI versus the deprivation index (DI after).
- https://cdn.elifesciences.org/articles/70633/elife-70633-fig4-figsupp2-data1-v2.zip
-
Figure 4—figure supplement 2—source data 2
Source data for the scatterplot of the power of sigma power averaged over the prefrontal ROI versus the deprivation index (DI after).
- https://cdn.elifesciences.org/articles/70633/elife-70633-fig4-figsupp2-data2-v2.zip
-
Figure 4—figure supplement 2—source data 3
Source data for the scatterplot of the power of sleep slow oscillation (SSO) rate averaged over the prefrontal ROI versus the deprivation index (DI after).
- https://cdn.elifesciences.org/articles/70633/elife-70633-fig4-figsupp2-data3-v2.zip
-
Figure 4—figure supplement 2—source data 4
Source data for the scatterplot of the power of sleep slow oscillation (SSO) slope+ power averaged over the prefrontal ROI versus the deprivation index (DI after).
- https://cdn.elifesciences.org/articles/70633/elife-70633-fig4-figsupp2-data4-v2.zip
-
Figure 4—figure supplement 2—source data 5
Source data for the scalp map of the correlations between sigma power and the deprivation index (DI after).
- https://cdn.elifesciences.org/articles/70633/elife-70633-fig4-figsupp2-data5-v2.zip
-
Figure 4—figure supplement 2—source data 6
Source data for the scalp map of the correlations between slow wave activity and the deprivation index (DI after).
- https://cdn.elifesciences.org/articles/70633/elife-70633-fig4-figsupp2-data6-v2.zip
-
Figure 4—figure supplement 2—source data 7
Source data for the scalp map of the correlations between sleep slow oscillation (SSO) rate and the deprivation index (DI after).
- https://cdn.elifesciences.org/articles/70633/elife-70633-fig4-figsupp2-data7-v2.zip
-
Figure 4—figure supplement 2—source data 8
Source data for the scalp map of the correlations between sleep slow oscillation (SSO) slope+ and the deprivation index (DI after).
- https://cdn.elifesciences.org/articles/70633/elife-70633-fig4-figsupp2-data8-v2.zip
Figure 4—figure supplement 3
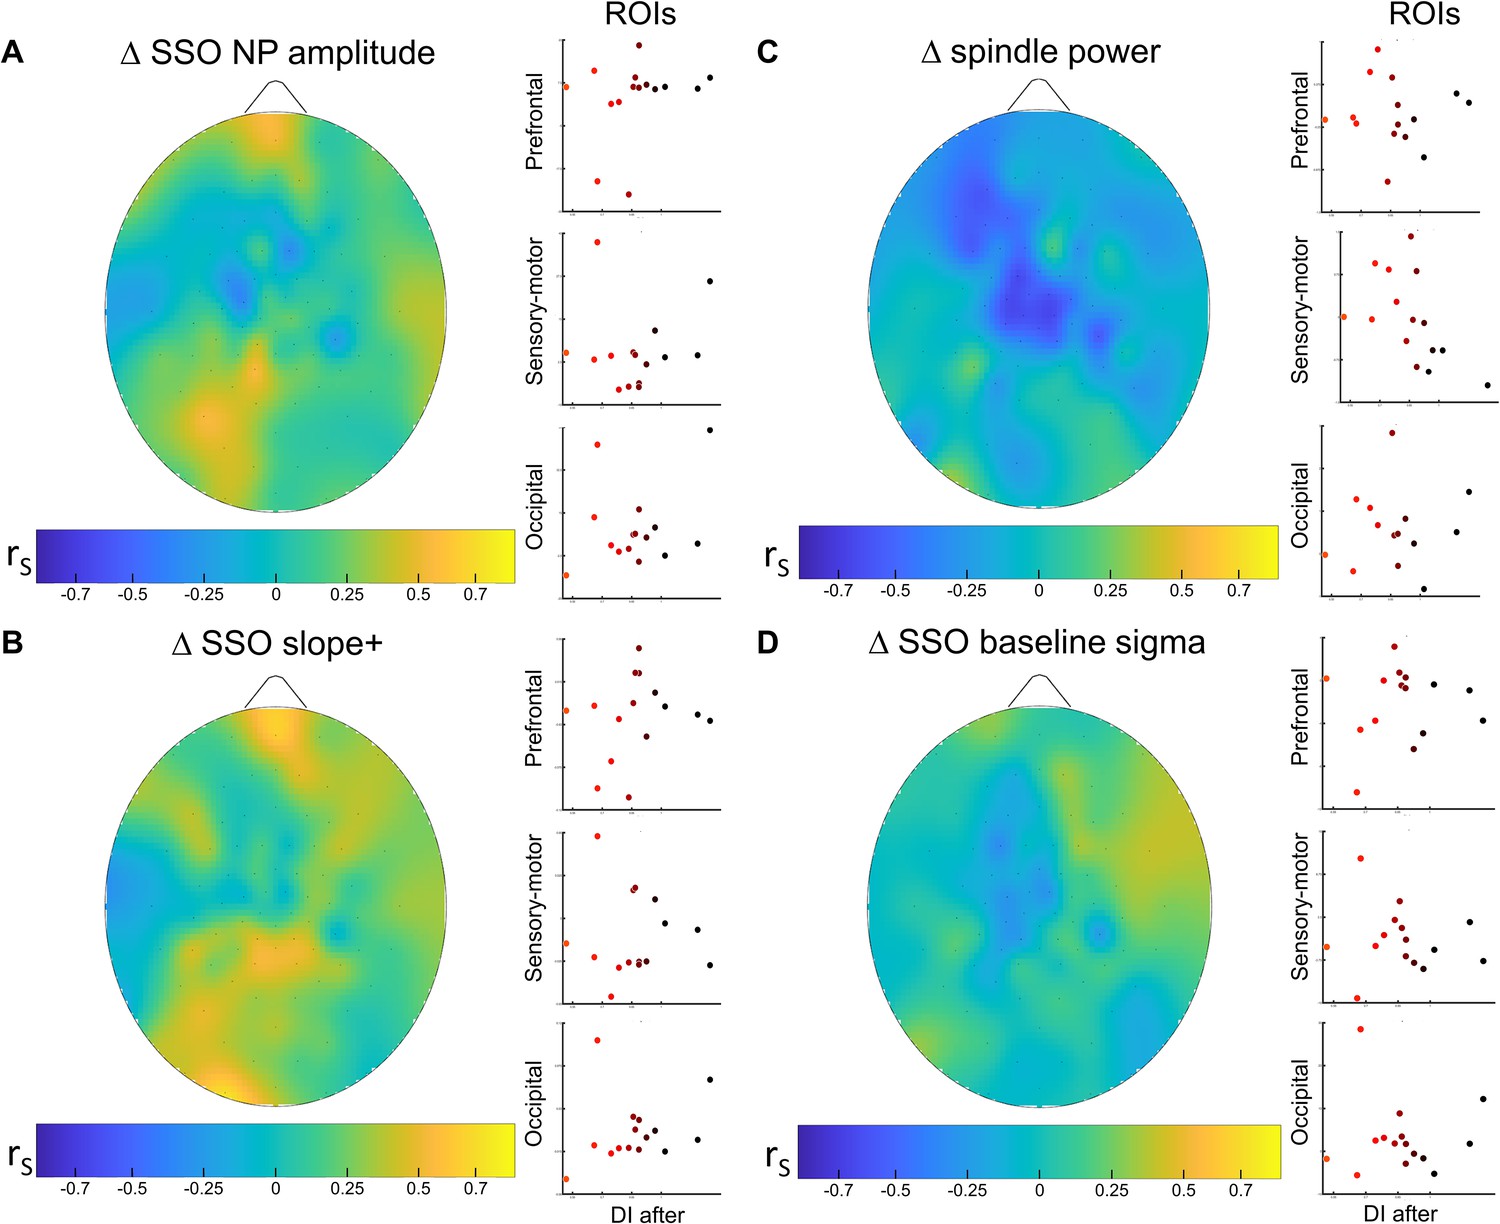
Across sleep analysis.
Correlation (N=15) analysis between EEG features changes within the sleep cycle and residual eye dominance plasticity measured at the end of the 2 hr of sleep. To perform the analysis, we (1) partitioned sleep slow oscillation (SSO) and spindle events into tertiles according to their occurrence, (2) estimated the average measures of events belonging to the first and last tertile, and considered the variation between tertiles as an estimate of the changes across the 2 hr of sleep. Finally, we tested whether there is a consistent relationship between measures of individual retained plasticity (DI after) and changes in SSO and sleep spindles across the sleep cycle within the three ROIs. None of the parameters considered in the three ROIs have shown significant (p < 0.05, after false discovery rate [FDR] correction) associations with the individual DI after sleep. (A) Correlation between the changes of SSO peak to peak amplitude (NP amp) from the early sleep to the late sleep within the 2 hr and the DI after. Scatterplot shows individual values averaged within the prefrontal, sensory-motor, and occipital ROIs. No significant correlations appeared when considering any ROIs. The scalp map shows the spatial distribution of Spearman’s correlation (rs) for each electrode; (B) same as A for the spindle power; (C) same as A for the steepness of SSO slope+; (D) same as A for the SSO baseline sigma. All other details as in Figure 3—figure supplement 3.
-
Figure 4—figure supplement 3—source data 1
Source data for the scalp map of the correlations between changes within the sleep cycle in sleep slow oscillation (SSO) amplitude and the deprivation index (DI after).
- https://cdn.elifesciences.org/articles/70633/elife-70633-fig4-figsupp3-data1-v2.zip
-
Figure 4—figure supplement 3—source data 2
Source data for the scalp map of the correlations between changes within the sleep cycle in spindle power within the sleep cycle and the deprivation index (DI after).
- https://cdn.elifesciences.org/articles/70633/elife-70633-fig4-figsupp3-data2-v2.zip
-
Figure 4—figure supplement 3—source data 3
Source data for the scalp map of the correlations between changes within the sleep cycle in sleep slow oscillation (SSO) slope+ and the deprivation index (DI after).
- https://cdn.elifesciences.org/articles/70633/elife-70633-fig4-figsupp3-data3-v2.zip
-
Figure 4—figure supplement 3—source data 4
Source data for the scalp map of the correlations between changes within the sleep cycle in the sigma rhythm expressed before sleep slow oscillation (SSO) events and the deprivation index (DI after).
- https://cdn.elifesciences.org/articles/70633/elife-70633-fig4-figsupp3-data4-v2.zip
Additional files
-
Supplementary file 1
Table: Sleep macrostructural parameters: monocular deprivation night (MDnight) and control night (Cnight) descriptive statistics.
- https://cdn.elifesciences.org/articles/70633/elife-70633-supp1-v2.docx
-
Supplementary file 2
Table: Features comparison between conditions and correlations with plasticity indices for the relevant ROIs.
- https://cdn.elifesciences.org/articles/70633/elife-70633-supp2-v2.docx
-
Transparent reporting form
- https://cdn.elifesciences.org/articles/70633/elife-70633-transrepform1-v2.docx
-
Source code 1
Matlab files with data and codes for statistics and final results.
- https://cdn.elifesciences.org/articles/70633/elife-70633-code1-v2.zip
Download links
A two-part list of links to download the article, or parts of the article, in various formats.
Downloads (link to download the article as PDF)
Open citations (links to open the citations from this article in various online reference manager services)
Cite this article (links to download the citations from this article in formats compatible with various reference manager tools)
Mutual interaction between visual homeostatic plasticity and sleep in adult humans
eLife 11:e70633.
https://doi.org/10.7554/eLife.70633


