Comparative transcriptomic analysis reveals translationally relevant processes in mouse models of malaria
- Section of Paediatric Infectious Disease, Department of Infectious Disease, Imperial College London, United Kingdom
- Centre for Paediatrics and Child Health, Imperial College London, United Kingdom
- Institute for Molecular Bioscience, University of Queensland, Australia
Figures
Figure 1 with 1 supplement
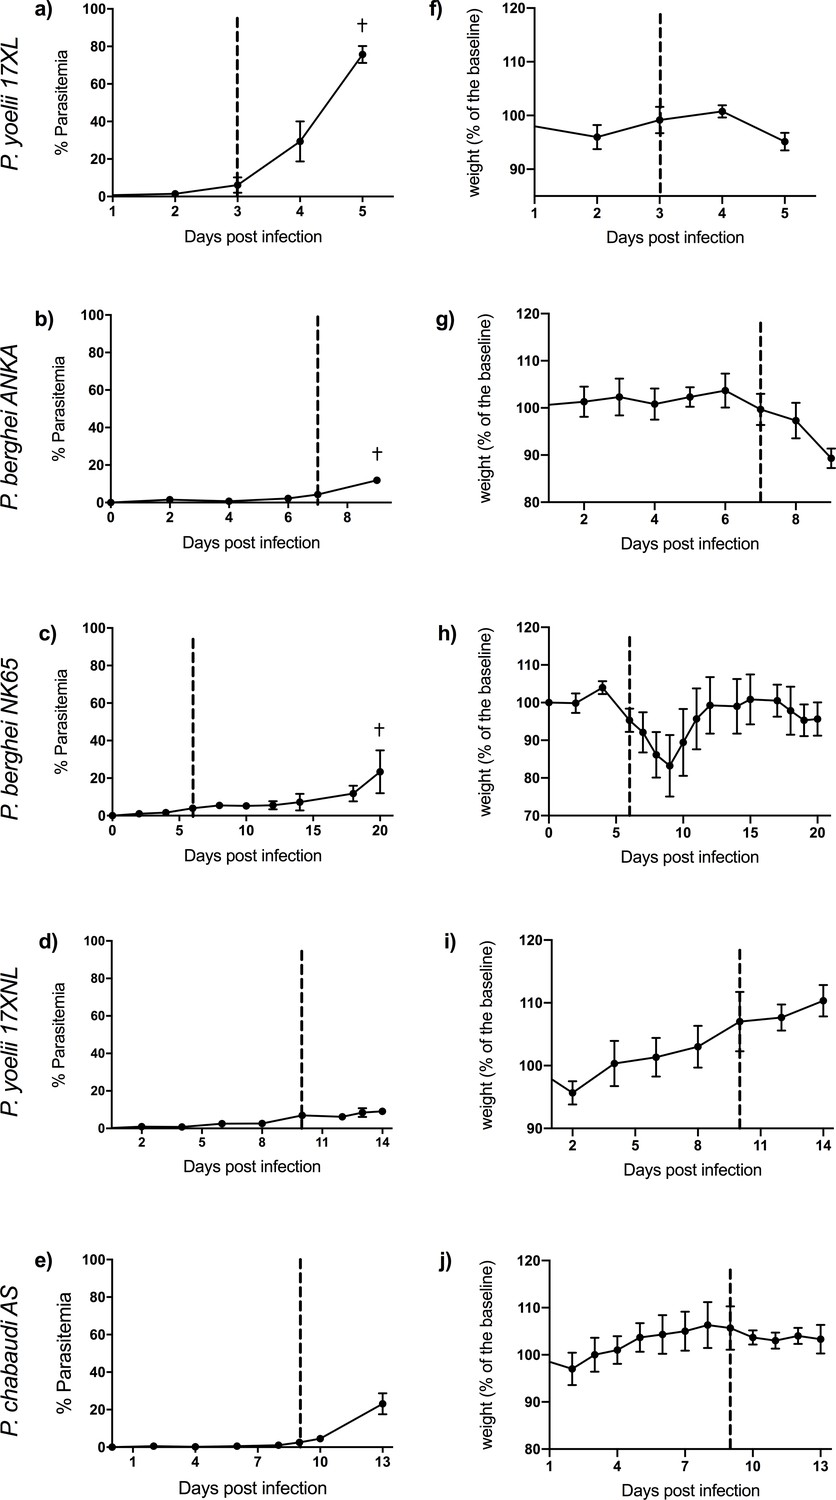
Course of infection in five mouse malaria models.
Comparison of parasitemia (a–e) and change in weight (as percentage of baseline weight) (f–j) for 8-week-old C57BL/6J female wild-type mice infected with: Plasmodium yoelii 17XL, P. berghei ANKA, P. berghei NK65, P. yoelii 17XNL, and P. chabaudi AS, respectively. Points show mean, and bars show SD, for n=6 mice (up to and including time point of first signs of ill health, dashed vertical line) and n=3 mice (after dashed vertical line) for each infection. † indicates humane endpoint for lethal infections. Severity scoring for each infection shown in Figure 1—figure supplement 1, and individual mouse parasitemia and weights shown in Figure 1—source data 1.
-
Figure 1—source data 1
Individual mouse parasitemia and weights.
- https://cdn.elifesciences.org/articles/70763/elife-70763-fig1-data1-v1.xlsx
Figure 1—figure supplement 1
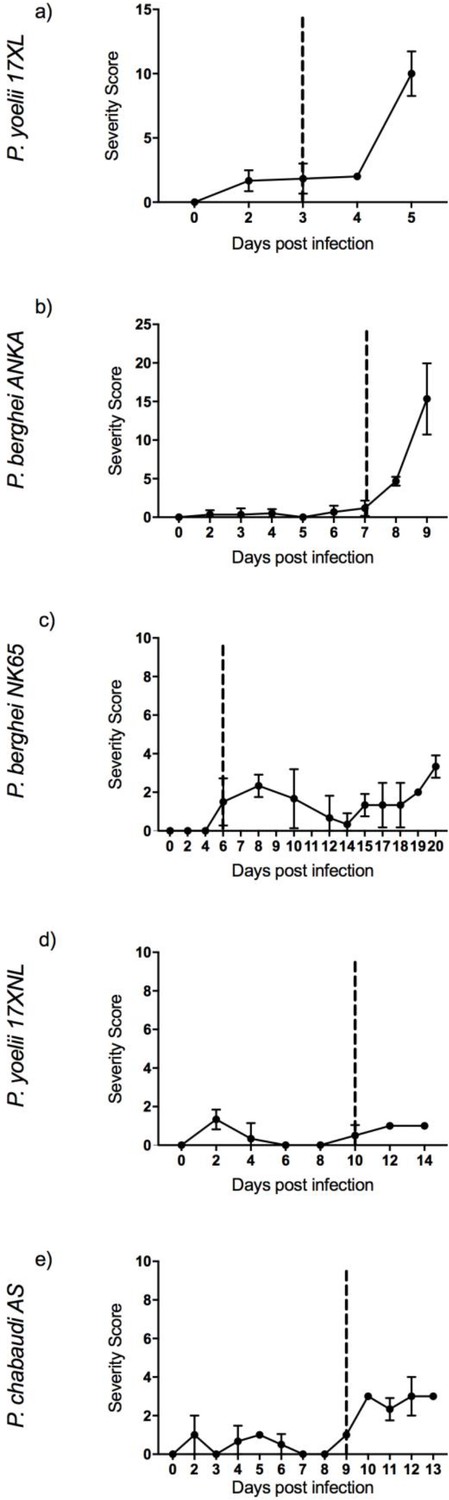
Severity scoring.
Severity scoring in five mouse malaria models: 8-week-old C57BL/6J female wild-type mice infected with: Plasmodium yoelii 17XL, P. berghei ANKA, P. berghei NK65, P. yoelii 17XNL, and P. chabaudi AS, respectively. Points show mean, and bars show SD, for n=6 mice (up to and including time point of first signs of ill health, dashed vertical line) and n=3 mice (after dashed vertical line) for each infection.
Figure 2 with 4 supplements
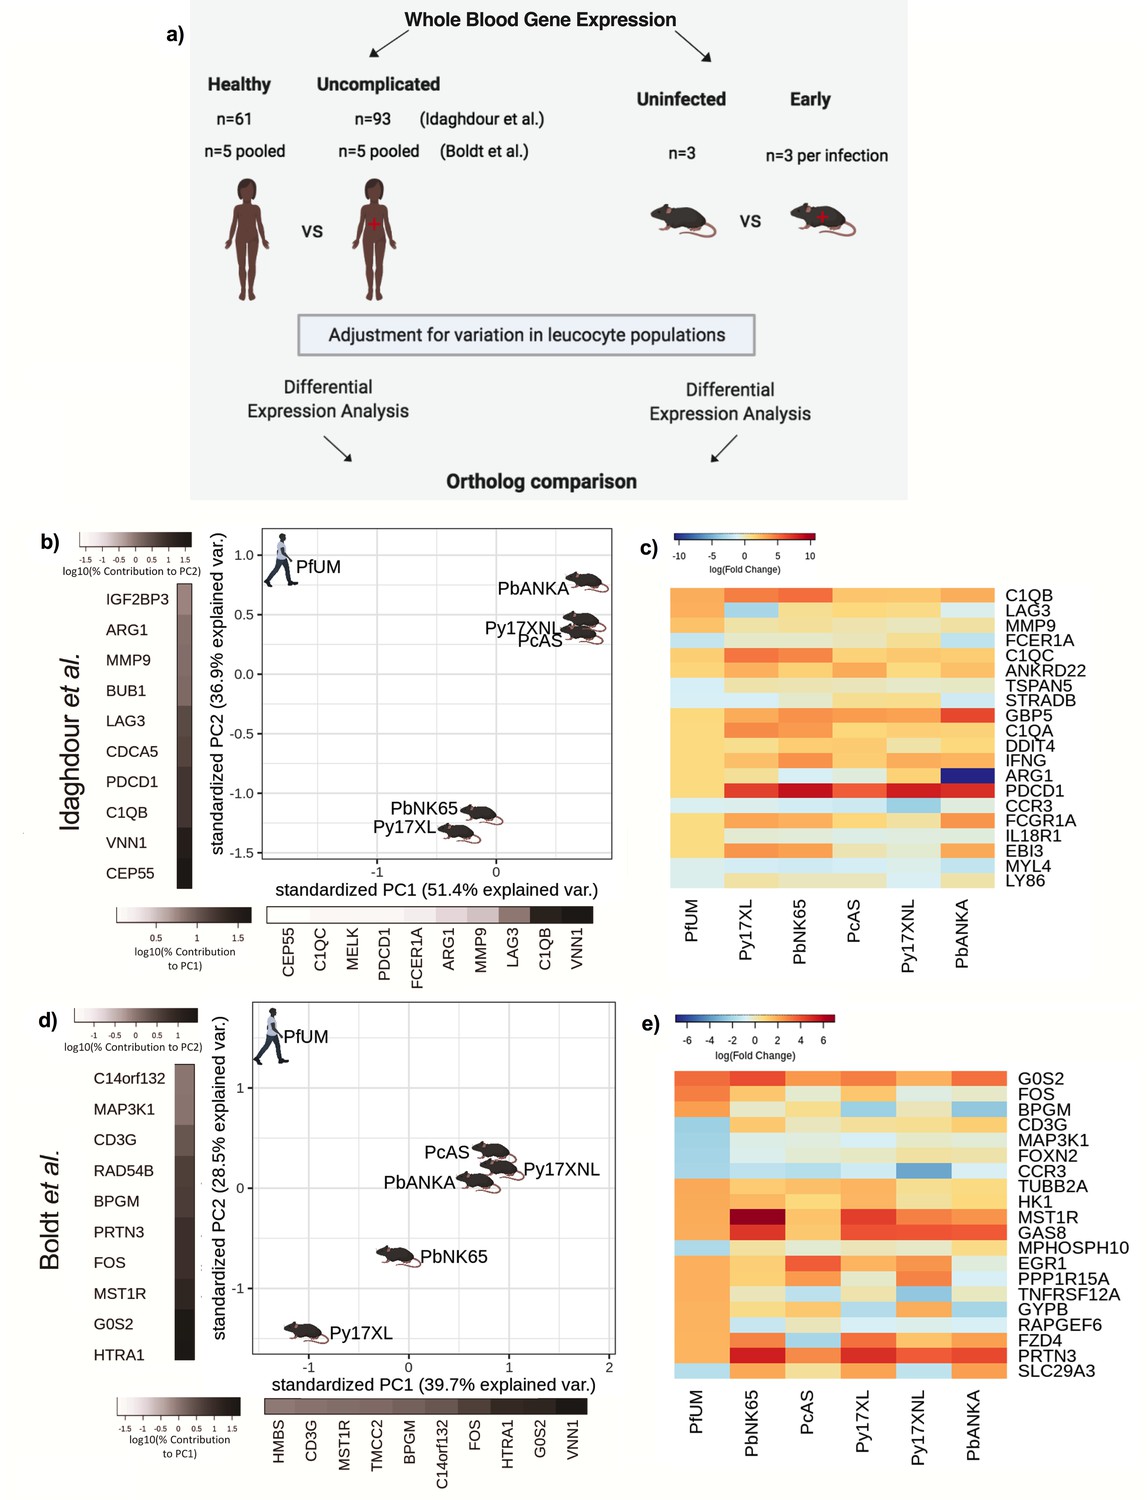
Comparison of host differential gene expression in human uncomplicated malaria and early stage illness in five mouse malaria models.
(a) Schematic illustration of the comparative transcriptomic analysis. (b, d) Principal component analysis (PCA) plots generated using rank-normalized log-fold change (logFC) values from the human and mouse differential expression analyses. Only genes with 1:1 mouse and human orthologs and with absolute logFC value greater than 1 in the corresponding human comparison were included. Comparison of changes in gene expression in the mouse models (uninfected vs. early in infection, Supplementary file 12) with those in uncomplicated malaria versus healthy (PfUMH) Beninese children (b, Idaghdour et al., 2012) or Gabonese children (Boldt et al., 2019). The percentage of the total variation explained by principal components 1 and 2 are shown in the axis labels. Greyscale heatmaps parallel to each axis show the contributions of the 10 genes contributing most to the corresponding PC. (c, e) Heatmaps show logFC for the 20 genes with the greatest absolute logFC values in the human differential gene expression analysis, and their orthologs in each mouse model, corresponding to the analyses illustrated in (b) and (d), respectively. Mouse models are ordered left to right in order of increasing dissimilarity to the human disease, based on the Euclidian distance calculated from all principal components (Supplementary file 13). The rows (genes) are ordered by absolute log-fold change in the human comparison in descending order. n=3 for early and n=3 for late time point in each mouse model; n=93 UM, n=61 controls (Beninese children, Idaghdour et al.), n=5 pools UM and n=5 pools healthy control samples (each pool contained RNA from four Gabonese children with the same phenotype, Boldt et al.). Full heatmaps for the expression of genes contributing most to the first two principal components in humans and each mouse model shown in Figure 2—figure supplements 1–4. The mouse model abbreviations are as follows: PbNK65 (P. berghei NK65), PbANKA (P. berghei ANKA), PcAS (P. chabaudi AS), Py17XL (P. yoelii 17XL), and Py17XNL (P. yoelii 17XNL).
Figure 2—figure supplement 1
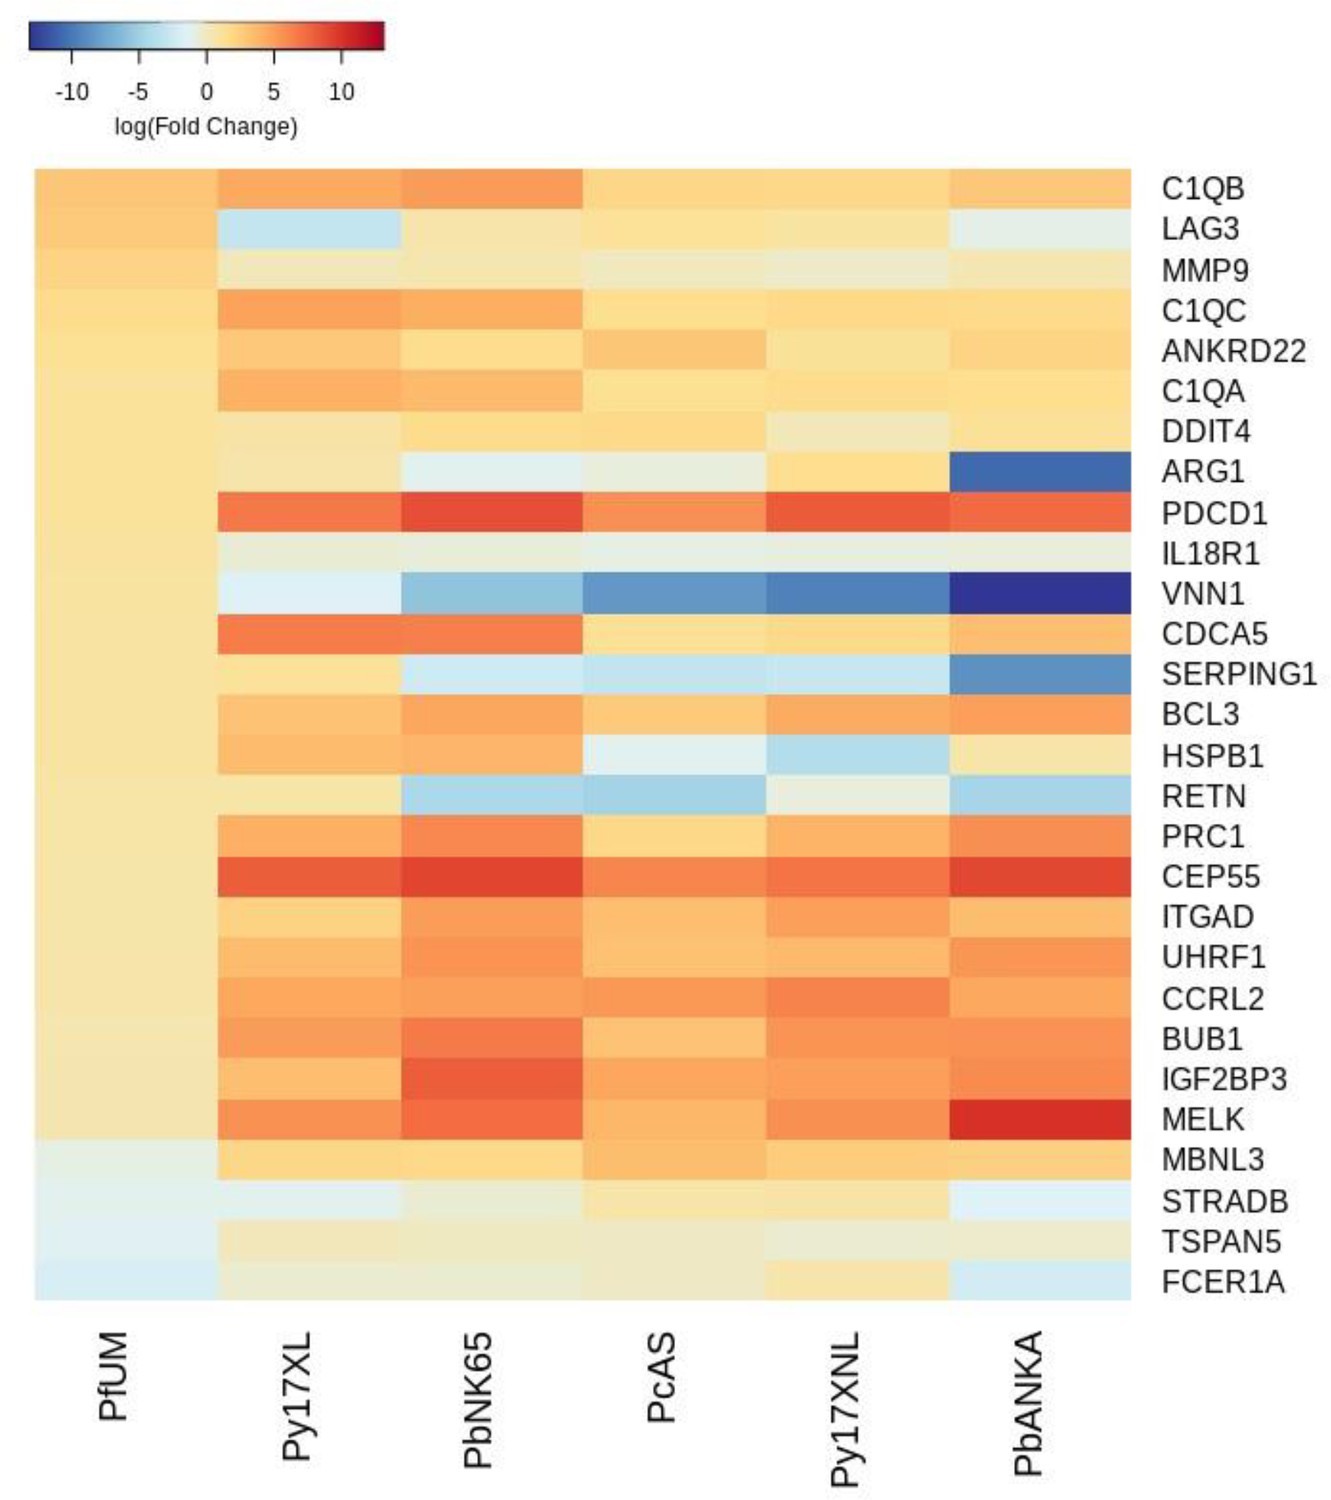
Additional heatmaps for Figure 2.
The logFC values of all the genes contributing greater than 0.1% to Principal Component 1 (PC1) of the corresponding PCA plot (Figure 2b) were extracted for the human and each mouse comparison and used to generate this heatmap. The sample rows of this plot are ordered according to increasing Euclidean distance from the human. This corresponds to the Idaghdour et al. data set comparative transcriptomics results.
Figure 2—figure supplement 2
Additional heatmaps for Figure 2.
The logFC values of all the genes contributing greater than 0.1% to Principal Component 2 (PC2) of the corresponding PCA plot (Figure 2b) were extracted for the human and each mouse comparison and used to generate this heatmap. The sample rows of this plot are ordered according to increasing Euclidean distance from the human. This corresponds to the Idaghdour et al. data set comparative transcriptomics results.
Figure 2—figure supplement 3
Additional heatmaps for Figure 2.
The logFC values of all the genes contributing greater than 0.1% to Principal Component 1 (PC1) of the corresponding PCA plot (Figure 2d) were extracted for the human and each mouse comparison and used to generate this heatmap. The sample rows of this plot are ordered according to increasing Euclidean distance from the human. This corresponds to the Boldt et al. data set comparative transcriptomics results.
Figure 2—figure supplement 4
Additional heatmaps for Figure 2.
The logFC values of all the genes contributing greater than 0.1% to Principal Component 2 (PC2) of the corresponding PCA plot (Figure 2d) were extracted for the human and each mouse comparison and used to generate this heatmap. The sample rows of this plot are ordered according to increasing Euclidean distance from the human. This corresponds to the Boldt et al. data set comparative transcriptomics results.
Figure 3 with 6 supplements
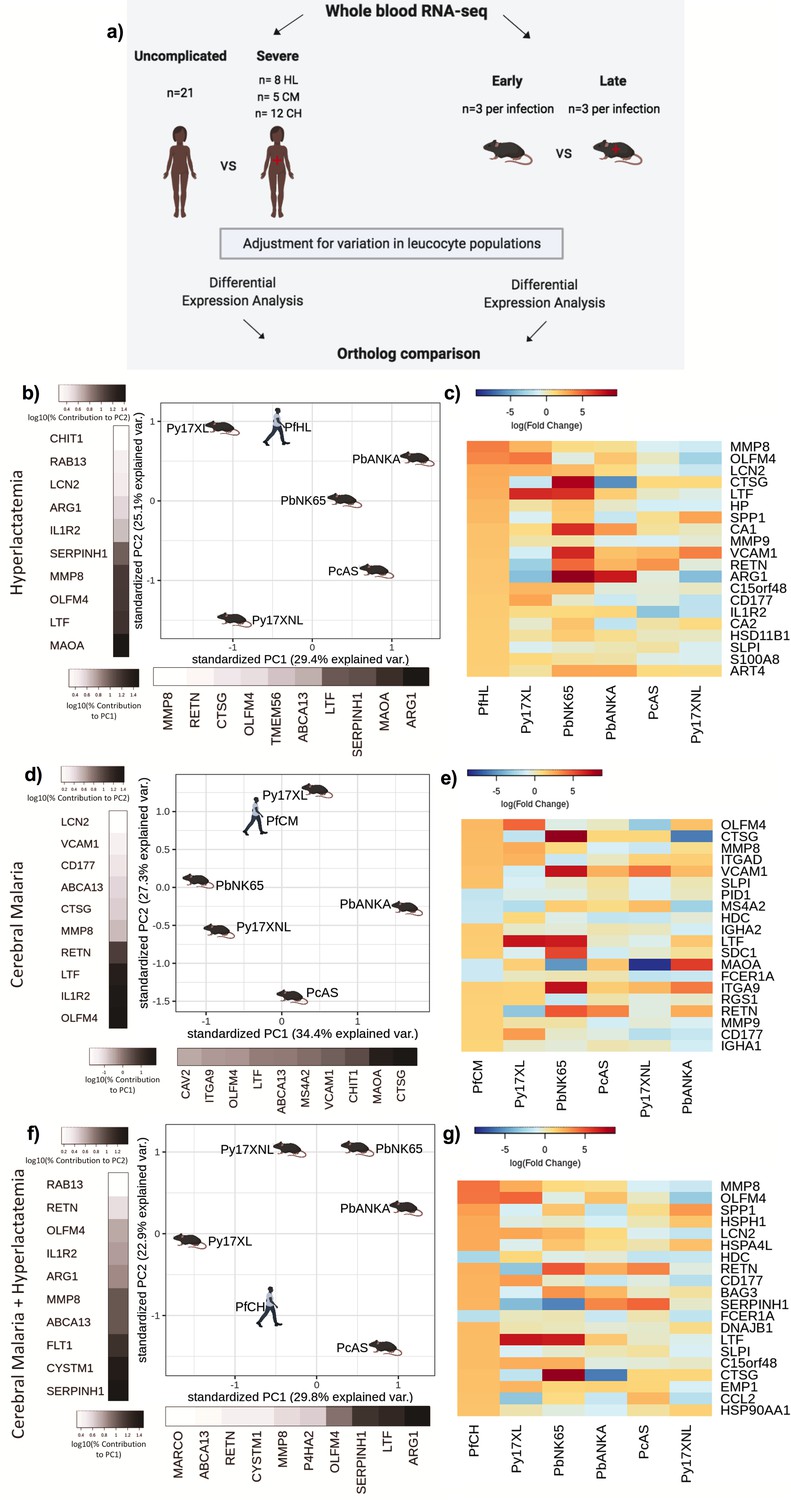
Comparison of host differential gene expression in three severe malaria phenotypes in Gambian Children and five mouse malaria models.
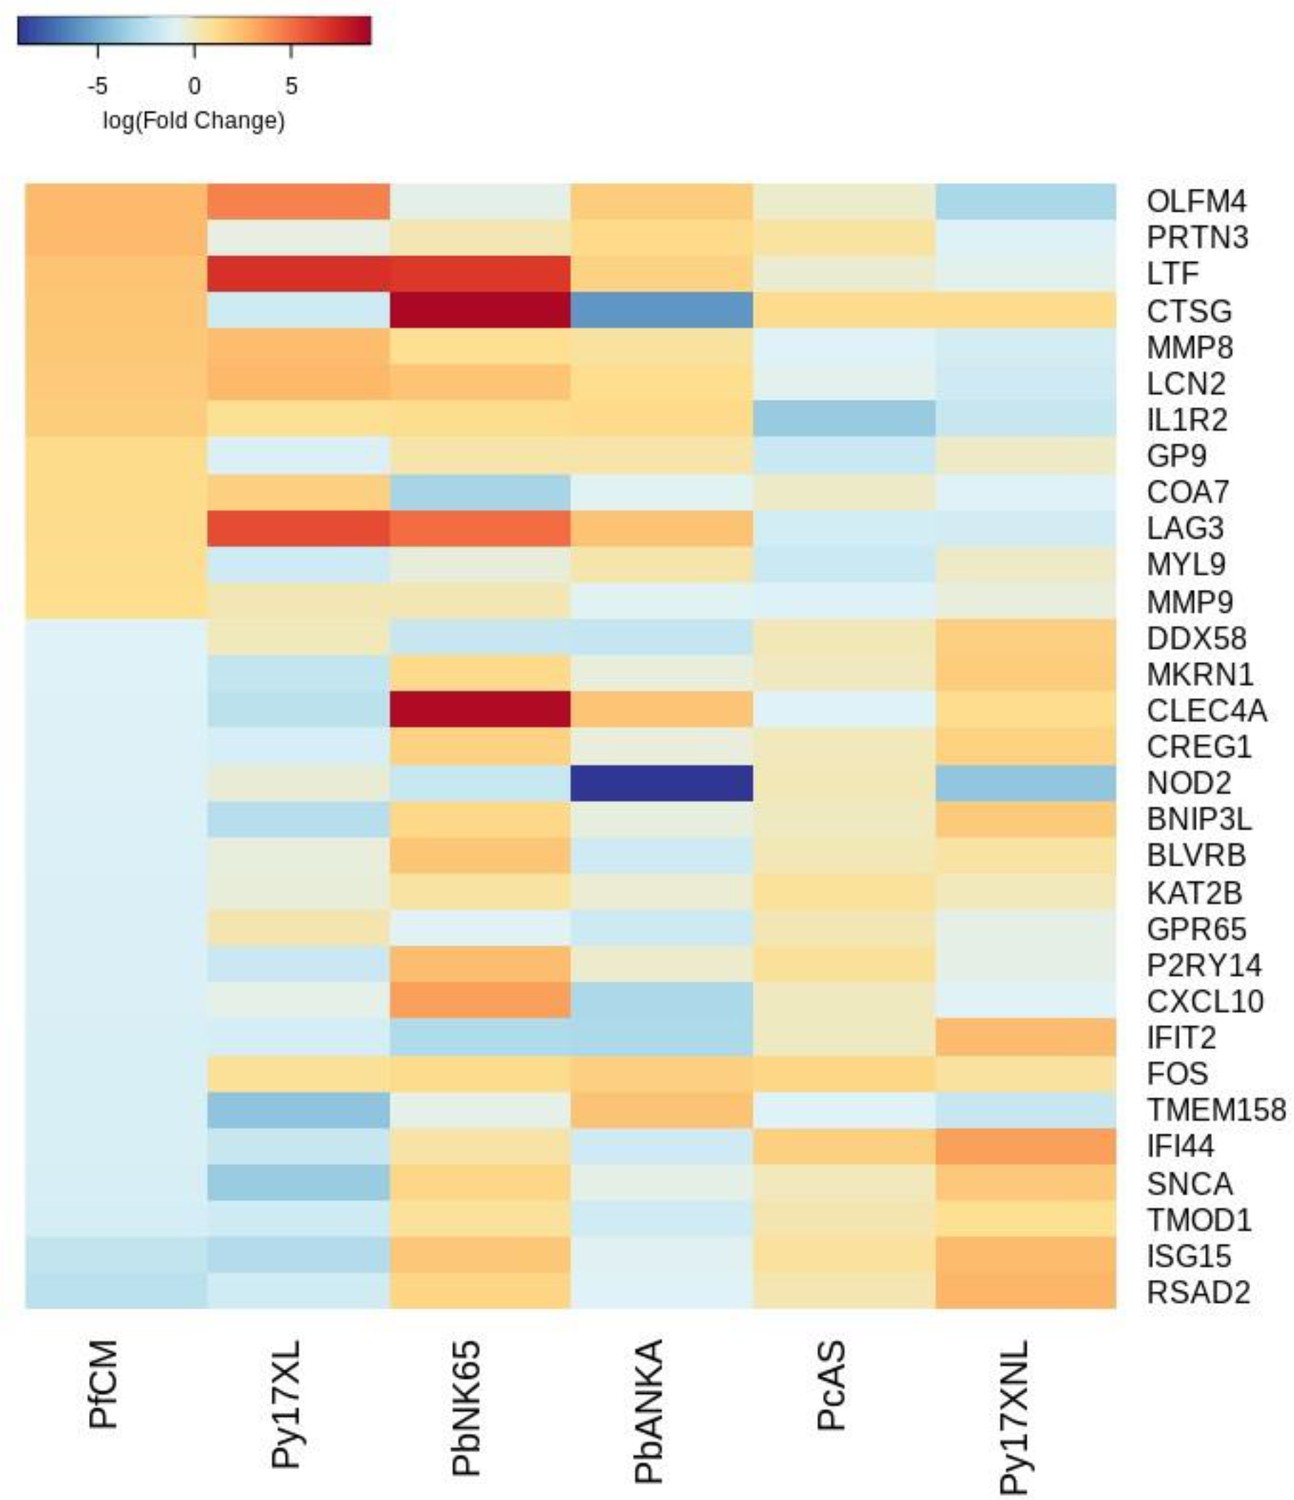
(a) Schematic illustration of the comparative transcriptomic analysis. (b, d, f) Principal component analysis (PCA) plots generated using rank-normalized log-fold change values from the human and mouse differential expression analyses. Only genes with 1:1 mouse and human orthologs and with absolute logFC value greater than 1 in the corresponding human comparison were included. Comparison of changes in gene expression in the mouse models with those in human hyperlactatemia (PfHL) (b), cerebral malaria (PfCM) (d), or human hyperlactatemia plus cerebral malaria phenotype (PfCH) (f). The percentage of the total variation explained by principal components 1 and 2 are shown in the axis labels. Grayscale heatmaps parallel to each axis show the contributions of the 10 genes contributing most to the corresponding PC (c, e, g). Heatmaps show logFC for the 20 genes with the greatest absolute logFC values in the human differential gene expression analysis, and their orthologs in each mouse model, corresponding to the analyses illustrated in (b), (d), and (f), respectively. Mouse models are ordered left to right in order of increasing dissimilarity to the human disease, based on the Euclidian distance calculated from all principal components (Supplementary file 13). The rows (genes) are ordered by absolute logFC in the human comparison in descending order. n=3 for early and n=3 for late time point in each mouse model; n=21 Uncomplicated, n=8 HL, n=5 CM, n=12 CH. Full heatmaps for the expression of genes contributing most to the first two principal components in humans and each mouse model shown in Figure 3—figure supplements 1–6. The mouse model abbreviations are as follows: PbNK65 (Plasmodium berghei NK65), PbANKA (P. berghei ANKA), PcAS (P. chabaudi AS), Py17XL (P. yoelii 17XL), and Py17XNL (P. yoelii 17XNL).
Figure 3—figure supplement 1
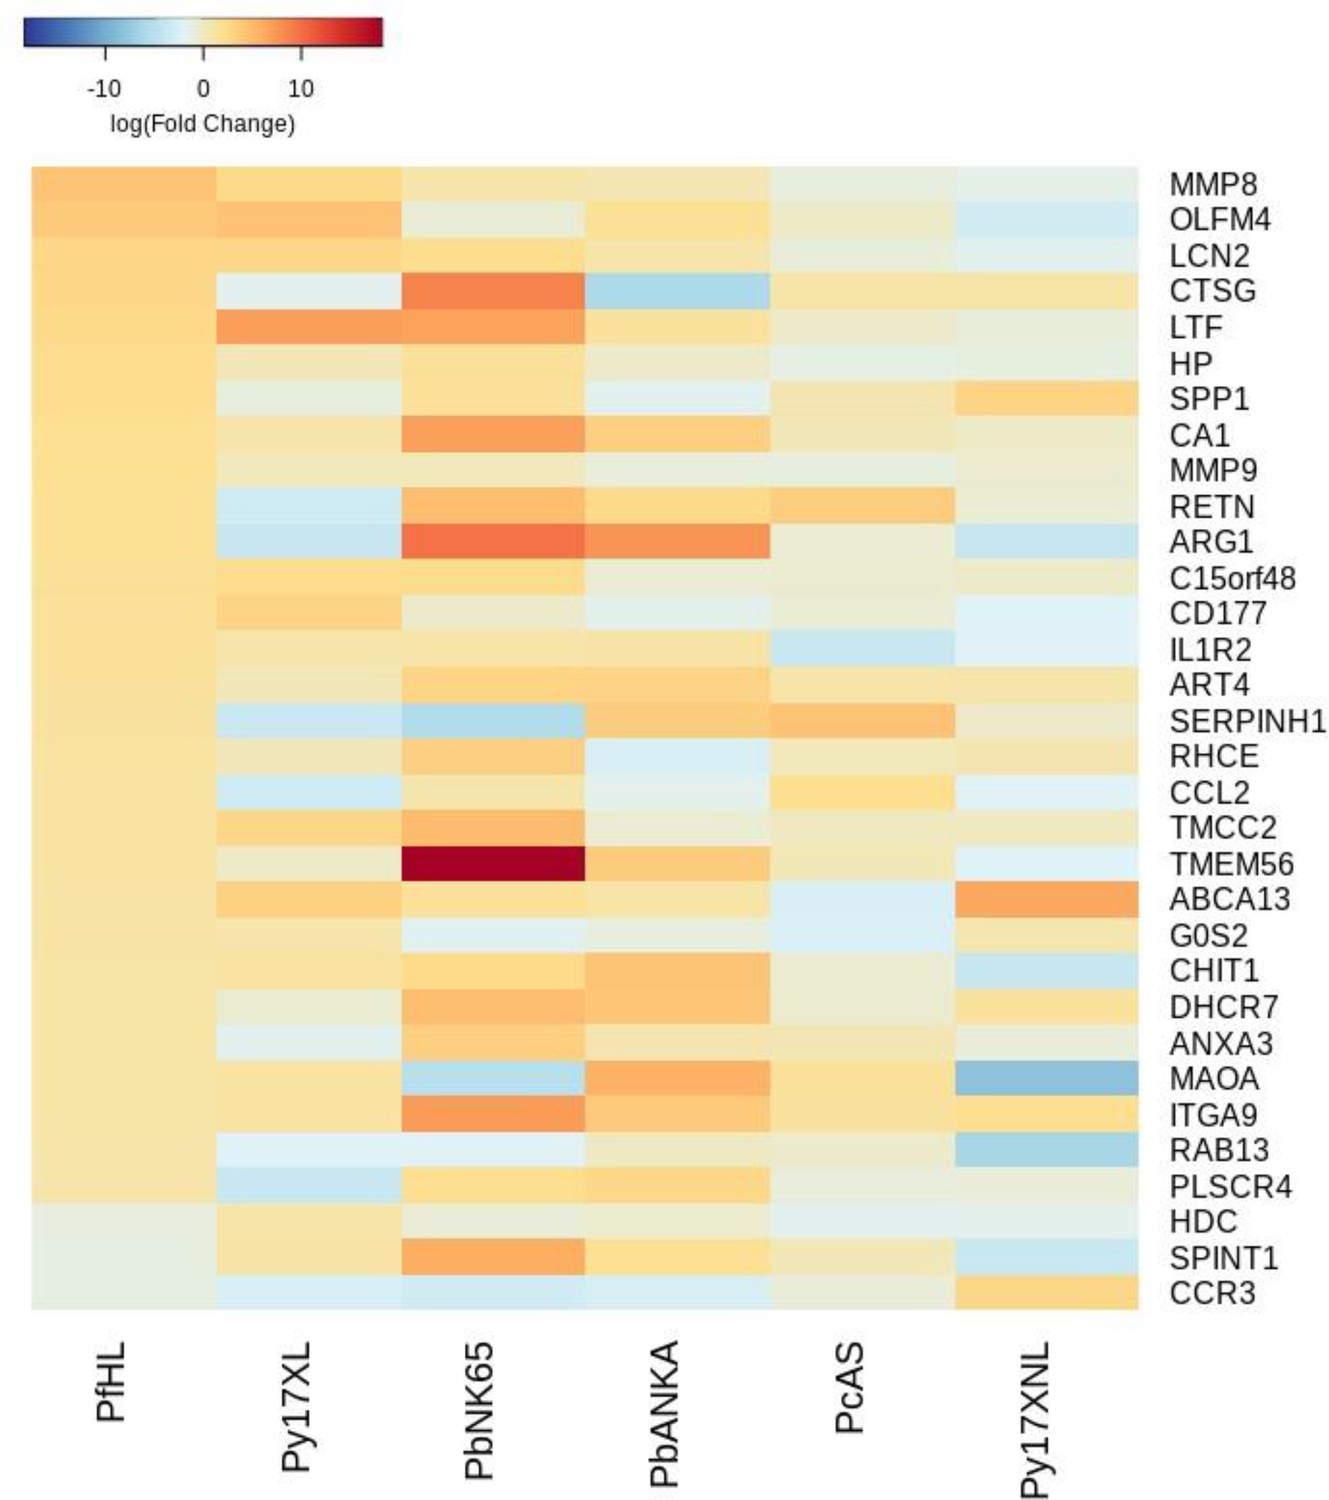
Additional heatmaps for Figure 3.
The logFC values of all the genes contributing greater than 0.1% to Principal Component 1 (PC1) of the corresponding PCA plot (Figure 3b) were extracted for the human and each mouse comparison and used to generate this heatmap. The sample rows of this plot are ordered according to increasing Euclidean distance from the human. This corresponds to the human RNA-Seq hyperlactatemia data set comparative transcriptomics results.
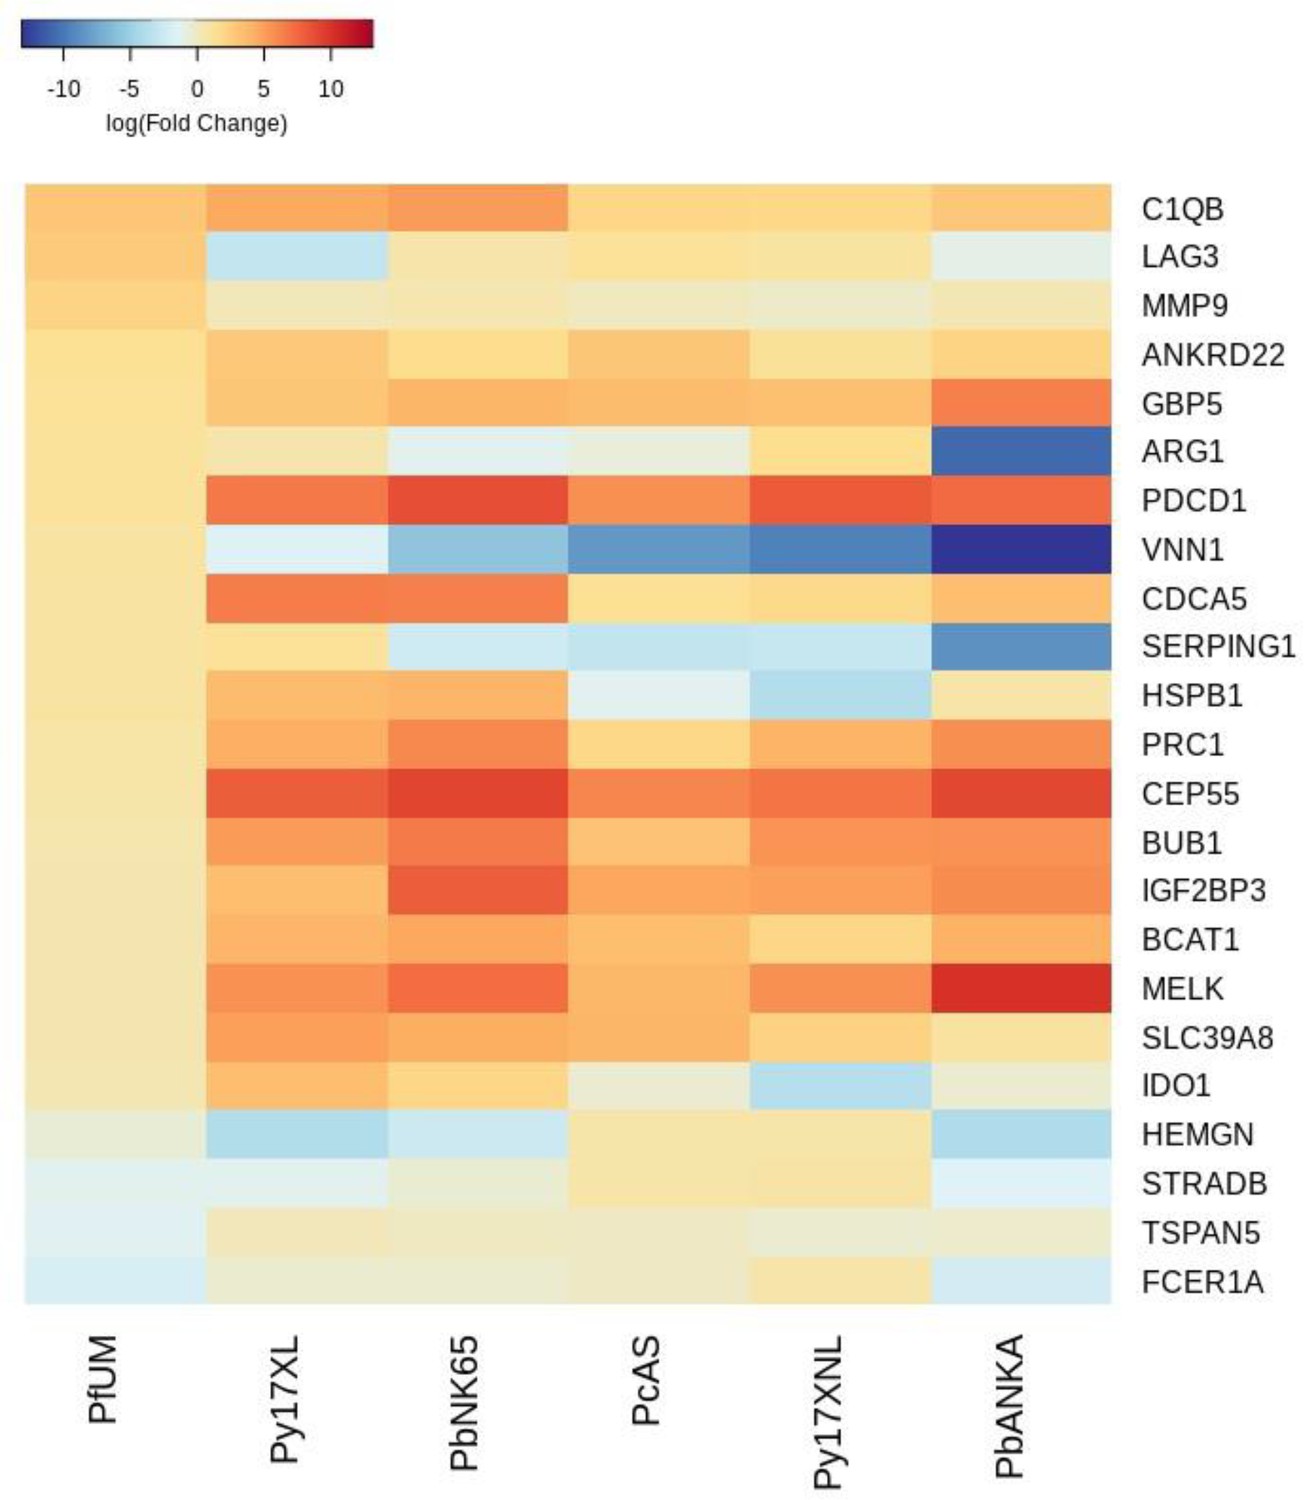
Figure 3—figure supplement 2
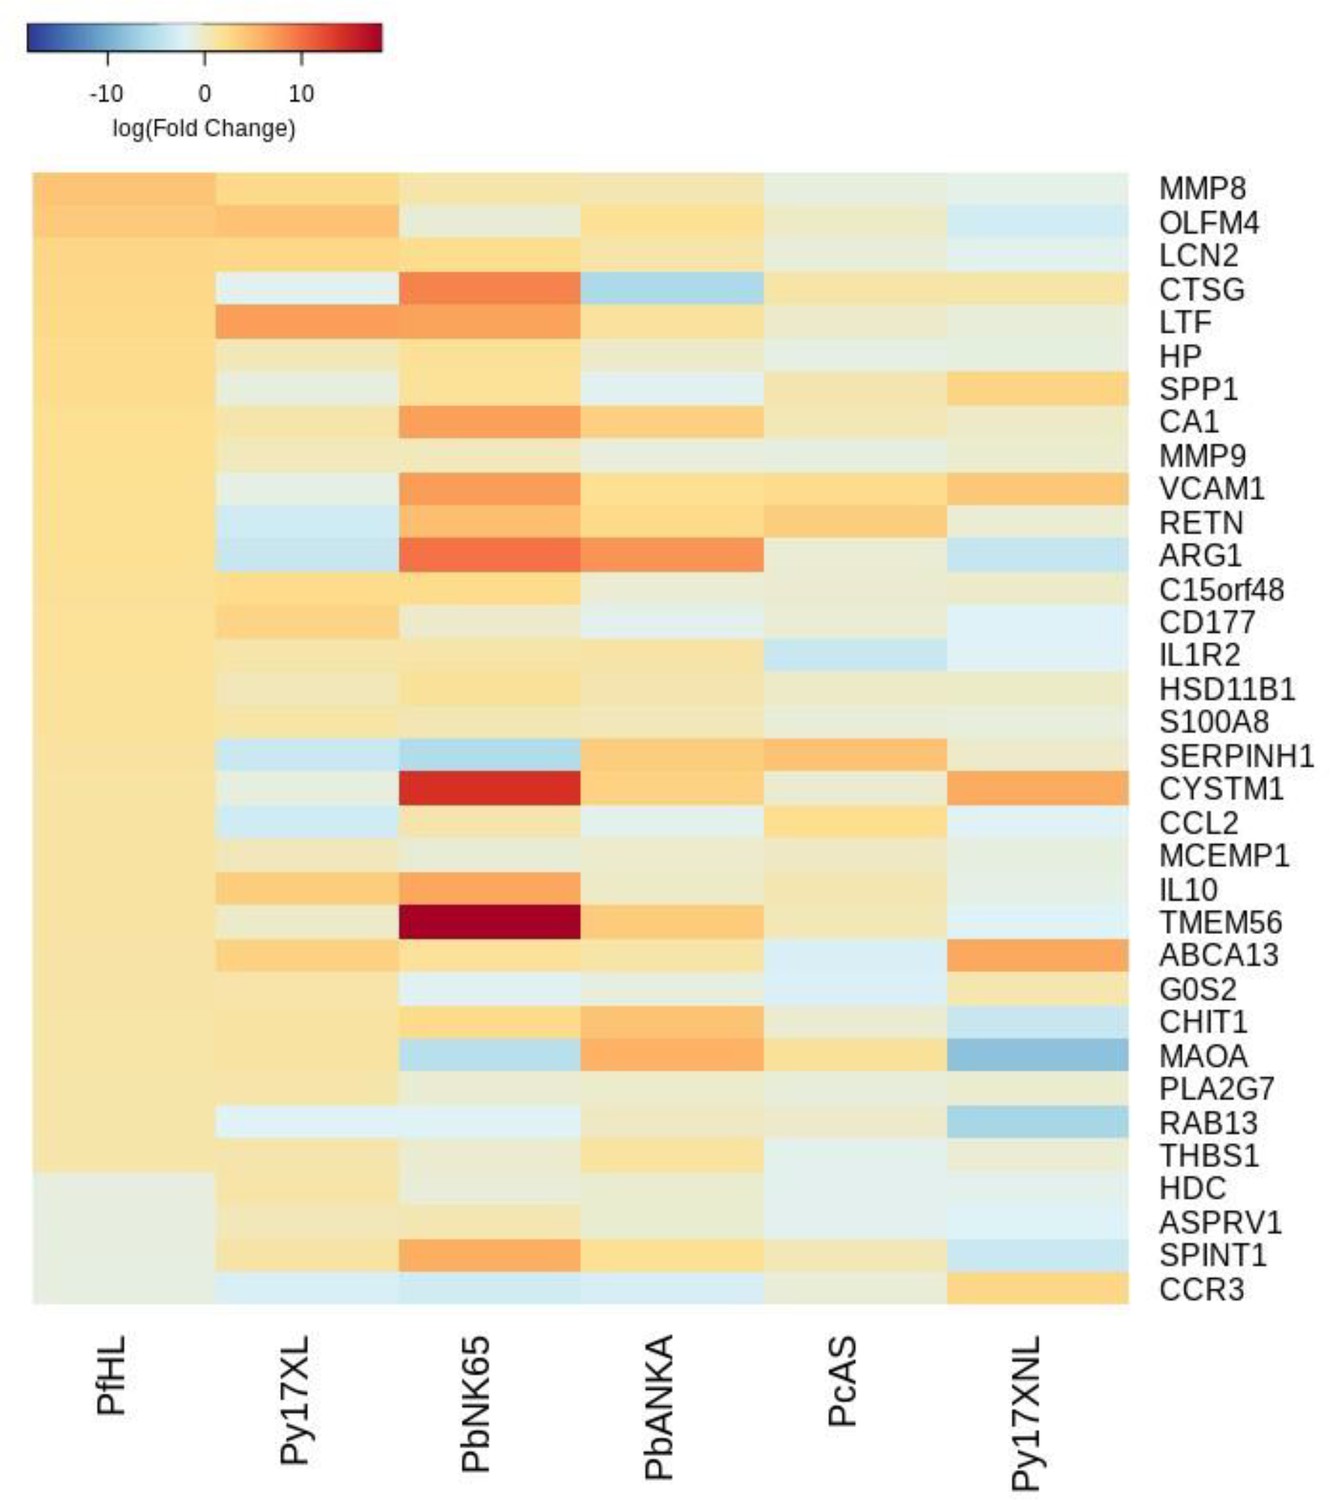
Additional heatmaps for Figure 3.
The logFC values of all the genes contributing greater than 0.1% to Principal Component 2 (PC2) of the corresponding PCA plot (Figure 3b) were extracted for the human and each mouse comparison and used to generate this heatmap. The sample rows of this plot are ordered according to increasing Euclidean distance from the human. This corresponds to the human RNA-Seq hyperlactatemia data set comparative transcriptomics results.
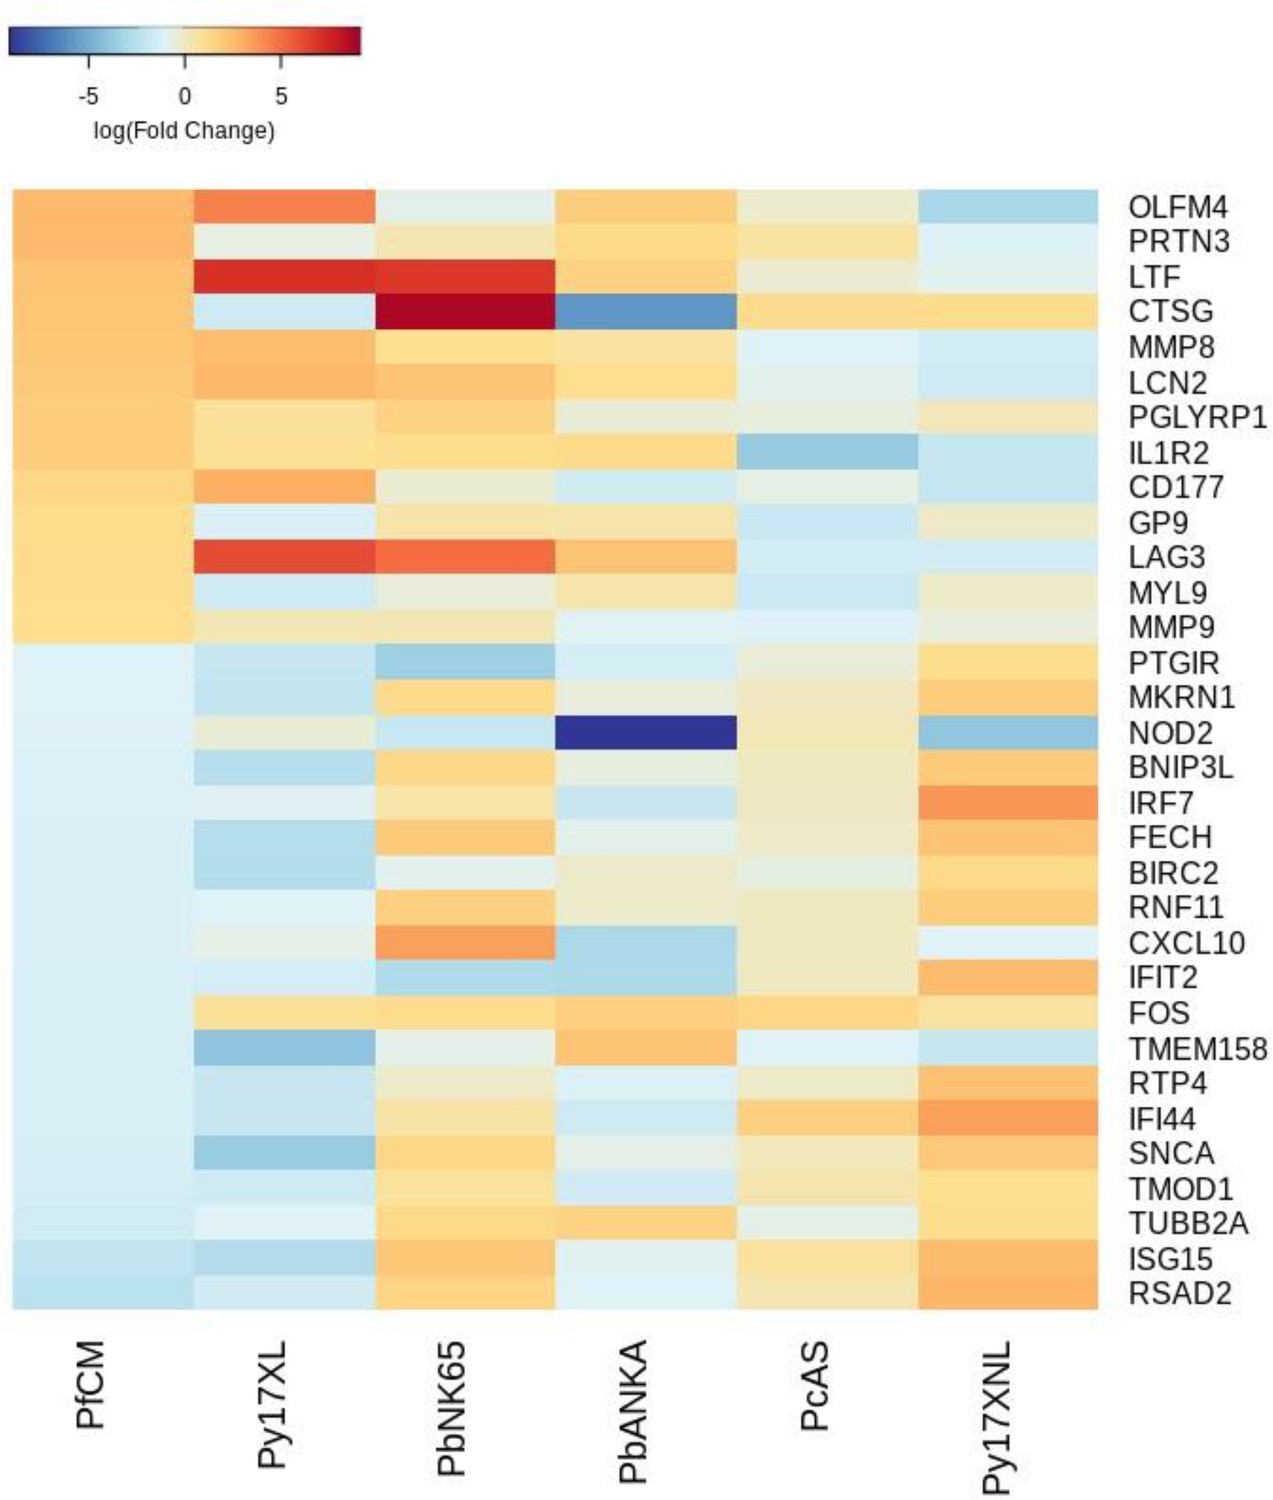
Figure 3—figure supplement 3
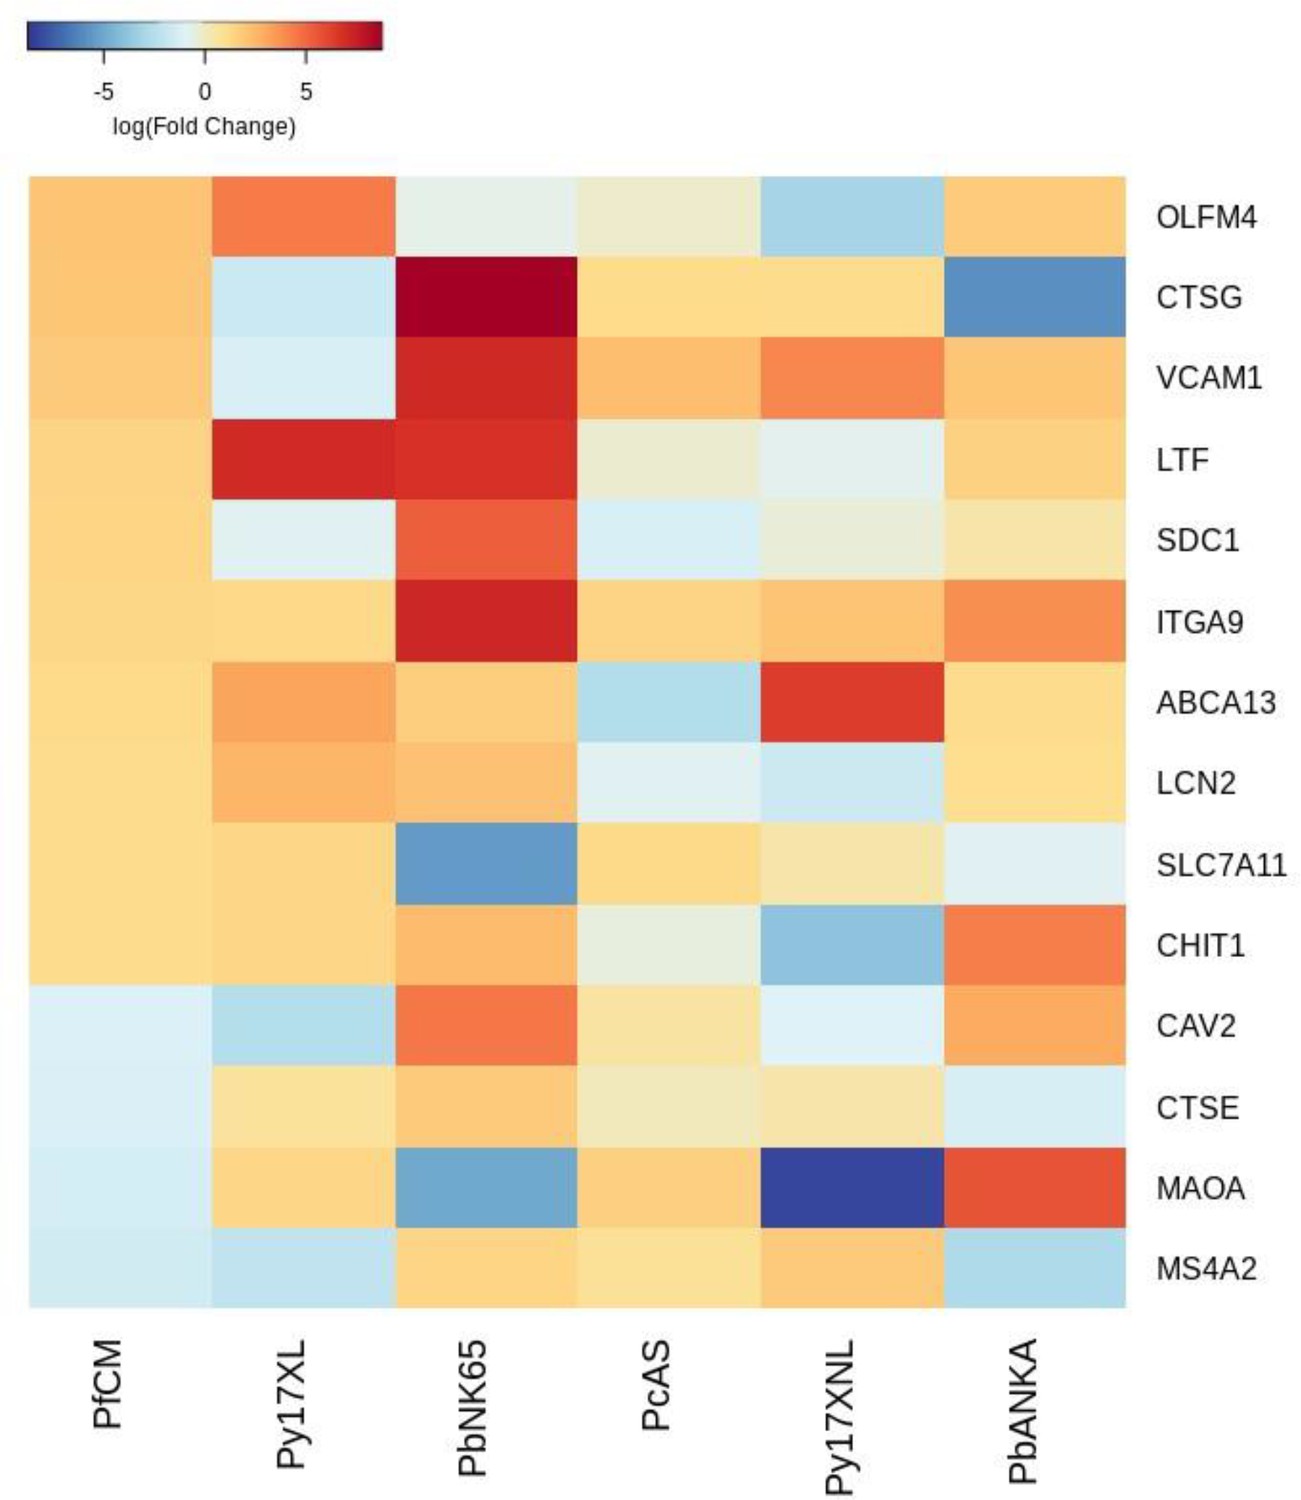
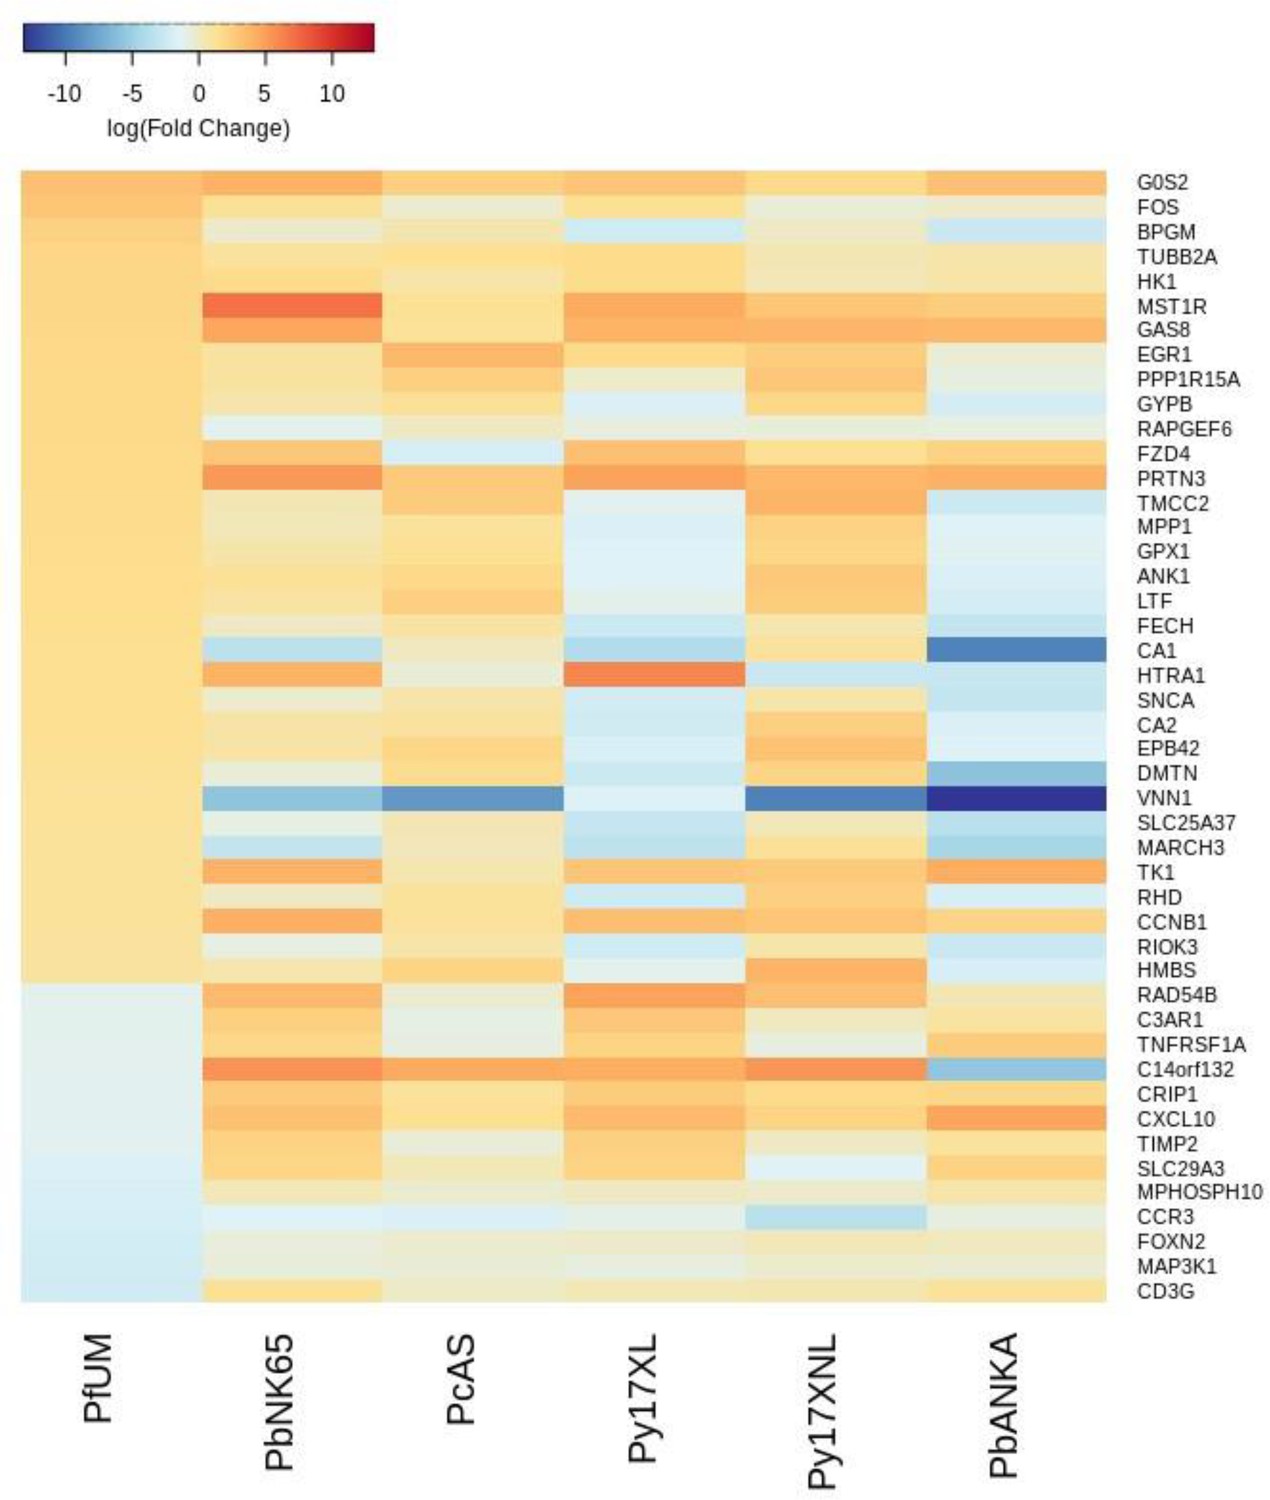
Additional heatmaps for Figure 3.
The logFC values of all the genes contributing greater than 0.1% to Principal Component 1 (PC1) of the corresponding PCA plot (Figure 3d) were extracted for the human and each mouse comparison and used to generate this heatmap. The sample rows of this plot are ordered according to increasing Euclidean distance from the human. This corresponds to the human RNA-Seq cerebral malaria data set comparative transcriptomics results.
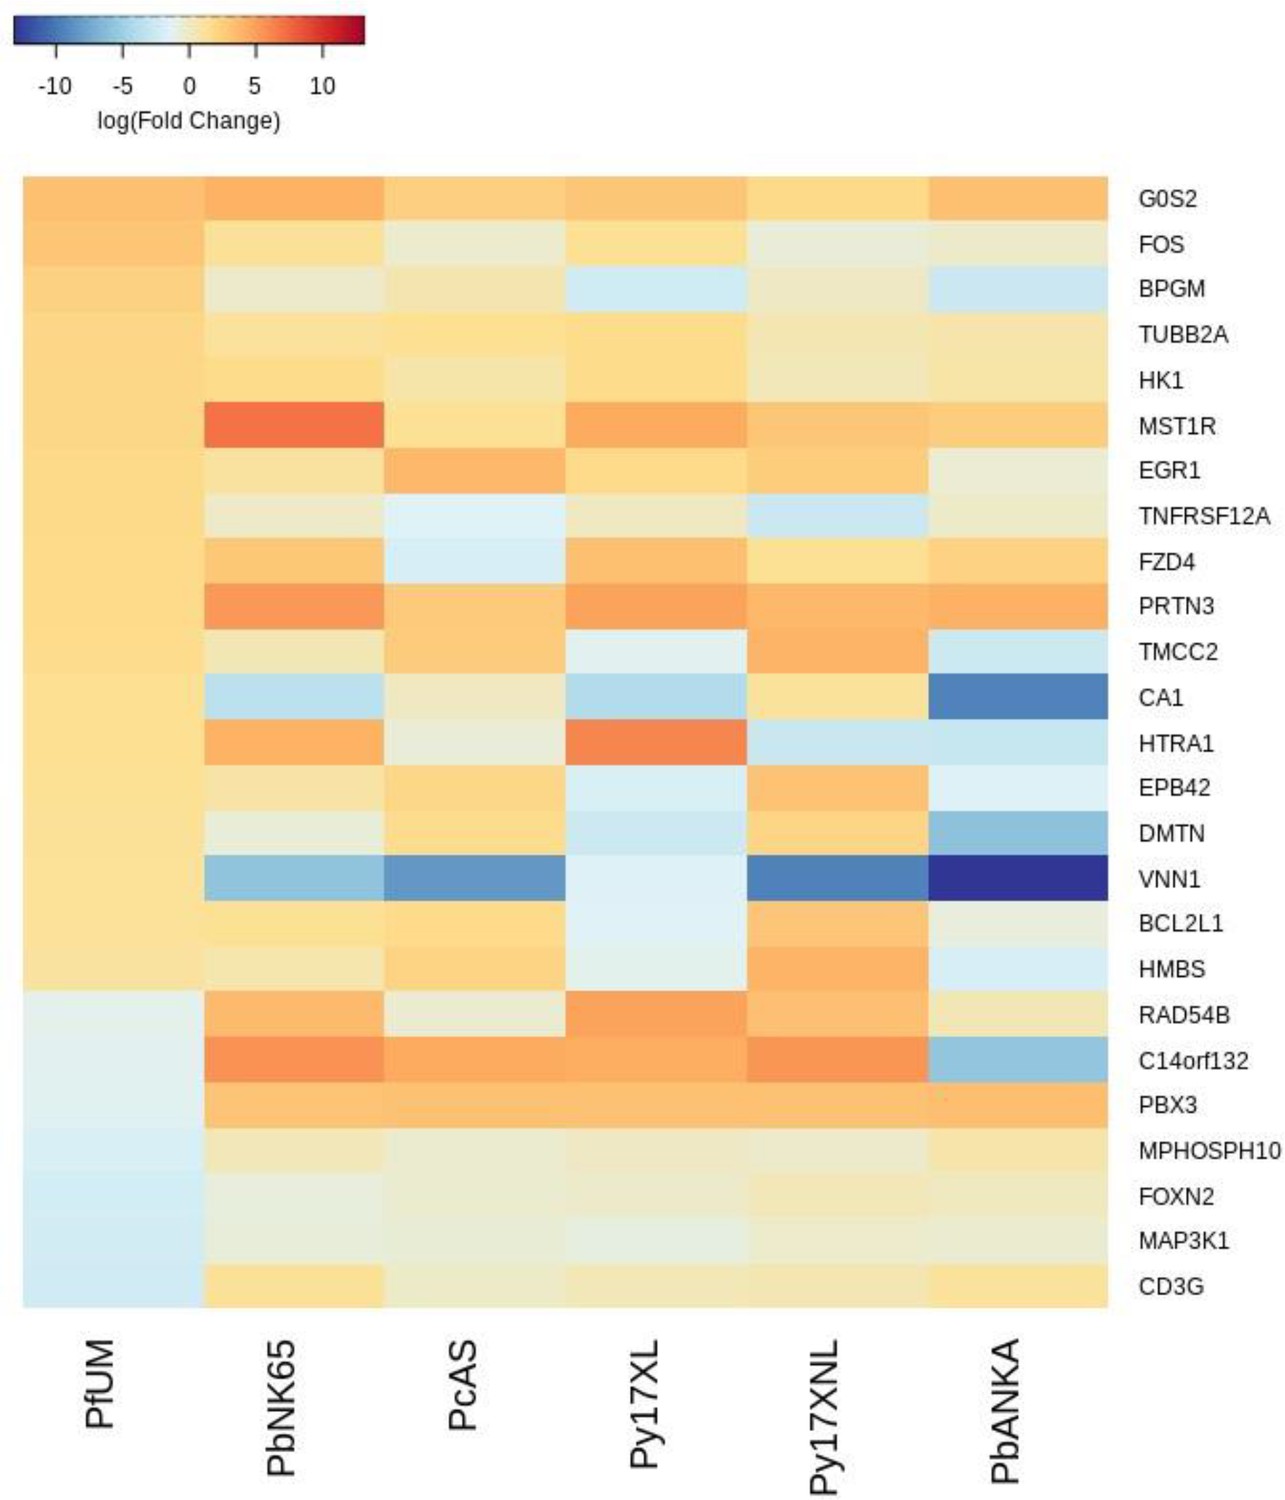
Figure 3—figure supplement 4
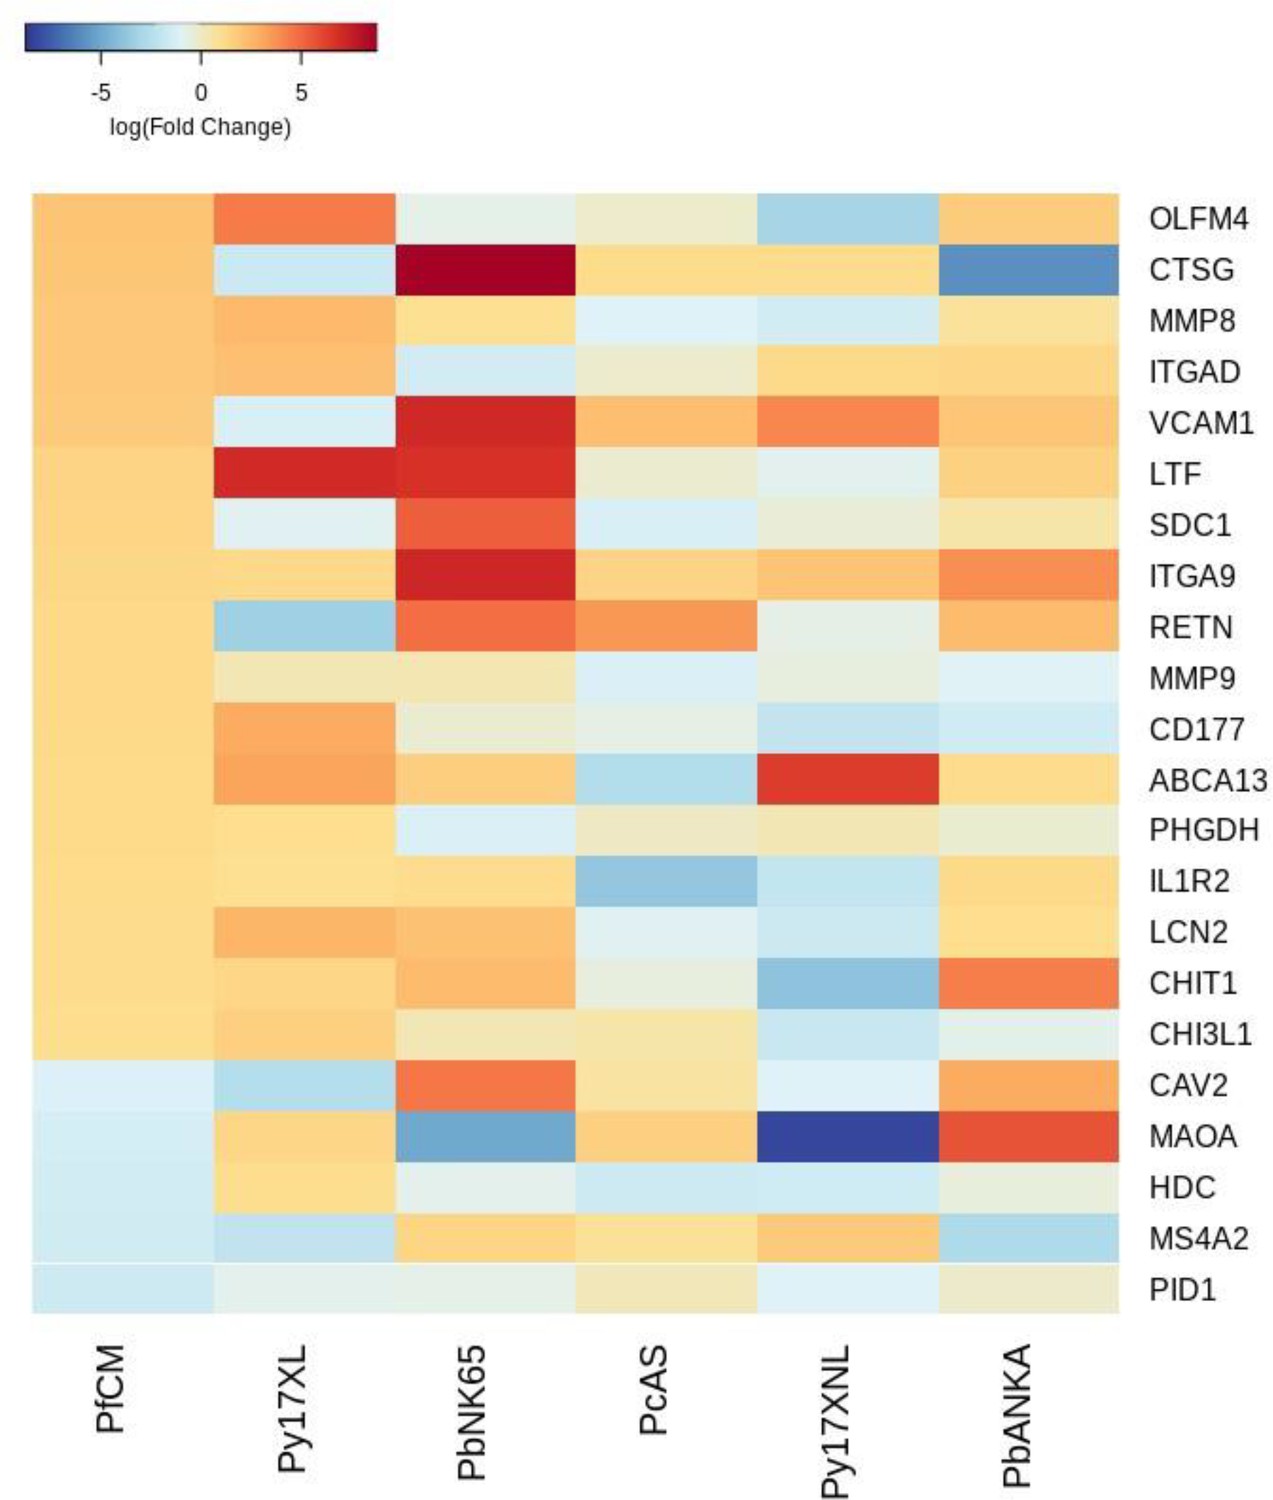
Additional heatmaps for Figure 3.
The logFC values of all the genes contributing greater than 0.1% to Principal Component 2 (PC2) of the corresponding PCA plot (Figure 3d) were extracted for the human and each mouse comparison and used to generate this heatmap. The sample rows of this plot are ordered according to increasing Euclidean distance from the human. This corresponds to the human RNA-Seq cerebral malaria data set comparative transcriptomics results.
Figure 3—figure supplement 5
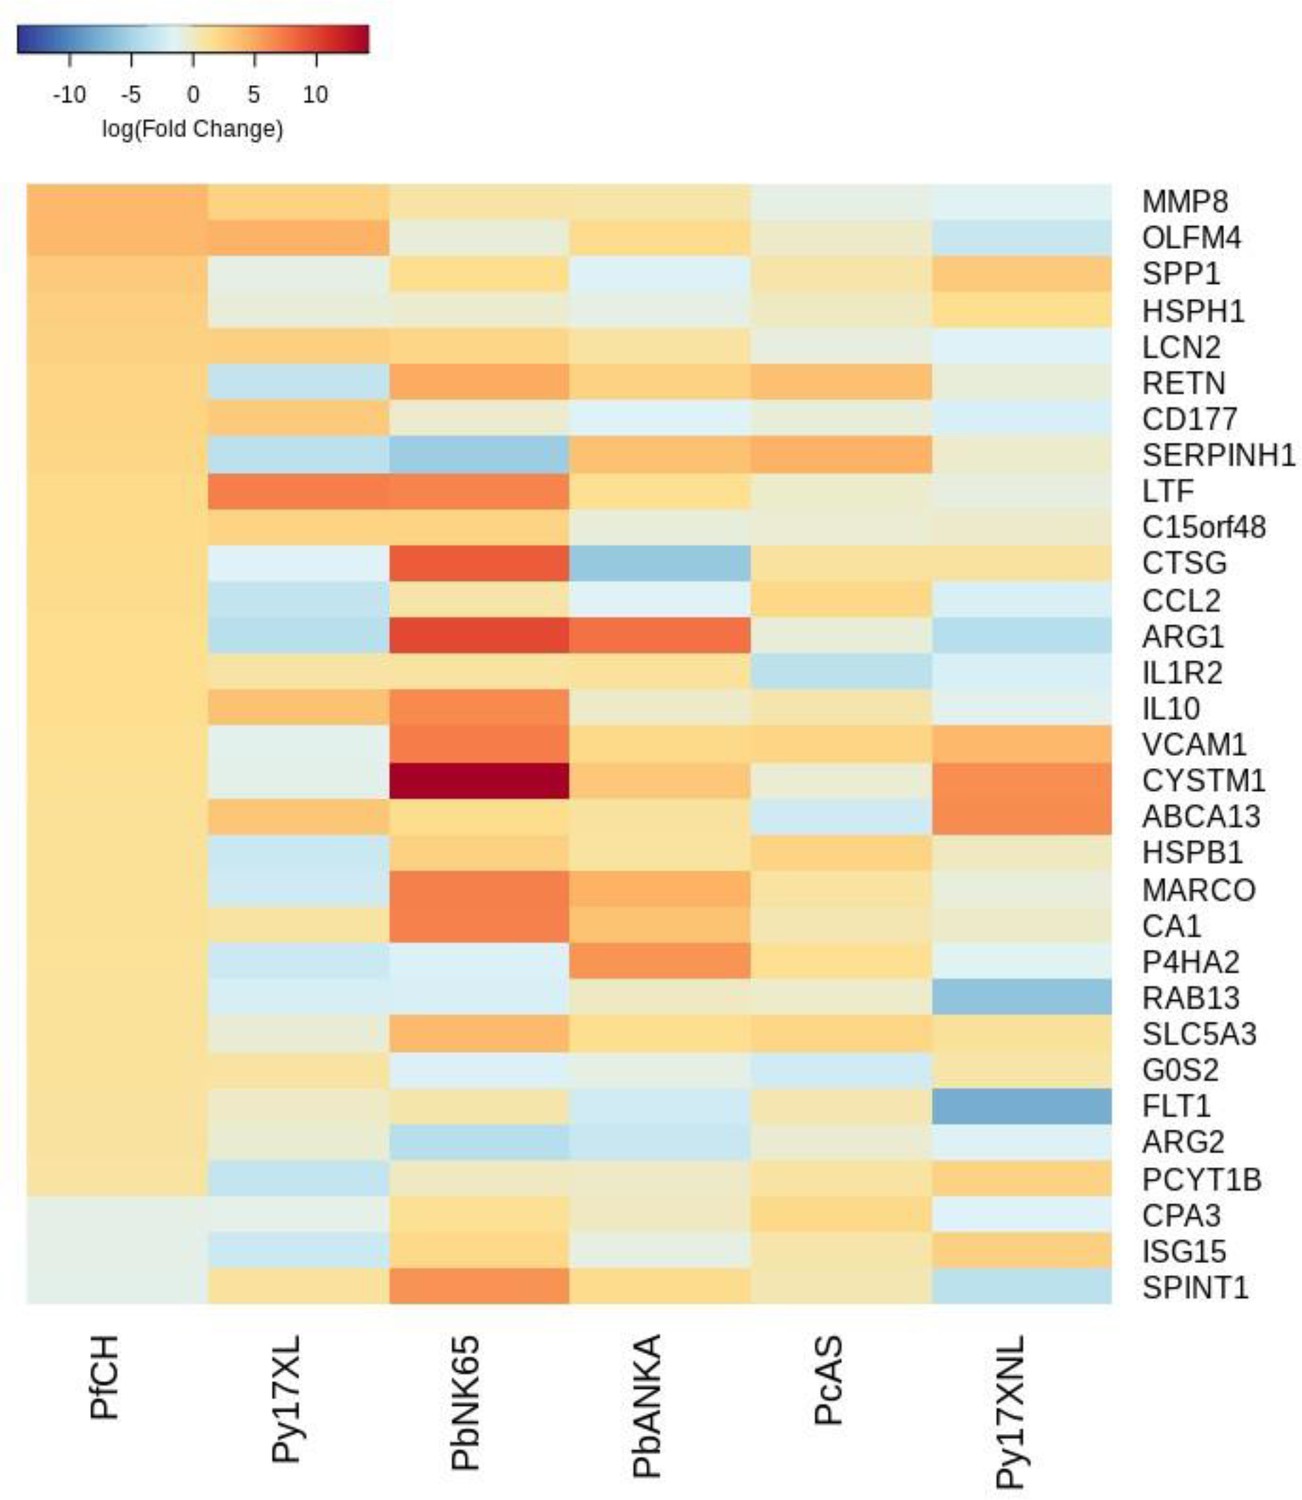
Additional heatmaps for Figure 3.
The logFC values of all the genes contributing greater than 0.1% to Principal Component 1 (PC1) of the corresponding PCA plot (Figure 3f) were extracted for the human and each mouse comparison and used to generate this heatmap. The sample rows of this plot are ordered according to increasing Euclidean distance from the human. This corresponds to the human RNA-Seq cerebral malaria+hyperlactatemia data set comparative transcriptomics results.
Figure 3—figure supplement 6
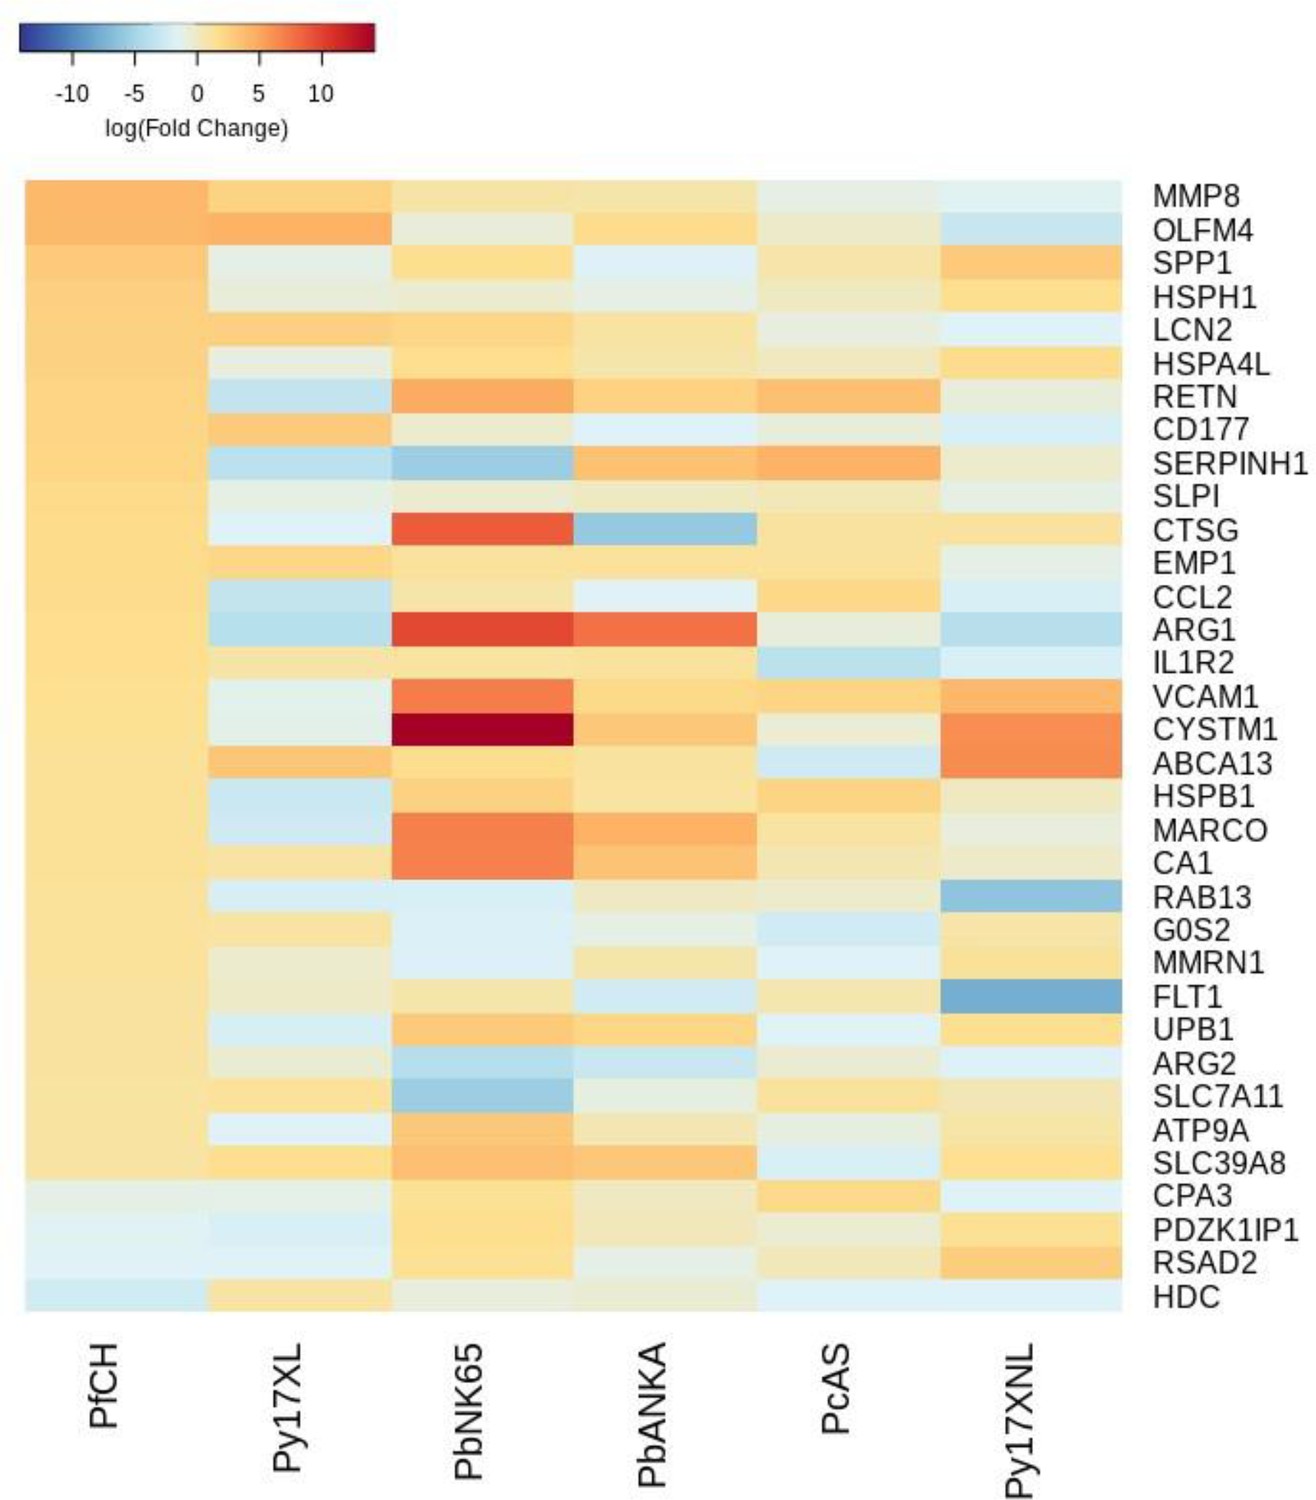
Additional heatmaps for Figure 3.
The logFC values of all the genes contributing greater than 0.1% to Principal Component 2 (PC2) of the corresponding PCA plot (Figure 3f) were extracted for the human and each mouse comparison and used to generate this heatmap. The sample rows of this plot are ordered according to increasing Euclidean distance from the human. This corresponds to the human RNA-Seq cerebral malaria+hyperlactatemia data set comparative transcriptomics results.
Figure 4 with 4 supplements
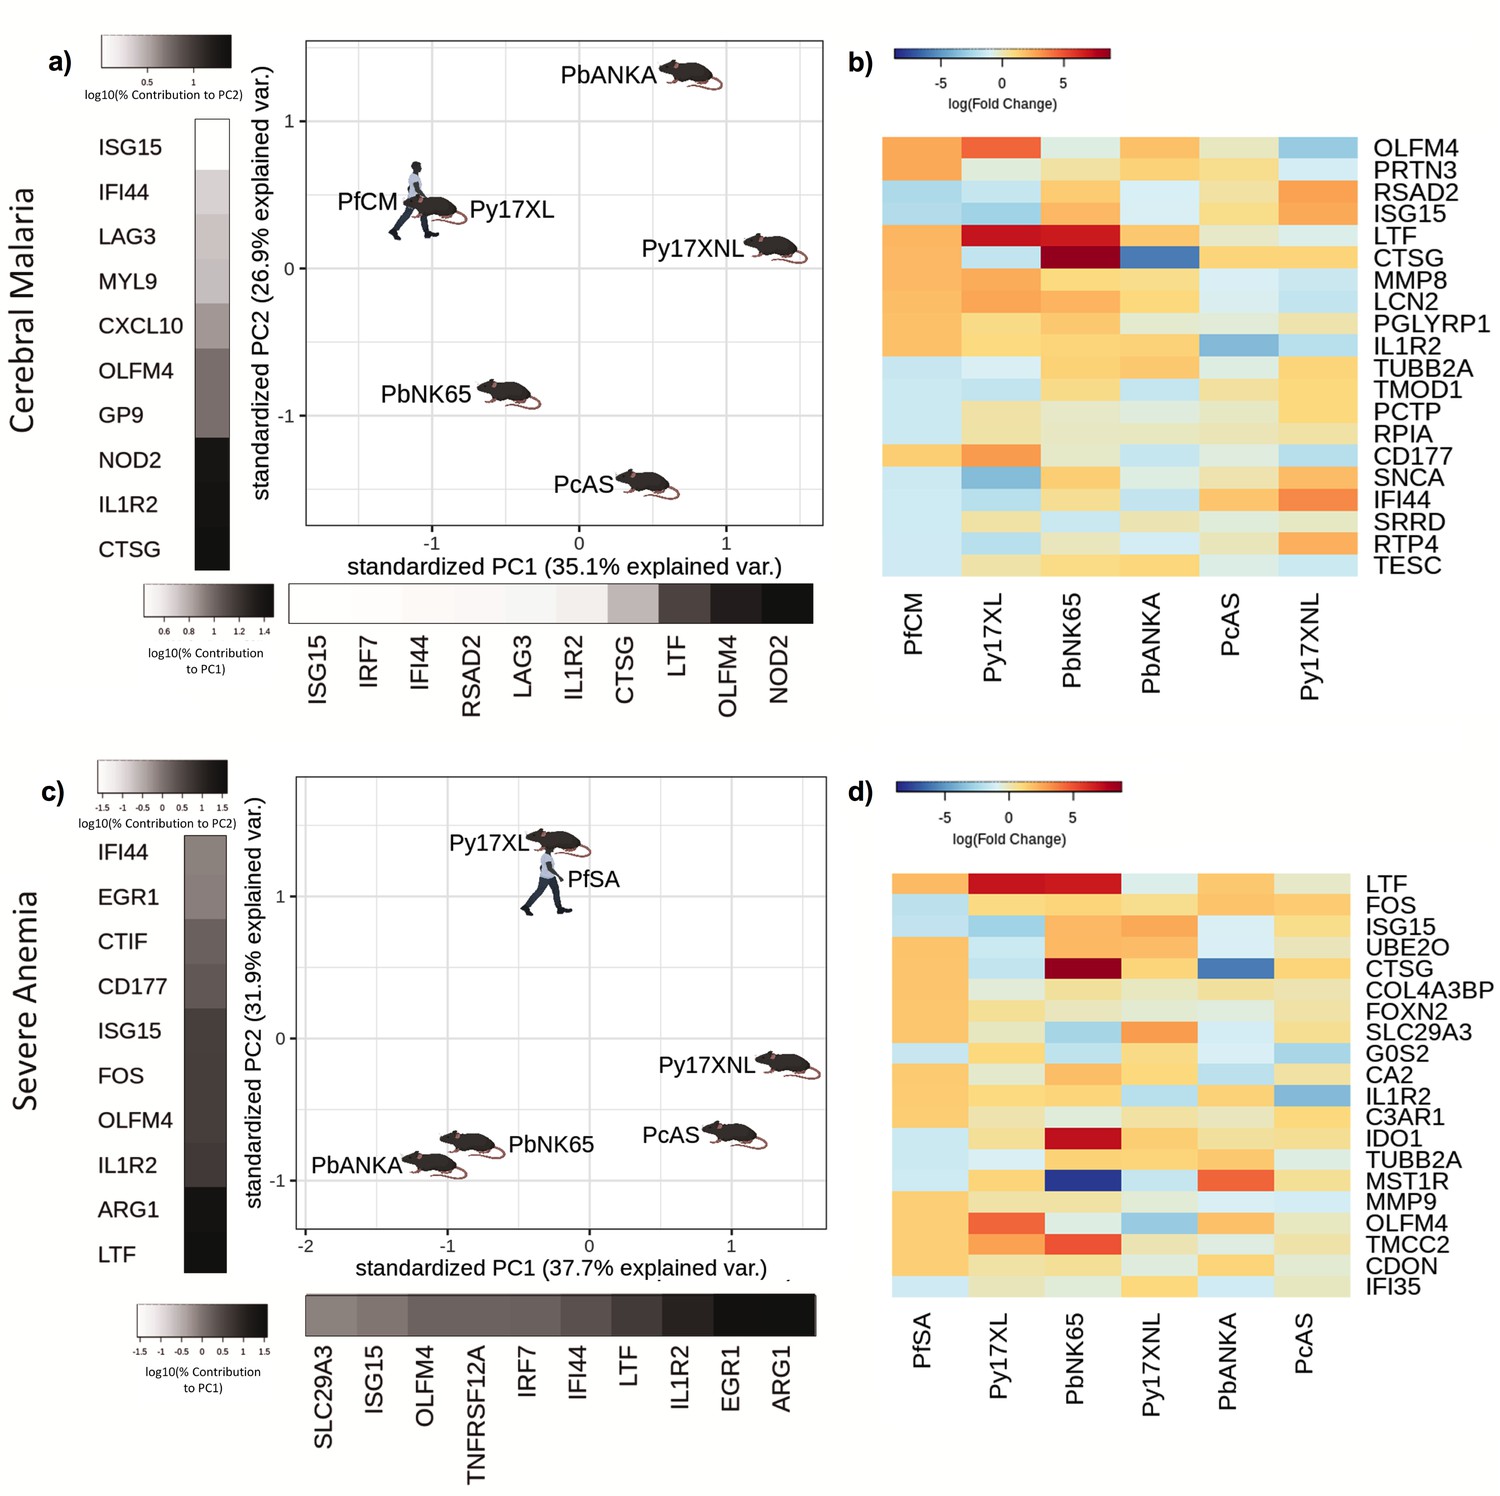
Comparison of host differential gene expression in two severe malaria phenotypes in Gabonese Children and five mouse malaria models.
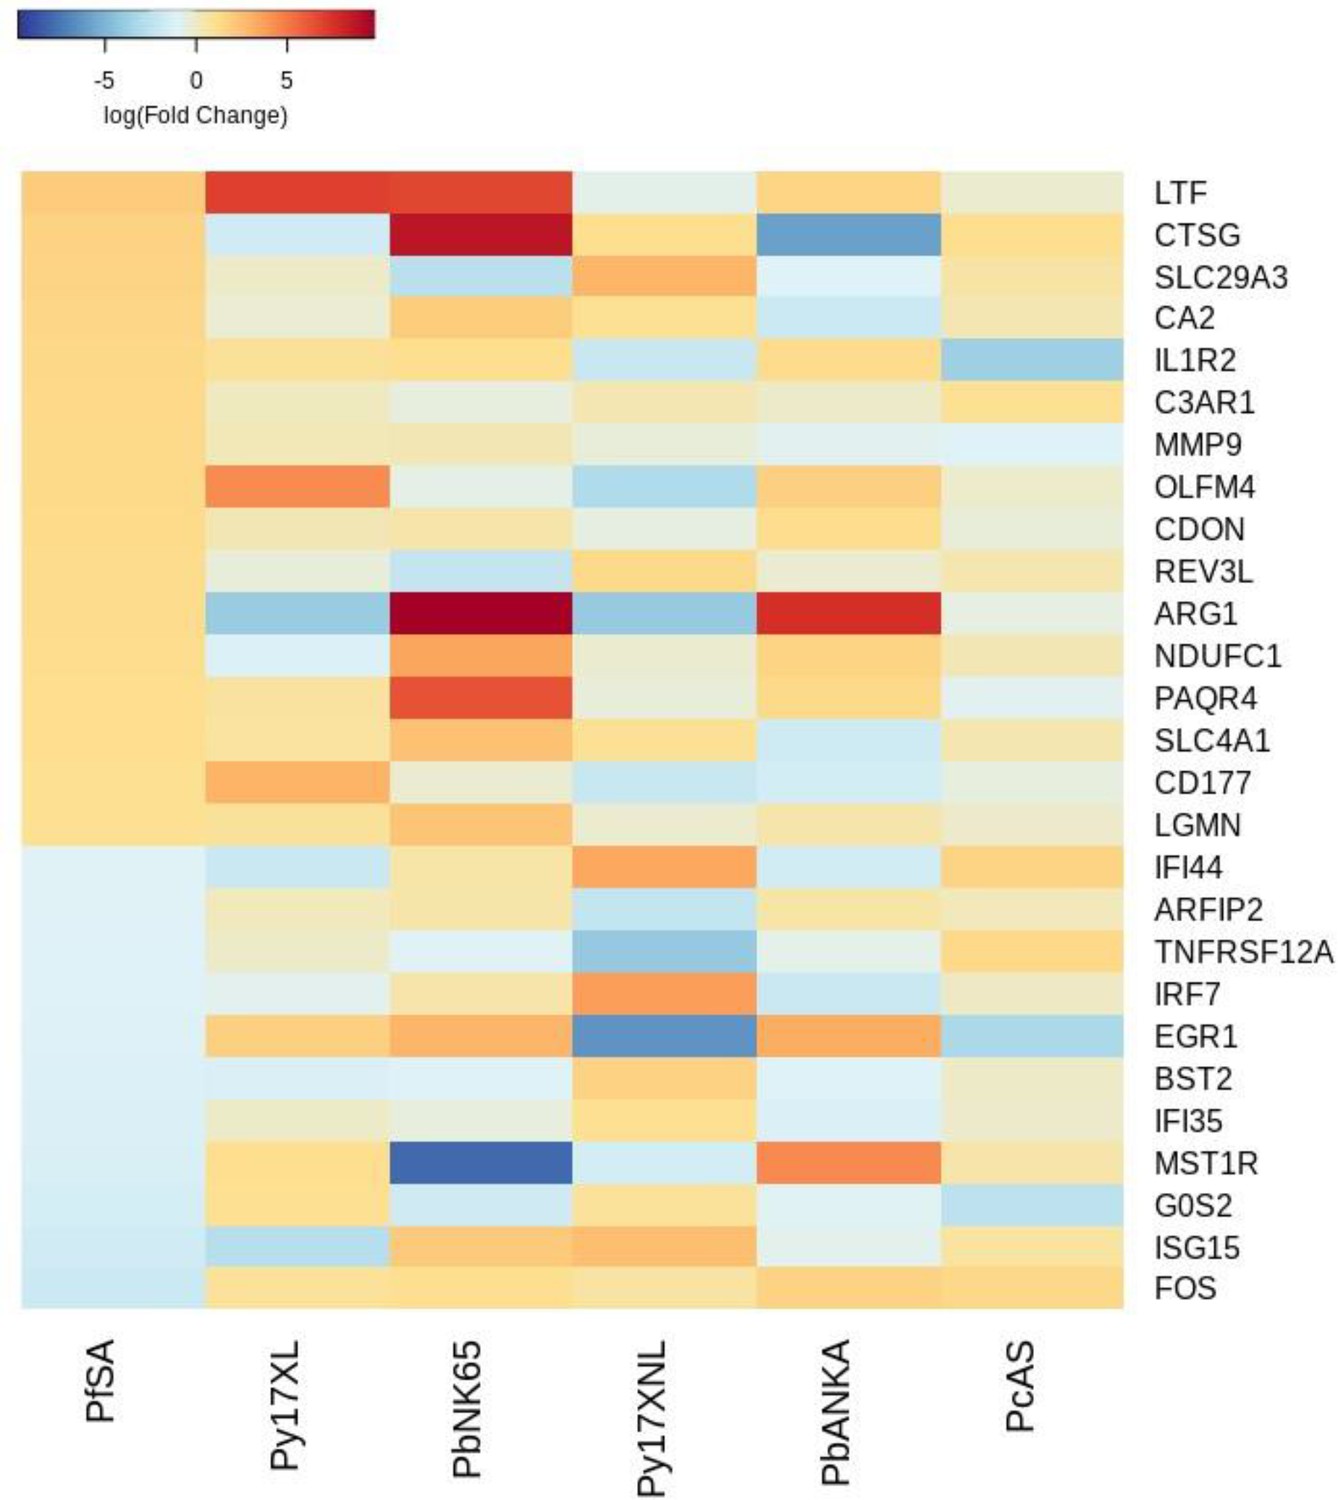
(a, c) Principal component analysis (PCA) plots generated using rank-normalized log-fold change values from the human and mouse differential expression analyses. Only genes with 1:1 mouse and human orthologs and with absolute logFC value greater than 1 in the corresponding human comparison were included. Comparison of changes in gene expression in the mouse models with those in human cerebral malaria (PfCM) (a) and severe anemia (PfSA) (c). The percentage of the total variation explained by principal components 1 and 2 are shown in the axis labels. Grayscale heatmaps parallel to each axis show the contributions of the 10 genes contributing most to the corresponding PC (b, d). Heatmaps show logFC for the 20 genes with the greatest absolute log-fold change values in the human differential gene expression analysis, and their orthologs in each mouse model, corresponding to the analyses illustrated in (a) and (c). Mouse models are ordered left to right in order of increasing dissimilarity to the human disease, based on the Euclidian distance calculated from all principal components (Supplementary file 13). The rows (genes) are ordered by absolute log-fold change in the human comparison in descending order. n=3 for early and n=3 for late time point in each mouse model; n=5 pooled samples uncomplicated (UM), n=5 pooled samples CM, n=5 pooled samples SA (each pool contained RNA from four individuals with the same phenotype). Full heatmaps for the expression of genes contributing most to the first two principal components in humans and each mouse model shown in Figure 4—figure supplements 1–4. The mouse model abbreviations are as follows: PbNK65 (Plasmodium berghei NK65), PbANKA (P. berghei ANKA), PcAS (P. chabaudi AS), Py17XL (P. yoelii 17XL), and Py17XNL (P. yoelii 17XNL).
Figure 4—figure supplement 1
Additional heatmaps for Figure 4.
The logFC values of all the genes contributing greater than 0.1% to Principal Component 1 (PC1) of the corresponding PCA plot (Figure 4a) were extracted for the human and each mouse comparison and used to generate this heatmap. The sample rows of this plot are ordered according to increasing Euclidean distance from the human. This corresponds to the Boldt et al. cerebral malaria comparative transcriptomics results.
Figure 4—figure supplement 2
Additional heatmaps for Figure 4.
The logFC values of all the genes contributing greater than 0.1% to Principal Component 2 (PC2) of the corresponding PCA plot (Figure 4a) were extracted for the human and each mouse comparison and used to generate this heatmap. The sample rows of this plot are ordered according to increasing Euclidean distance from the human. This corresponds to the Boldt et al. cerebral malaria comparative transcriptomics results.
Figure 4—figure supplement 3
Additional heatmaps for Figure 4.
The logFC values of all the genes contributing greater than 0.1% to Principal Component 1 (PC1) of the corresponding PCA plot (Figure 4c) were extracted for the human and each mouse comparison and used to generate this heatmap. The sample rows of this plot are ordered according to increasing Euclidean distance from the human. This corresponds to the Boldt et al. severe anemia comparative transcriptomics results.
Figure 4—figure supplement 4
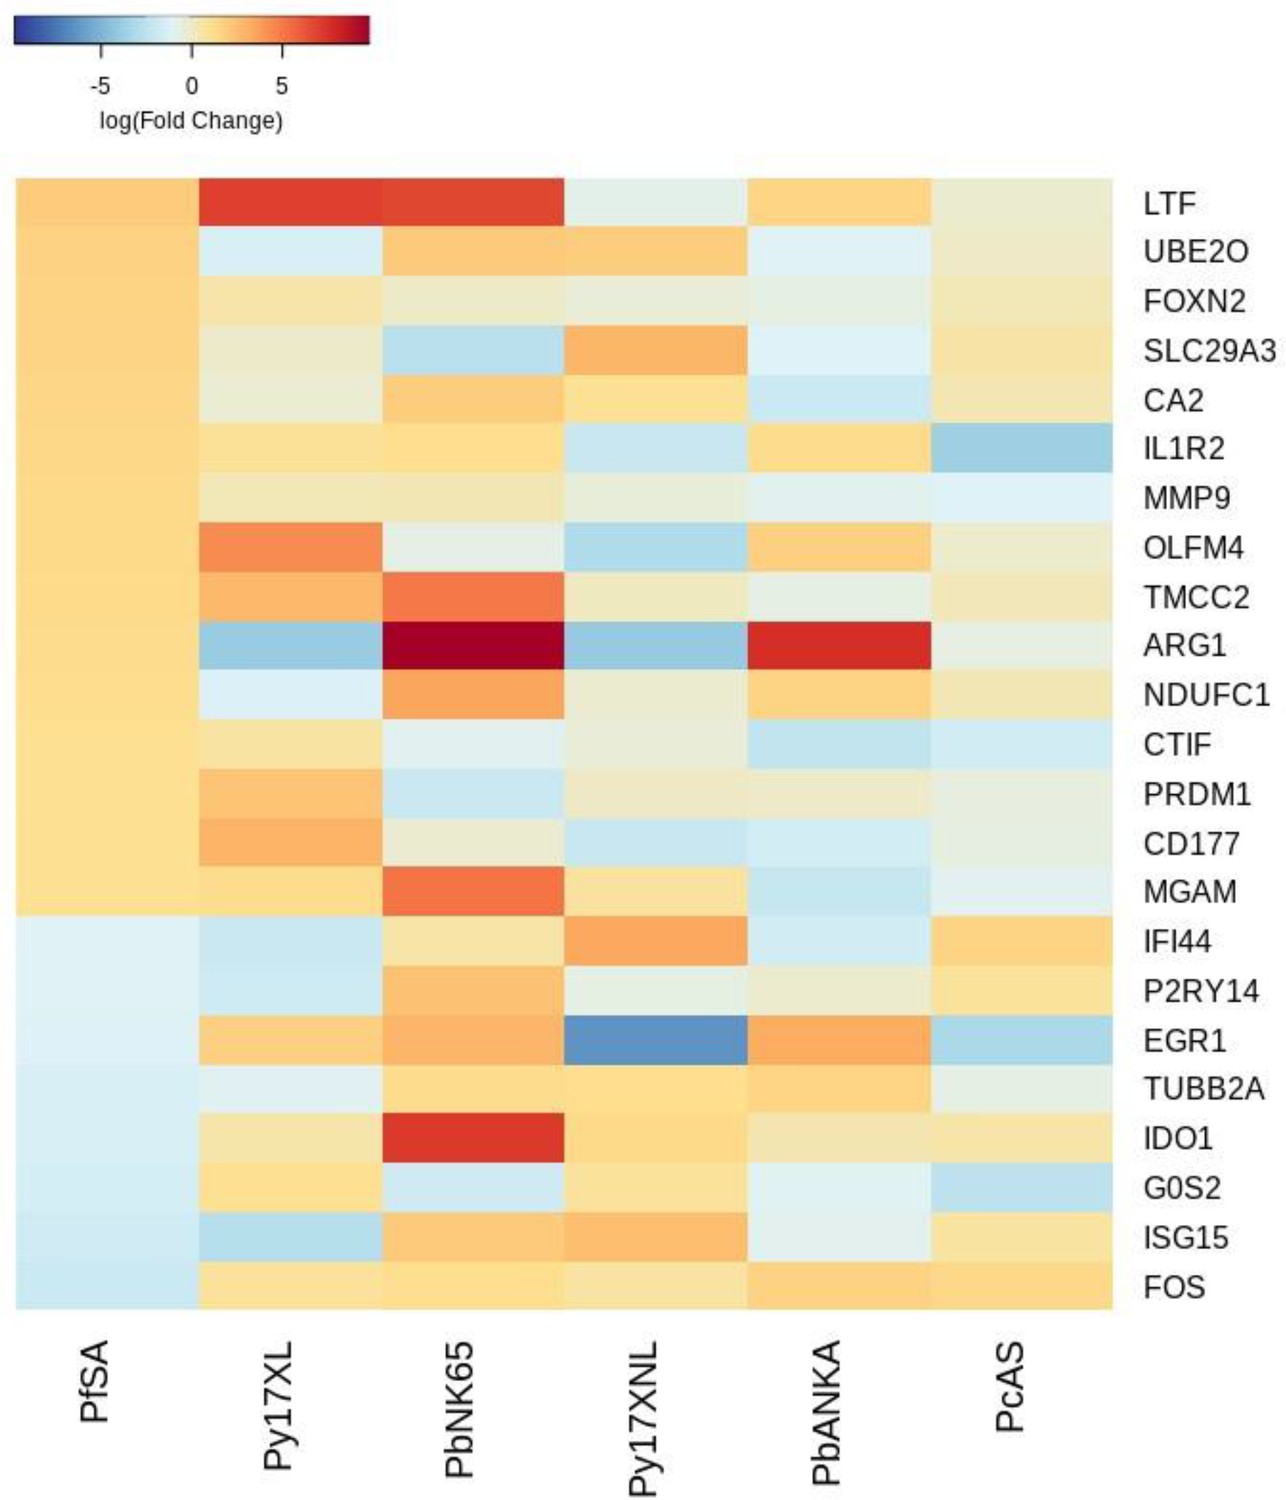
Additional heatmaps for Figure 4.
The logFC values of all the genes contributing greater than 0.1% to Principal Component 2 (PC2) of the corresponding PCA plot (Figure 4c) were extracted for the human and each mouse comparison and used to generate this heatmap. The sample rows of this plot are ordered according to increasing Euclidean distance from the human. This corresponds to the Boldt et al. severe anemia comparative transcriptomics results.
Figure 5
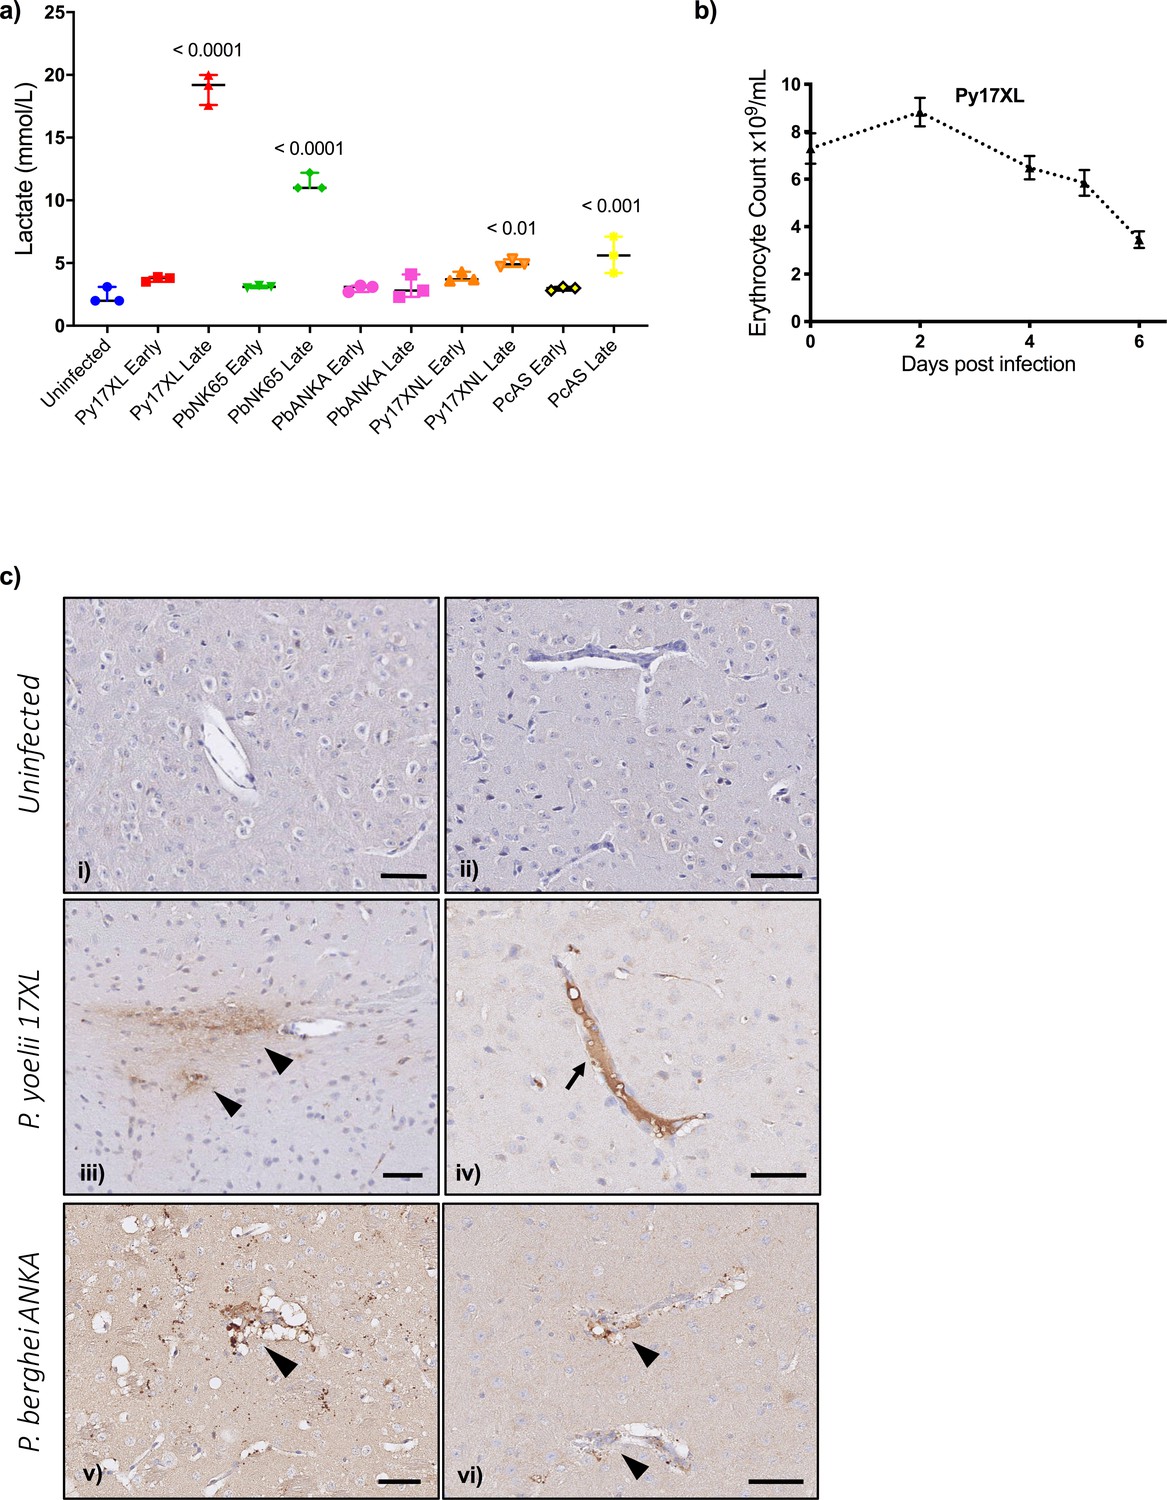
Pathophysiological features of rodent malaria infections.
(a) Lactate concentration in blood (mmol/L) in mice, uninfected, or at the early or late stage of each malaria parasite infection (n=3 for each infection time point). Error bars show median with range, One-way ANOVA p-value<0.0001, p-values for post hoc Dunnett’s multiple comparisons against uninfected mice are shown within the plot. (b) Erythrocyte counts from Plasmodium yoelii 17XL infected mice, n=9, representative of three experiments, repeated measures ANOVA p-value<0.01. (c) Representative histological specimens of brain with fibrinogen staining to identify vascular leak in mice uninfected (i, ii), infected with P. yoelii 17XL (iii, iv), and infected P. berghei ANKA (v, vi) collected at the late stage (humane endpoint) of infection. Arrowheads identify extravascular fibrinogen indicating leak from the vasculature. Arrow points to strong intravascular fibrinogen staining (iv) suggestive of microthrombus. Representative images from analysis of uninfected mouse brains n=3; P. yoelii 17XL-infected mouse brains n=5; P. berghei ANKA-infected mouse brains n=4; Scale bar: 50 µm. Eight-week-old wild-type female C57BL/6J mice were used in all experiments. Individual mouse lactate measurements and erythrocyte counts shown in Figure 5—source data 1.
-
Figure 5—source data 1
Individual mouse lactate measurements and erythrocyte counts.
- https://cdn.elifesciences.org/articles/70763/elife-70763-fig5-data1-v1.xlsx
Tables
Key resources table
| Reagent type (species) or resource | Designation | Source or reference | Identifiers | Additional information |
|---|---|---|---|---|
| Strain, strain background Plasmodium berghei | NK65 | https://doi.org/10.4049/jimmunol.0904019 | ||
| Strain, strain background P. berghei | ANKA | https://doi.org/10.4049/jimmunol.1100241 | ||
| Strain, strain background P. yoelii | 17XL | https://doi.org/10.1371/journal.ppat.1000004 | ||
| Strain, strain background P. yoelii | 17XNL | doi:10.1002/eji.201546018 | ||
| Strain, strain background P. chabaudi | AS | https://doi.org/10.1111/j.1365-3024.2012.01366.x | ||
| Strain, strain background (Mus musculus, female) | C57BL/6J | Charles River Laboratories | ||
| Antibody | Anti-Fibrinogen antibody Rabbit polyclonal antibody | Abcam | ab34269 RRID:AB_732367 | (1:100) |
| Antibody | Alexa Fluor 488 anti-mouse/human CD11b Clone M1/70 Rat monoclonal antibody | BioLegend | (101217) RRID:AB_389305 | (1:300) |
| Antibody | APC anti-mouse Ly-6G Clone 1 A8 Rat monoclonal antibody | BioLegend | (127614) RRID:AB_2227348 | (1:300) |
| Antibody | PE anti-mouse CD19 Clone 6D5 Rat monoclonal antibody | BioLegend | (115508) RRID:AB_313643 | (1:300) |
| Antibody | Brilliant Violet 421 anti-mouse CD4 Clone GK1.5 Rat monoclonal antibody | BioLegend | (100443) RRID:AB_2562557 | (1:200) |
| Antibody | Alexa Fluor 700 anti-mouse CD8a Clone 53–6.7 Rat monoclonal antibody | BioLegend | (100730) RRID:AB_493703 | (1:200) |
| Antibody | Brilliant Violet 650 anti-mouse CD3 Clone 17 A2 Rat monoclonal antibody | BioLegend | (100229) RRID:AB_11204249 | (2:100) |
| Antibody | Alexa Fluor 488 anti-mouse CD4 Clone GK1.5 Rat monoclonal antibody | BioLegend | (100425) RRID:AB_493520 | (1:200) |
| Antibody | APC anti-mouse CD4 Clone GK1.5 Rat monoclonal antibody | BioLegend | (100411) RRID:AB_312696 | (1:200) |
| Antibody | PE anti-mouse CD4 Clone GK1.5 Rat monoclonal antibody | BioLegend | (100407) RRID:AB_312692 | (1:200) |
| Antibody | Alexa Fluor 700 anti-mouse CD4 Clone GK1.5 Rat monoclonal antibody | BioLegend | (100429) RRID:AB_493698 | (1:200) |
| Antibody | Brilliant Violet 650 anti-mouse CD4 Clone GK1.5 Rat monoclonal antibody | BioLegend | (100545) RRID:AB_11126142 | (1:200) |
| Commercial assay or kit | PAXgene Blood RNA Kit | QIAGEN | Cat. No./ID: 762174 | |
| Commercial assay or kit | Agilent RNA 6000 Nano Kit | Agilent | 5067-1511 | |
| Software, algorithm | R | https://www.R-project.org/ | R 3.5.1 RRID:SCR_001905 | |
| Software, algorithm | STAR | DOI:10.1093/bioinformatics/bts635 | 2.5.4b RRID:SCR_004463 | |
| Software, algorithm | Python Package: HTSeq | DOI:10.1093/bioinformatics/btu638 | 1.99.2 RRID:SCR_005514 | |
| Software, algorithm | GraphPad PRISM | https://www.graphpad.com | GraphPad Prism 8 RRID:SCR_002798 |
Additional files
-
Supplementary file 1
Supplementary Figures and small tables.
(A): The proportions of different leukocyte subtypes in the Lee et al. RNA-Seq data vs. the mouse models. (B): Details of the publicly available microarray data sets. (C): Comparison of host differential gene expression at onset of symptoms in a controlled human malaria infection study and at early stage illness in five mouse malaria models. (D): The Discordance-concordance analysis of the Boldt et al. Gabonese CH-UM vs Lee et al. Gambian children CM-UM differential expression analysis. (E): Gating strategy for defining WBC proportions in mouse blood. (F): Leucocyte proportions measured in whole blood by flow cytometry. (G): The genetic confirmation of the identity of the two different Plasmodium yoelii strains using the RNA-Seq reads in conjunction with the known single nucleotide variant. (H): The genetic confirmation of the two different Plasmodium berghei strains using the RNA-Seq reads in conjunction with four known single nucleotide variants.
- https://cdn.elifesciences.org/articles/70763/elife-70763-supp1-v1.docx
-
Supplementary file 2
Mouse Differential Expression Analysis without adjustment for immune cell type proportions.
- https://cdn.elifesciences.org/articles/70763/elife-70763-supp2-v1.xlsx
-
Supplementary file 3
Boldt et al., 2019 Differential Expression Analysis without immune cell type adjustment.
- https://cdn.elifesciences.org/articles/70763/elife-70763-supp3-v1.xlsx
-
Supplementary file 4
Idaghdour et al., 2012 Differential Expression Analysis without cell type adjustment.
- https://cdn.elifesciences.org/articles/70763/elife-70763-supp4-v1.xlsx
-
Supplementary file 5
The results of the CHMI microarray data set differential expression analysis without cell type mixture adjustment.
- https://cdn.elifesciences.org/articles/70763/elife-70763-supp5-v1.xlsx
-
Supplementary file 6
Idaghdour et al., 2012 Differential Expression Analysis.
- https://cdn.elifesciences.org/articles/70763/elife-70763-supp6-v1.xlsx
-
Supplementary file 7
Boldt et al., 2019 Differential Expression Analysis.
- https://cdn.elifesciences.org/articles/70763/elife-70763-supp7-v1.xlsx
-
Supplementary file 8
Human Mouse Orthologs.
- https://cdn.elifesciences.org/articles/70763/elife-70763-supp8-v1.xlsx
-
Supplementary file 9
Discordance Concordance.
- https://cdn.elifesciences.org/articles/70763/elife-70763-supp9-v1.xlsx
-
Supplementary file 10
The results of the CHMI microarray data set differential expression analysis.
- https://cdn.elifesciences.org/articles/70763/elife-70763-supp10-v1.xlsx
-
Supplementary file 11
GO terms.
- https://cdn.elifesciences.org/articles/70763/elife-70763-supp11-v1.xlsx
-
Supplementary file 12
Mouse Differential Expression Analysis.
- https://cdn.elifesciences.org/articles/70763/elife-70763-supp12-v1.xlsx
-
Supplementary file 13
Euclidean Distances.
- https://cdn.elifesciences.org/articles/70763/elife-70763-supp13-v1.xlsx
-
Supplementary file 14
Lee et al., 2018b Differential Expression Analysis.
- https://cdn.elifesciences.org/articles/70763/elife-70763-supp14-v1.xlsx
-
Supplementary file 15
Lee et al., 2018b Differential Expression Analysis without adjustment.
- https://cdn.elifesciences.org/articles/70763/elife-70763-supp15-v1.xlsx
-
Supplementary file 16
The results of the microarray mouse PcAS differential expression analysis.
- https://cdn.elifesciences.org/articles/70763/elife-70763-supp16-v1.xlsx
-
Supplementary file 17
Severity scoring protocols.
- https://cdn.elifesciences.org/articles/70763/elife-70763-supp17-v1.docx
-
Supplementary file 18
RNA-Seq Mouse Raw Counts.
- https://cdn.elifesciences.org/articles/70763/elife-70763-supp18-v1.xlsx
-
Supplementary file 19
Mouse Cell Type Proportions.
- https://cdn.elifesciences.org/articles/70763/elife-70763-supp19-v1.xlsx
-
Supplementary file 20
Metadata Sample IDs Phenotypes.
- https://cdn.elifesciences.org/articles/70763/elife-70763-supp20-v1.xlsx
-
Supplementary file 21
Lee et al., 2018b Sample Metadata.
- https://cdn.elifesciences.org/articles/70763/elife-70763-supp21-v1.xlsx
-
Supplementary file 22
Reference Immune Cell Type Expression Profile for Human Microarray data sets.
- https://cdn.elifesciences.org/articles/70763/elife-70763-supp22-v1.xlsx
-
Supplementary file 23
PCA input standardized logFC values.
- https://cdn.elifesciences.org/articles/70763/elife-70763-supp23-v1.xlsx
-
Supplementary file 24
Genes contributing to PC1 and PC2.
- https://cdn.elifesciences.org/articles/70763/elife-70763-supp24-v1.xlsx
-
Supplementary file 25
GO Term Background Gene Lists.
- https://cdn.elifesciences.org/articles/70763/elife-70763-supp25-v1.xlsx
-
Transparent reporting form
- https://cdn.elifesciences.org/articles/70763/elife-70763-transrepform1-v1.docx
Download links
A two-part list of links to download the article, or parts of the article, in various formats.
Downloads (link to download the article as PDF)
Open citations (links to open the citations from this article in various online reference manager services)
Cite this article (links to download the citations from this article in formats compatible with various reference manager tools)
Comparative transcriptomic analysis reveals translationally relevant processes in mouse models of malaria
eLife 11:e70763.
https://doi.org/10.7554/eLife.70763


