Auditory sensory deprivation induced by noise exposure exacerbates cognitive decline in a mouse model of Alzheimer’s disease
- Fondazione Policlinico Universitario A. Gemelli IRCCS, Italy
- Department of Neuroscience, Università Cattolica del Sacro Cuore, Italy
- Department of Otolaryngology Head and Neck Surgery, Università Cattolica del Sacro Cuore, Italy
Figures
Figure 1
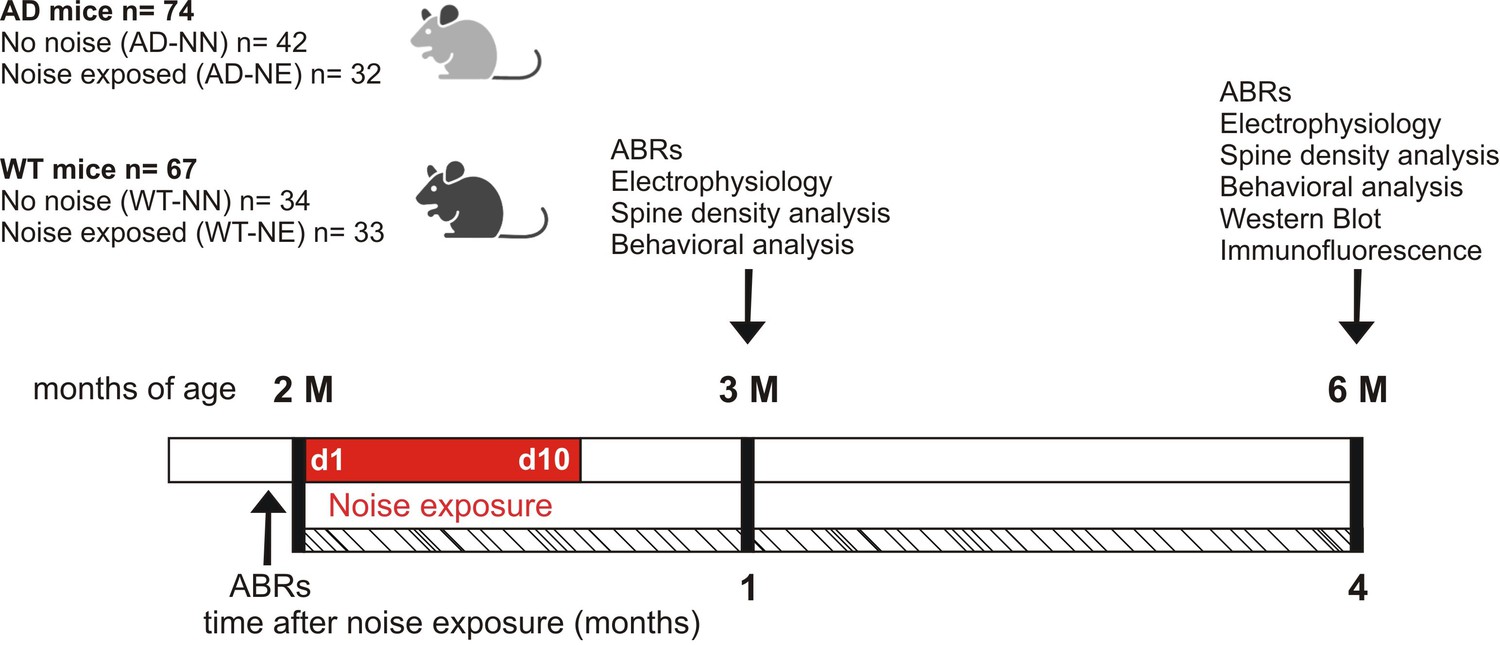
Schematic representation of the experimental design and time schedule of the protocols.
Wild-type (WT) and 3×Tg Alzheimer’s disease (AD) animals of 2 months of age (M) at the beginning of the study were randomly assigned to no noise (NN) or noise-exposed (NE) groups. Baseline hearing thresholds were evaluated the day before the exposure to repeated noise sessions lasting 10 consecutive days (d1–d10). After 1 and 4 months from the onset of trauma sessions, when the mice aged 3 and 6 M, behavioral, morphological (spine density), electrophysiological, and molecular (Western blot and immunofluorescence) evaluations were performed. ABRs: auditory brainstem responses.
Figure 2

Auditory threshold evaluations after noise exposure.
(A–B) Graphs show ABR averaged threshold values (± SEM) measured in not-exposed (NN) and noise-exposed (NE) wild-type (WT) and in Alzheimer’s disease (AD) mice. Auditory thresholds were similar in WT-NN and AD-NN mice at both 3 (A) and 6 (D) months of age (WT-NN 3 M n = 11; AD-NN 3 M n = 12; WT-NN 6 M n = 9; AD-NN 6 M n = 13). Repeated noise exposure induced a threshold elevation of about 30–40 dB after 1 month from the onset of trauma sessions in both strains (WT-NE 3 M n = 8; AD-NE 3 M n = 7; three-way ANOVA, Tukey’s post hoc test, WT-NE vs. WT-NN, p = 0.0001; AD-NE vs. AD-NN, p = 0.0002) and no recovery in threshold and threshold shift values was observed 4 months after noise exposure, corresponding to 6 M, compared with age-matched not-exposed animals (WT-NE 6 M n = 7; AD-NE 6 M n = 11; three-way ANOVA, Tukey’s post hoc test, WT-NN vs. WT-NE, p = 0.017; AD-NN vs. AD-NE, p = 0.003). (C–D) Graphs show Wave I (C) and II (D) latency-intensity functions across animals of 3 M in response to 16 kHz tone bursts (WT-NN n = 8; AD-NN n = 10; WT-NE n = 7; AD-NE n = 7). Asterisks indicate significant differences between groups (*p < 0.05; ***p < 0.001).
-
Figure 2—source data 1
Numerical source data from Figure 2.
- https://cdn.elifesciences.org/articles/70908/elife-70908-fig2-data1-v1.xlsx
Figure 3 with 2 supplements
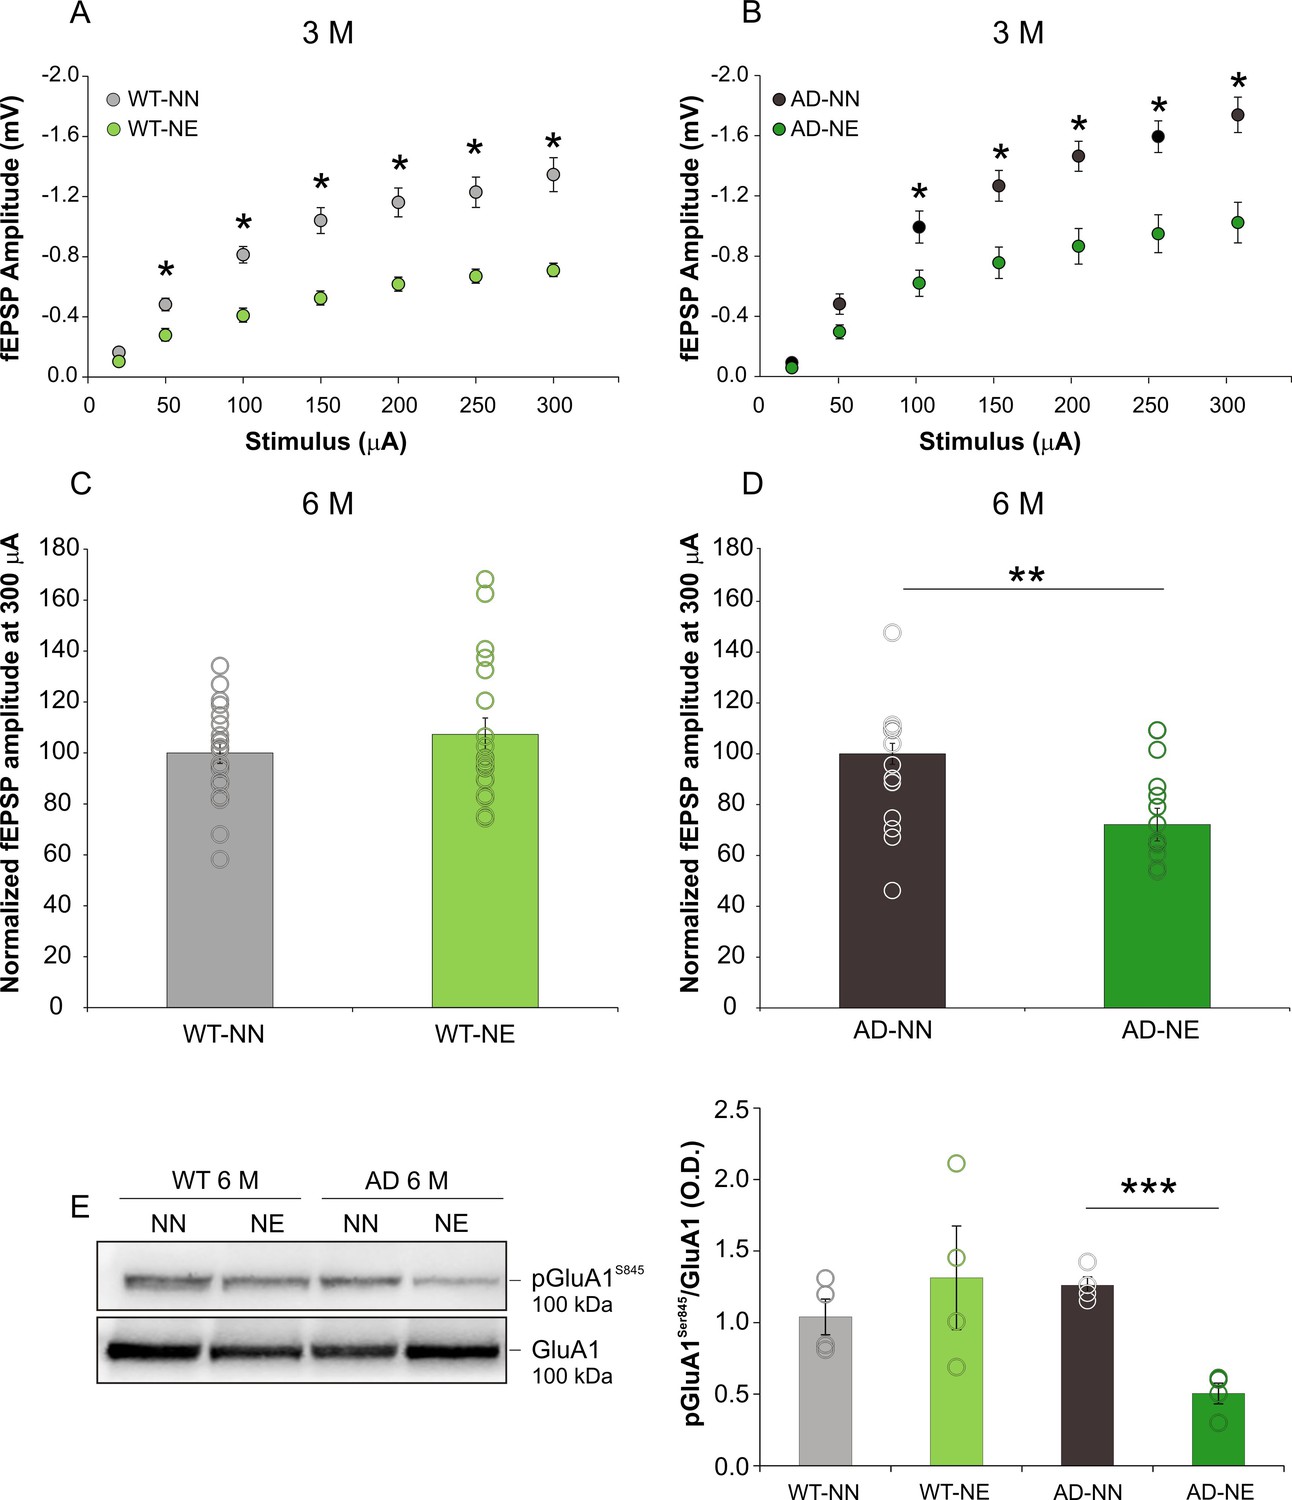
Hearing loss induces persistent synaptic dysfunctions in the ACx of 3×Tg Alzheimer’s disease (AD) mice.
(A–B) Field excitatory post-synaptic potential (fEPSP) amplitude following stimulation of afferent fibers in ACx layer II/III at increasing intensities are shown for slices obtained from 3 months of age (M) not-exposed (NN) and noise-exposed (NE) wild-type (WT) (A) and 3×Tg-AD mice (B). Statistical analysis by two-way ANOVA followed by Tukey’s post hoc revealed significant differences between not-exposed (WT n = 11 slices from mice; AD n = 15 slices from six mice) and noise-exposed (WT n = 17 slices from three mice; AD n = 13 slices from five mice) groups of both strains (WT-NN vs. WT-NE, p < 0.001; AD-NN vs. AD-NE, p < 0.001). (C,D) fEPSP amplitude normalized to mean values obtained in 6 M WT-NN and AD-NN at 300 μA, taken as 100% (C; WT-NN n = 21 slices from seven mice; WT-NE n = 20 slices from eight mice; D, AD-NN n = 12 slices from five mice; AD-NE n = 14 slices from five mice). Statistical analysis by two-way ANOVA revealed significant differences between AD-NN and AD-NE groups (p = 0.001). (E) Representative Western immunoblot revealing decreased pGluA1Ser845 in the ACx of AD mice exposed to noise (6 M) compared with age-matched not-exposed group. Bar graph shows results of densitometric analyses on all samples (n = 4 mice for each group; Student’s t-test, p = 0.071 WT-NE vs. WT-NN; p = 0.0001 AD-NE vs. AD-NN) normalized to the corresponding total protein levels (GluA1). Data are expressed as mean ± SEM. Asterisks indicate significant differences between groups (*p < 0.05; **p < 0.01;***p < 0.001).
-
Figure 3—source data 1
Numerical source data from Figure 3.
- https://cdn.elifesciences.org/articles/70908/elife-70908-fig3-data1-v1.xlsx
Figure 3—figure supplement 1
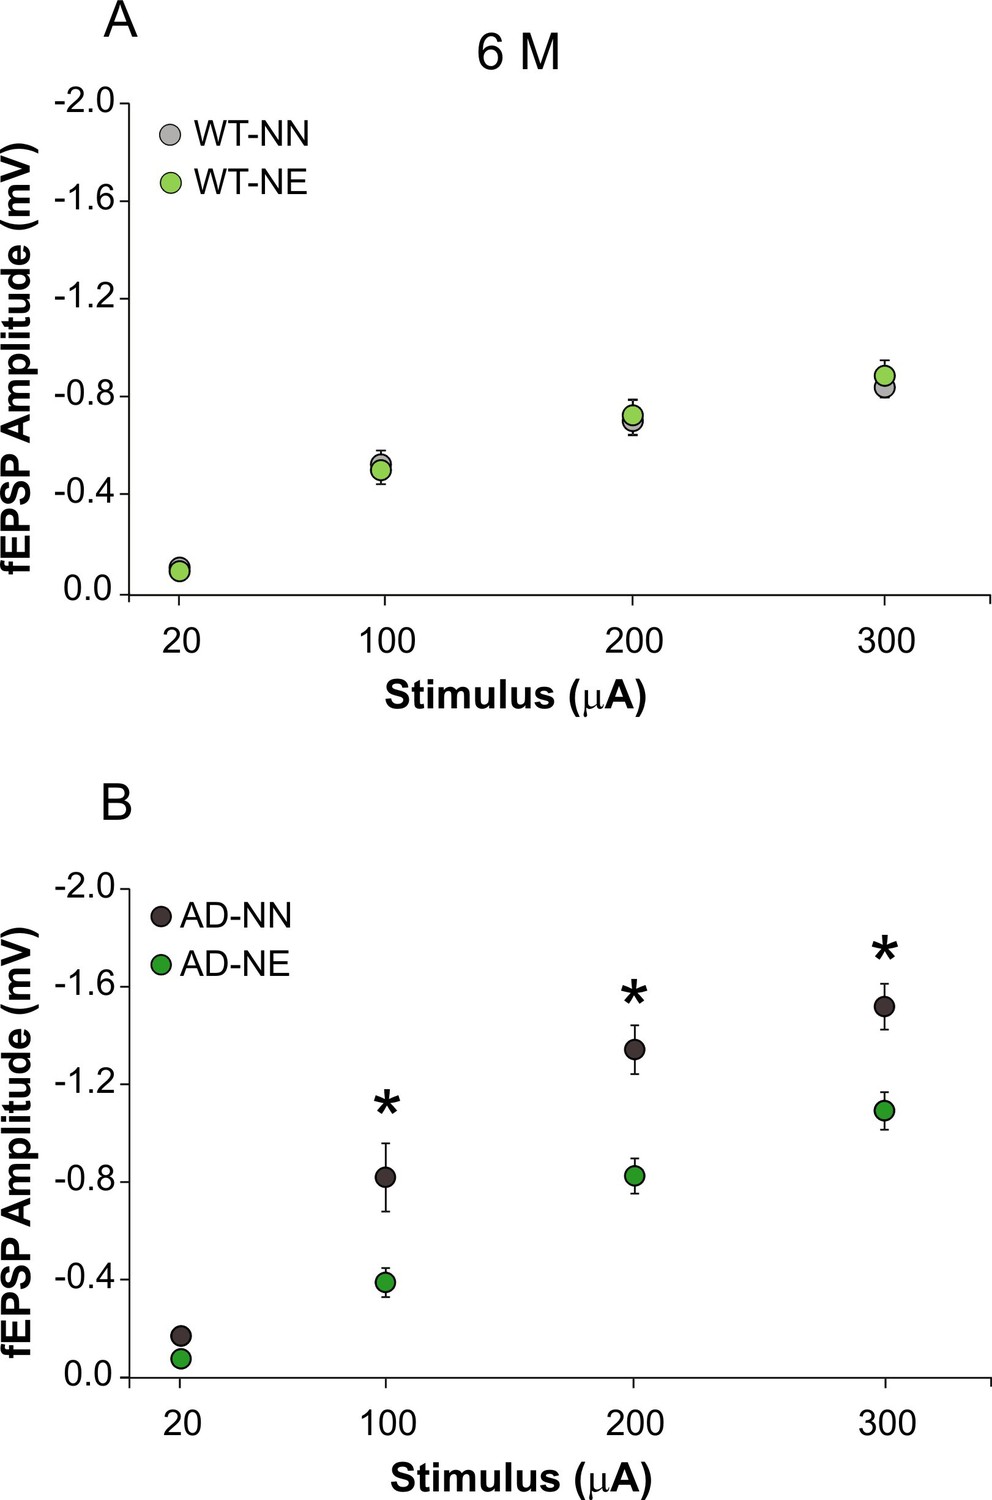
(A–B) Field excitatory post-synaptic potentials (fEPSP) amplitude following stimulation of afferent fibers in ACx layer II/III at increasing intensities are shown for slices obtained from 6 months of age (M) not-exposed (NN) and noise-exposed (NE) wild-type (WT) (A) and Alzheimer’s disease (AD) mice (B).
Data are expressed as mean ± SEM. Asterisks indicate significant differences between groups by two-way ANOVA (*p < 0.05).
Figure 3—figure supplement 2
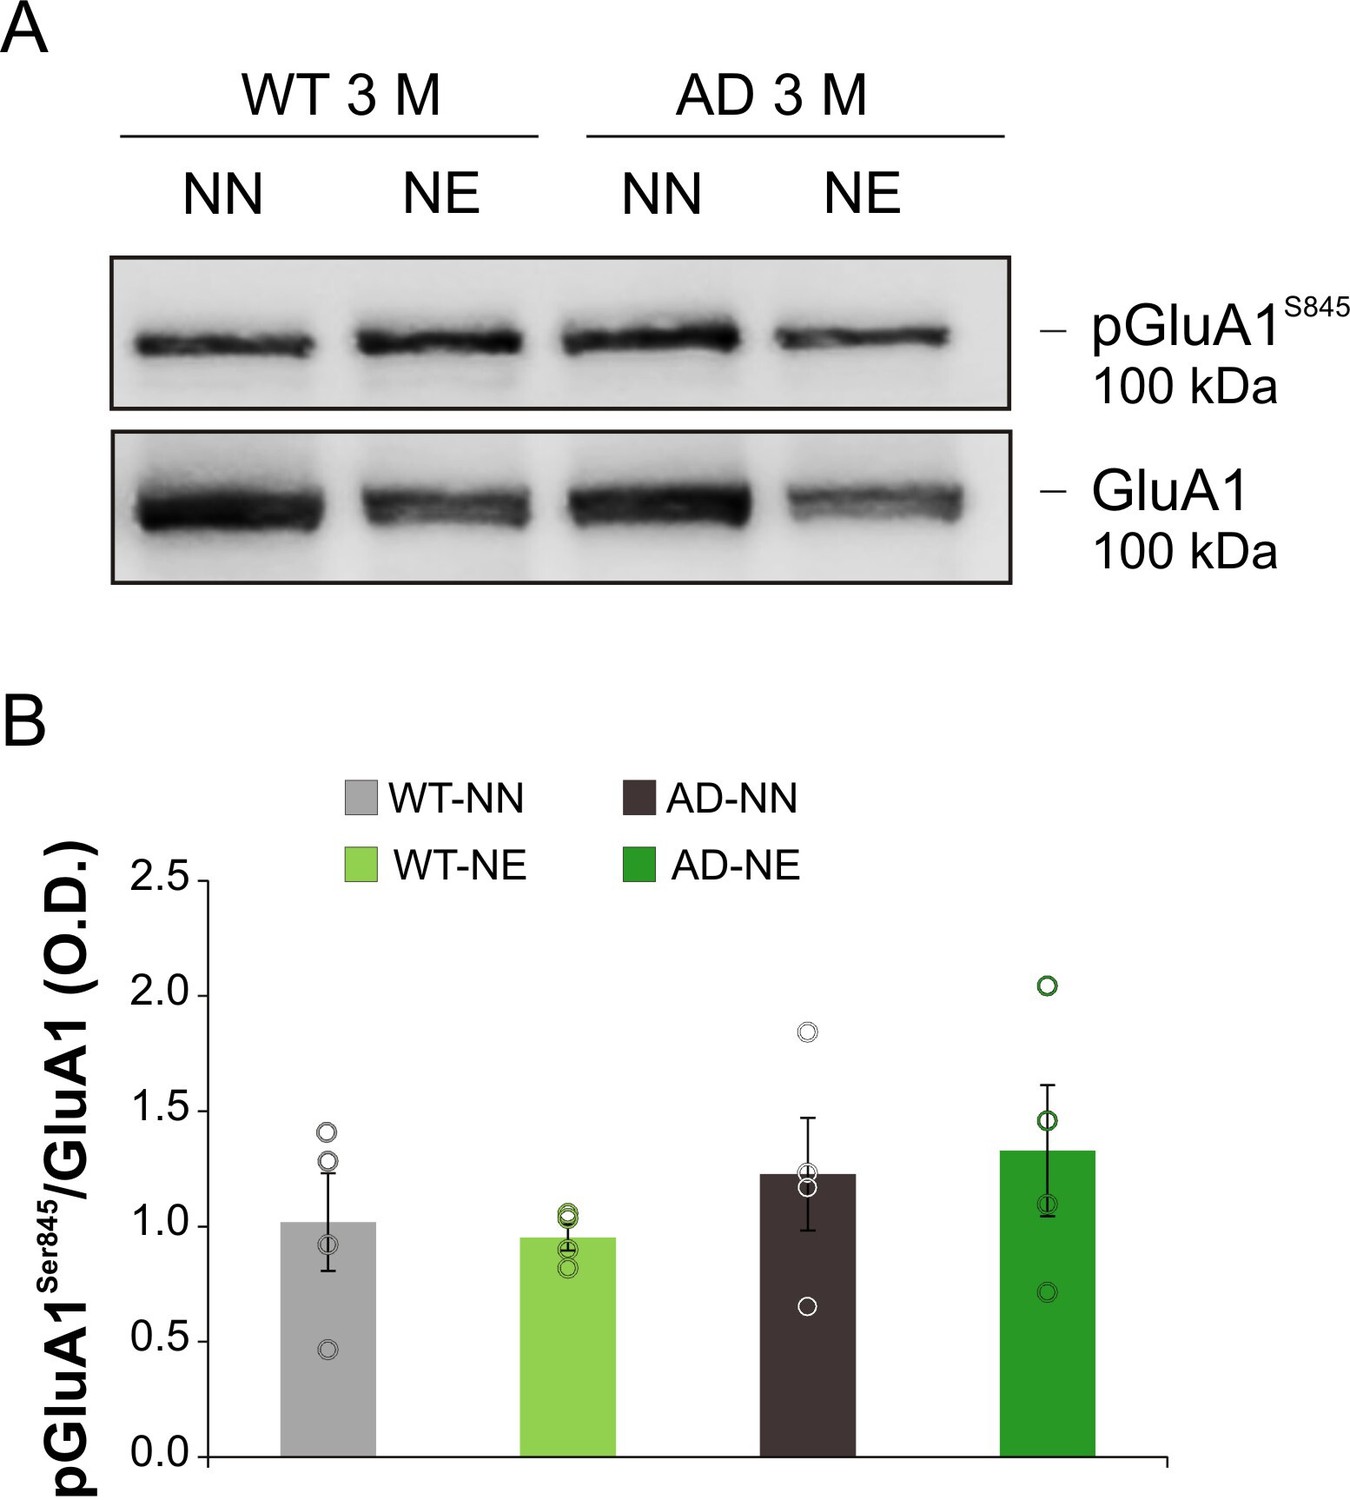
Representative Western immunoblot revealing pGluA1Ser845 expression in the ACx of 3 months of age (M) animals.
Bar graph shows results of densitometric analyses (O.D.) on all samples (n = 4 mice for each group; Student’s t-test, p = 0.77 WT-NE vs. WT-NN; p = 0.79 AD-NE vs. AD-NN) normalized to the corresponding total protein levels (GluA1). Data are expressed as mean ± SEM.
Figure 4 with 1 supplement
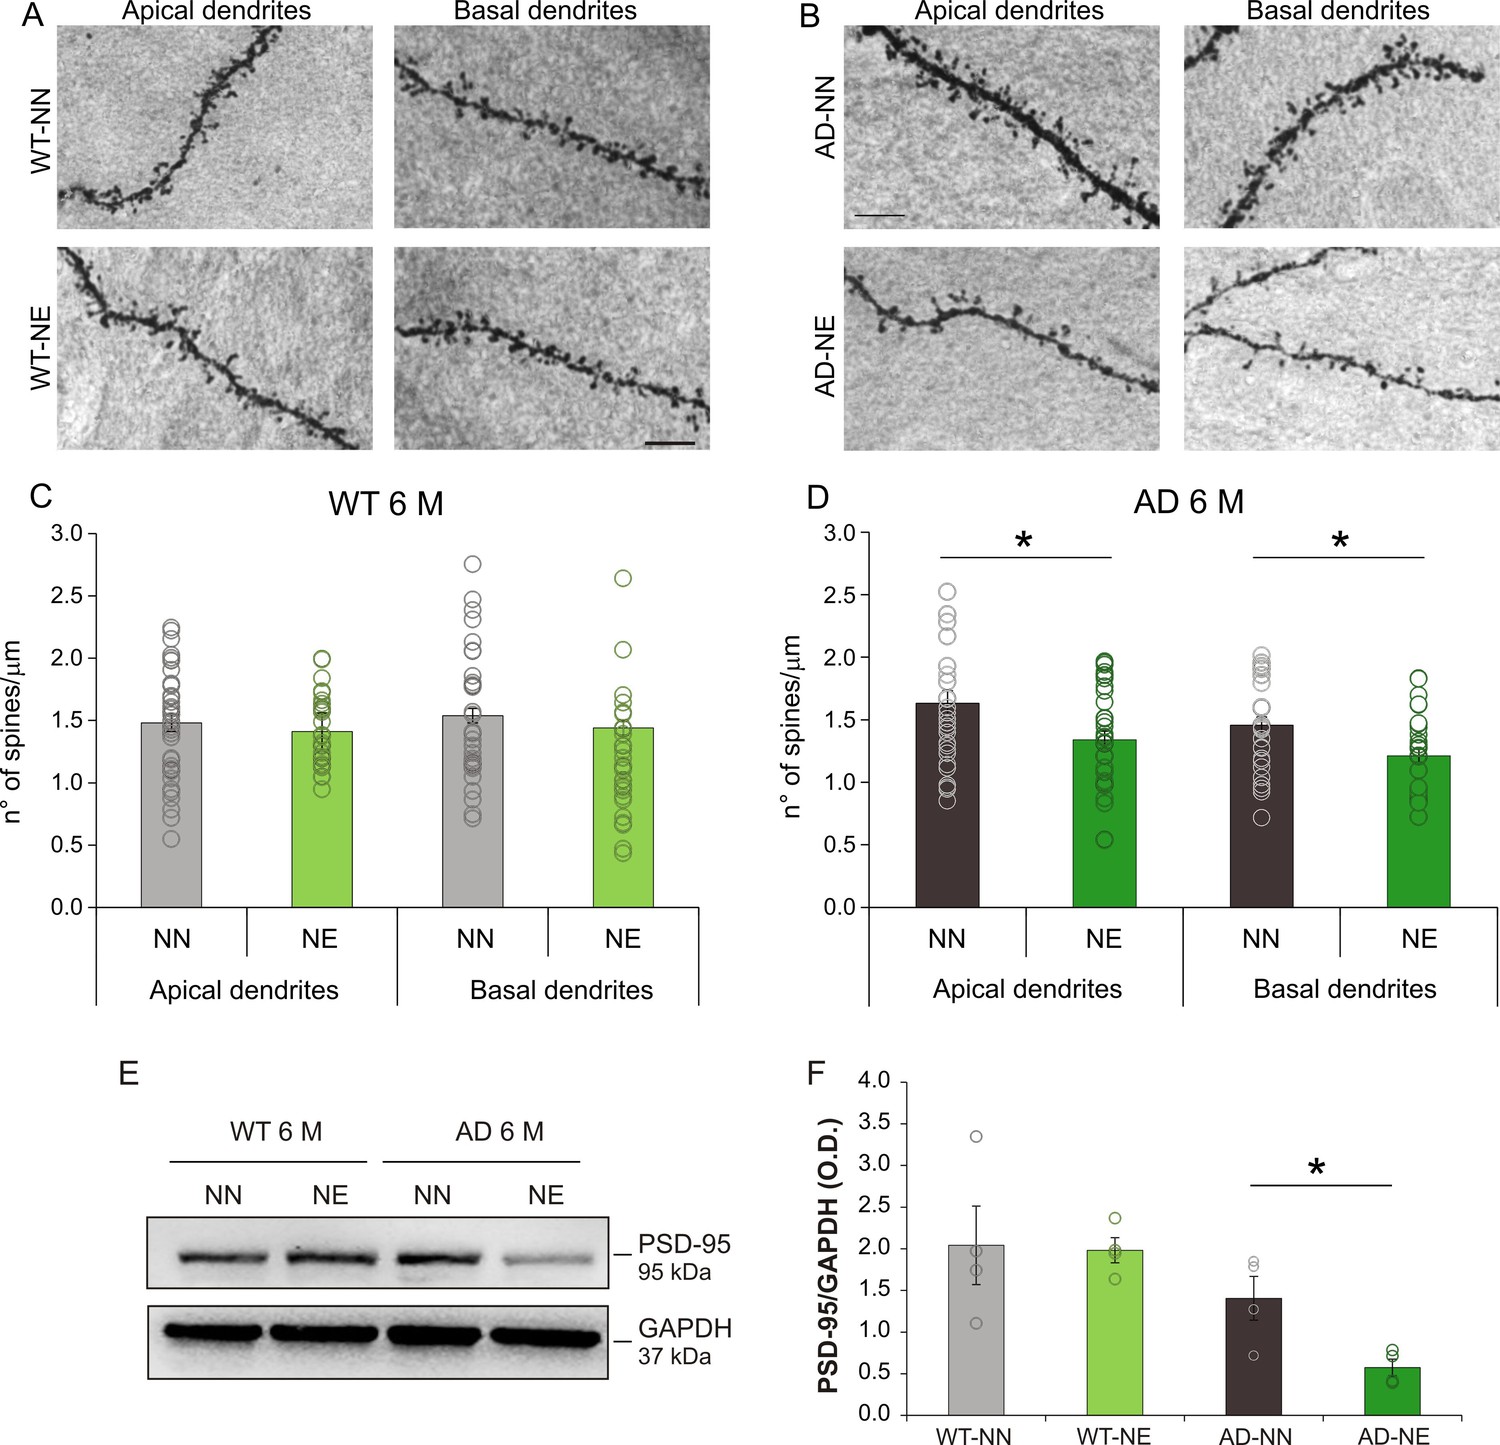
Hearing loss affects spine density in pyramidal neurons of ACx layer II/III in 3×Tg Alzheimer’s disease (AD) mice.
(A–B) Representative images of apical and basal dendrites of pyramidal neurons of layers II/III in WT-NN and WT-NE groups (left panels, A) and AD-NN and AD-NE groups (right panels, B) at 6 months of age (M). Scale bar: 10 μm. (C–D) Bar graphs showing mean values of spine density in apical and basal dendrites of neurons of layer II/III of the ACx of NN and NE wild-type (WT) (C) and AD mice (D) (n = at least 30 segments from 30 different neurons were analyzed from four animals/groups). The number of spines decreased significantly in AD-NE compared to AD-NN mice both in apical and in basal dendrites (D, two-way ANOVA, Tukey’s post hoc test, apical dendrites p = 0.011; basal dendrites p = 0.012) whereas no differences between WT-NN and WT-NE groups were observed (C, two-way ANOVA, apical dendrites p = 0.88, basal dendrites p = 0.70). (E) Representative Western immunoblot revealing decreased PSD-95 expression in ACx of 6 M AD mice exposed to noise compared with age-matched not-exposed group. (F) Bar graph in the lower panel shows results of densitometric analyses on all samples (n = 4 mice for each group; Student’s t-test, WT-NE vs. WT-NN, p = 0.90; AD-NE vs. AD-NN, p = 0.025) normalized to total protein levels (GAPDH). Data are expressed as mean ± SEM. Asterisks indicate significant differences between groups (*p < 0.05).
-
Figure 4—source data 1
Numerical source data from Figure 4.
- https://cdn.elifesciences.org/articles/70908/elife-70908-fig4-data1-v1.xlsx
Figure 4—figure supplement 1
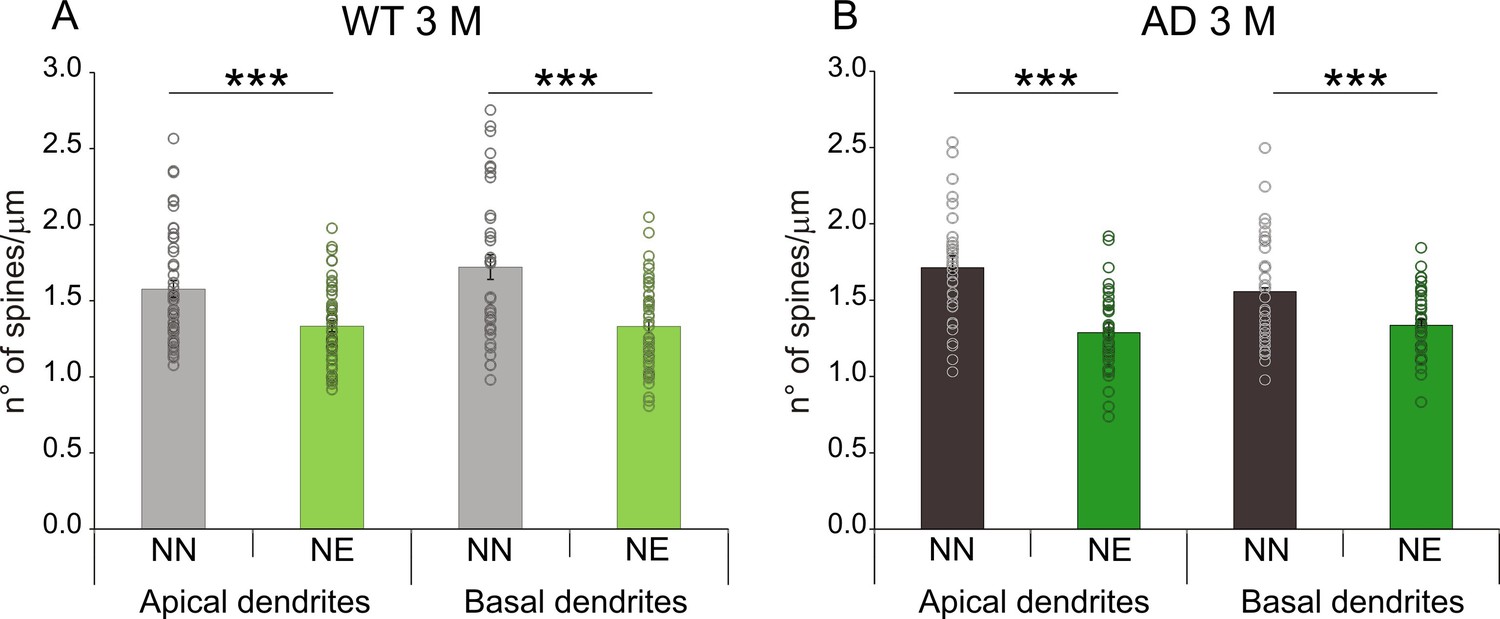
Spine density in pyramidal neurons of layer II/III in wild-type (WT) and Alzheimer’s disease (AD) mice at 3 months of age (M).
Bar graphs showing mean values of spine density (mean ± SEM) in apical and basal dendrites of neurons of layer II/III of the ACx of not-exposed (NN) and noise-exposed (NE) WT (A) and AD mice (B) at 3 M (***p < 0.001).
Figure 5

Hearing loss affects basal synaptic transmission in hippocampus of 3×Tg Alzheimer’s disease (AD) mice.
Field excitatory post-synaptic potential (fEPSP) amplitudes following stimulation of the Schaffer collaterals at increasing stimulus intensities in slices obtained from not-exposed and noise-exposed animals of both wild-type (WT) (A) and AD (B) groups at 6 months of age (M). Statistical analysis by two-way ANOVA followed by Tukey’s post hoc revealed significant differences (p = 0.020) between AD-NN (n = 12 slices from four mice) and AD-NE (n = 11 slices from four mice) groups, whereas no significant differences (p = 0.78) were observed between WT-NN (n = 14 slices from seven mice) and WT-NE groups (n = 12 slices from six mice). Data are expressed as mean ± SEM. Asterisks indicate significant differences between groups (*p < 0.05).
-
Figure 5—source data 1
Numerical source data from Figure 5.
- https://cdn.elifesciences.org/articles/70908/elife-70908-fig5-data1-v1.xlsx
Figure 6
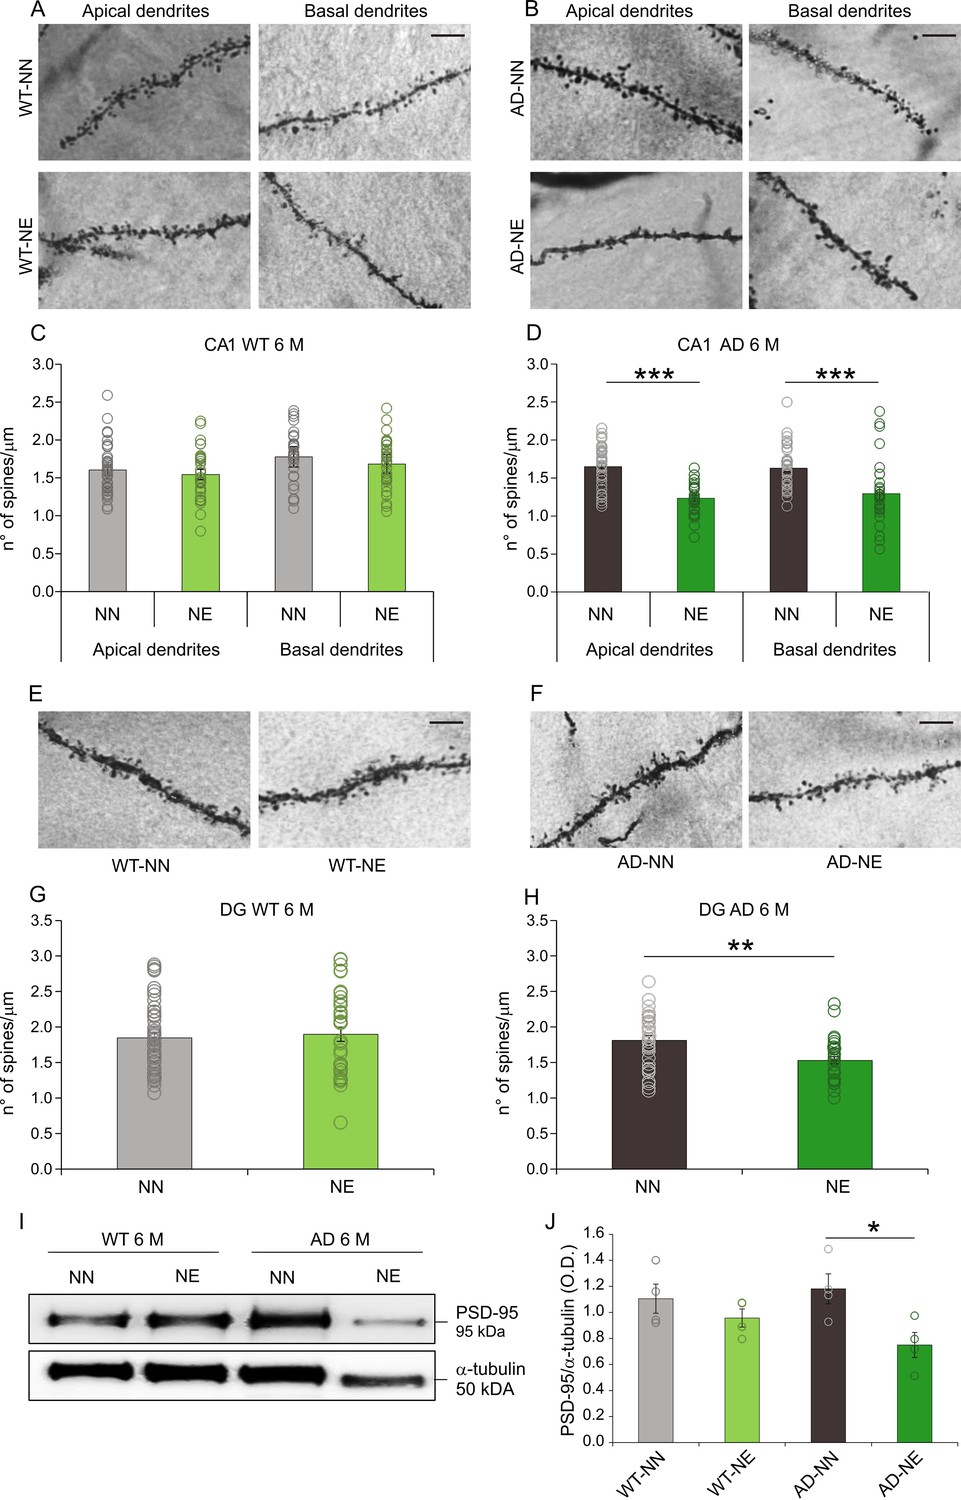
Decreased spine density is observed in the hippocampus of 3×Tg Alzheimer’s disease (AD) mice exposed to noise.
(A–B) Representative images of apical and basal dendrites of neurons in the hippocampal CA1 region in WT-NN and WT-NE groups (left panels, A) and in AD-NN and AD-NE groups (right panels, B). Scale bar: 10 μm. (C–D) Bar graphs showing mean values of spine density (mean ± SEM) in apical and basal dendrites of CA1 pyramidal neurons in NN and NE groups from WT (C) and AD mice (D) at 6 months of age (M). At least 30 segments from 30 different neurons were analyzed from four animals/groups. The number of spines decreased significantly in AD-NE compared to AD-NN group (D, two-way ANOVA, Tukey’s post hoc test, apical dendrites p = 0.0001; basal dendrites p = 0.0009) whereas no differences between WT-NN and WT-NE groups were observed (C, two-way ANOVA, Tukey’s post hoc test, p = 0.64). (E–F) Representative images of dentate gyrus (DG) neuron dendrites in WT-NN and WT-NE groups (left panels, E) and AD-NN and AD-NE groups (right panels, F). Scale bar: 10 μm. (G–H) Bar graphs showing mean values of spine density (mean ± SEM) in neurons of DG in NN and NE groups from WT mice (G) and AD mice (H) at 6 M. The number of spines decreased significantly in AD-NE compared to AD-NN mice (H, one-way ANOVA, p = 0.001) whereas no differences between WT-NN and WT-NE groups were observed (G, one-way ANOVA, p = 0.68). (I) Representative Western immunoblot revealing decreased PSD-95 expression in the hippocampus of AD exposed to noise (6 M) compared with age-matched not-exposed group. (J) Bar graph in the lower panel shows results of densitometric analyses on all samples (n = 4 mice for each group; Student’s t-test, WT-NE vs. WT-NN, p = 0.30; AD-NE vs. AD-NN, p = 0.028) normalized to total protein levels (α-tubulin). Data are expressed as mean ± SEM. Asterisks indicate significant differences between groups (*p < 0.05; **p < 0.01; ***p < 0.001).
-
Figure 6—source data 1
Numerical source data from Figure 6.
- https://cdn.elifesciences.org/articles/70908/elife-70908-fig6-data1-v1.xlsx
Figure 7 with 2 supplements
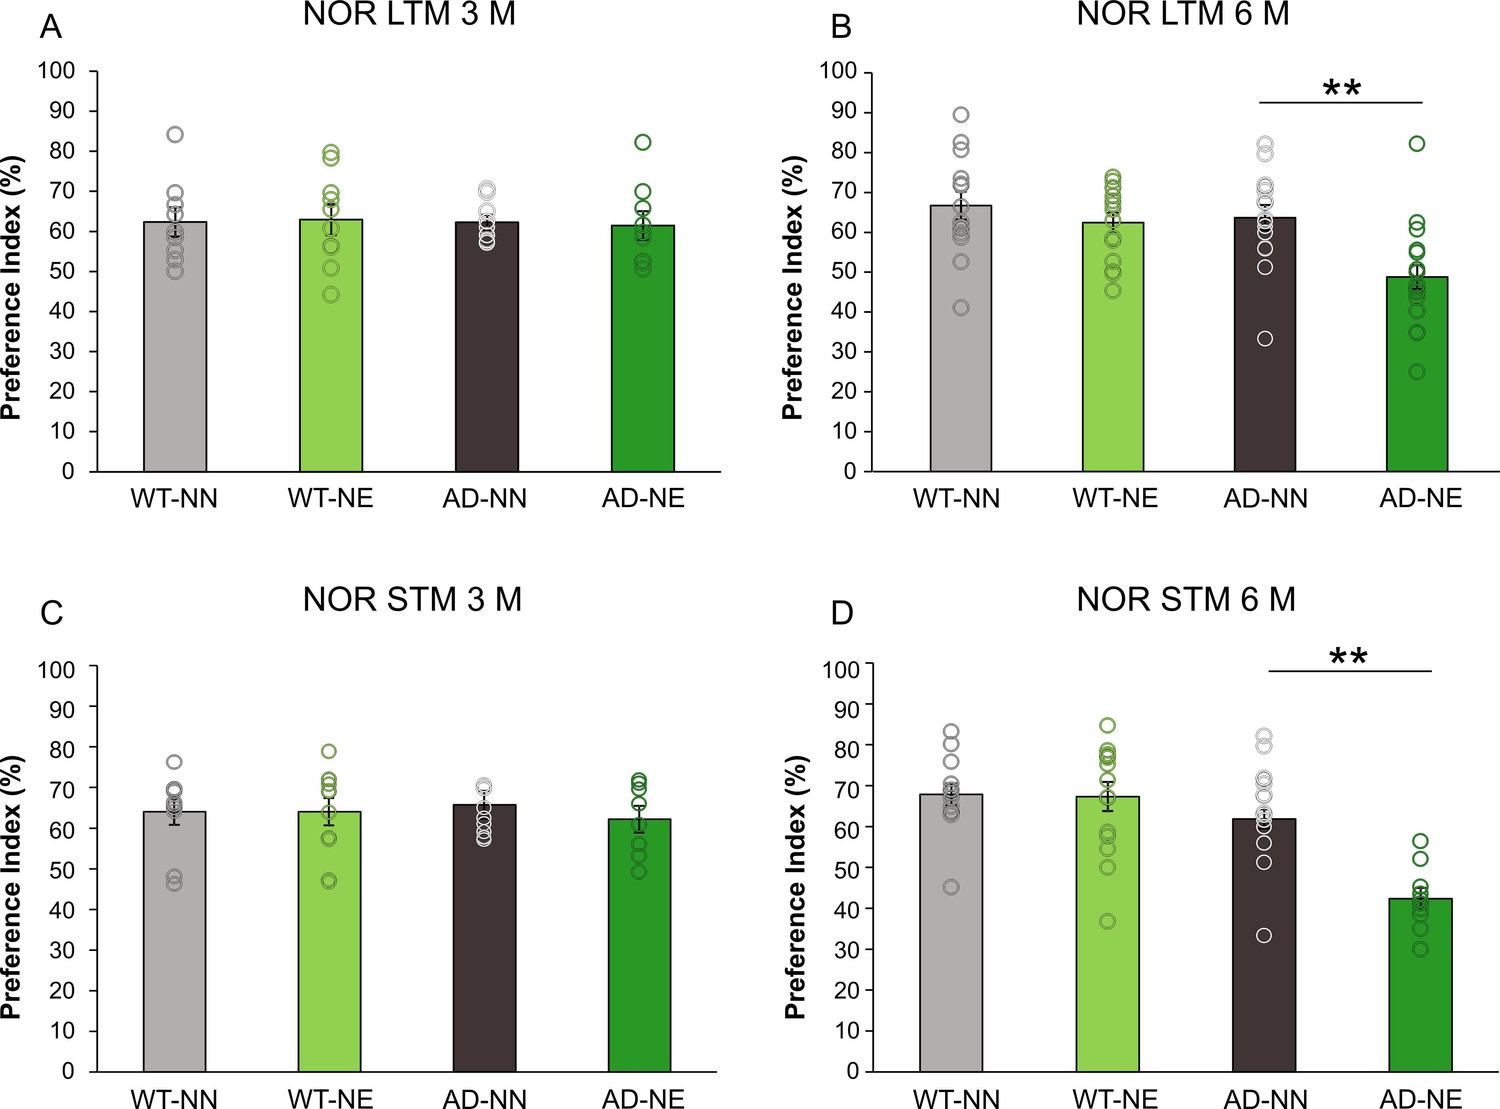
Sensory deprivation induced by noise accelerates learning and memory deficits in 3×Tg Alzheimer’s disease (AD) mice.
Graphs show preference index for the novel object in the novel object recognition (NOR), from both long-term memory (LTM; A,B) and short-term memory (STM; C,D) paradigms in NN and NE groups from wild-type (WT) and AD animals of 3 months of age (M) (A,C; WT-NN STM n = 10, LTM n = 9; WT-NE STM n = 11, LTM n = 10; AD-NN STM n = 8, LTM n = 9; AD-NE STM n = 8, LTM n = 9) and 6 M (B,D; WT-NN STM n = 13, LTM n = 14; WT-NE STM n = 15, LTM n = 15; AD-NN STM n = 14, LTM n = 15; AD-NE STM n = 10, LTM n = 18). Notably, memory performance decreased significantly in AD mice exposed to noise compared to age-matched not-exposed animals at 6 M, for both LTM (two-way ANOVA, Bonferroni post hoc test, p = 0.001) and STM (two-way ANOVA, Bonferroni post hoc test, p < 0.001) evaluations. Data are expressed as mean ± SEM. Asterisks indicate significant differences among groups (**p < 0.001).
-
Figure 7—source data 1
Numerical source data from Figure 7.
- https://cdn.elifesciences.org/articles/70908/elife-70908-fig7-data1-v1.xlsx
Figure 7—figure supplement 1
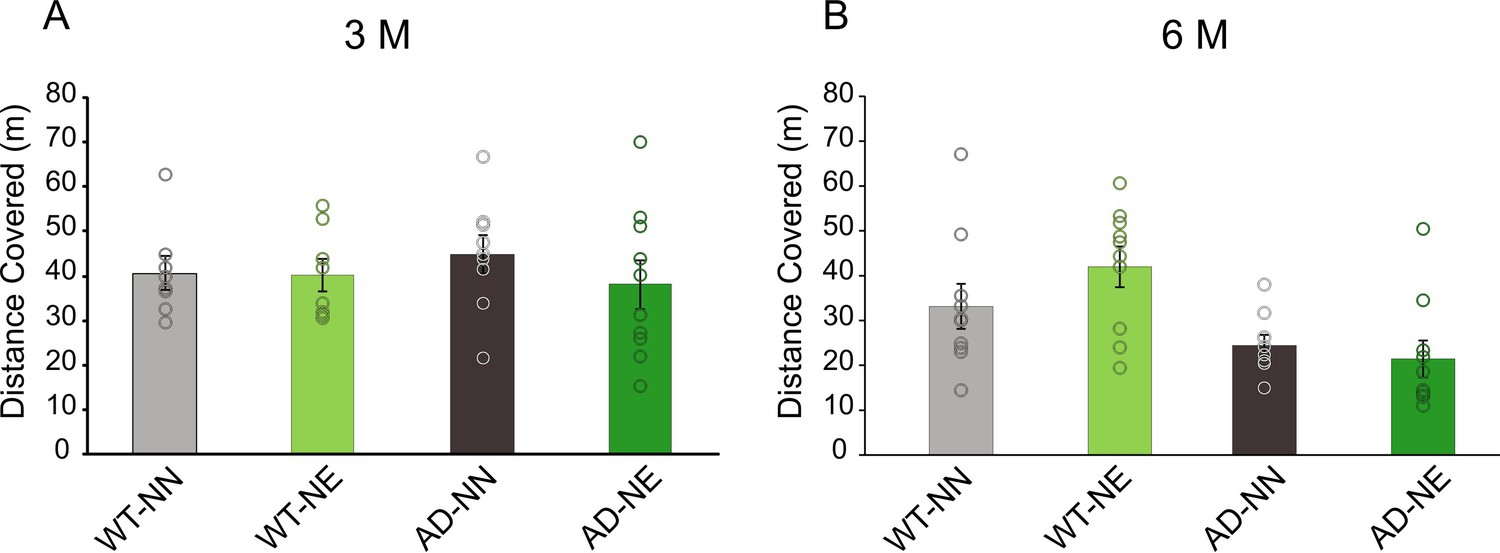
Locomotor activity of wild-type (WT) and 3×Tg Alzheimer’s disease (AD) mice of 3 months of age (M) and 6 M in the open field.
Bar graphs showing mean distance covered (mean ± SEM) in the open field test in WT and AD animals at 3 M (A) and 6 M (B).
Figure 7—figure supplement 2
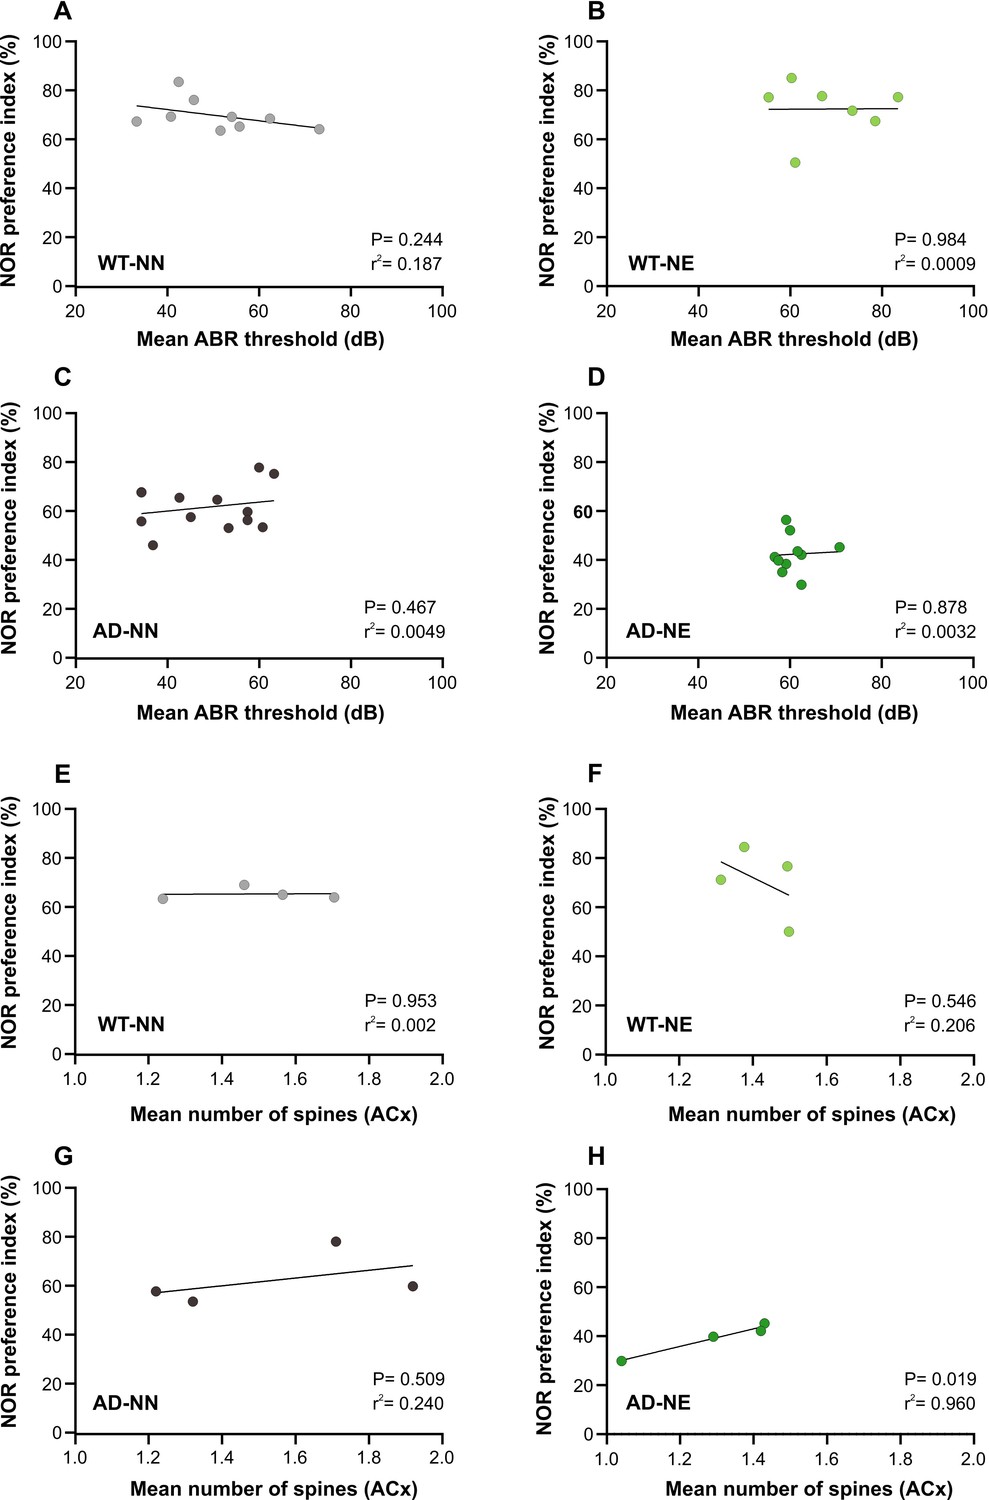
Animal-by-animal analysis comparing auditory brainstem recording (ABR) measurements, novel object recognition (NOR) performance, and ACx spine density.
(A–D) Simple linear regression analysis (Statistica, Statsoft) showing the relationship between NOR preference index (STM) and mean ABR threshold across not-exposed (NN) and noise-exposed (NE) wild-type (WT) and Alzheimer’s disease (AD) animals at 6 months of age (M) (WT-NN n = 9; WT-NE n = 7; AD-NN n = 13; AD-NE n = 10). (E–H) Simple linear regression analysis showing the relationship between NOR preference index (STM) and the mean number of spines (calculated as the average of all apical and basal dendritic spines/animal) in neurons of layer II/III of the ACx across NN and NE WT and AD animals at 6 M (n = 4 animals/group).
Figure 8
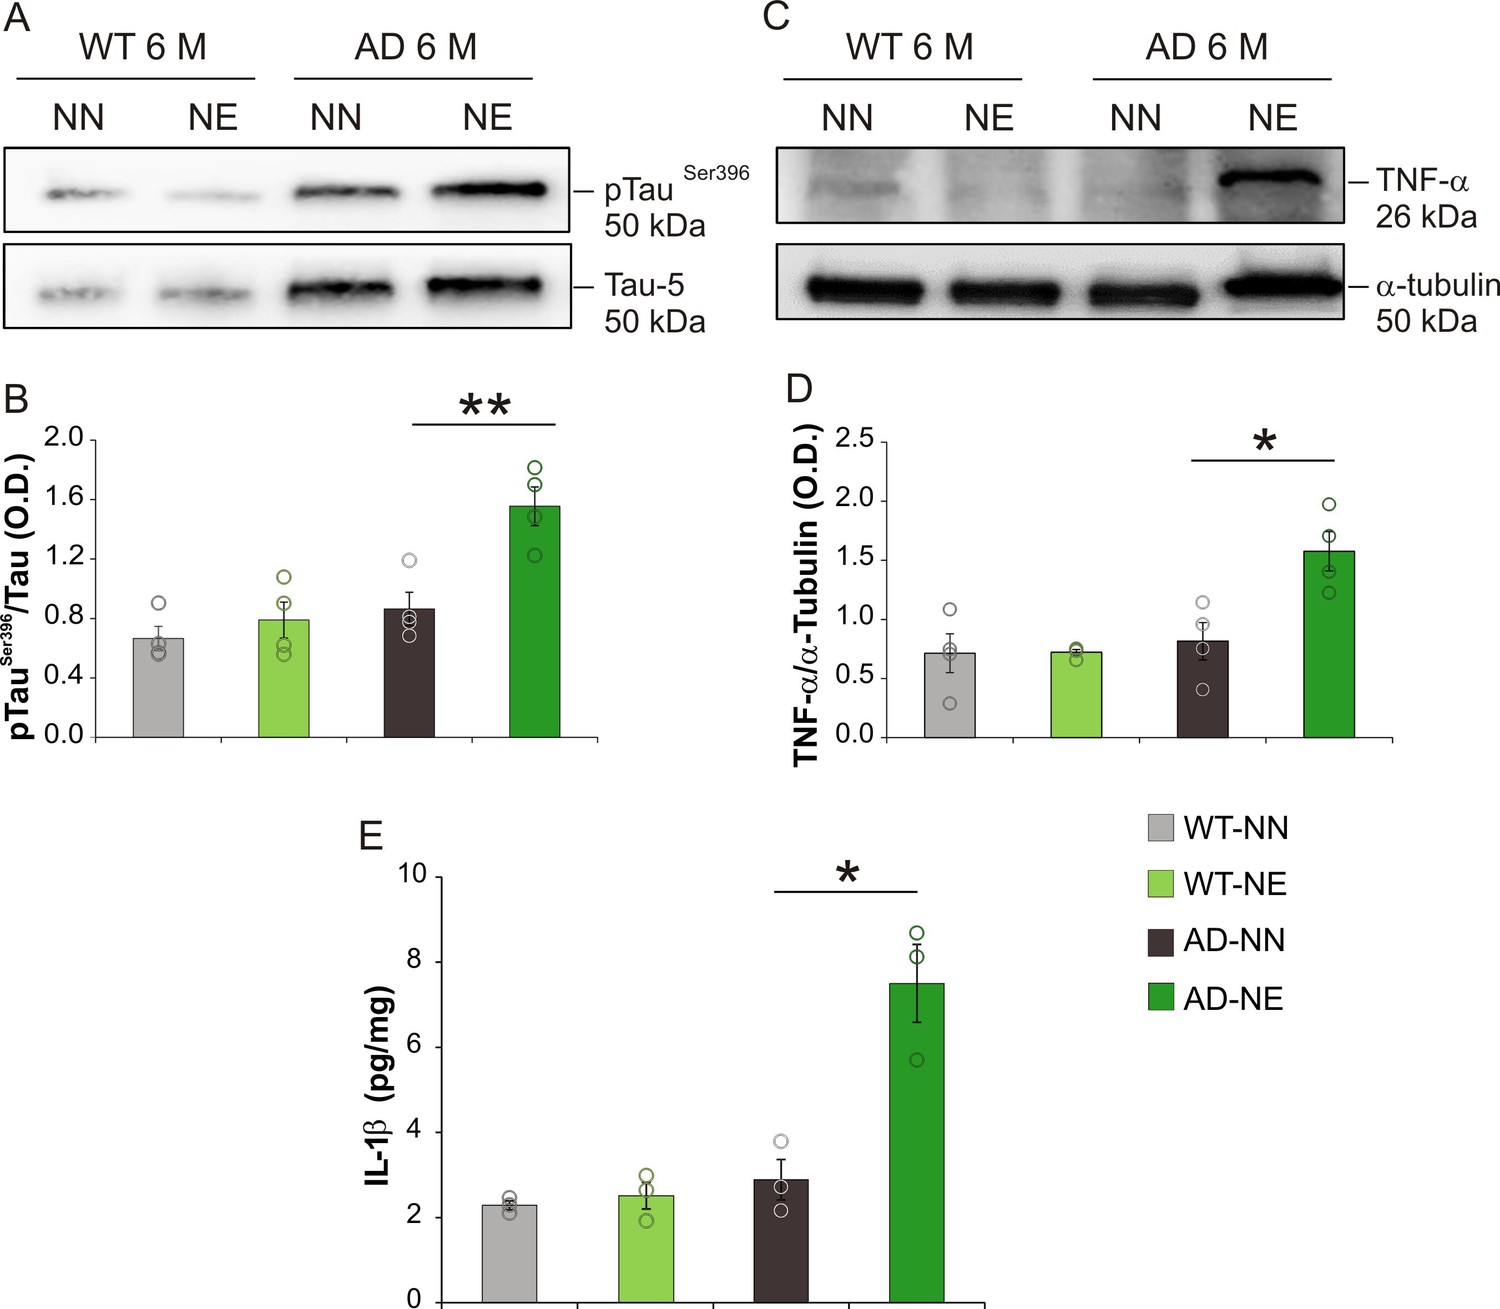
Increased tau phosphorylation and neuroinflammation in hippocampus of 3×Tg Alzheimer’s disease (AD) mice.
(A) Representative immunoblot revealing increased pTauSer396 in the hippocampus of 3×Tg-AD mice exposed to noise (6 months of age [M]) compared with age-matched not-exposed group. (B) Bar graph shows results of densitometric analyses on all samples (n = 4 mice for each group; Student’s t-test, WT-NE vs. WT-NN, p = 0.64; AD-NE vs. AD-NN, p = 0.006) normalized to the corresponding total protein levels (Tau). (C) Representative Western immunoblot revealing increasing TNF-α expression in the hippocampus of AD exposed to noise (6 M) compared with age-matched not-exposed group. (D) Bar graph shows results of densitometric analyses on all samples (n = 4 mice for each group, Student’s t-test; WT-NE vs. WT-NN, p = 0.95; AD-NE vs. AD-NN, p = 0.015) normalized to total protein levels (α-tubulin). Data are expressed as mean ± SEM. Asterisks indicate significant differences between groups (*p < 0.05; **p < 0.01). (E) Bar graph showing hippocampal IL-1β levels measured at 6 M in both NN and NE WT and AD mice (n = 3 mice for each group; Student’s t-test, WT-NE vs. WT-NN, p = 0.60; AD-NE vs. AD-NN, p = 0.01). Data are expressed as mean ± SEM. Asterisks indicate significant differences among groups (*p < 0.05; **p < 0.01).
Figure 9
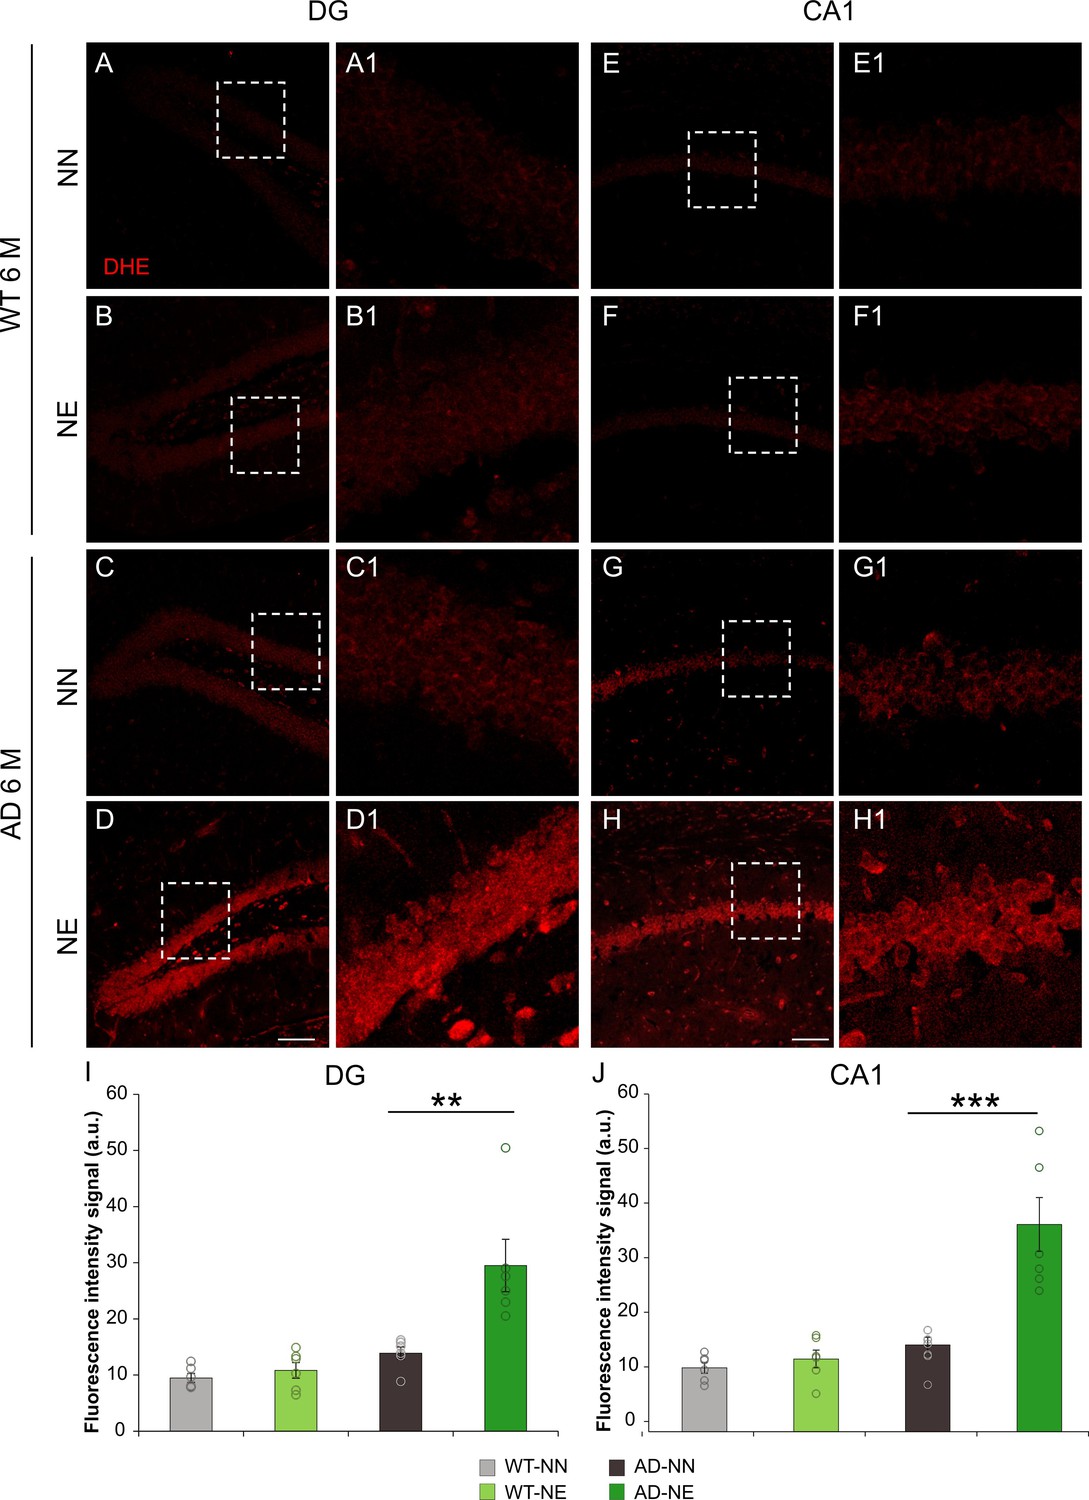
Noise induces increased reactive oxygen species (ROS) amount in the hippocampus of 3×Tg Alzheimer’s disease (AD) mice.
(A–H) Representative images of brain coronal sections stained with dihydroethidium (DHE) (red fluorescence) showing ROS amount in dentate gyrus (DG) (A–D) and CA1 (E–H) hippocampal regions of both not-exposed and noise-exposed wild-type (WT) and AD mice at 6 months of age (M). Dotted boxes in A–D and E–H refer to high magnifications showed in A1–D1 and E1–H1 respectively. (I–J) Bar graphs showing fluorescence intensity signal quantification in DG (I) and CA1 (J) in all groups. Data are expressed as mean ± SEM and are representative of three independent experiments from three animals/group. Scale bar: 100 µm. Asterisks indicate significant differences between groups (**p < 0.01; ***p < 0.001, Student’s t-test).
Figure 10 with 1 supplement
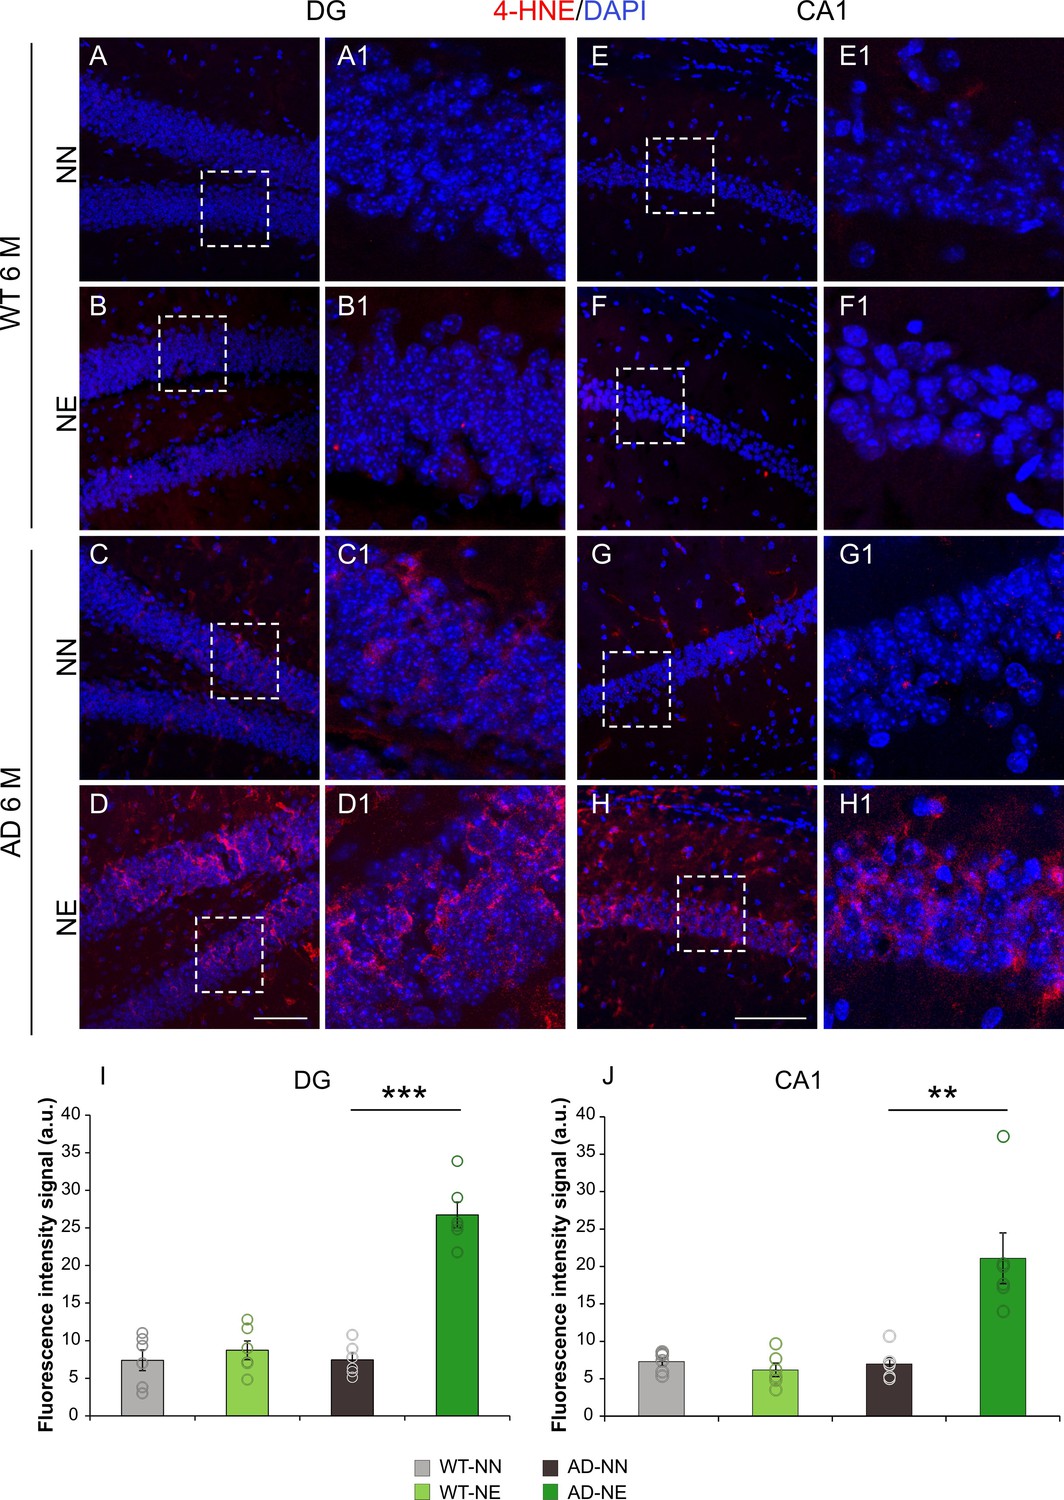
3×Tg Alzheimer’s disease (AD) mice exposed to noise show increased lipid peroxidation in the hippocampus.
(A–H) Representative images of brain coronal sections stained with 4-hydroxy-2-nonenal (4-HNE) as a marker of lipid peroxidation (red fluorescence) and DAPI (blue fluorescence) to label cell nuclei in dentate gyrus (DG) (A–D) and CA1 (E–H) hippocampal regions of both not-exposed and noise-exposed wild-type (WT) and AD mice at 6 months of age (M). Dotted box in A–D and E–H refers to high magnifications showed in A1–D1 and E1–H1 respectively. (I–J) Bar graphs showing 4-HNE fluorescence intensity signal quantification in DG (I) and CA1 (J) in all groups. Data are expressed as mean ± SEM and are representative of three independent experiments from three animals/group. Scale bar: 100 µm. Asterisks indicate significant differences between groups (**p < 0.01; ***p < 0.001, Student’s t-test).
Figure 10—figure supplement 1
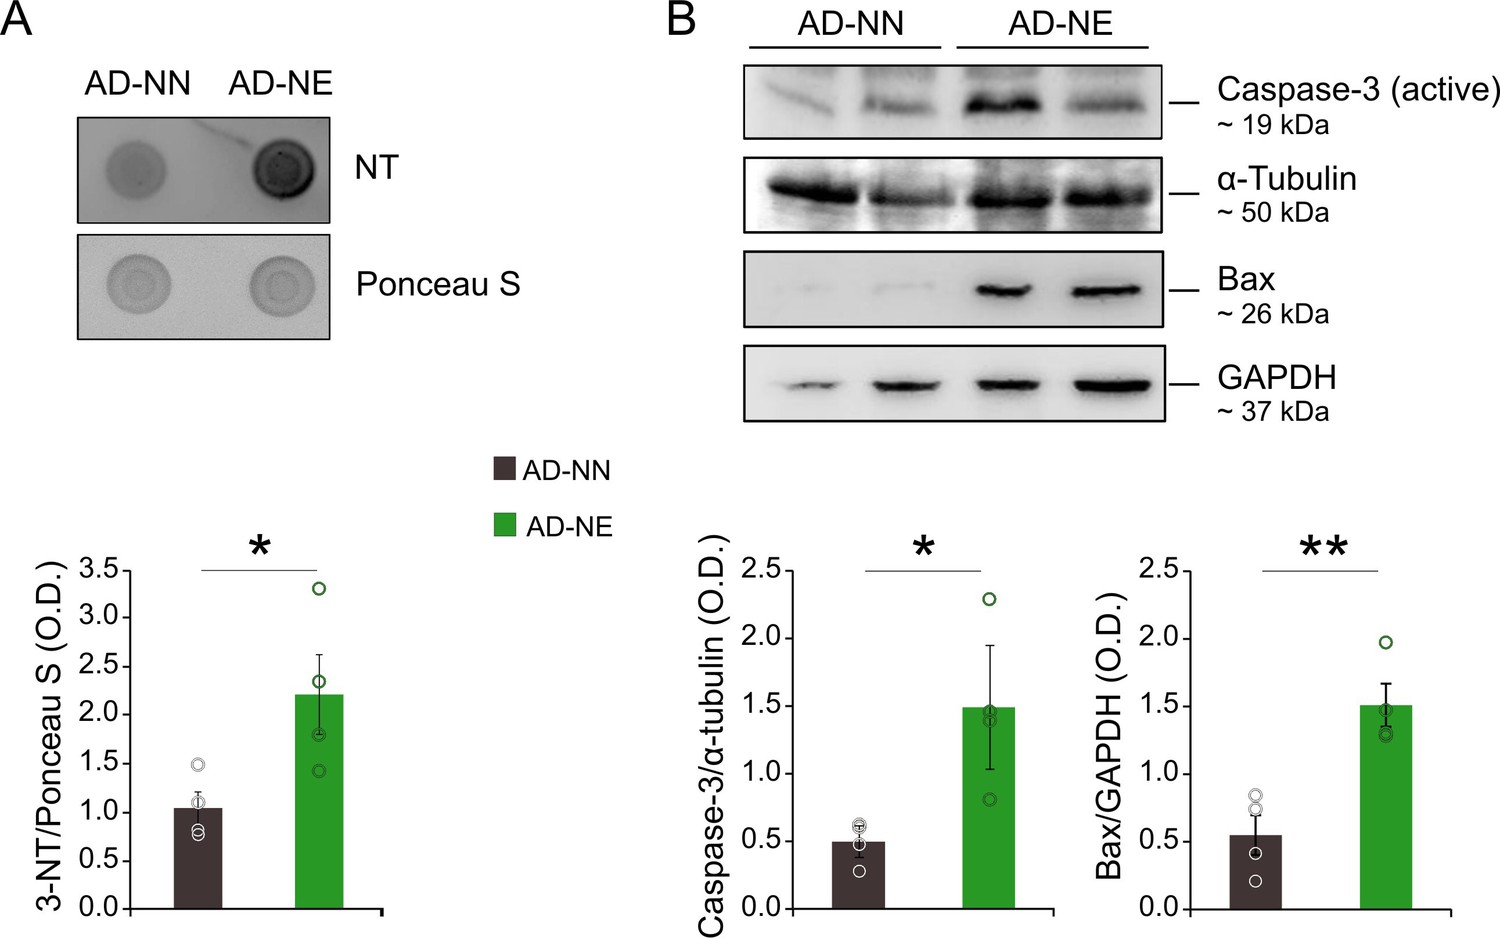
Detection of hippocampal protein tyrosine nitration and increase of apoptotic markers.
(A) Representative dot blot and densitometric analysis showing an increase of nitrotyrosine (NT) expression in 6 months of age (M) Alzheimer’s disease (AD) mice exposed to noise (n = 4 mice for each group; Student’s t-test, AD-NE vs. AD-NN, p = 0.038). Equal protein loading was checked by Ponceau S staining of the membrane. (B) Representative Western immunoblots revealing increased expression of Bax (n = 4 mice/group; Student’s t-test, p = 0.004) and active Caspase-3 (n = 4 mice/group; Student’s t-test, p = 0.24) in the hippocampus of 6 M AD-NE mice compared to age-matched not-exposed animals. Bar graphs showing results of densitometric analyses on all samples normalized to the corresponding total protein levels (α- tubulin or GAPDH). Asterisks indicate significant differences between groups (*p < 0.05; **p < 0.01).
Figure 11

Expression of endogenous antioxidant enzymes in hippocampus after noise exposure.
(A,C) Representative Western immunoblots revealing expression of superoxide dismutase 2 (SOD2) (A) and heme oxygenase-1 (HO-1) (C) in the hippocampus of both not-exposed (NN) and noise-exposed (NE) wild-type (WT) and Alzheimer’s disease (AD) mice at 6 months of age (M). (B,D) Bar graphs showing results of densitometric analyses on all samples normalized to the corresponding total protein levels (GAPDH). No differences in SOD2 expression were found among groups (n = 4 mice for each group; Student’s t-test, WT-NE vs. WT-NN, p = 0.81; AD-NE vs. AD-NN, p = 0.76), whereas a significant increase in HO-1 expression was found in hippocampi of WT animals exposed to noise (n = 4 mice for each group; Student’s t-test, WT-NE vs. WT-NN, p = 0.0007; AD-NE vs. AD-NN, p = 0.95). Data are expressed as mean ± SEM. Asterisks indicate significant differences between groups (**p < 0.01).
Tables
Table 1
Exploration time for novel and familiar objects in both short- and long-term memory.
| Treatment | Short-term memory NOR | Long-term memory NOR | ||
|---|---|---|---|---|
| 3 M | Novel obj. | Familiar obj. | Novel obj. | Familiar obj. |
| WT-NN | 14 ± 2.1 s | 8 ± 1.3 s | 18.8 ± 4.2 s | 10.3 ± 1.2 s |
| WT-NE | 14.6 ± 1.5 s | 8.7 ± 1.4 s | 15.7 ± 3 s | 8.6 ± 1.3 s |
| AD-NN | 14.1 ± 1.2 s | 7.6 ± 1.1 s | 11.4 ± 1.9 s | 6.8 ± 0.9 s |
| AD-NE | 10.9 ± 1.1 s | 6.9 ± 1.1 s | 9.2 ± 0.9 s | 5.8 ± 0.8 s |
| 6 M | Novel obj. | Familiar obj. | Novel obj. | Familiar obj. |
| WT-NN | 19.7 ± 2.8 s | 8.7 ± 1.1 s | 15.2 ± 1.9 s | 7.3 ± 1 s |
| WT-NE | 16.3 ± 1.9 s | 7.6 ± 0.9 s | 17.5 ± 1.5 s | 10.9 ± 1.5 s |
| AD-NN | 13.1 ± 1.8 s | 7.7 ± 0.9 s | 11.4 ± 1.4 s | 6.3 ± 0.9 s |
| AD-NE | 6.8 ± 0.7 s | 9.4 ± 1 s | 7.1. ± 0.7 s | 7.2 ± 0.5 s |
Additional files
-
Supplementary file 1
List of reagents and antibodies used.
- https://cdn.elifesciences.org/articles/70908/elife-70908-supp1-v1.docx
-
Transparent reporting form
- https://cdn.elifesciences.org/articles/70908/elife-70908-transrepform1-v1.docx
-
Source data 1
Source data for western blots.
- https://cdn.elifesciences.org/articles/70908/elife-70908-supp2-v1.zip
Download links
A two-part list of links to download the article, or parts of the article, in various formats.
Downloads (link to download the article as PDF)
Open citations (links to open the citations from this article in various online reference manager services)
Cite this article (links to download the citations from this article in formats compatible with various reference manager tools)
Auditory sensory deprivation induced by noise exposure exacerbates cognitive decline in a mouse model of Alzheimer’s disease
eLife 10:e70908.
https://doi.org/10.7554/eLife.70908


