Pathogen clonal expansion underlies multiorgan dissemination and organ-specific outcomes during murine systemic infection
- Department of Microbiology, Harvard Medical School, United States
- Division of Infectious Diseases, Brigham & Women’s Hospital, United States
Figures
Figure 1 with 4 supplements
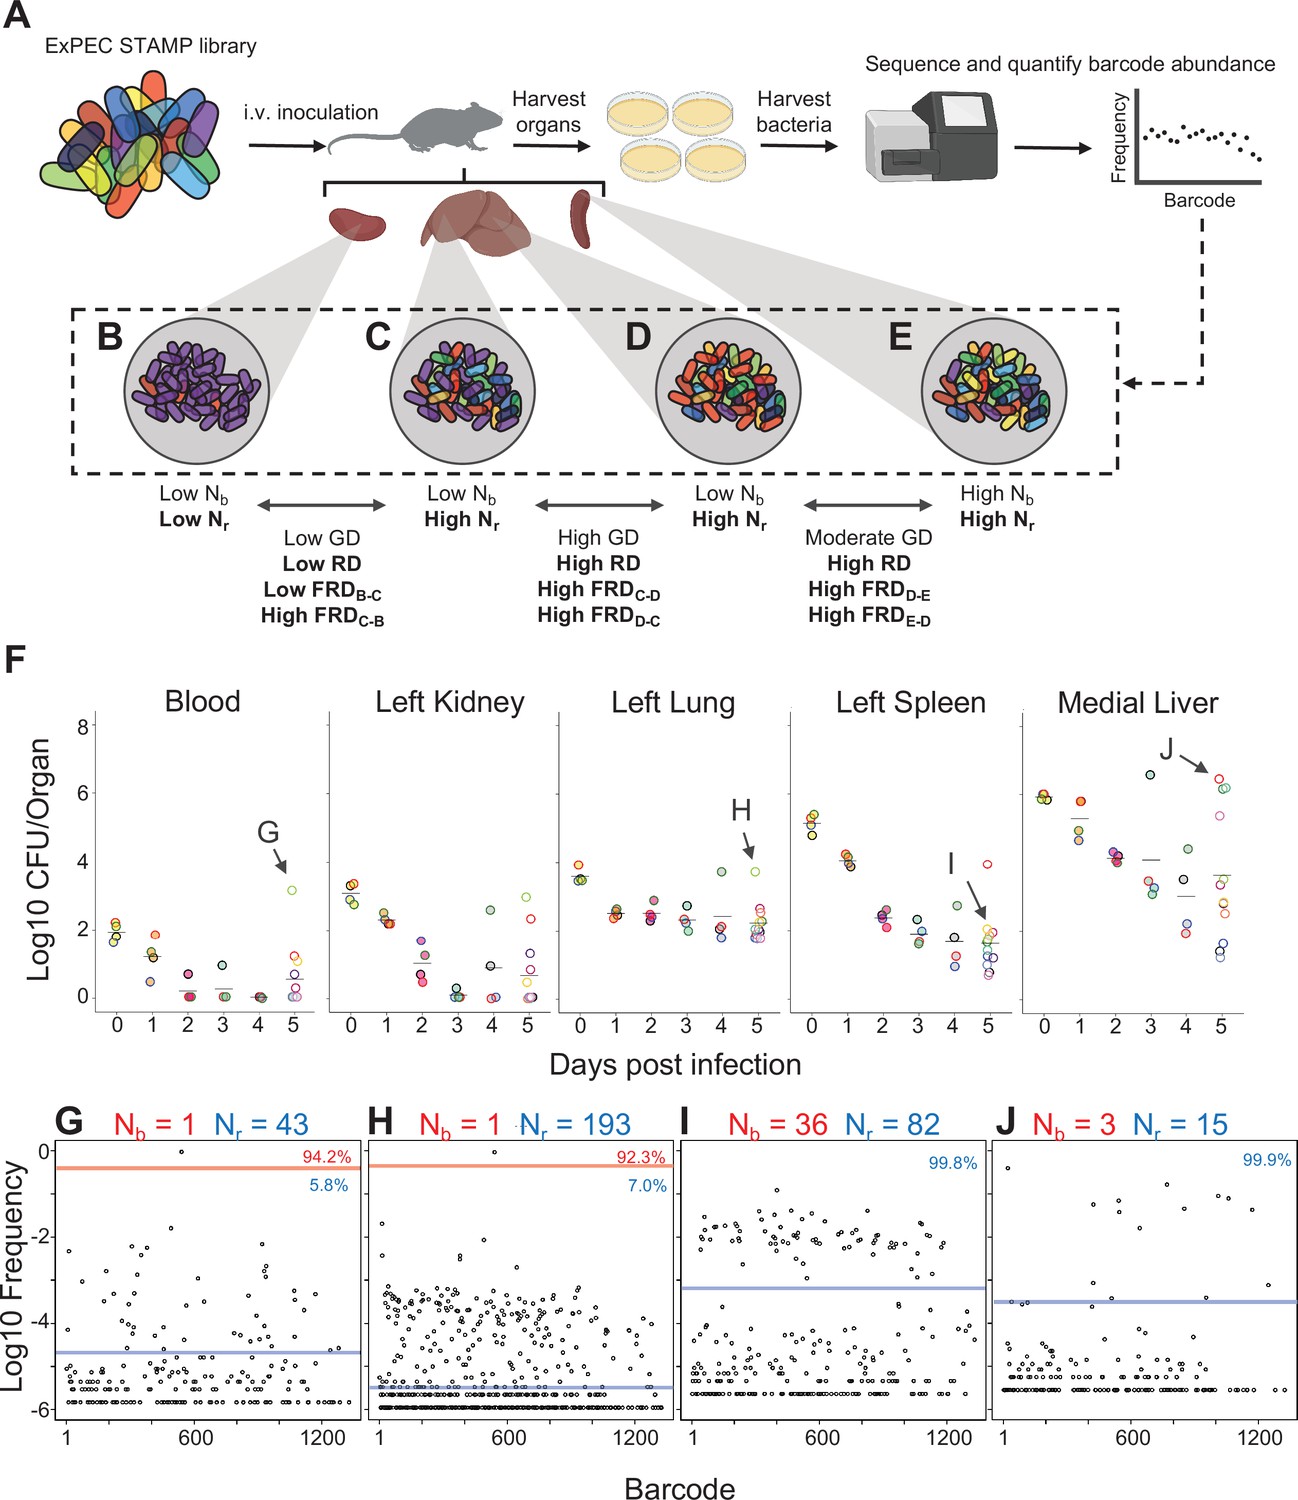
Experimental design and metrics and CFU dynamics.
(A) The experimental schematic depicts the extraintestinal pathogenic Escherichia coli (ExPEC) barcoded library as colored bacteria, where colors indicate unique barcodes; the library was injected intravenously (i.v.) into mice, after which organs were harvested, homogenized, and plated for enumeration of CFU. Bacterial cells were scraped, pooled, and the barcode abundances in the output populations were quantified. The distributions of the barcodes (far-right graph) define the population structure of the organ, schematized in (B–E). (B–E) Graphical depiction of populations with different combinations of Nb and Nr values. These populations arise from (B) a tight bottleneck and subsequent expansion of purple cells, (C, D) a wider bottleneck and expansion of purple (C) or red (D) cells and (E) a wide bottleneck and even growth of all cells. Metrics used for comparisons between samples (genetic distance [GD], “resilient” genetic distance [RD], and fractional RD [FRD]) are indicated. (F) CFU recovered from select organs on days 0–5; the full CFU data set is provided in Figure 1—figure supplements 2–4. Points with the same fill and border color were obtained from the same animal. Arrows pointing to G–J correspond to the points where complete barcode frequency distributions are shown below (in G–J). (G–J) Barcode distributions and Nb and Nr values are shown. Red lines separate populations that were distinguished by the Nr algorithm (Hullahalli et al., 2021). Blue line indicates the algorithm-defined threshold for noise. Percentages represent the relative abundance of barcodes within each region. G and H represent examples with highly abundant barcodes that skew Nb values lower. (G) reproduced from Figure S5B (Hullahalli et al., 2021).
Figure 1—figure supplement 1
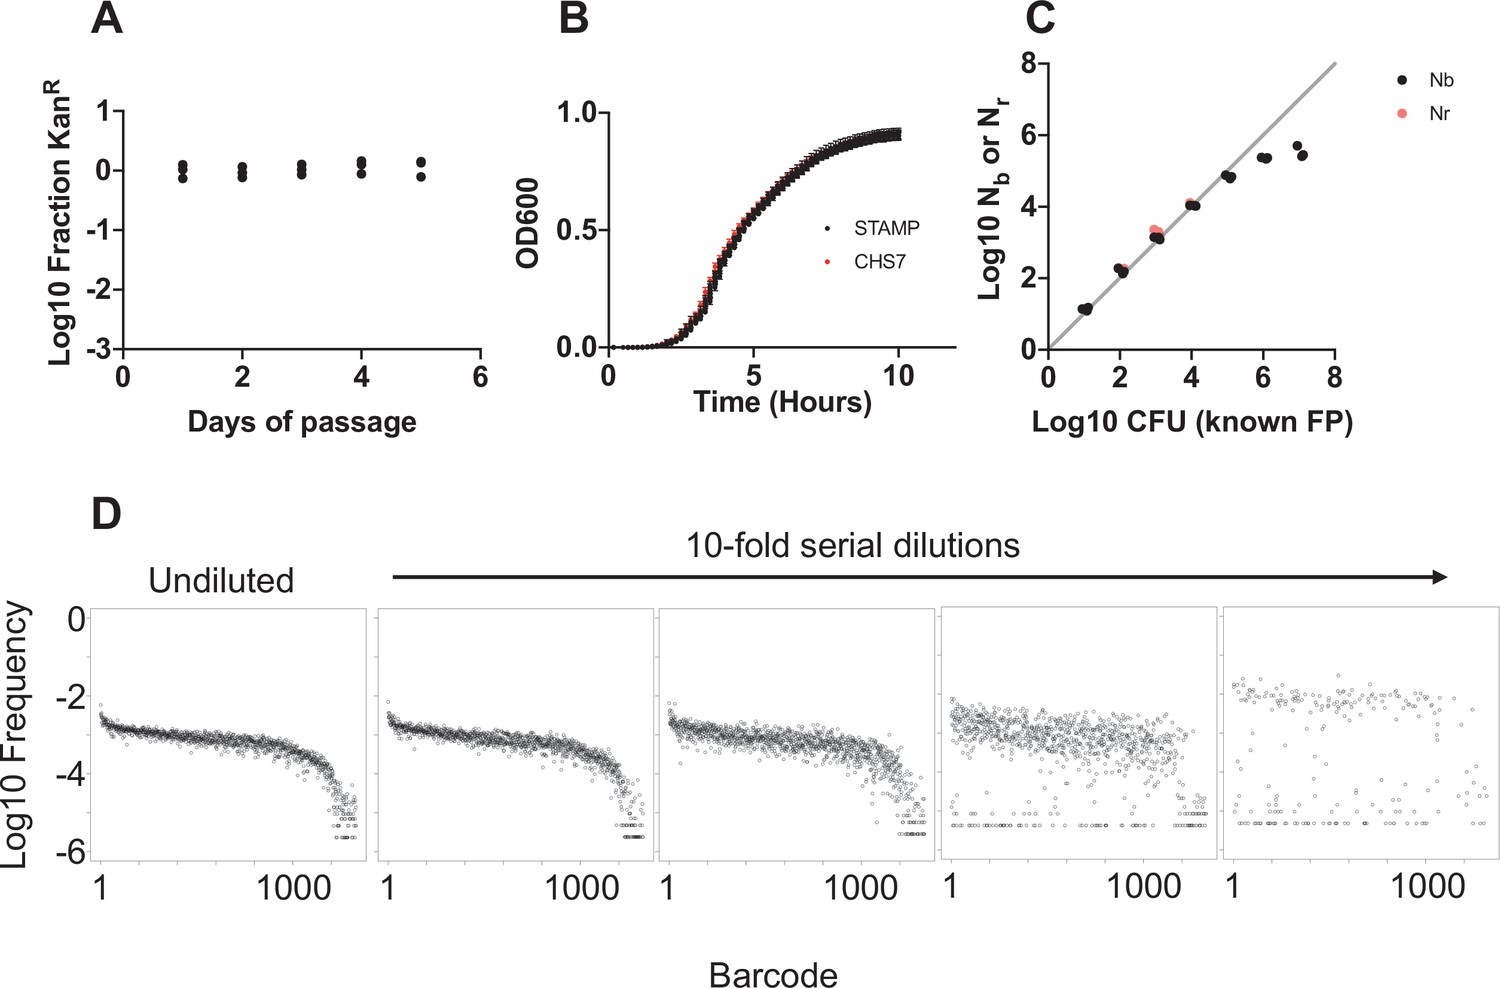
Barcode stability and creation of the STAMPR standard curve.
(A) The barcoded library was serially passed in LB lacking antibiotic. Each day, colonies containing barcodes were enumerated as a fraction of the kanamycin-resistant cells. In addition, every day, 30 single colonies derived from the serially passaged culture were grown on plates lacking kanamycin and then patched onto media containing kanamycin. All colonies retained the antibiotic resistance marker, suggesting that the barcode is stable for at least ~50 generations. (B) Growth curves of nine individual barcoded clones (STAMP) and the WT untagged strain (CHS7) were indistinguishable, indicating that the tags do not confer a growth defect. (C) Sequencing of the barcodes at different known bottleneck sizes (plated serial dilutions of the barcoded library) showed that both Nb and Nr accurately reflect founding population (FP) values up to 105 – corresponding to the approximate sequencing depth of the sample. The underlying barcode distributions that result from the serial dilutions are shown in (D).
Figure 1—figure supplement 2
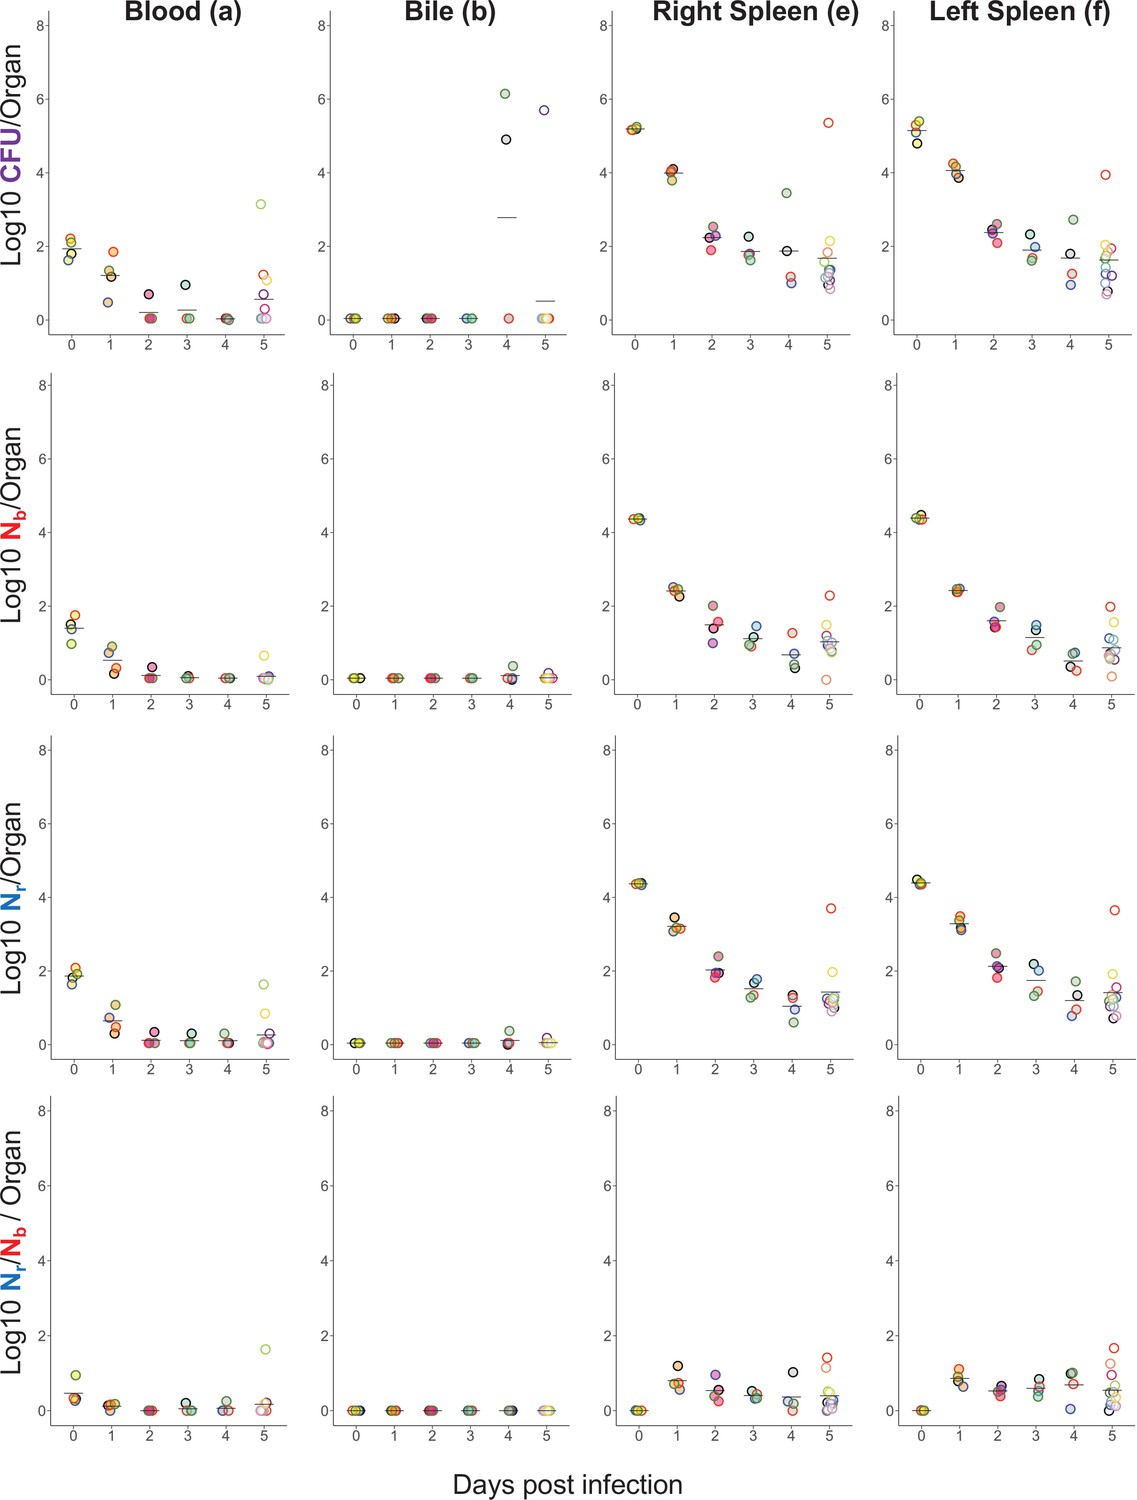
Longitudinal CFU, Nb, and Nr measurements from the blood, bile, and spleen.
Points with the same fill and border color are from the same animal; the same fill and border coloring scheme is used for the animals shown in Figure 1—figure supplement 3 and Figure 1—figure supplement 4.
Figure 1—figure supplement 3
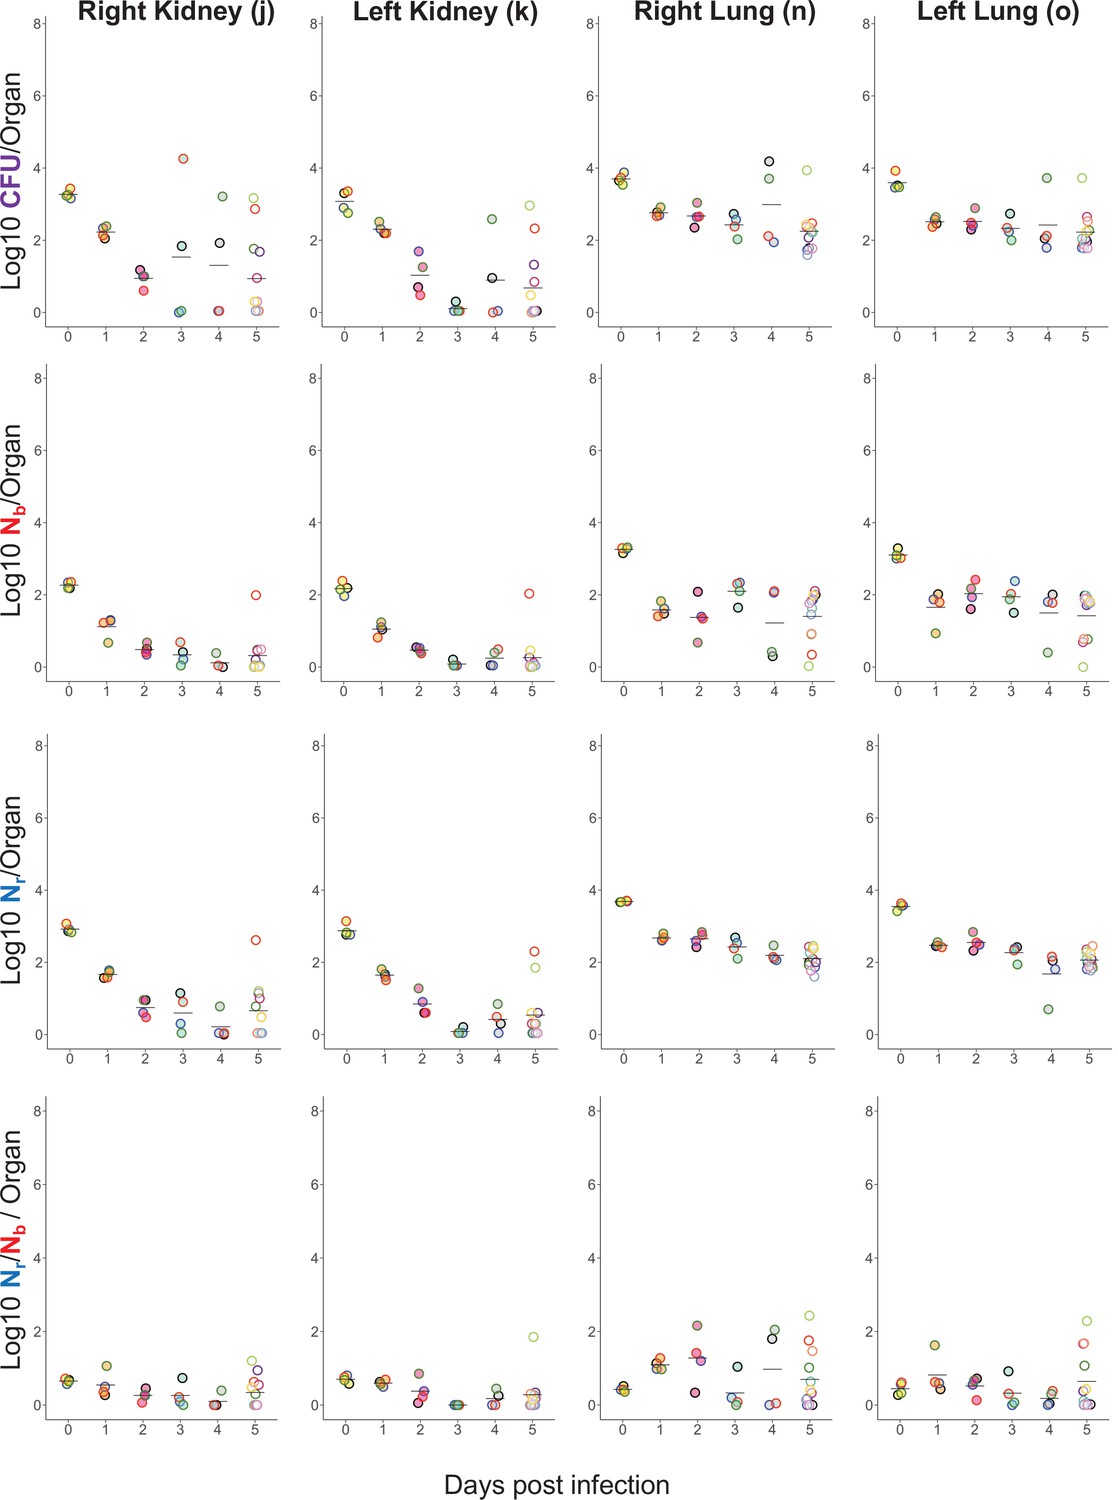
Longitudinal CFU, Nb, and Nr measurements from the lungs and kidneys.
Points with the same fill and border color are from the same animal and correspond to animals shown in Figure 1—figure supplement 2 and Figure 1—figure supplement 4.
Figure 1—figure supplement 4
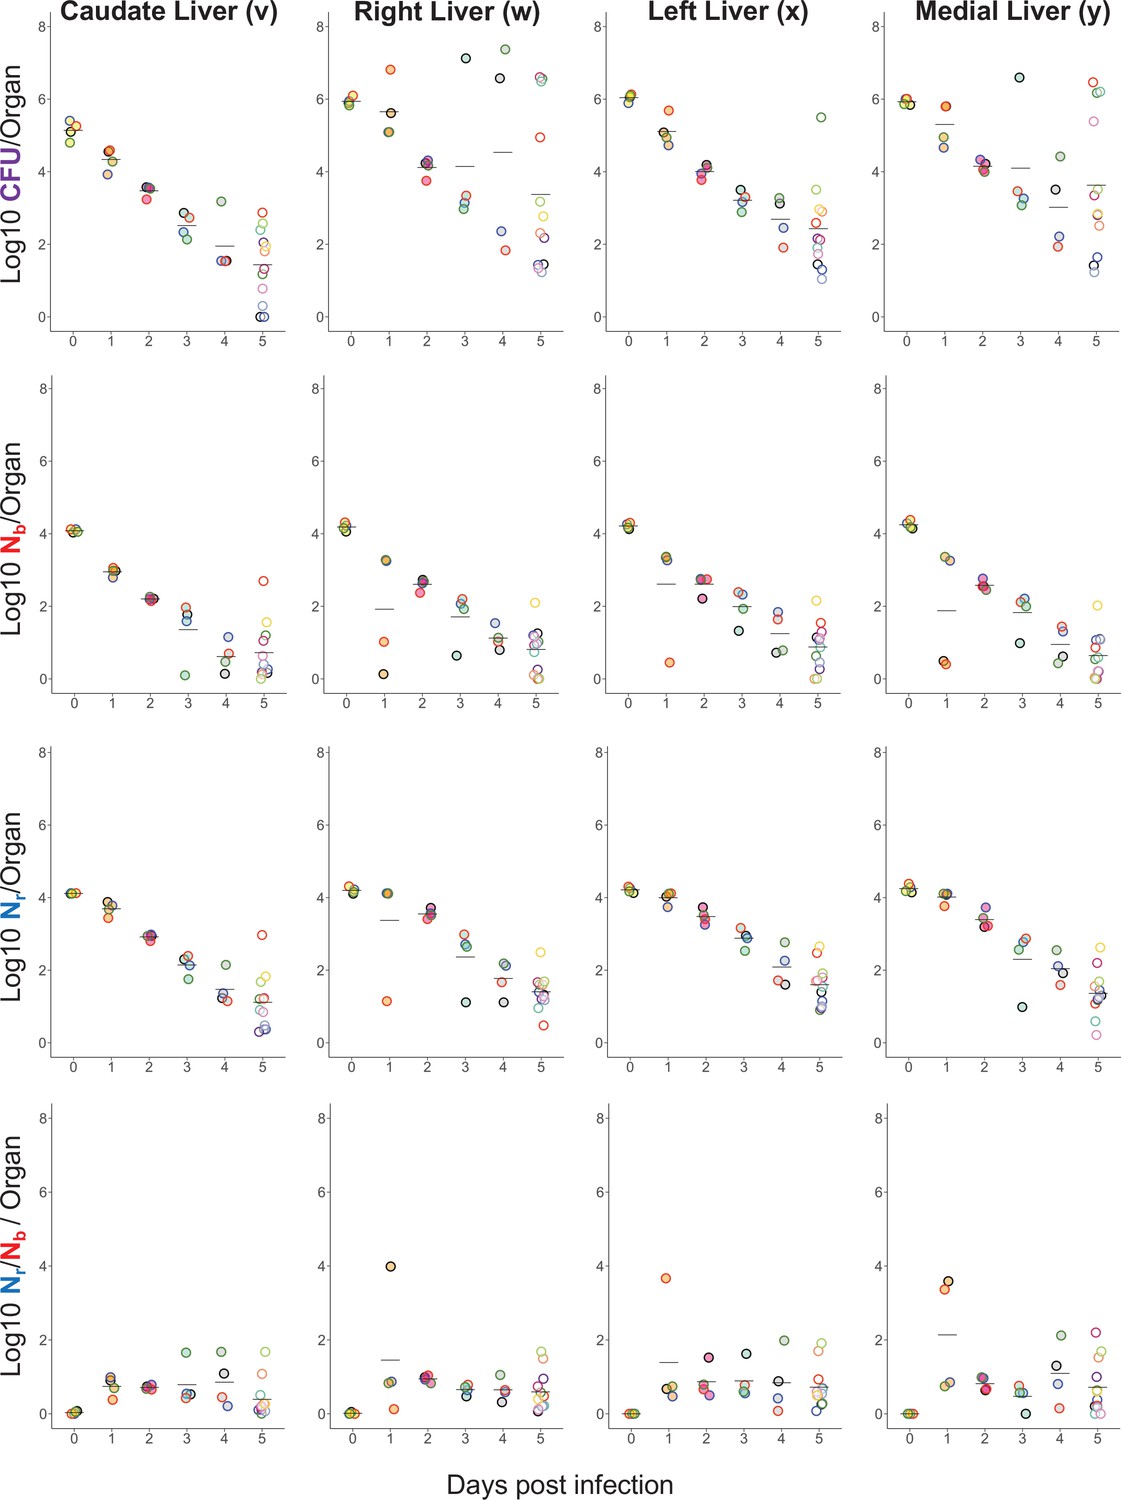
Longitudinal CFU, Nb, and Nr measurements from the liver.
Points with the same fill and border color are from the same animal and correspond to animals shown in Figure 1—figure supplement 2 and Figure 1—figure supplement 3.
Figure 2 with 1 supplement
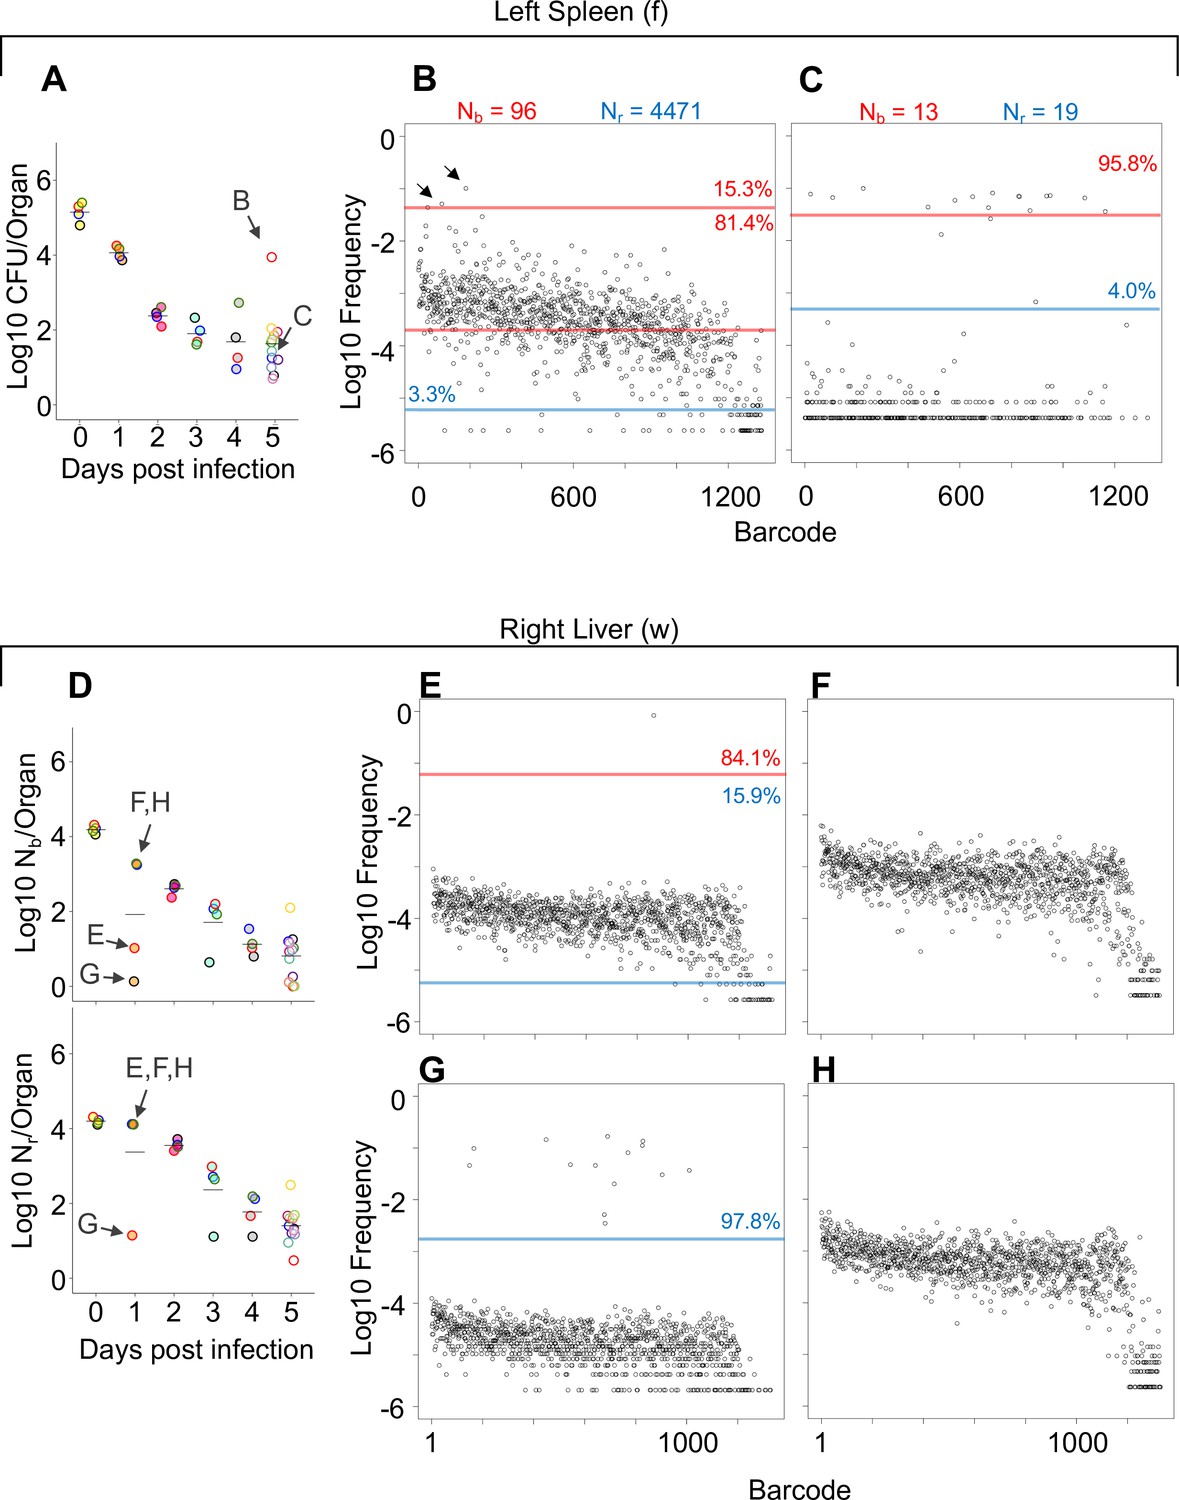
Comparisons of barcode distributions in animals with or without clonal expansion events.
(A) CFU from the left half of the spleen 5 days post infection (dpi); points with the same fill and border color are derived from the same animal. (B, C) The underlying barcode distribution found in animals B and C are shown in the respective graphs on the right. The highly increased bacterial burden in animal B relative to animal C can be attributed to both a wider bottleneck and clonal expansion. In the barcode frequency distribution shown in (B), a diverse population is evident, as is the clear expansion of a few clones (arrows). In contrast, in animal C, Nb and Nr are similar to CFU, suggesting that the population has undergone relatively little replication. (D) Nb and Nr plots from the right lobe of the liver 1 dpi. The underlying barcode distributions in animals E, F, G, and H are shown in the respective graphs to the right (in E–H). Animals E and G have clonal expansion events; expansion is so substantial in (G) (~98% of reads) that the algorithm cannot distinguish the underlying population from noise, and Nr is not substantially higher than Nb for this sample. In contrast, Nr can identify this population in sample E. Red and blue lines denote subpopulations and noise, as in Figure 1.
Figure 2—figure supplement 1
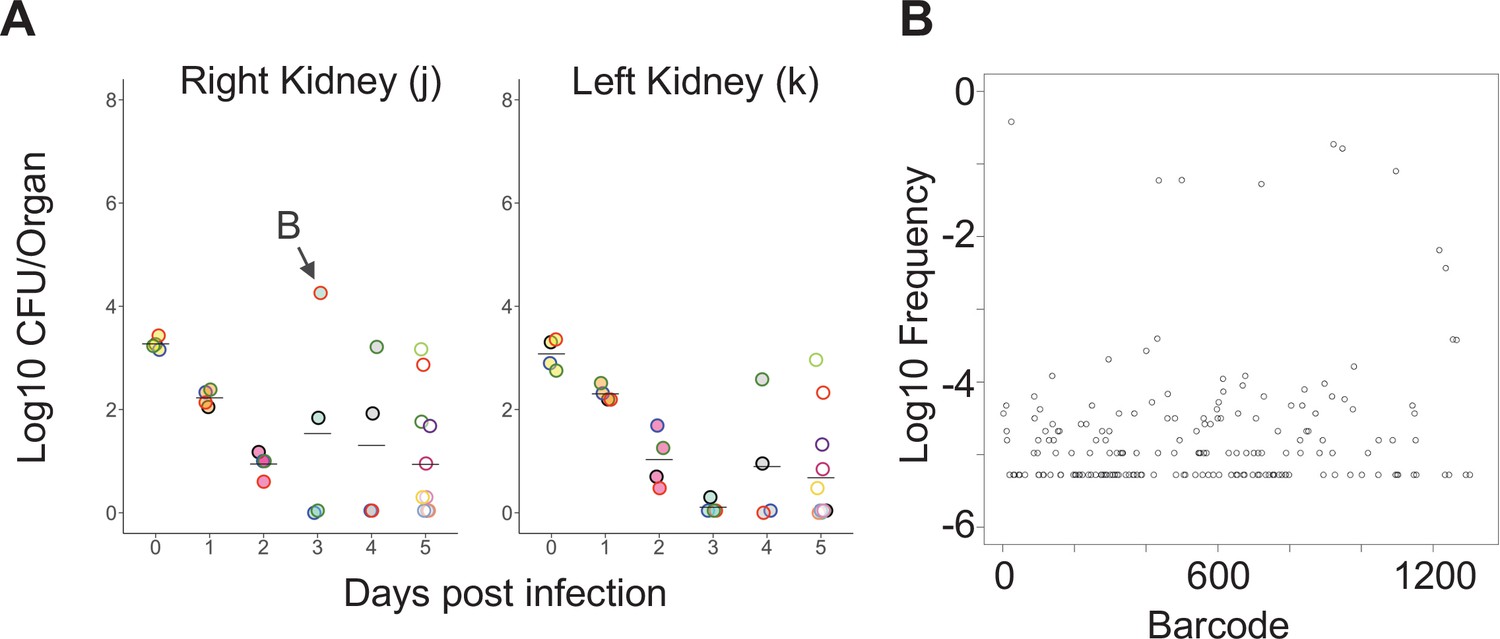
Clonal expansion in the kidney.
(A) CFU of the right kidney is shown and is taken from the larger data set in Figure 1—figure supplement 4. Points with the same fill and border color are derived from the same animal; in animal B, the right kidney possessed 10,000 times more bacteria than the left kidney, which was sterile. (B) The underlying barcode distribution found in animal B. High CFU in the right kidney is attributable to marked expansion of eight cells.
Figure 3 with 6 supplements
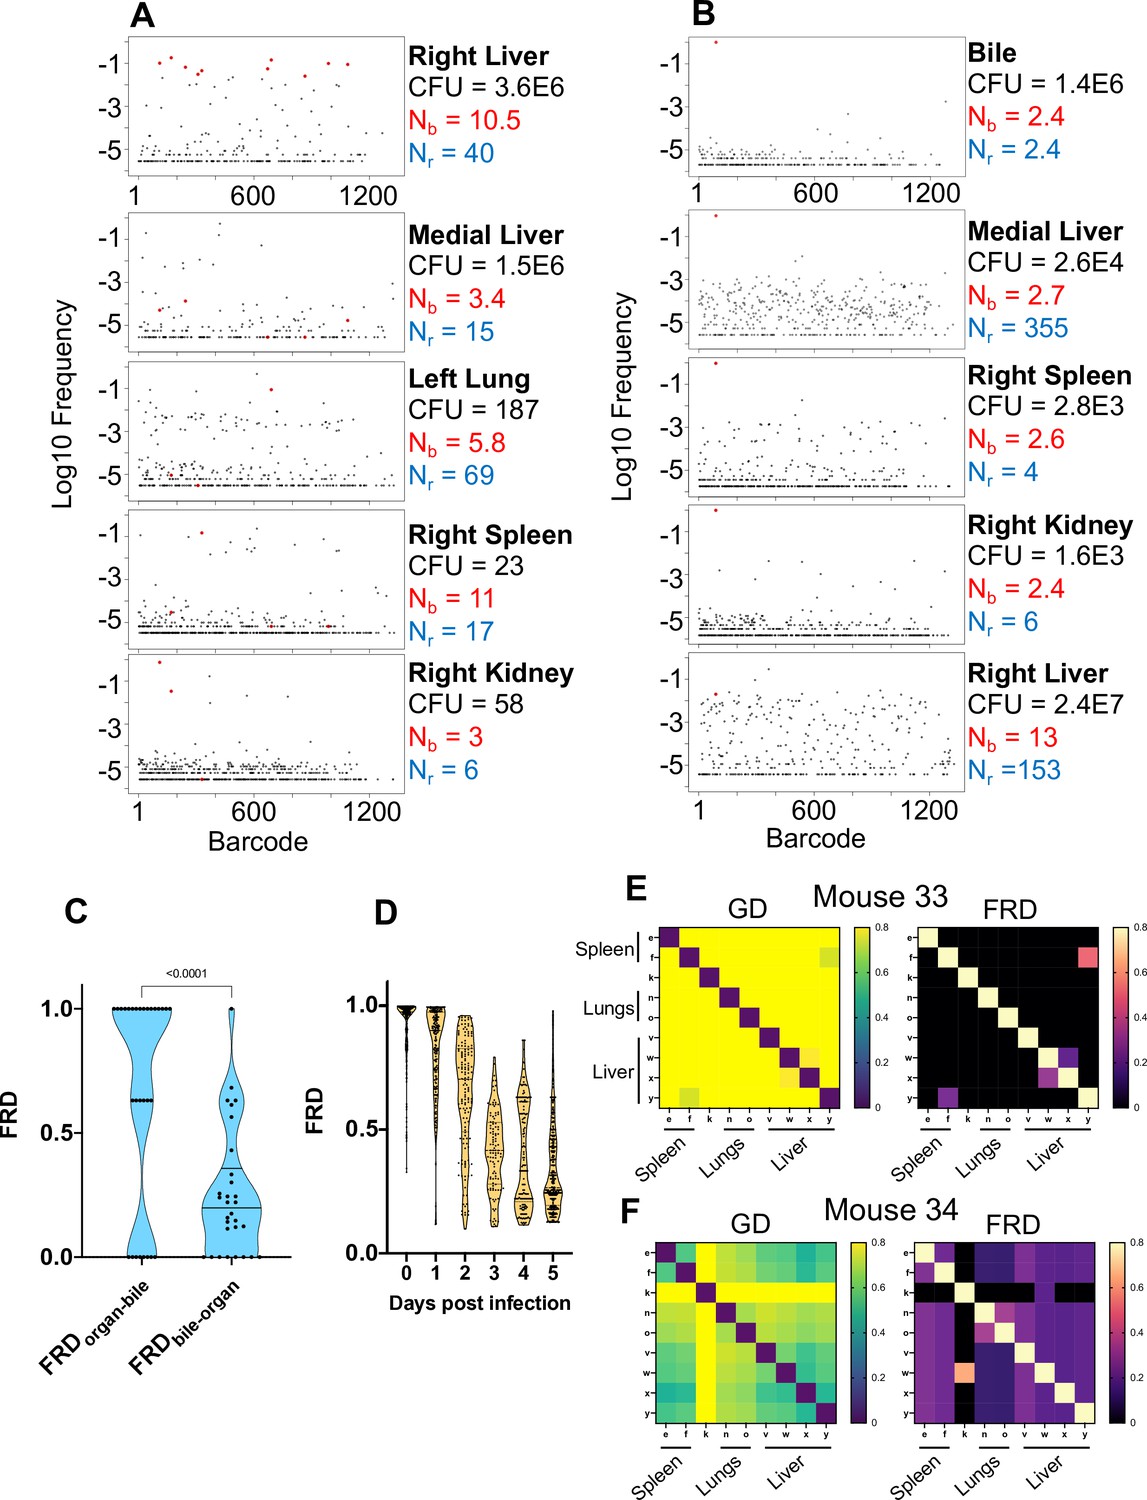
Visualizing dissemination patterns.
(A) Barcode frequency distribution from the right lobe of the liver in a single animal (mouse 24) is shown. This lobe harbored an abscess, which is reflected in the large bacterial burden. The top 10 barcodes are highlighted in red and identified in the four organs below. The relative absence of these dominant barcodes in the other organs reveals that the clones in the abscess did not substantially disseminate to other organs. GD and FRD values resulting from these comparisons are shown in Figure 3—figure supplement 6. Nr and Nb values are shown adjacent to each sample. (B) Same as (A) but where the top barcode frequency distribution is from the bile of mouse 20. The most dominant clone is highlighted in red and identified in other organs below. This clone is also dominant in other organs with the exception of the right lobe of the liver, where the clones within an abscess are dominant. (C) FRD values resulting from organ comparisons with the bile in all animals with bile CFU (mice 17, 20, and 31). Significantly lower FRD values (Mann–Whitney) when the non-bile organ is set to the reference (FRDbile-organ) reveal that the non-bile organ harbors a more substantial nontransferred population, particularly exemplified by liver samples in panel (B). (D) FRD values for all organs, omitting FRD values of 0 (no detectable relatedness) and 1 (self-organ comparisons). This panel summarizes and quantifies the increasingly purple colors observed across Figure 3—figure supplements 1–6. The significant decrease in FRD (Spearman’s r = –0.7, p<0.0001) indicates that relatedness becomes driven by fewer clones over time. (E, F) Heatmaps of GD (left) and FRD (right) are displayed for mouse 33 (C) and mouse 34 (D). Lower GD values in mouse 34 indicate substantially more sharing of bacteria than in mouse 33. Low FRD values across all organs in mouse 34 reveal that only a few barcodes (i.e., clones) are being shared. FRD = 0 for most organs in mouse 33 because no clones are shared. In (E, F), organs displayed are the right spleen (e), left spleen (f), left kidney (k), right lung (n), left lung (o), caudate liver (v), right liver (w), left liver (x), and medial liver (y). Column names in FRD heatmaps represent the organ used as the reference. Heatmaps for all mice and all time points are shown in Figure 3—figure supplements 1–6.
Figure 3—figure supplement 1
Genetic distance (GD) and fractional resilient genetic distance (FRD) 4 hr post infection (hpi) (0 day post infection [dpi]).
GD heatmaps are shown on the left, and FRD heatmaps are shown on the right. Column names for FRD correspond to the reference sample. Organ codes are blood (a), bile (b), right spleen (e), left spleen (f), right kidney (j), left kidney (k), right lung (n), left lung (o), caudate liver (v), right liver (w), left liver (x), and medial liver (y). In these animals, low GD values are reflective of their very high Nb values as all samples are closely related to the inoculum. This is consistent with high FRD values.
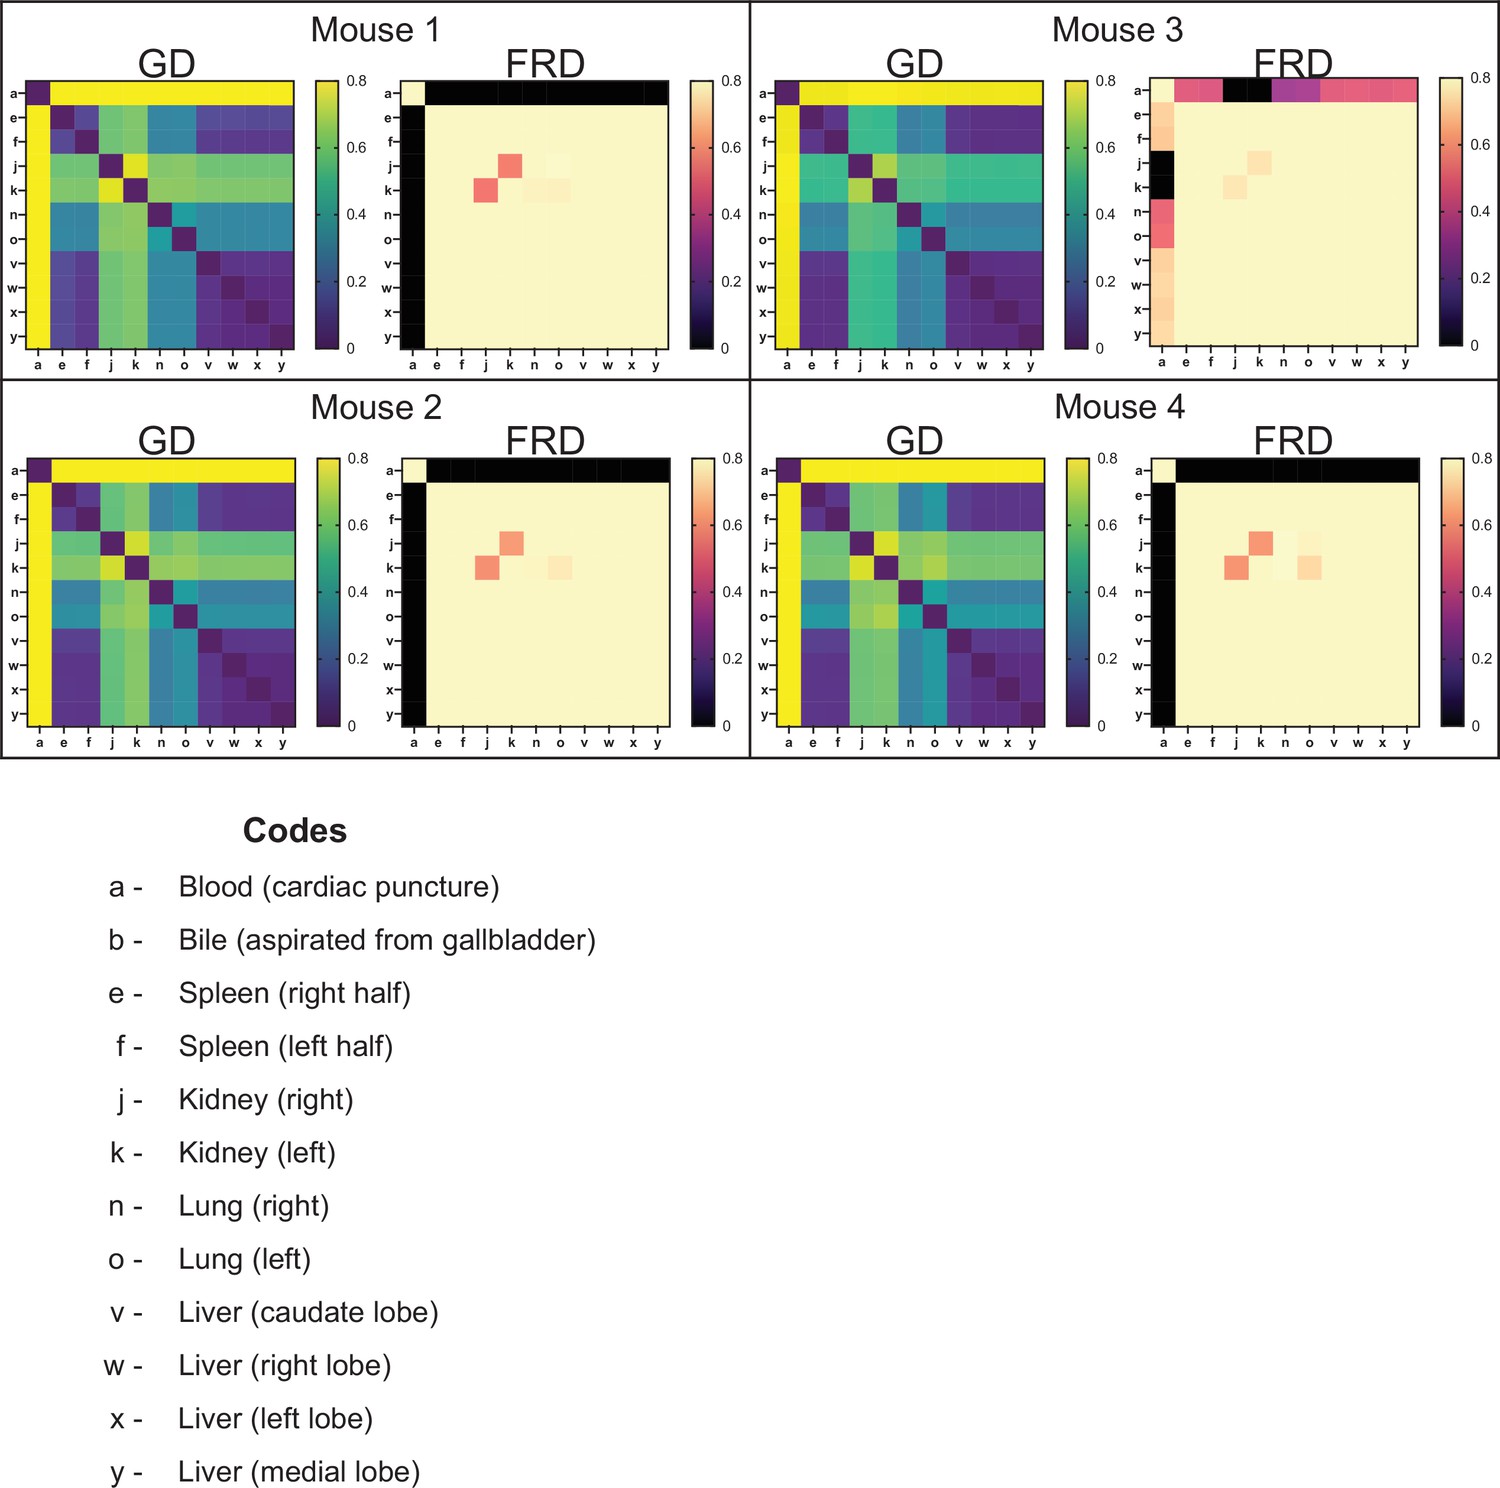
Figure 3—figure supplement 2
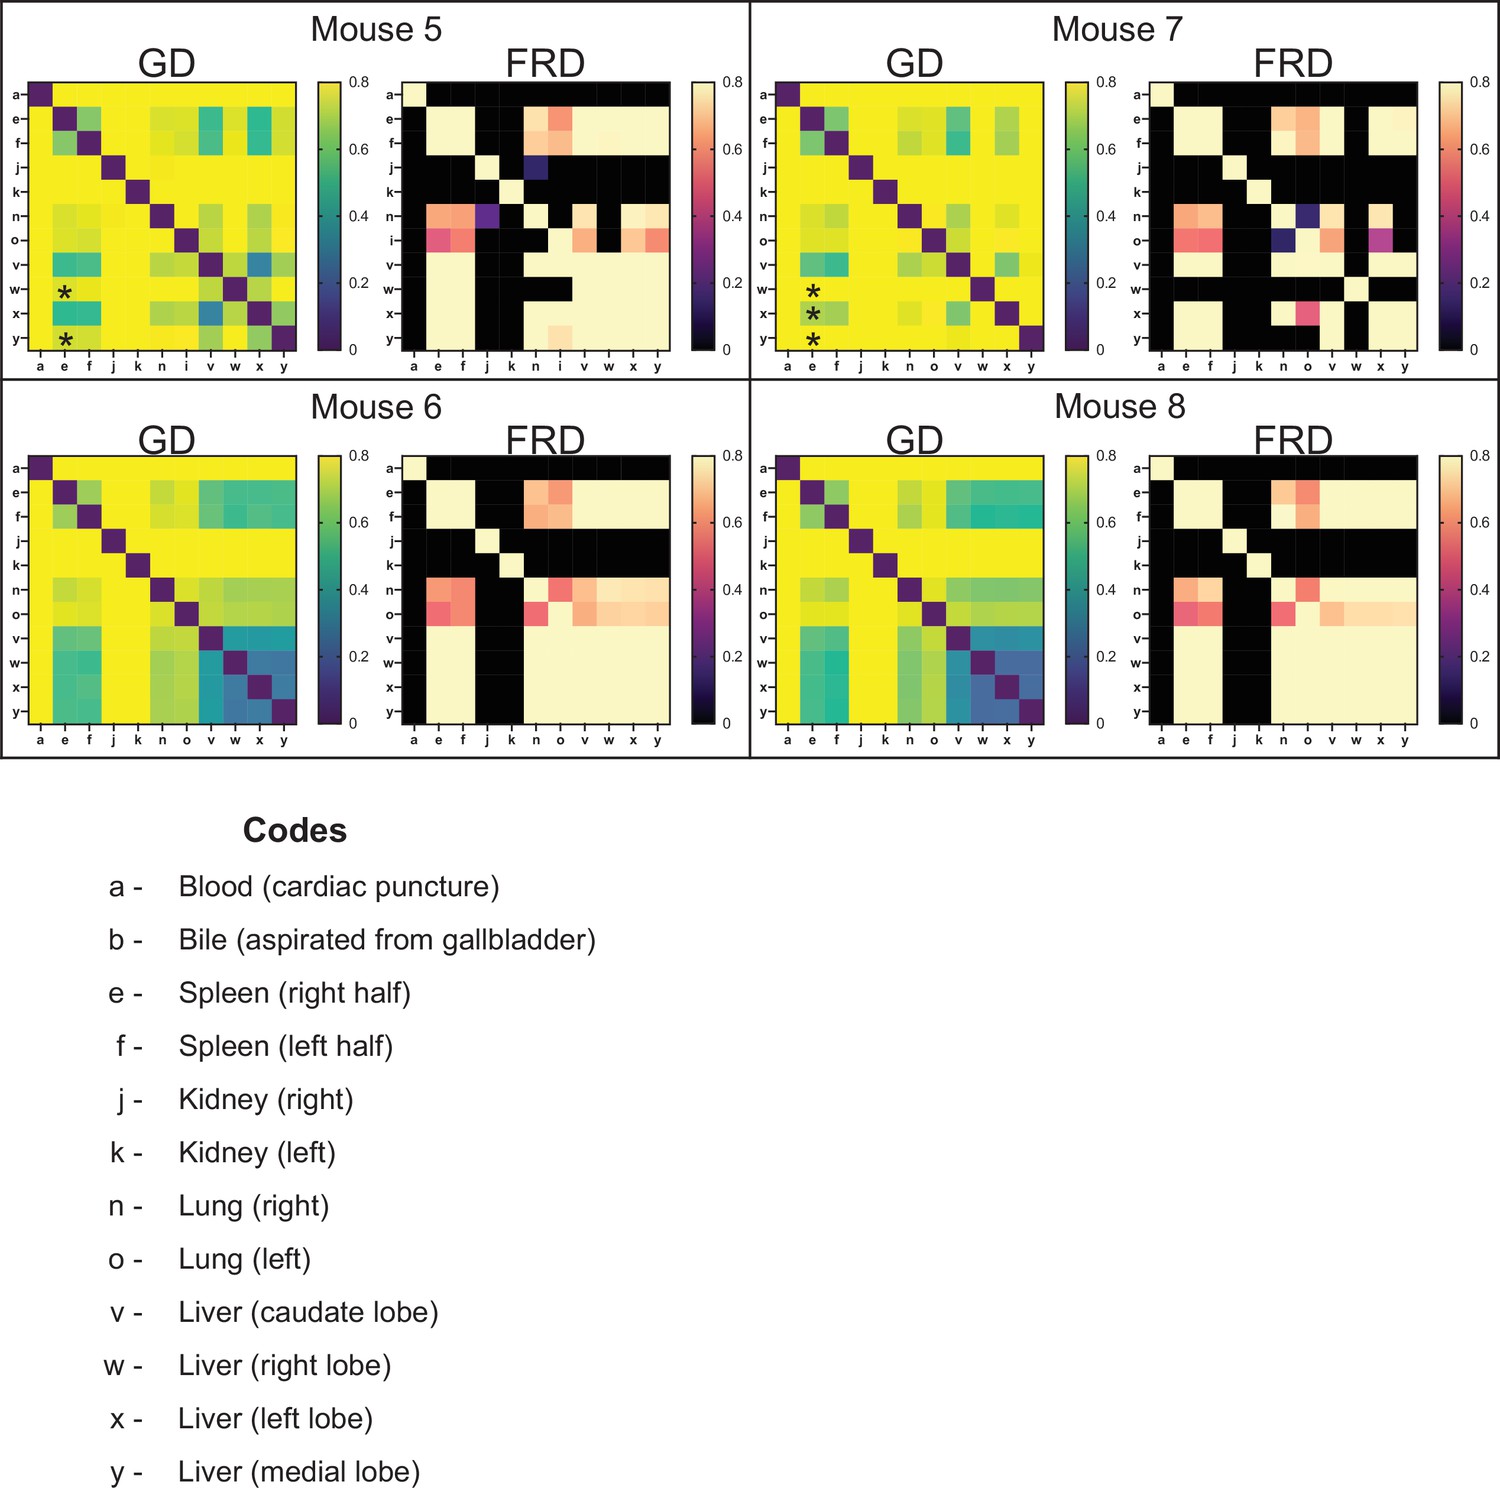
Genetic distance (GD) and fractional resilient genetic distance (FRD) 1 day post infection (dpi).
GD heatmaps are shown on the left, and FRD heatmaps are shown on the right. Column names for FRD correspond to the reference sample. Organ codes are blood (a), bile (b), right spleen (e), left spleen (f), right kidney (j), left kidney (k), right lung (n), left lung (o), caudate liver (v), right liver (w), left liver (x), and medial liver (y). By 1 dpi, populations in highly bottlenecked samples are largely unrelated to each other. The spleen and liver still possess modestly diverse populations and therefore have lower GD values. The ‘checkerboarding’ effect in the liver samples (v, w, x, y: bottom right) of mice 5 and 7 is due to expanded clones in the liver that increase genetic distance across all samples (asterisks). The FRD metric was in part designed to detect these events as comparisons with samples possessing clonal expansion events yielded both high GD and FRD, indicating that the underlying population is similar and diverse. The single exception was observed in the right lobe of mouse 7. The clonal expansion in this sample was so profound that the underlying population is indistinguishable from noise (see Figure 2).
Figure 3—figure supplement 3
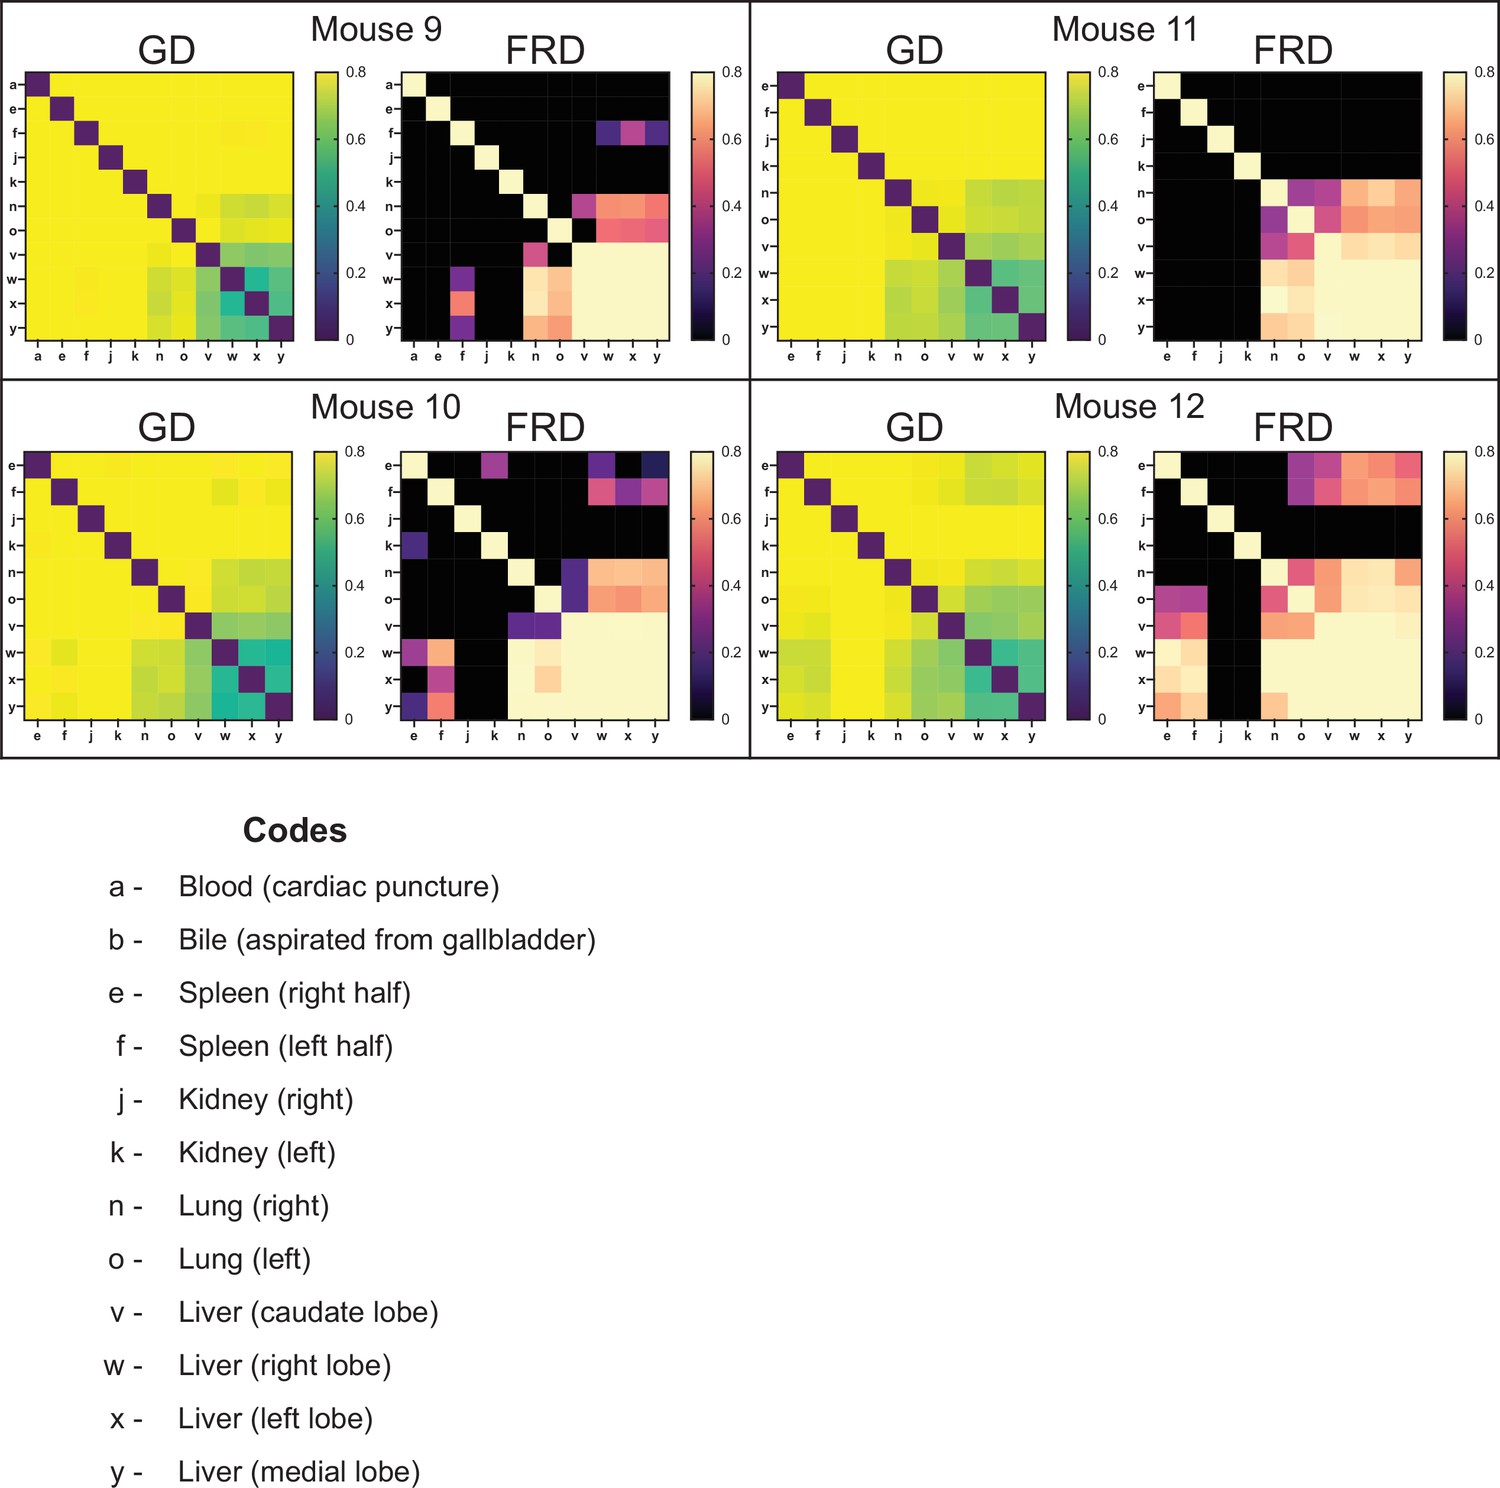
Genetic distance (GD) and fractional resilient genetic distance (FRD) 2 days post infection (dpi).
GD heatmaps are shown on the left, and FRD heatmaps are shown on the right. Column names for FRD correspond to the reference sample. Organ codes are blood (a), bile (b), right spleen (e), left spleen (f), right kidney (j), left kidney (k), right lung (n), left lung (o), caudate liver (v), right liver (w), left liver (x), and medial liver (y). Most organs are now highly divergent (high GD), apart from the liver, where adjacent lobes share many tags and are diverse.
Figure 3—figure supplement 4
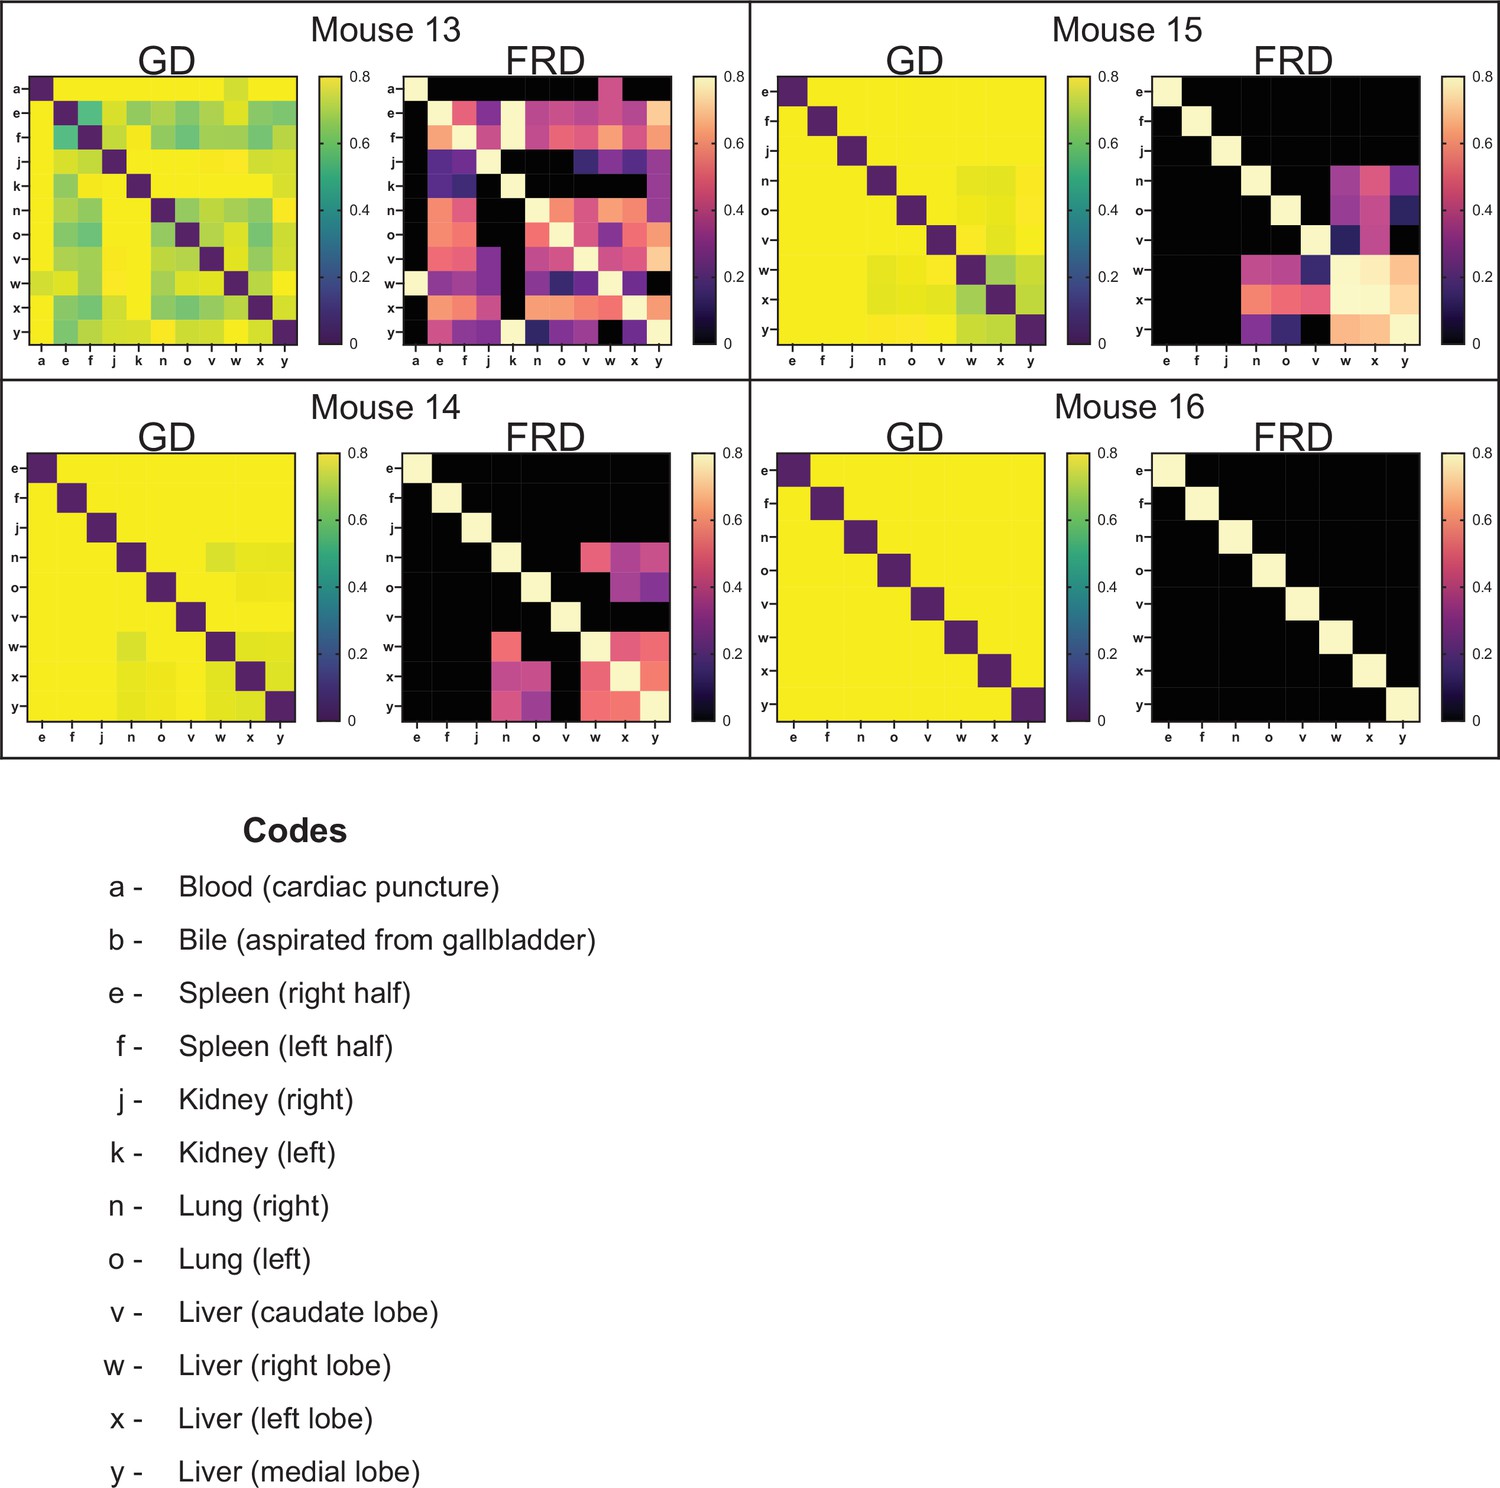
Genetic distance (GD) and fractional resilient genetic distance (FRD) 3 days post infection (dpi).
GD heatmaps are shown on the left, and FRD heatmaps are shown on the right. Column names for FRD correspond to the reference sample. Organ codes are blood (a), bile (b), right spleen (e), left spleen (f), right kidney (j), left kidney (k), right lung (n), left lung (o), caudate liver (v), right liver (w), left liver (x), and medial liver (y). Relatedness between all organs has substantially decreased. Mouse 16 is the first animal where there is essentially no similarity between liver lobes, indicating that by 3 dpi clearance has completely segregated suborgan populations. The checkerboarding in mouse 13 is due to transferred clones. Moderate FRD values indicate that transferred populations comprise multiple clones, although underlying nontransferred populations are present as well.
Figure 3—figure supplement 5
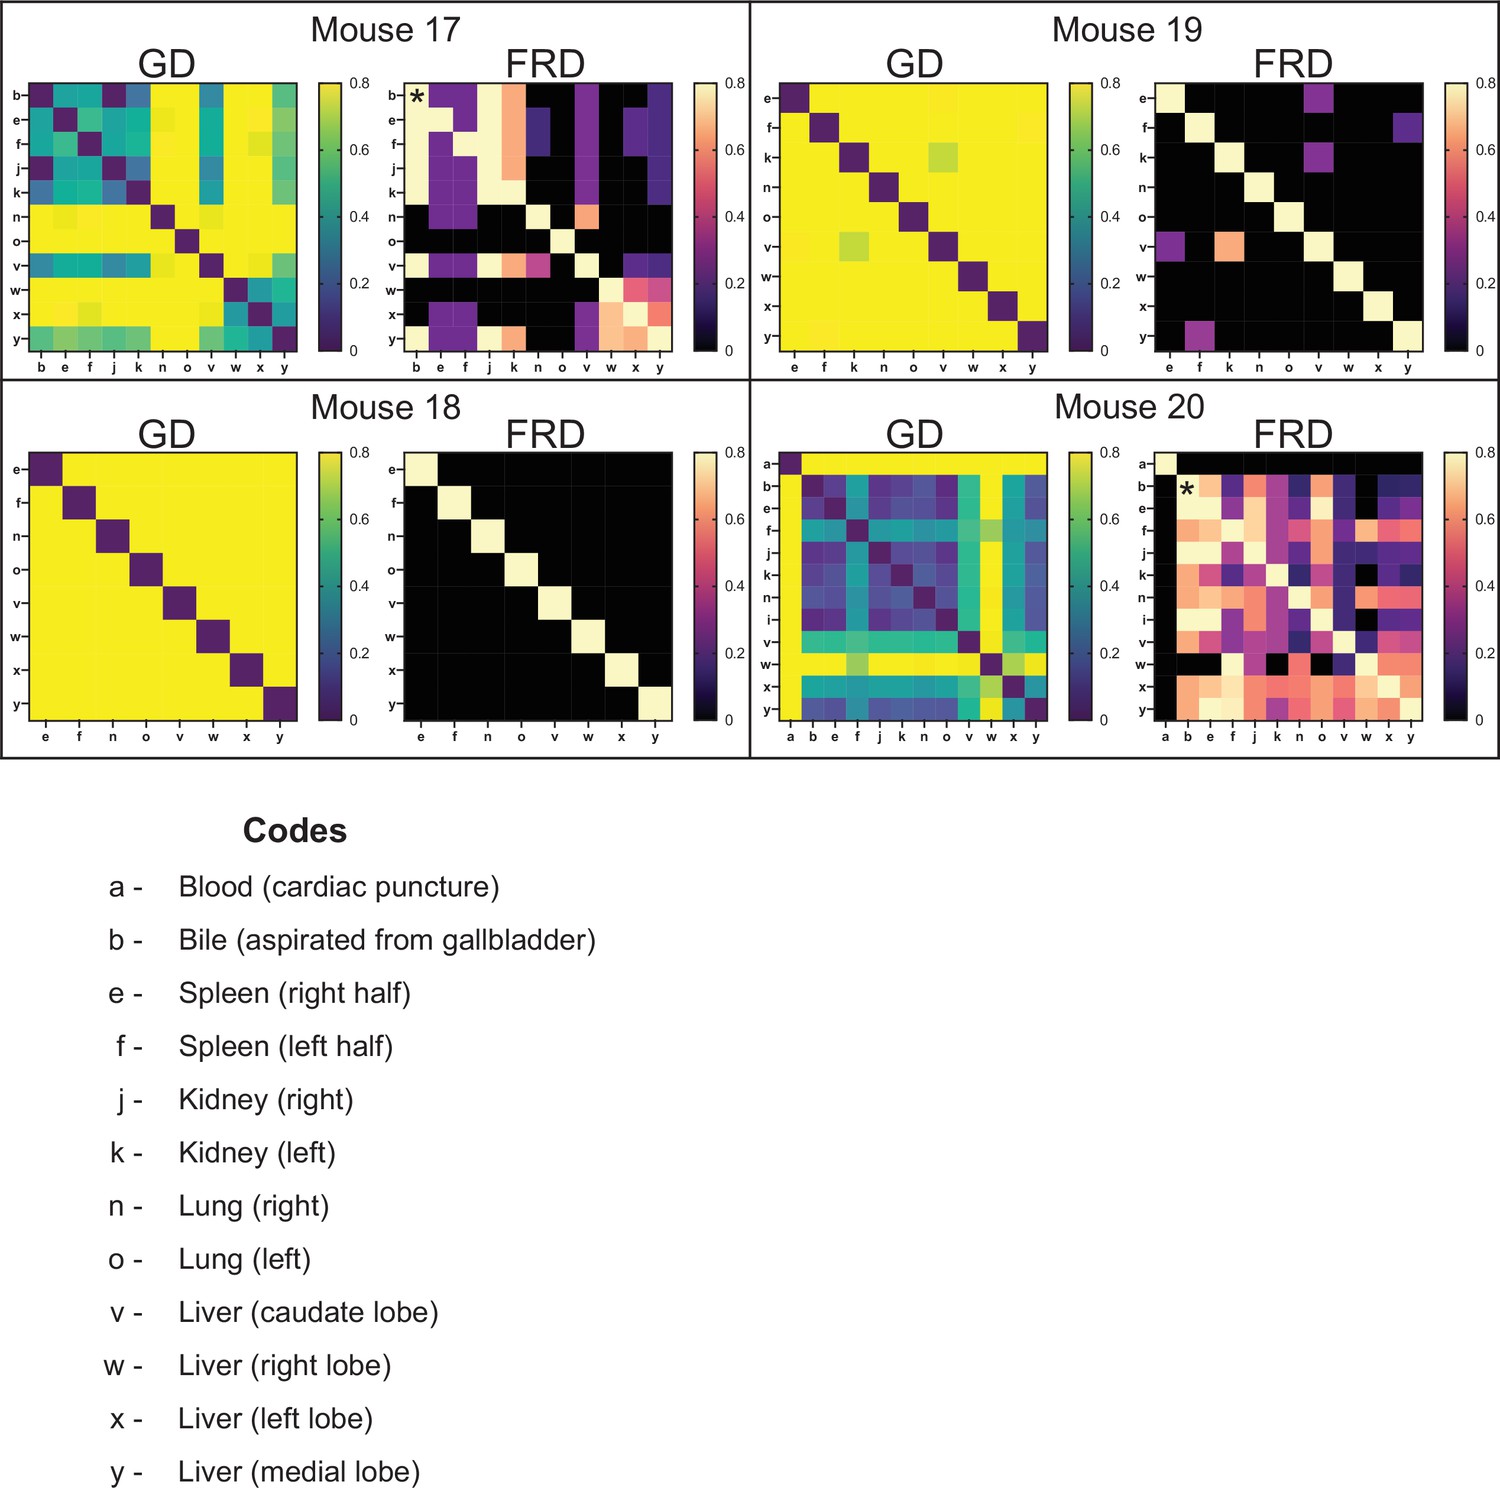
Genetic distance (GD) and fractional resilient genetic distance (FRD) 4 days post infection (dpi).
GD heatmaps are shown on the left, and FRD heatmaps are shown on the right. Column names for FRD correspond to the reference sample. Organ codes are blood (a), bile (b), right spleen (e), left spleen (f), right kidney (j), left kidney (k), right lung (n), left lung (o), caudate liver (v), right liver (w), left liver (x), and medial liver (y). A clear dichotomy is observed between mice 18 and 19 versus mice 17 and 20. Mice 17 and 20 had substantial replication of bacteria in the bile. This clone spread across the body, indicated by low GD values in multiple organs. FRD values reflect the fact that the bile is a single clone. Starting at the asterisk, rightward movement on the FRD heatmap yields lower nonzero FRD values than downward movement. This indicates that when the non-bile organ is set as the reference, FRD values are low, revealing that only a few barcodes are shared. When the bile is set as the reference, FRD values are much higher, indicating that the shared clones represent a larger fraction of barcodes in the bile. This is quantified in Figure 3C. Given that the Nr of bile is ~1, low GD values are due to essentially a single clone.
Figure 3—figure supplement 6
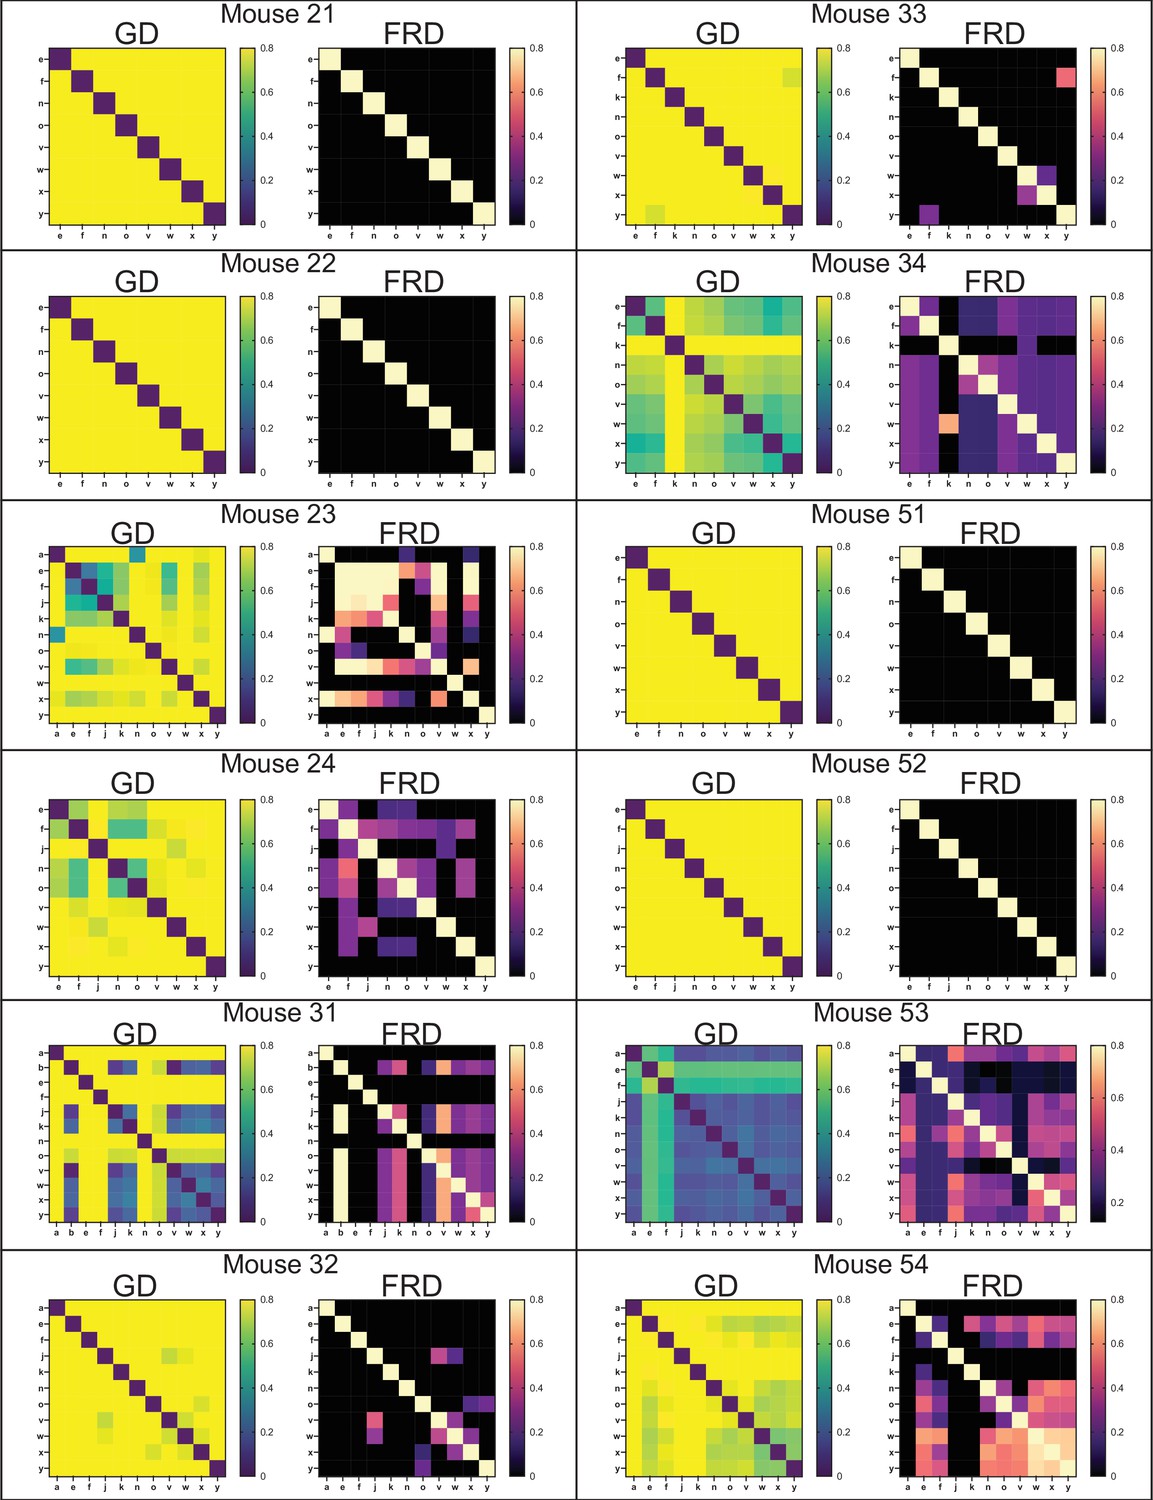
Genetic distance (GD) and fractional resilient genetic distance (FRD) 5 days post infection (dpi).
GD heatmaps are shown on the left, and FRD heatmaps are shown on the right. Column names for FRD correspond to the reference sample. Organ codes are blood (a), bile (b), right spleen (e), left spleen (f), right kidney (j), left kidney (k), right lung (n), left lung (o), caudate liver (v), right liver (w), left liver (x), and medial liver (y). Mice 23, 24, 32, 33, and 52 had abscesses in at least one lobe of the liver. Mouse 31 had a clone apparently disseminated from bile. Mouse 53 had much higher blood CFU than others in the cohort. Note that most instances of sharing correspond to low FRD values, indicating that sharing is due to very few barcodes. A notable exception is the splenic samples of mouse 23, which are represented in Figure 2.
Figure 4
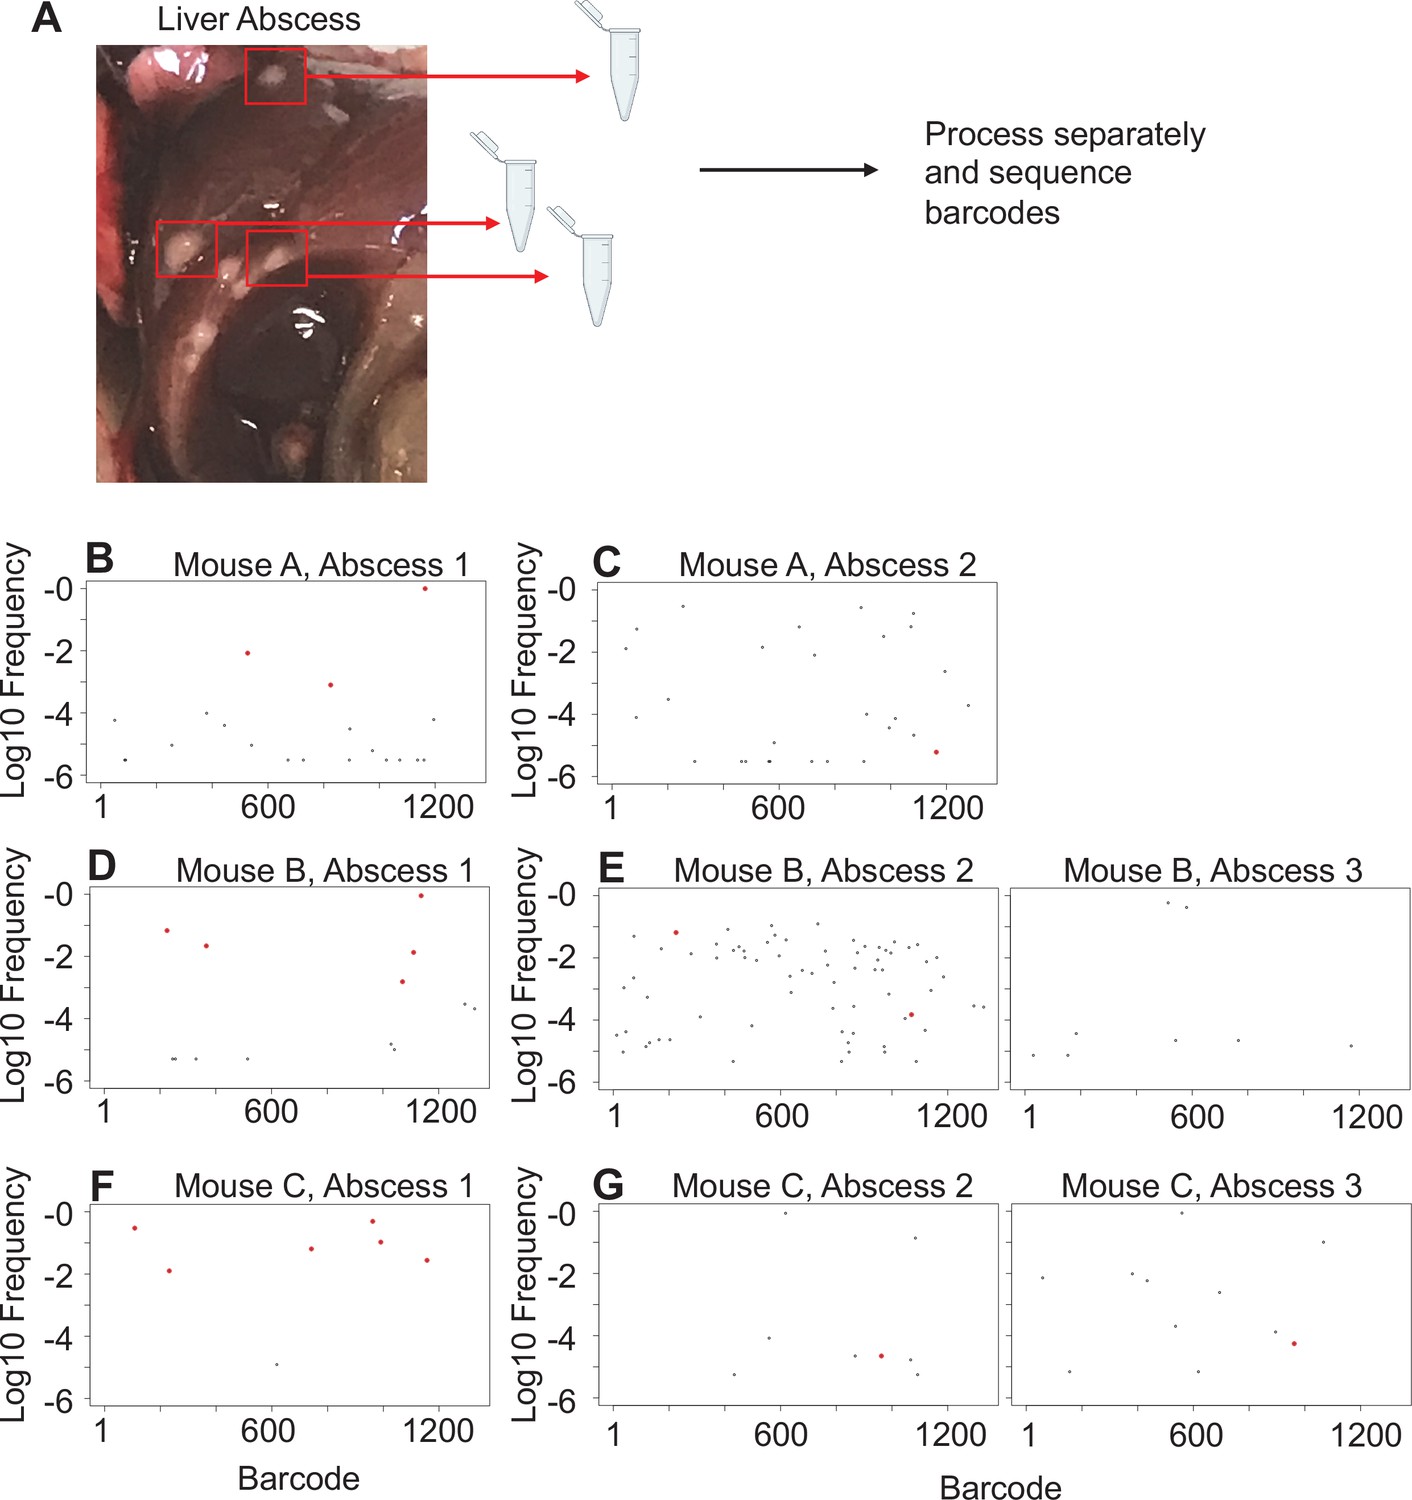
Liver abscesses arise from distinct bacterial populations.
(A) A schematic of the experimental setup is shown. Single abscesses were dissected and separately processed for analysis of barcode frequencies to determine if abscesses in the same animal arose from similar or distinct populations. The panels on the left (B, D, F), where dominant barcodes are highlighted in red, correspond to the reference for the graphs on the right (C, E, G). These barcodes are then identified on the panels on the right (C, E, G). Very few dominant red barcodes in (C), (E), and (G) indicate that populations within individual abscesses are distinct.
Figure 5
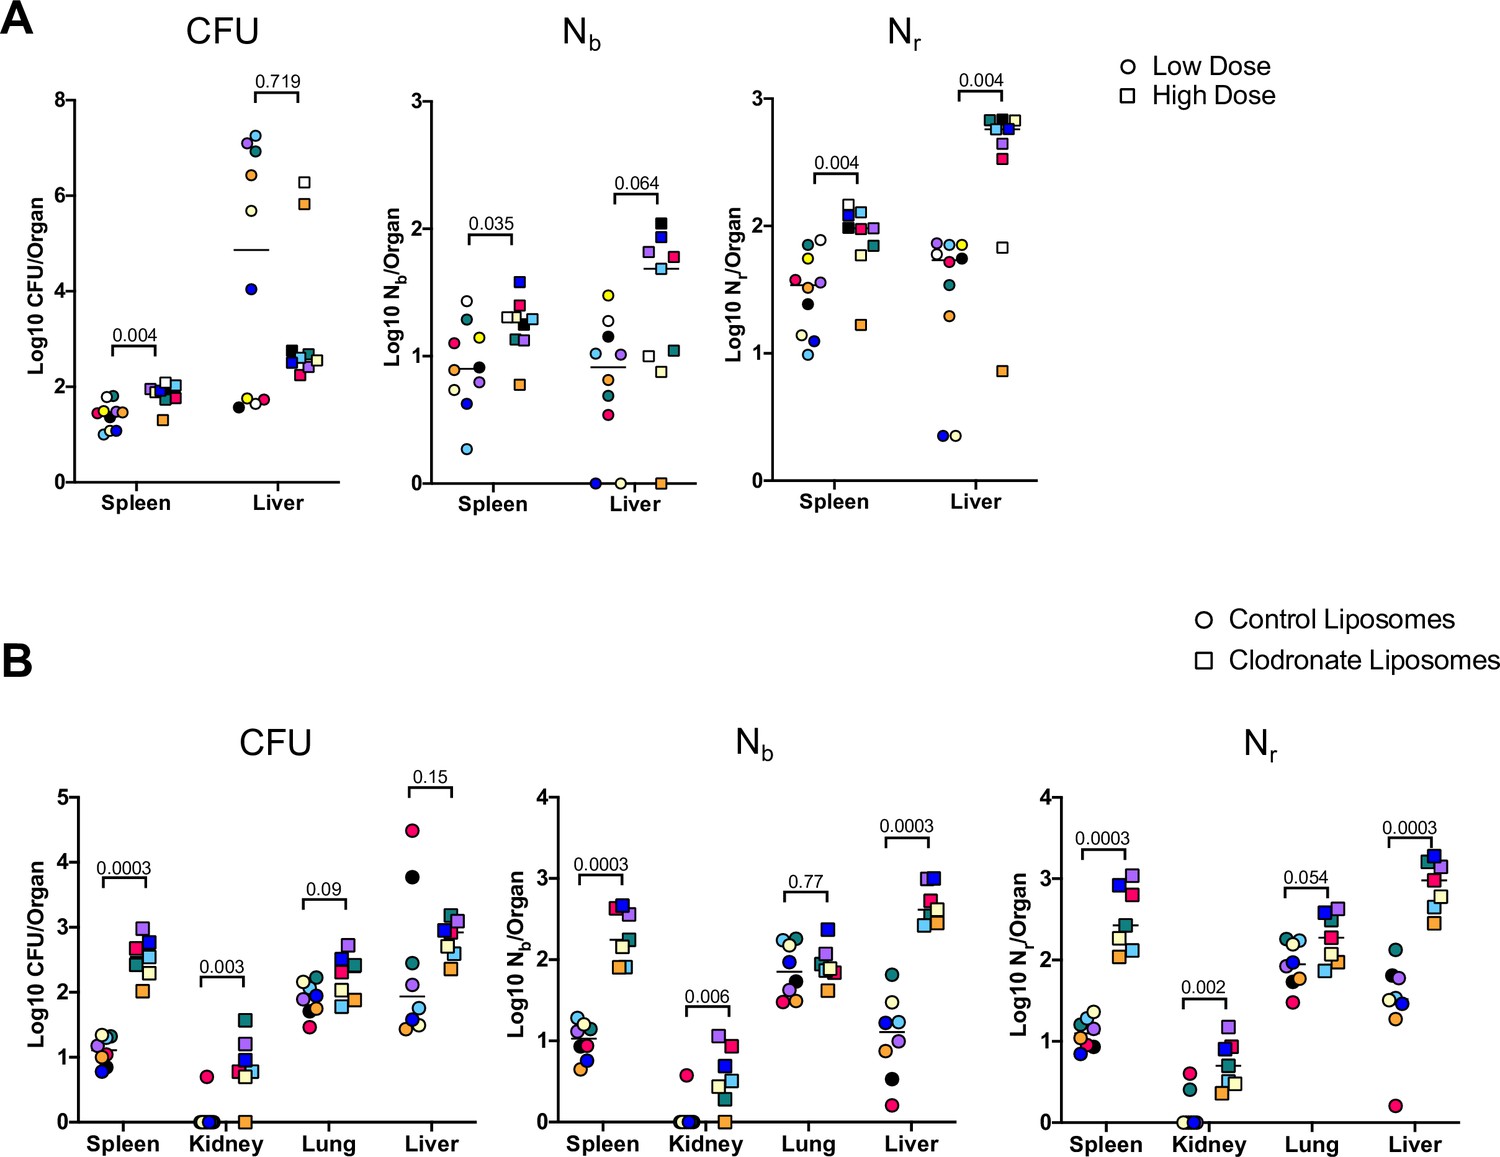
Inoculum size and macrophages regulate bottleneck sizes.
(A) CFU, Nb, and Nr values from mice given a low (~5E6, circles) and high (~2E7, squares) dose of extraintestinal pathogenic Escherichia coli (ExPEC) intravenously (i.v.) 5 days post infection (dpi). Note that all measurements in the spleen were significantly higher in mice inoculated with a higher dose, but only Nr, not CFU, was significantly greater in the liver. Low founding population (FP) values with high CFU indicate that a few clones replicated substantially. Points with the same color and shape are derived from the same animal. (B) CFU, Nb, and Nr values from mice treated with control liposomes (circles) or clodronate-containing liposomes (squares). CFU is significantly increased in the spleen and kidneys, but not the lung and liver. FP is significantly greater after clodronate treatment in the liver. Points with the same shape and color are from the same animal. The two animals with high CFU in the liver result from the expansion of very few clones (high CFU, low FP). Statistical significance for each comparison represents q-values from multiple Mann–Whitney tests.
Figure 6 with 1 supplement
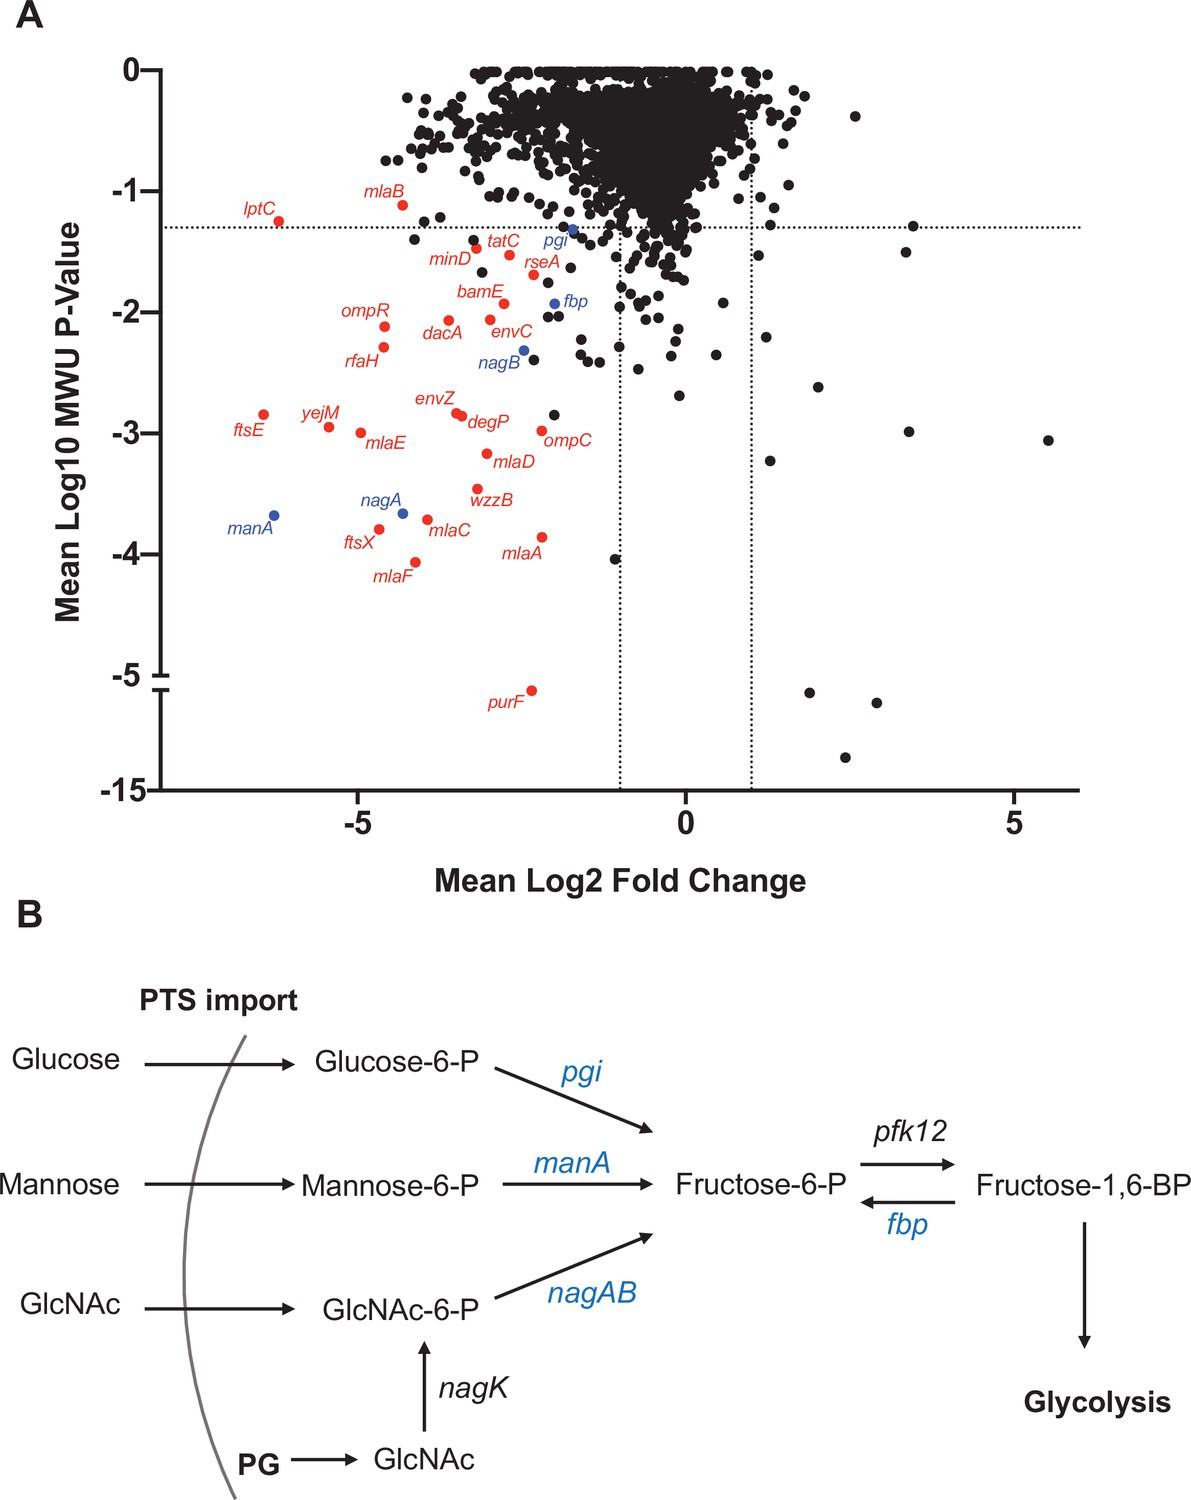
Genes that promote extraintestinal pathogenic Escherichia coli (ExPEC) survival in the liver.
(A) Inverse volcano plot of fitness of ExPEC genes in the liver. Genes shown in red are involved in cell envelope homeostasis, and genes shown in blue are involved in generating fructose-6-phosphate, and their roles are schematized in (B). (B) Pathways to convert sugars to fructose-6-phosphate. GlcNAc generated from peptidoglycan (PG) degradation is converted to GlcNaC-6P by nagK, which is not among the underrepresented genes in (A).
Figure 6—figure supplement 1
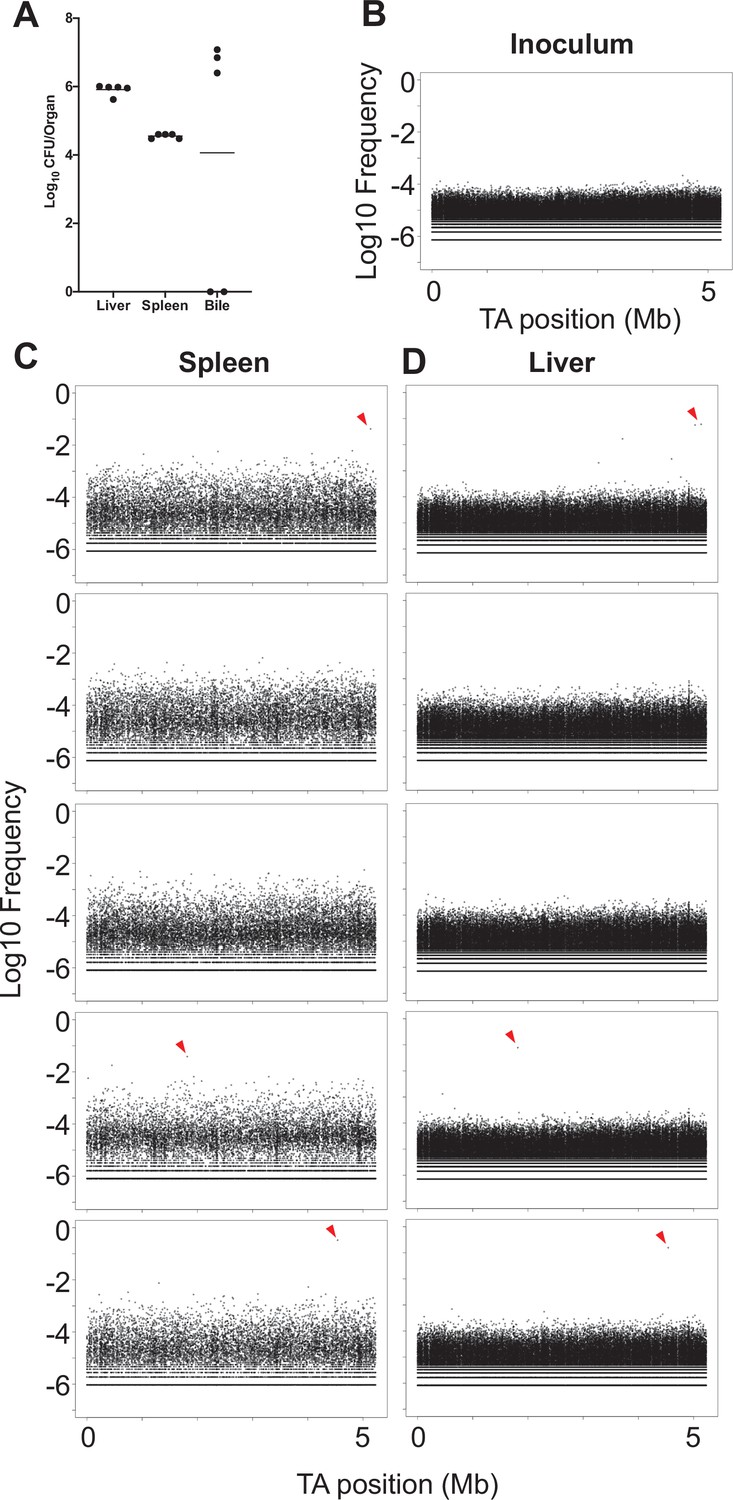
CFU and population structure from in vivo transposon mutant screen.
(A) Bacterial burdens for the liver, spleen, and bile are shown for animals sacrificed 1 day post infection (dpi) following inoculation of the transposon library. The three animals with bile CFU correspond to the three animals where spreading of clones between the liver and spleen was observed (C, D). (B–D) Frequencies of mutants (analogous to barcodes) are shown as a function of genome position. Mutants are relatively evenly represented in the inoculum (B). (C, D) Distributions from the livers and spleens from five animals. Three animals possessed marked expansion of a single mutant that spread between the liver and spleen (red triangles).
Figure 7 with 1 supplement
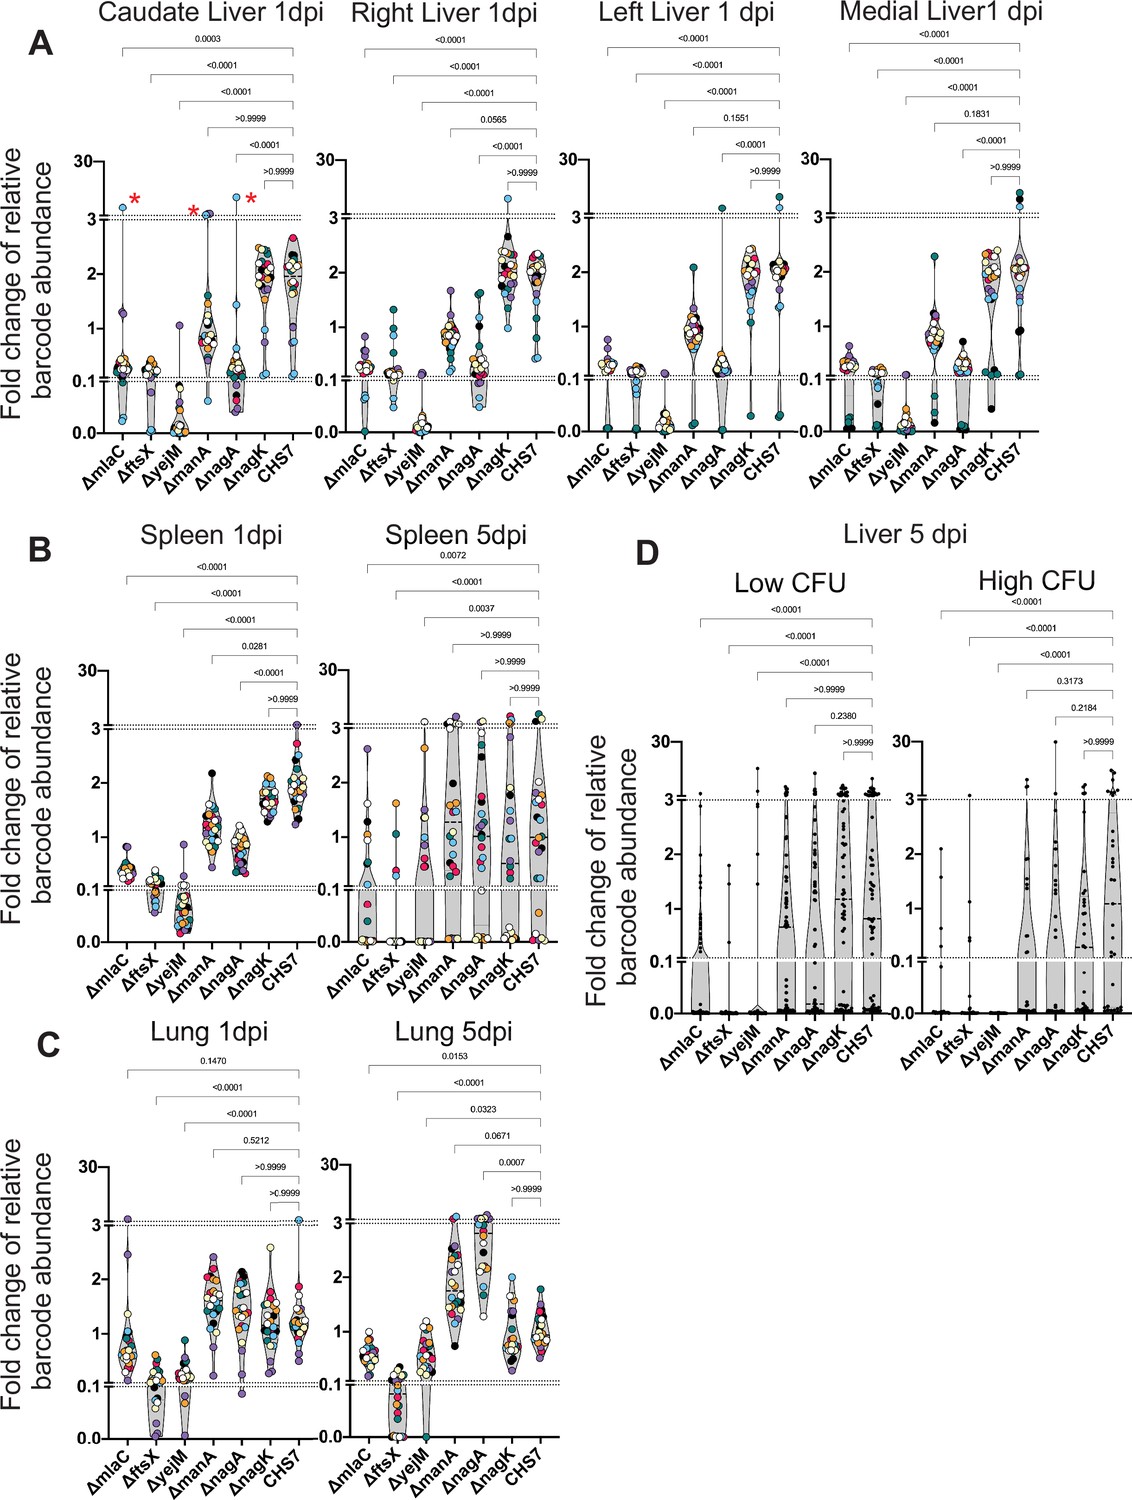
Distinct genetic requirements for extraintestinal pathogenic Escherichia coli (ExPEC) survival/growth across organs and time.
(A) Changes in barcode frequencies for WT and six mutants after coinfection are shown for liver 1 day post infection (dpi). Red asterisks represent an example of clonal expansion. (B, C) same as (A) for spleen (B) and lungs (C) 1 and 5 dpi. (D) Same as (A–C) but for liver samples 5 dpi, separated into lobes with or without abscesses. Figure 7—figure supplement 1 displays this data separated by lobe, in addition to data from the kidneys. Within each graph, points with the same color were derived from the same animal. Each strain is represented by three barcodes, so within each graph, each color is represented 21 times. Dotted lines depict breaks in the y-axis that are useful to visualize the influence of clonal expansion. p-Values (Dunn’s multiple comparisons test) are shown relative to the WT.
Figure 7—figure supplement 1
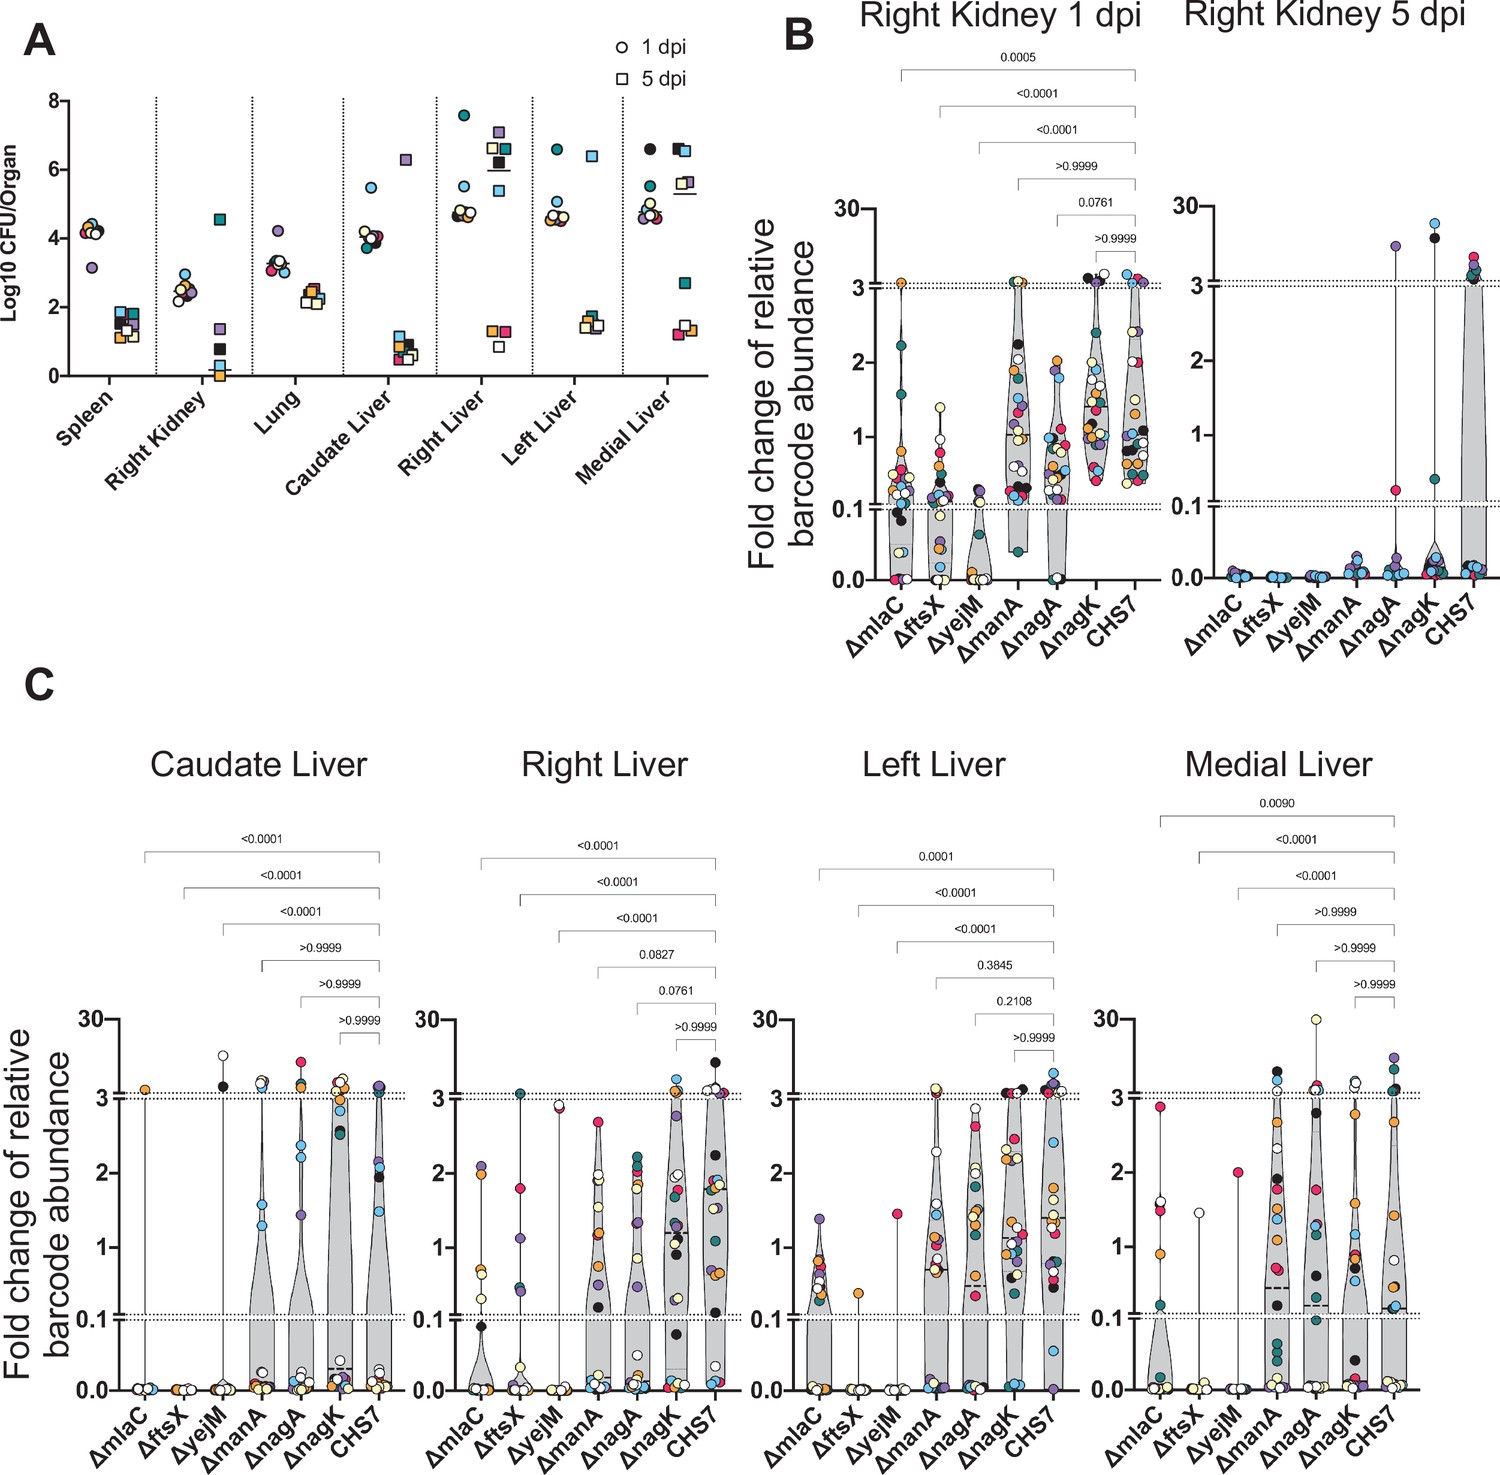
CFU and additional organs from Figure 7.
(A) Bacterial burdens from the spleen, right kidney, lungs, and all four lobes of the liver are shown for 1 days post infection (dpi) and 5 dpi of the barcoded mutant library. High CFU in the liver 5 dpi corresponded to animals with abscesses. Points with the same color and shape were obtained from the same animal. (B) Fold change of barcode abundance of strains in the kidney is shown for 1 dpi (left) and 5 dpi (right). Too few samples were obtained from 5 dpi kidney samples for analysis. (C) Same as (B) but for lobes of the liver 5 dpi; note that this graph separates mutant fitness by liver lobe rather than the presence or absence of liver abscesses, as done in Figure 7. p-Values were obtained by Dunn’s multiple comparisons test.
Figure 8
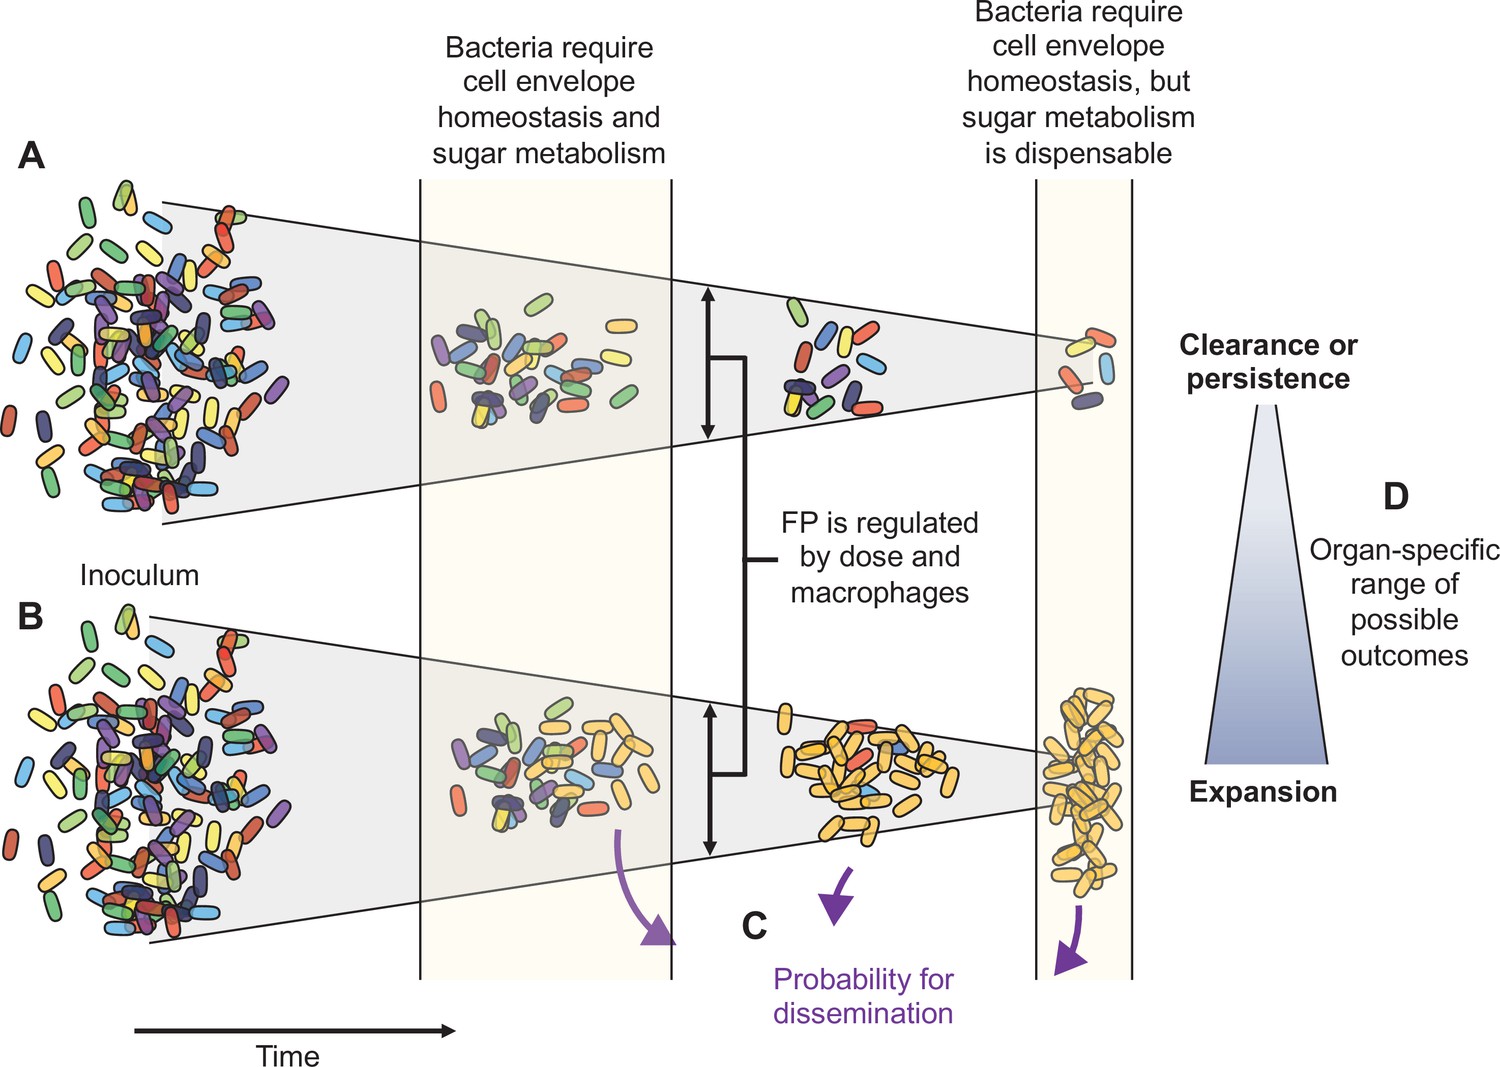
Schematic summary of key findings.
(A) and (B) schematize the most distinct trajectories of extraintestinal pathogenic Escherichia coli (ExPEC) population dynamics identified – one where bacteria are nearly cleared (A) and one where they expand clonally (B). Additional intermediate categories are also observed when clonally expanded populations disseminate systemically and alter bacterial burdens and population structure in distal organs (C). The probability of dissemination depends on the organ where clonal expansion occurred (D); for example, there was a much larger likelihood of disseminating when there was clonal expansion evident in bile versus from the liver. Every animal displays a unique pattern of expansion and dissemination.
Additional files
-
Supplementary file 1
Genes identified by transposon insertion sequencing (TIS).
- https://cdn.elifesciences.org/articles/70910/elife-70910-supp1-v2.xlsx
-
Supplementary file 2
Strains and plasmids.
- https://cdn.elifesciences.org/articles/70910/elife-70910-supp2-v2.xlsx
-
Supplementary file 3
Oligonucleotides.
- https://cdn.elifesciences.org/articles/70910/elife-70910-supp3-v2.xlsx
-
Transparent reporting form
- https://cdn.elifesciences.org/articles/70910/elife-70910-transrepform1-v2.docx
Download links
A two-part list of links to download the article, or parts of the article, in various formats.
Downloads (link to download the article as PDF)
Open citations (links to open the citations from this article in various online reference manager services)
Cite this article (links to download the citations from this article in formats compatible with various reference manager tools)
Pathogen clonal expansion underlies multiorgan dissemination and organ-specific outcomes during murine systemic infection
eLife 10:e70910.
https://doi.org/10.7554/eLife.70910


