Spatial tuning of face part representations within face-selective areas revealed by high-field fMRI
- Institute of Biophysics, Chinese Academy of Sciences, China
- University of Chinese Academy of Sciences, China
- Department of Psychology, University of Minnesota, United States
Figures
Figure 1
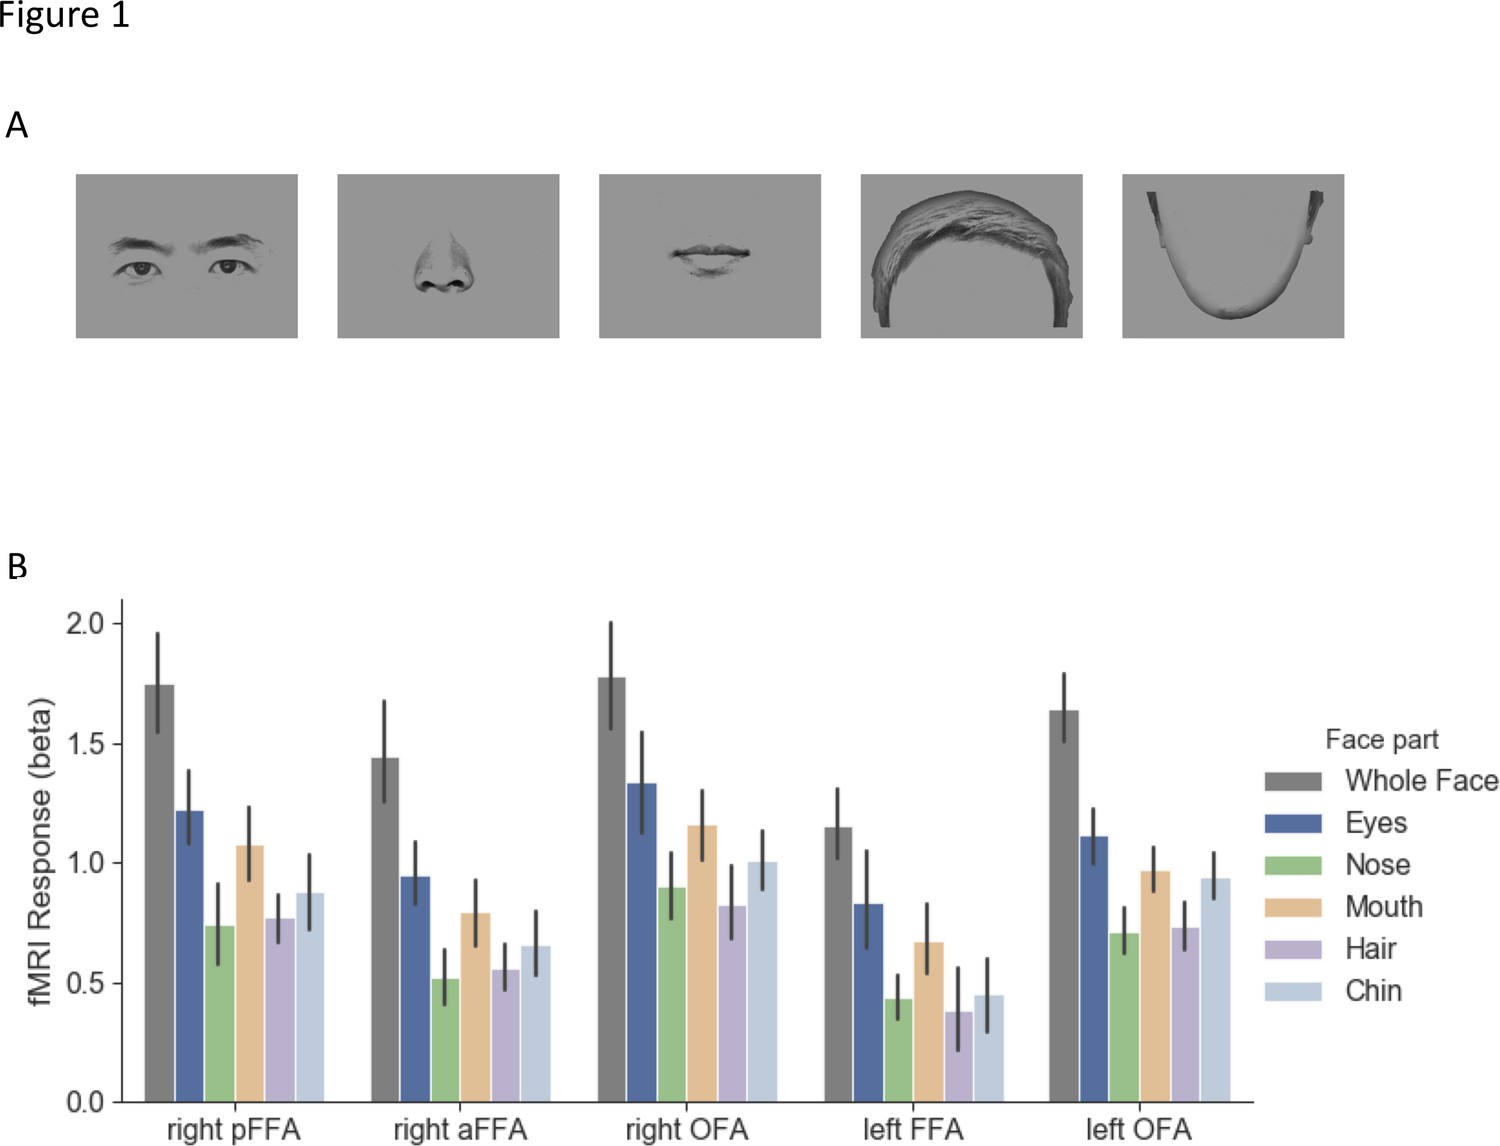
Stimuli and fMRI response maps.
(A) Exemplars of face part stimuli used in the main experiment. The face parts were generated from 20 male faces. Each stimulus was presented around the fixation and participants performed a one-back task during the scan. (B) Average fMRI responses to different face parts in each face-selective region. Generally, eyes elicited higher responses than responses to nose, hair, and chin in most of the regions. No significant difference was observed between eyes and mouth responses. Error bars reflect ±1 SEM.
Figure 2 with 1 supplement
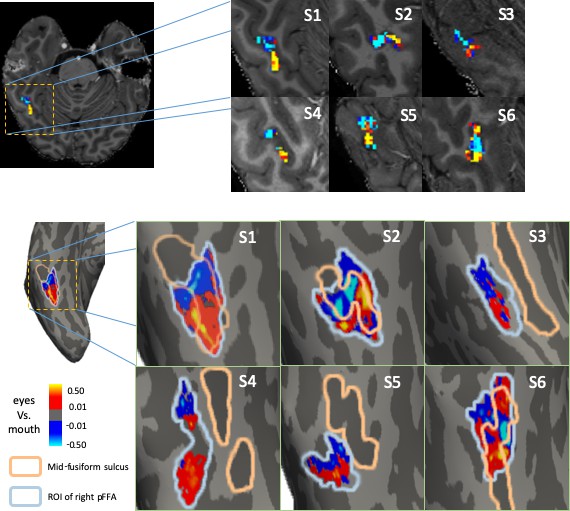
Contrast maps between normalized fMRI responses to eyes and mouth in the right pFFA illustrated in the volume (upper) or on inflated cortical surface (lower) of each participant.
On the surface, the mid-fusiform sulcus is shown in dark gray with orange outline. The blue line outlines the right pFFA identified with an independent localizer scan. Aligned with the direction of mid-fusiform sulcus, the posterior part of right pFFA shows response bias to eyes (warm colors), while the anterior part illustrates mouth bias (cool colors). The posterior to anterior pattern is generally consistent across participants.
Figure 2—figure supplement 1
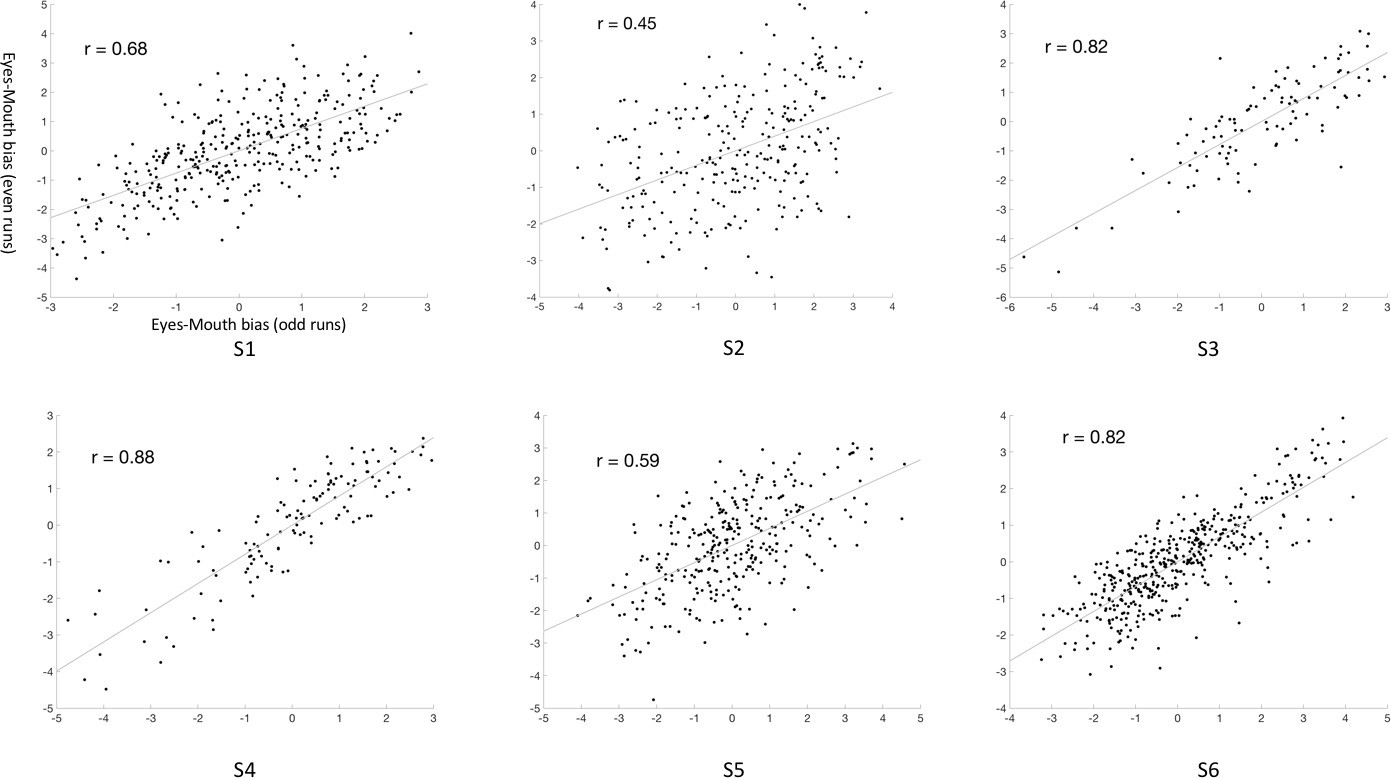
Correlation of eyes-mouth bias across voxels between split half data sets in the main experiment.
Each panel shows data from one participant.
Figure 3 with 3 supplements
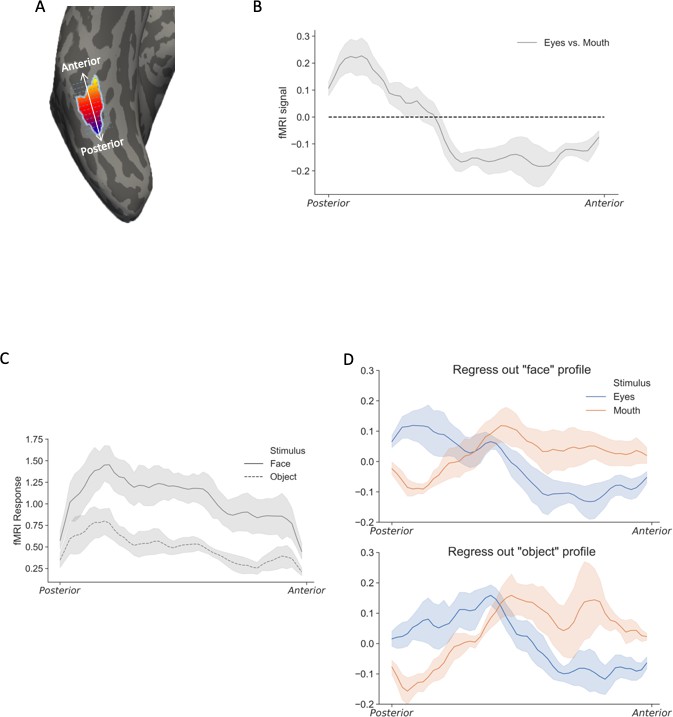
The spatial profiles of eyes and mouth responses along the posterior-anterior dimension.
(A) To obtain the one-dimensional spatial profile of fMRI responses, a line was drawn parallel to the direction of mid-fusiform sulcus. Response from each vertex in the right pFFA was projected to the closest point on the line and averaged to generate the response profile. (B) The response profile of eyes vs mouth on the anterior-posterior dimension in right pFFA. The shaded regions reflect ±1 SEM. (C) The spatial profiles of whole faces and everyday objects in the right pFFA. Both profiles showed similar patterns, though the whole face responses were generally higher than object responses. (D) The spatial profile of individual face part responses, after regressing out the general fMRI response patterns elicited by either the whole faces (upper) or everyday objects (lower). In both cases, distinct spatial profiles were observed between eyes and mouth in the right pFFA.
Figure 3—figure supplement 1

Stimuli and results of Control Experiment 1.
(A) Four conditions (i.e. single eye near peripheral, single eye near central, mouth near peripheral, mouth near central) were include in the Control Experiment 1. For the near peripheral conditions, eye or mouth were presented at 3.1° either to the left or to the right of the fixation. For the near central conditions, face parts were presented at 1.3° left or right to the fixation. (B) The contrast maps between eyes and mouth regardless of location in each participant, showing clear anterior-posterior trend. (C) The contrast maps of near peripheral vs. near central location regardless of face parts, no consistent pattern is observed.
Figure 3—figure supplement 2
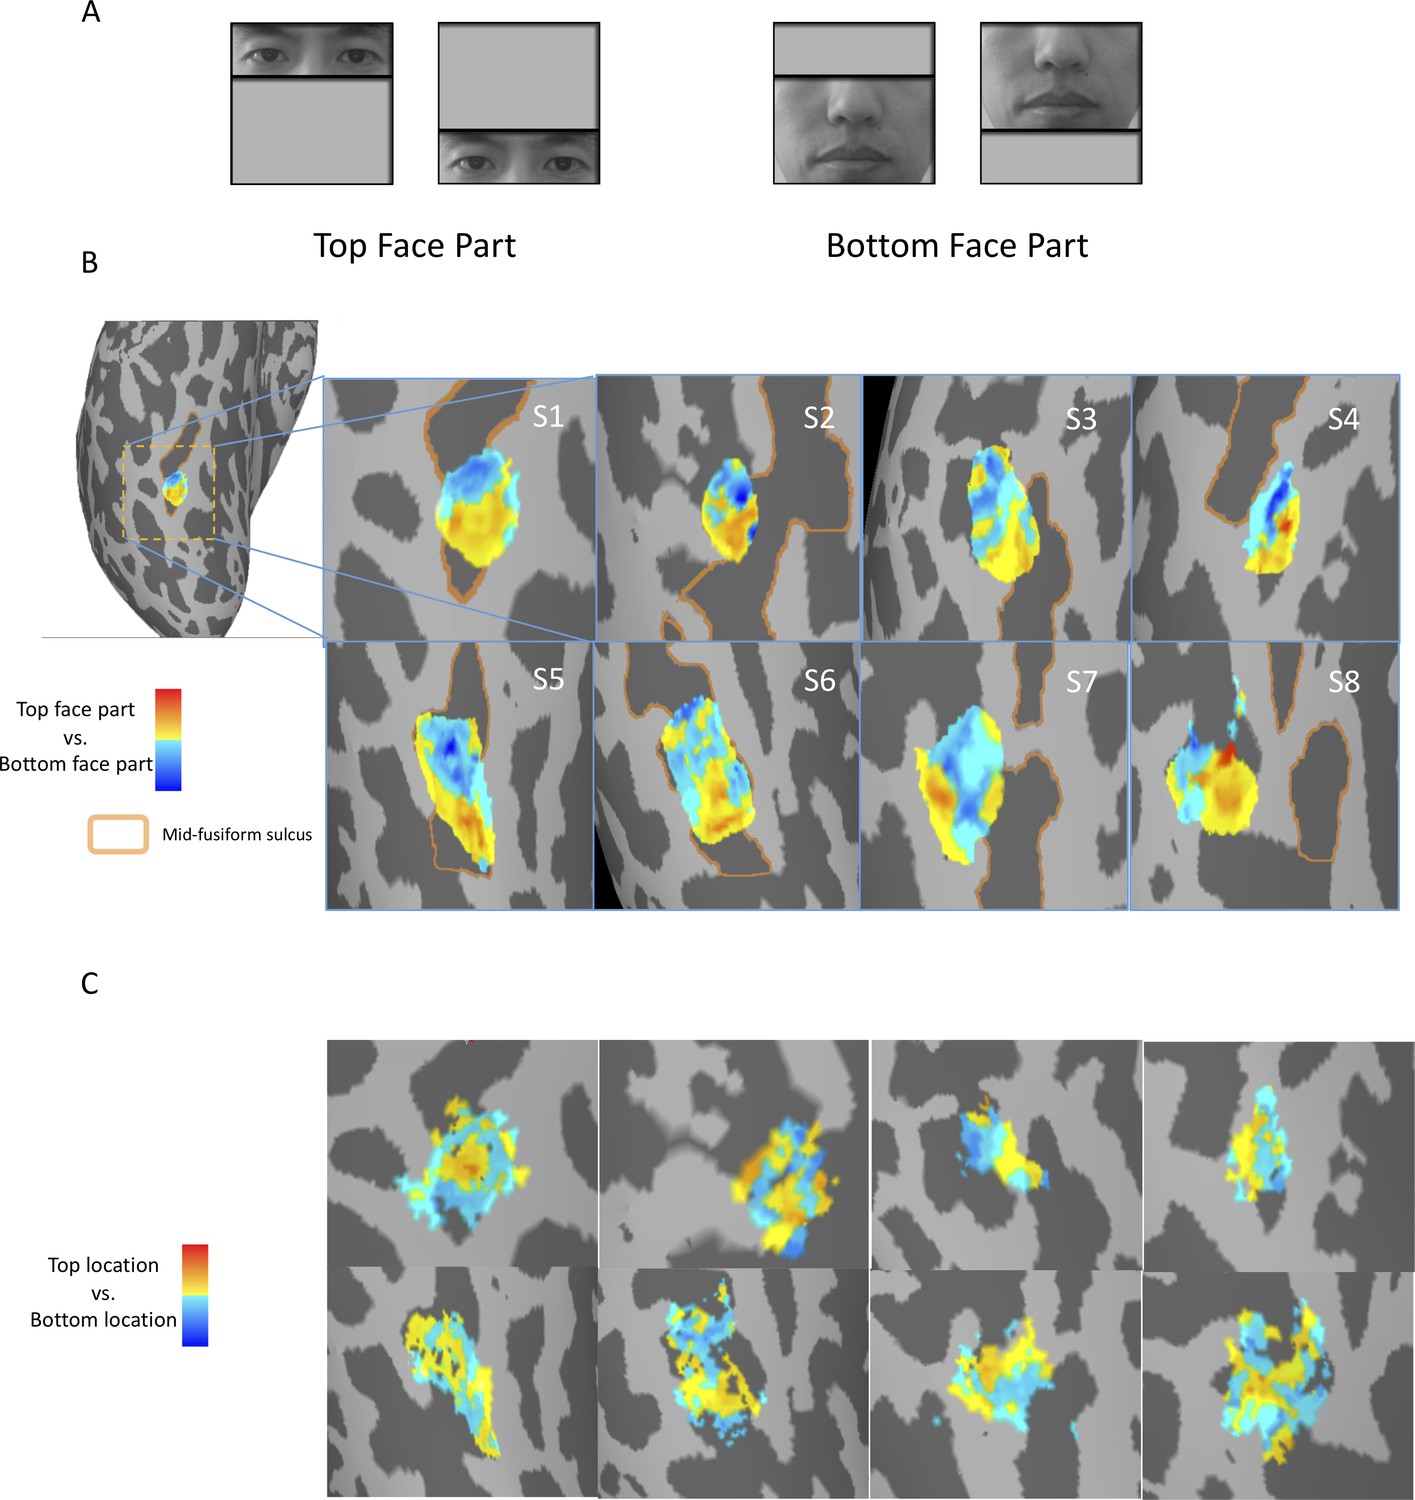
Stimuli and results of Control Experiment 2.
(A) Stimulus examples from Control Experiment 2 that top or bottom face parts presented at upper or lower visual field. (B) The anterior-posterior neural response profiles of face parts in right pFFA in eight participants. (C) The maps (without spatial smoothing) of response biases to face parts presented above vs. below fixation in right pFFA.
Figure 3—figure supplement 3
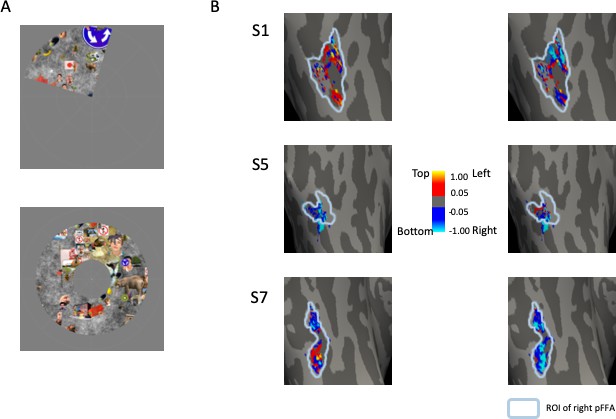
Stimuli and results of pRF experiment.
(A) Wedge and ring stimuli used in the pRF experiment. (B) Visualization of receptive field center of each voxel in the right pFFA outlined in blue. The maps represent the locations of receptive field center on the horizontal (left column) or vertical (right column) axis. No consistent spatial pattern is found across different participants.
Figure 4 with 1 supplement
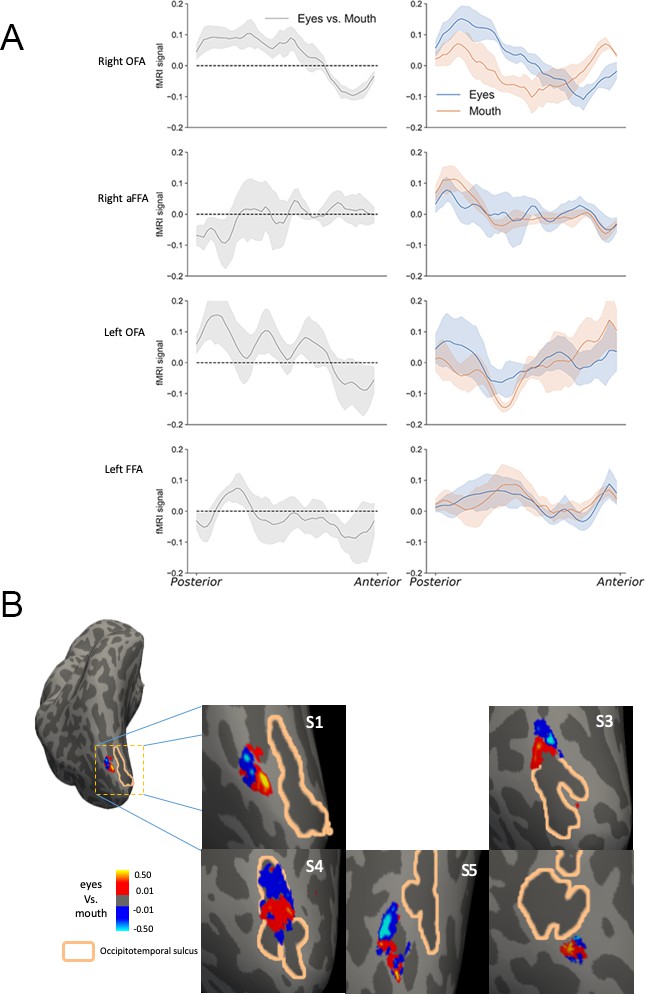
The spatial tuning of face parts in other face-selective regions.
(A) The anterior-posterior neural response profiles of eyes and mouth in other face-selective regions. The contrast between normalized eyes and mouth response patterns in different regions are shown in the left column. The right column plots show the eyes and mouth response profiles with general response patterns regressed out. The right OFA (top panel) demonstrates different response profiles for eyes and mouth, similar to the observation in right pFFA. The shaded regions reflect ±1 SEM. (B) The eyes vs mouth contrast maps in right OFA in the control experiment 1. A consistent anterior-posterior pattern could be observed in each participant. Right OFA could not be identified in one of the six participants.
Figure 4—figure supplement 1
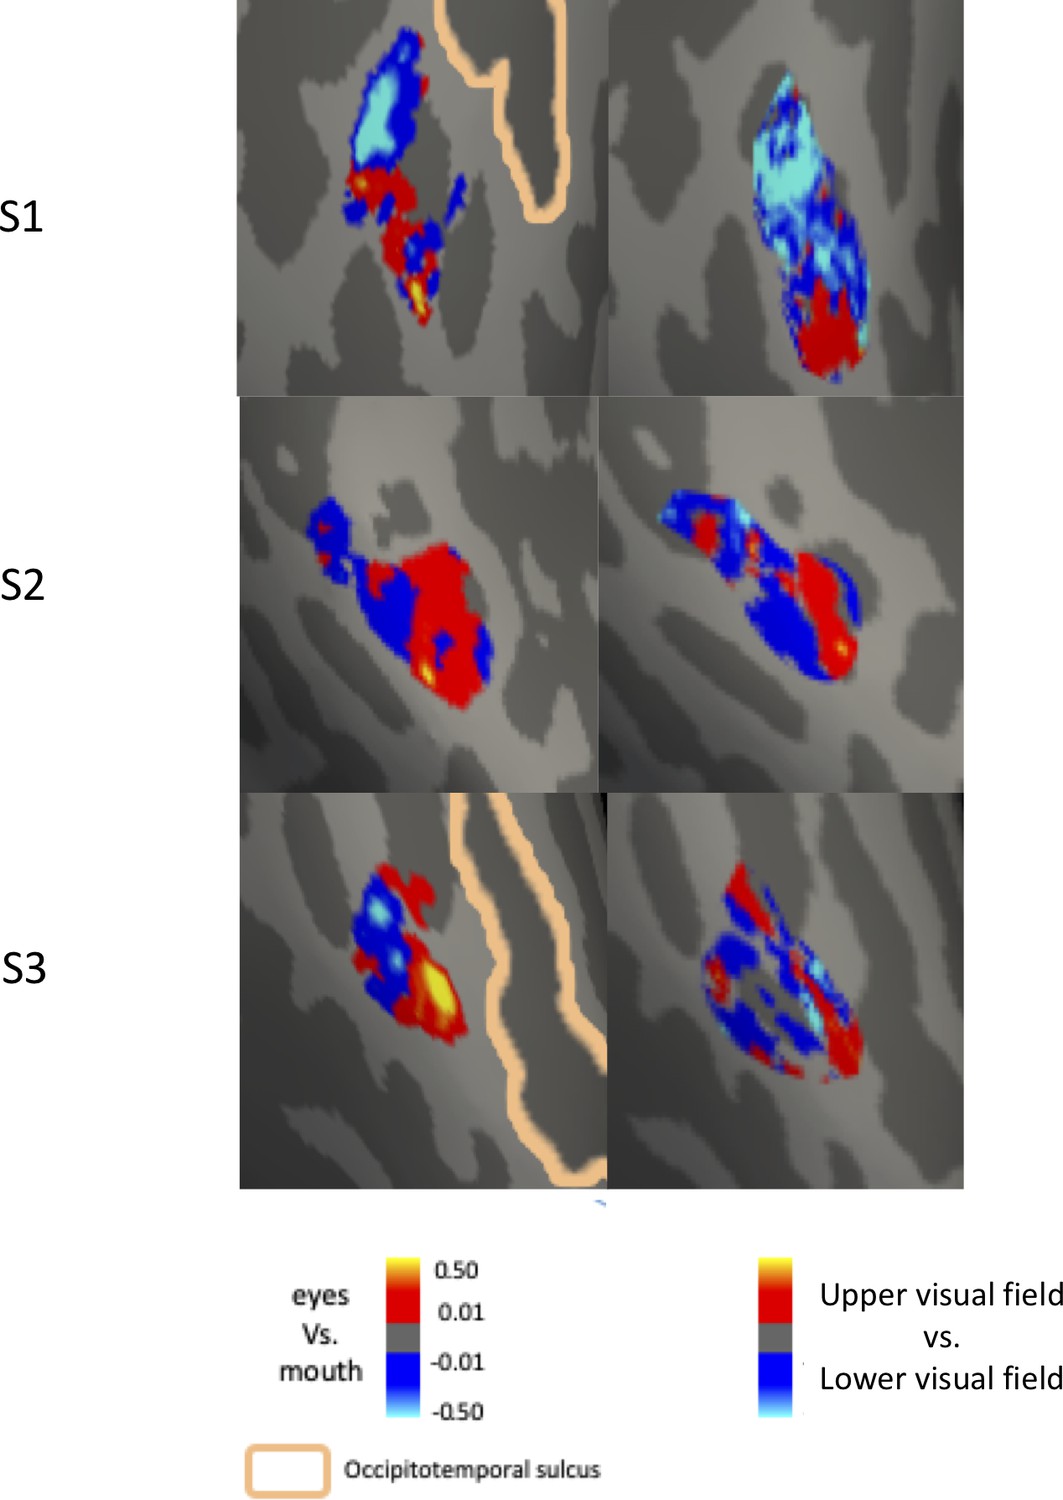
Maps of eyes-mouth bias (left column) and vertical visual field bias (right column) in the right OFA.
Results from three participants showed that two maps were spatially similar.
Figure 5
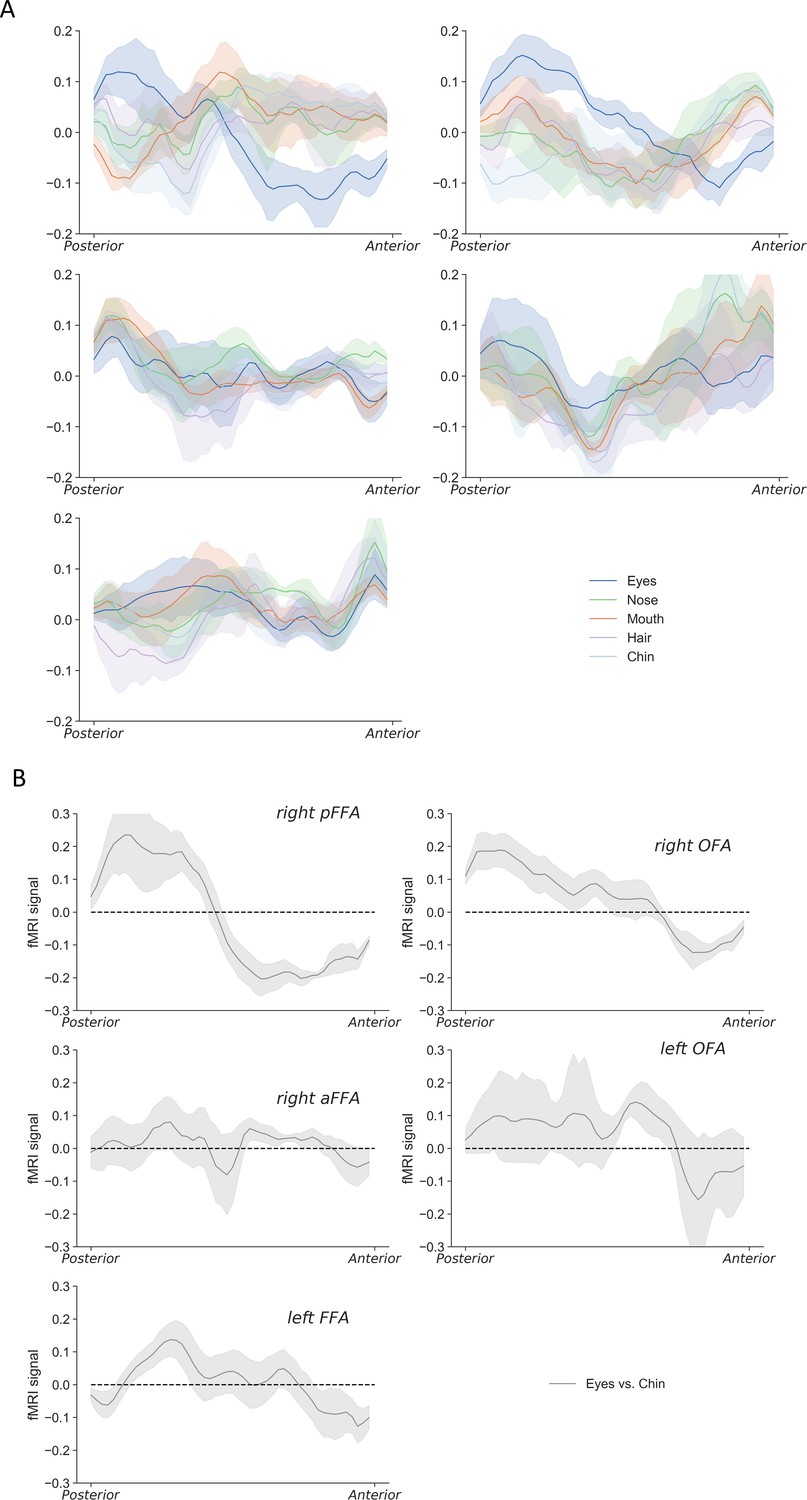
The anterior-posterior neural response profiles of all face parts (i.e. eyes, nose, mouth, hair, and chin) in five face-selective regions.
(A) With general pattern regressed out, the chin showed similar response profiles as mouth in right pFFA and right OFA. (B) Contrasting normalized eyes and chin response patterns revealed consistent changes along the posterior-anterior dimension in right pFFA and right OFA. The shaded regions reflect ±1 SEM.
Author response image 1

Additional files
Download links
A two-part list of links to download the article, or parts of the article, in various formats.
Downloads (link to download the article as PDF)
Open citations (links to open the citations from this article in various online reference manager services)
Cite this article (links to download the citations from this article in formats compatible with various reference manager tools)
Spatial tuning of face part representations within face-selective areas revealed by high-field fMRI
eLife 10:e70925.
https://doi.org/10.7554/eLife.70925


