Histone deacetylase 3 represses cholesterol efflux during CD4+ T-cell activation
- Department of Immunology, Mayo Clinic, United States
- Division of Rheumatology, Department of Medicine, Mayo Clinic, United States
Figures
Figure 1 with 1 supplement
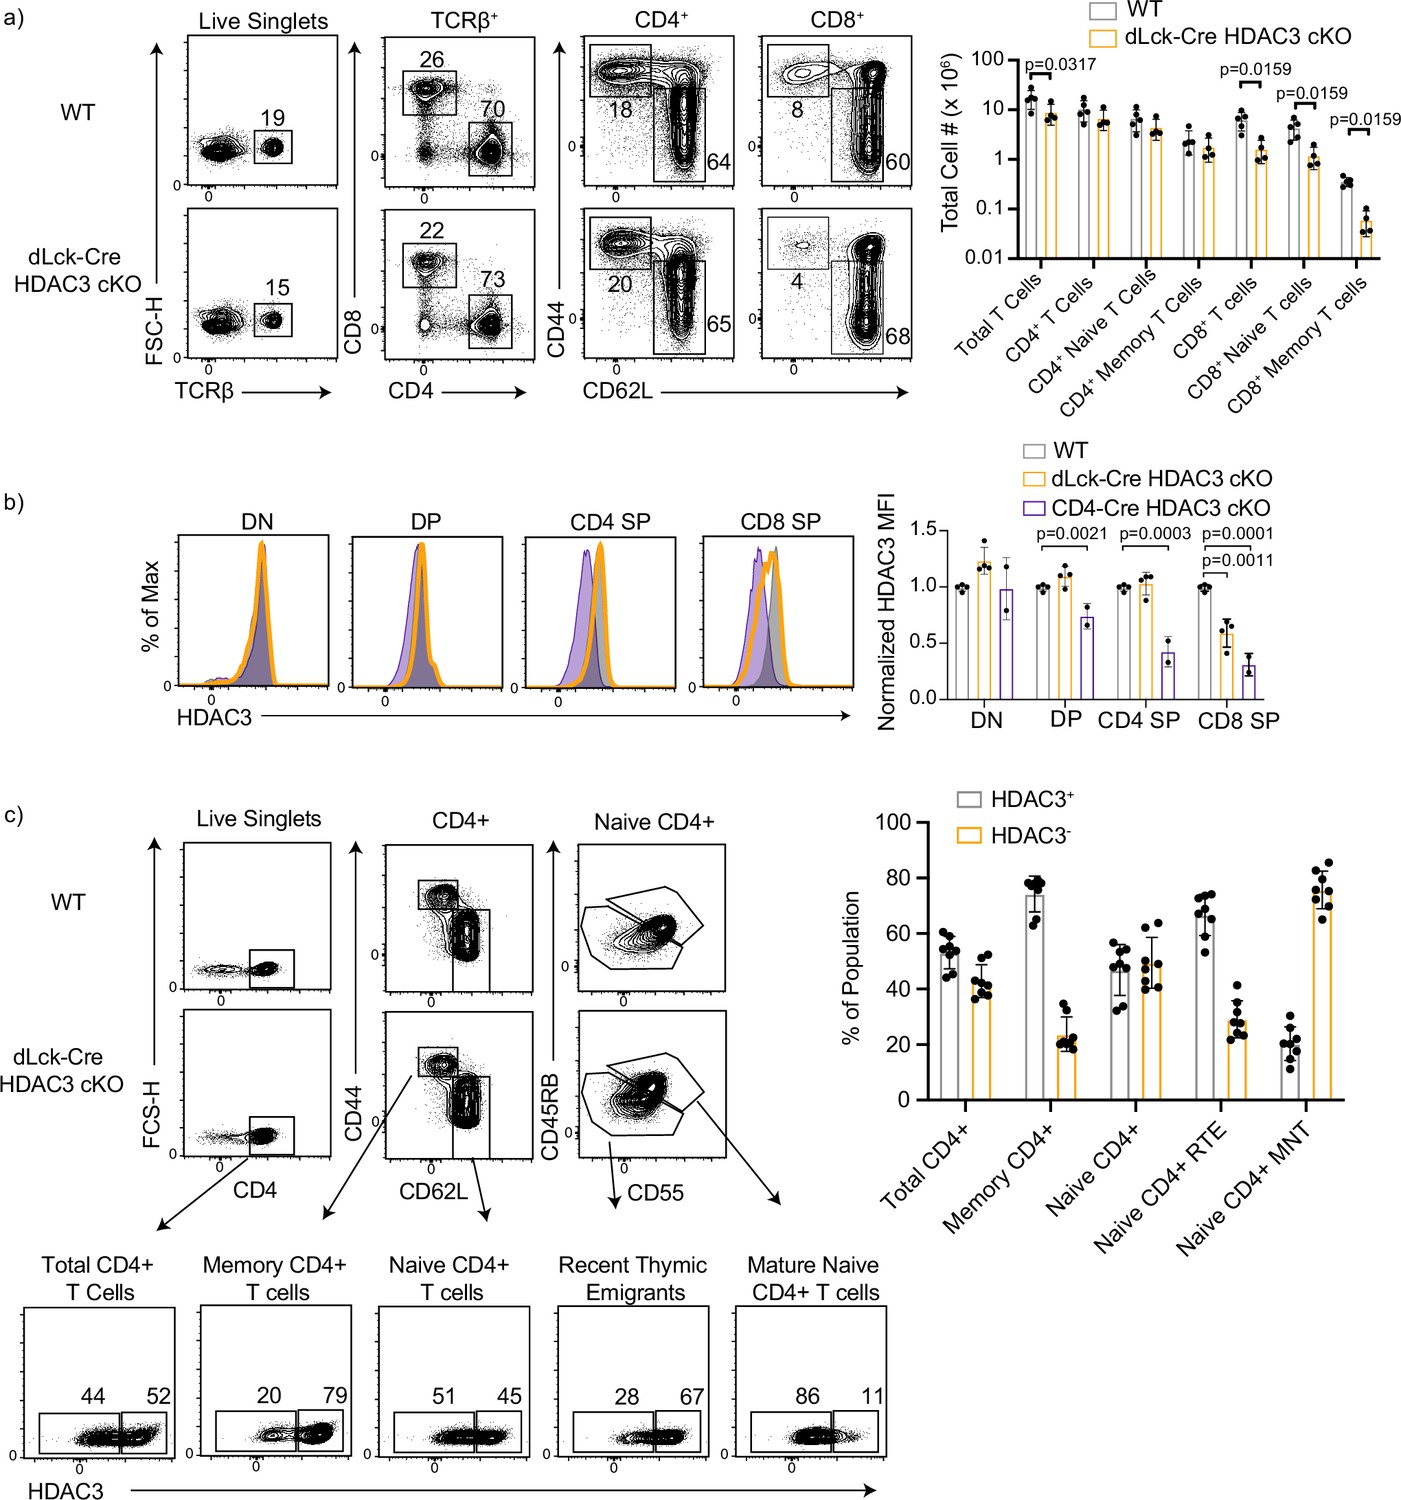
CD8+ T cells have intrathymic deletion of histone deacetylase 3 (HDAC3) in dLck-HDAC3 cKO, but CD4+ T cells initiate deletion at the recent thymic emigrant (RTE) stage.
(a) Profile of primary splenic T-cell populations from wild-type (WT) and dLck-Cre HDAC3 cKO mice including total T cells (TCRβ+), total CD4+ (TCRβ+ CD4+), and total CD8+ (TCRβ+ CD8+), as well as memory (CD44hi CD62Llo) and naive (CD44lo CD62Lhi) from each of the CD4+ and CD8+ populations. Bar graph depicts mean ± standard deviation (SD). Total cell number from three independent experiments (n = 5 mice/group). Statistical significance was determined for the indicated comparisons with Mann–Whitney tests between each WT and cKO population. (b) Expression of HDAC3 in thymocyte populations from WT, dLck-Cre HDAC3 cKO and CD4-Cre HDAC3 cKO mice. Thymic populations are gated as in Figure 1—figure supplement 1, and quantification of normalized HDAC3 MFI (median fluorescent intensity) ± SD from three independent experiments is shown on the right (n = 2–4 mice/group). Statistical significance was determined for the indicated comparisons with a one-way analysis of variance (ANOVA) with Tukey’s multiple comparisons test. (c) Profile of HDAC3 deletion in dLck-Cre HDAC3 cKO mice. Splenocytes were gated on key populations including total CD4+ (CD4+), naive CD4+ (CD4+ CD44lo CD62Lhi), and memory CD4+ (CD4+CD44hiCD62Llo). Naive cells were further gated in mature naive T cells (MNTs; CD45RBhiCD55hi) or recent thymic emigrants (RTEs; CD45RBloCD55lo). HDAC3-positive and -negative population frequencies are shown below. Bar chart on right quantifies the mean frequency ± SD of HDAC3+ or HDAC3− events within each population (n = 8 mice/group from three independent experiments).
Figure 1—figure supplement 1

dLck-Cre histone deacetylase 3 (HDAC3) cKO mice have normal thymocyte population numbers.
(a) CD4/CD8 profile in thymocytes from wild-type (WT) and dLck-Cre HDAC3 cKO. Gates for double negative (DN; CD4− CD8−), double positive (DP; CD4+ CD8+), CD4 single positive (CD4 SP; CD4+ CD8−), and CD8 single positive (CD8 SP; CD4− CD8+) are shown. Quantification of total cell number ± standard deviation (SD) from three independent experiments is shown on the right (n = 2–5 mice/group).
Figure 2 with 2 supplements

Histone deacetylase 3 (HDAC3)-deficient CD4+ T cells from dLck-Cre HDAC3 cKO mice have reduced differentiated Th-cell populations.
Identification of helper T-cell populations in vivo. Splenocytes were harvested from wild-type (WT) and HDAC3 cKO mice, and labeled for flow cytometry. Cells were first gated on HDAC3+ or HDAC3− events, then gating for Th1 (T-bet+), Th2 (GATA3+), Th17 (RORγt+), Treg (Foxp3+ CD25+), and Tfh (CXCR5+ PD-1+ Bcl-6hi) is shown (left). Bar plots on right represent pooled data for the total cell number ± standard deviation (SD) from three independent experiments (n = 4–5 mice/group in total). Non-Tfh CXCR5− PD-1− cells (dark gray histograms) were used as a negative control for Bcl-6 expression to set the gate on the Bcl-6 histograms. Statistical significance was determined for the indicated comparisons using ordinary one-way analysis of variance (ANOVA) with Tukey’s multiple comparisons test (*p < 0.05, **p < 0.01, ***p < 0.001, ****p < 0.0001).
Figure 2—figure supplement 1
Histone deacetylase 3 (HDAC3)-deficient T cells from dLck-Cre HDAC3 cKO mice have reduced differentiated Th-cell populations.
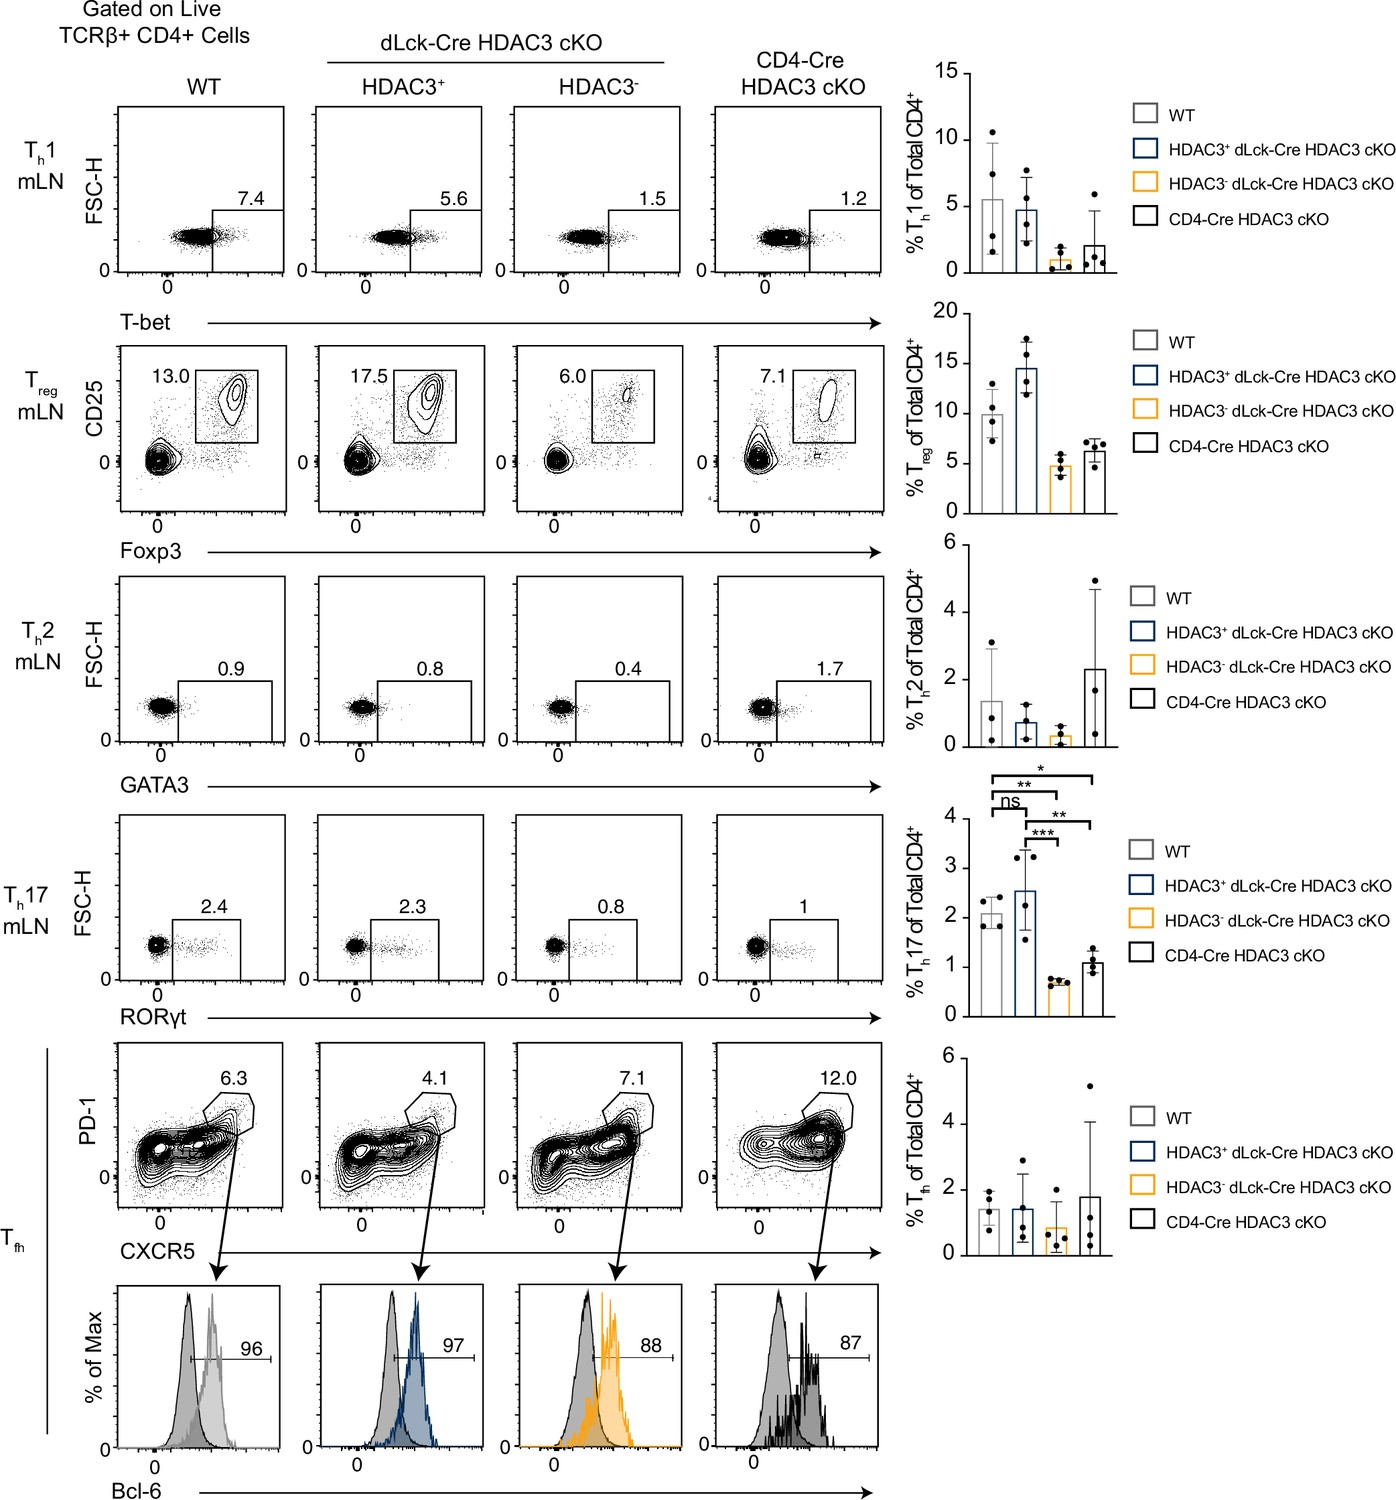
Identification of helper T-cell populations in vivo. Lymphocytes were harvested from mesenteric lymph nodes of wild-type (WT) and dLck-Cre HDAC3 cKO mice, and labeled for flow cytometry. Cells were first gated on HDAC3+ or HDAC3− events, then gating for Th1 (T-bet+), Th2 (GATA3+), Th17 (RORγt+), Treg (Foxp3+ CD25+), and Tfh (CXCR5+ PD-1+ Bcl-6hi) is shown (left). Bar plots on right represent pooled data for the frequency of CD4+ T cells ± standard deviation (SD) from three independent experiments (n = 4–5 mice/group).
Non-Tfh CXCR5− PD-1− cells (dark gray histograms) were used as a negative control for Bcl-6 expression to set the gate on the Bcl-6 histograms. Statistical significance was determined for the indicated comparisons using ordinary one-way analysis of variance (ANOVA) with Tukey’s multiple comparisons test (*p<0.05, **p < 0.01, ***p < 0.001).
Figure 2—figure supplement 2

Histone deacetylase 3 (HDAC3)-deficient T cells from Peyer’s patches have reduced Tfh cell numbers.
Lymphocytes were harvested from the Peyer’s patches of wild-type (WT) and dLck-Cre HDAC3 cKO mice, and labeled for flow cytometry. Cells were first gated on HDAC3+ or HDAC3− events, then gating for Tfh (CXCR5+ PD-1+ Bcl-6hi). Non-Tfh CXCR5− PD-1− cells were used as a negative control for Bcl-6 expression to set the gate on the Bcl-6 histograms. Bar plots on right represent pooled data for the frequency of Tfh cells (n = 3–5 mice/group from two independent experiments). Statistical significance was determined for the indicated comparisons using ordinary one-way analysis of variance (ANOVA) with Tukey’s multiple comparisons test.
Figure 3 with 2 supplements
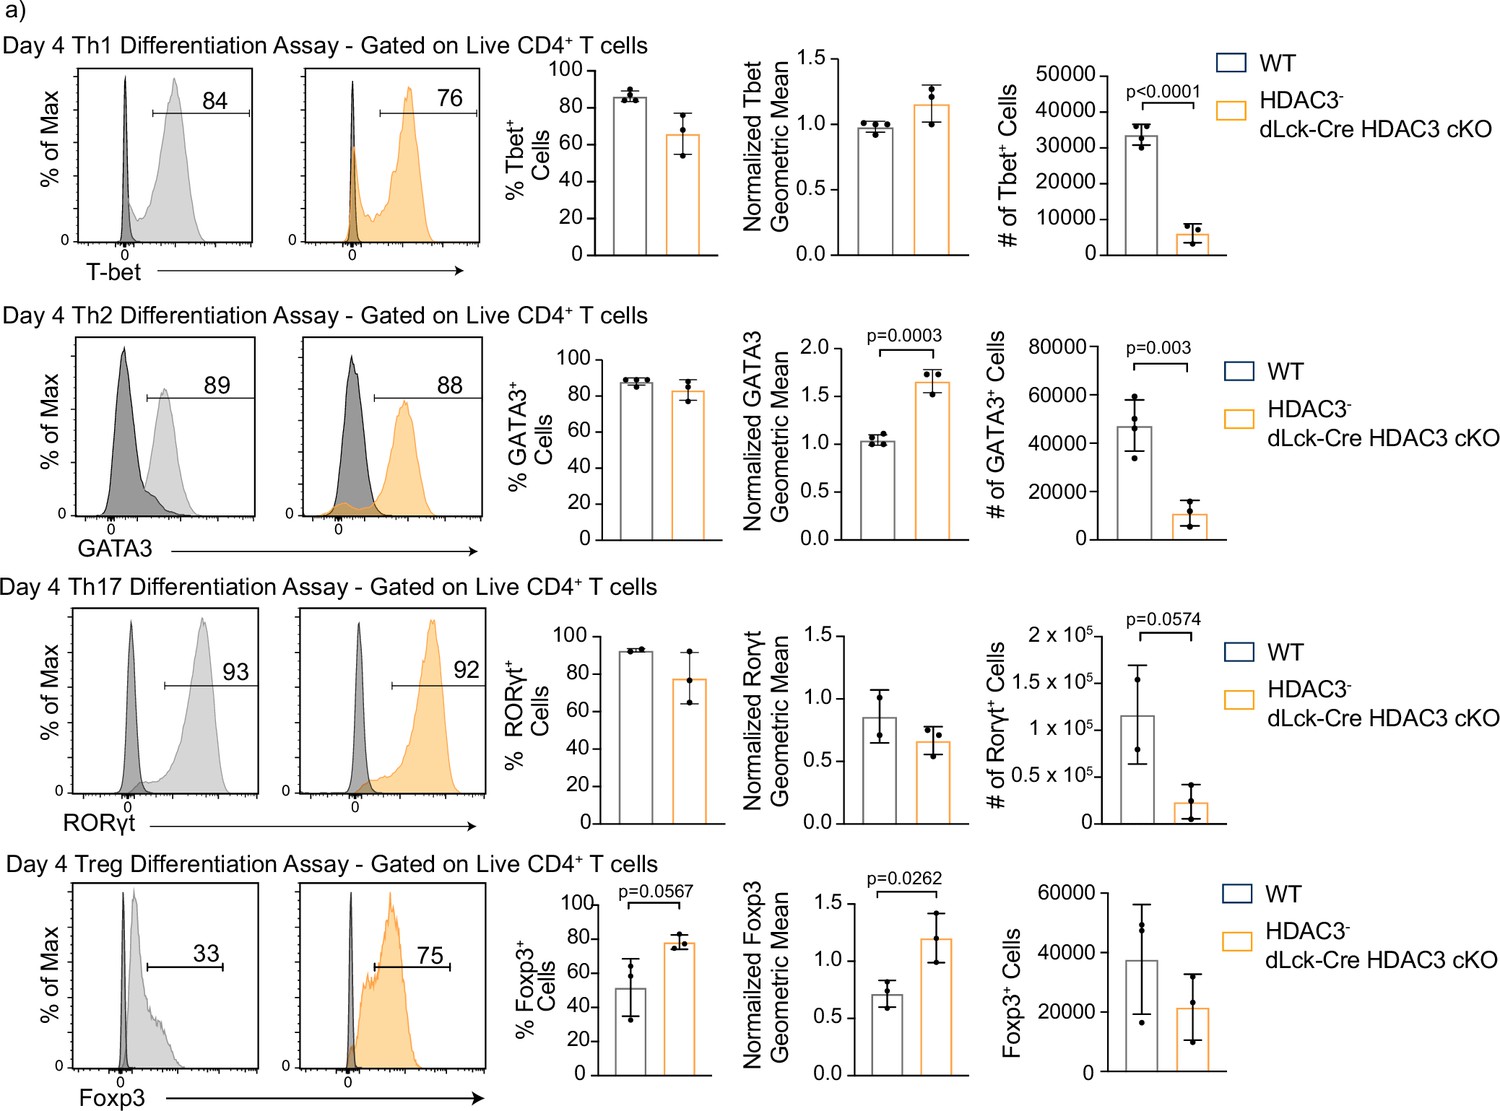
Histone deacetylase 3 (HDAC3)-deficient CD4+ T cells are capable of differentiation, but produce fewer cells than wild-type (WT).
(a) In vitro differentiation assays were performed to examine differentiation into the Th1, Th2, Th17, and Treg lineages characterized by transcription factor expression. Splenocytes were harvested and magnetically enriched for naive (CD44−) CD4+ T cells by negative selection. Cells in all assays were stimulated with 2 µg/ml plate-bound αCD3 and 0.5 µg/ml αCD28 for 4 days. For Th1 differentiation, 1 µg/ml αIL-4 antibody and 10 ng/ml of IL-12 were added to the media. For Th2 differentiation, 1 µg/ml of each αIFNγ and αIL-12 antibody, as well as 10 ng/ml of IL-4 was added to the media. For Th17 differentiation, media was supplemented with 10 µg/ml of αIFNγ and αIL-4 antibody as well as 10 ng/ml of rIL-23, 5 ng/ml TGF-β1, and 20 ng/ml IL-6. For Treg differentiation, media was supplemented with 10 µg/ml αIFNγ and αIL-4 antibody as well as 2 ng/ml TGF-β1, and 2 ng/ml interleukin-2 (IL-2). Unstimulated control samples did not receive αCD3/αCD28 stimulation, but did receive 10 ng/ml IL-7 to maintain cell survival during culture. Bar plots on the right show % of cells from the total culture that are positive for the transcription factor ± standard deviation (SD), total cell number ± SD, and geometric mean of expression ± SD (n = 2–4 mice/group from two to three independent experiments for each). Two nonlittermate, but age and sex matched, WT B6 controls were used in these experiments. Negative controls (black histograms) represent unstimulated, but stained samples from the same mouse as the stimulated sample shown. Statistical significance was determined for the indicated comparisons using an unpaired t-test.
Figure 3—figure supplement 1
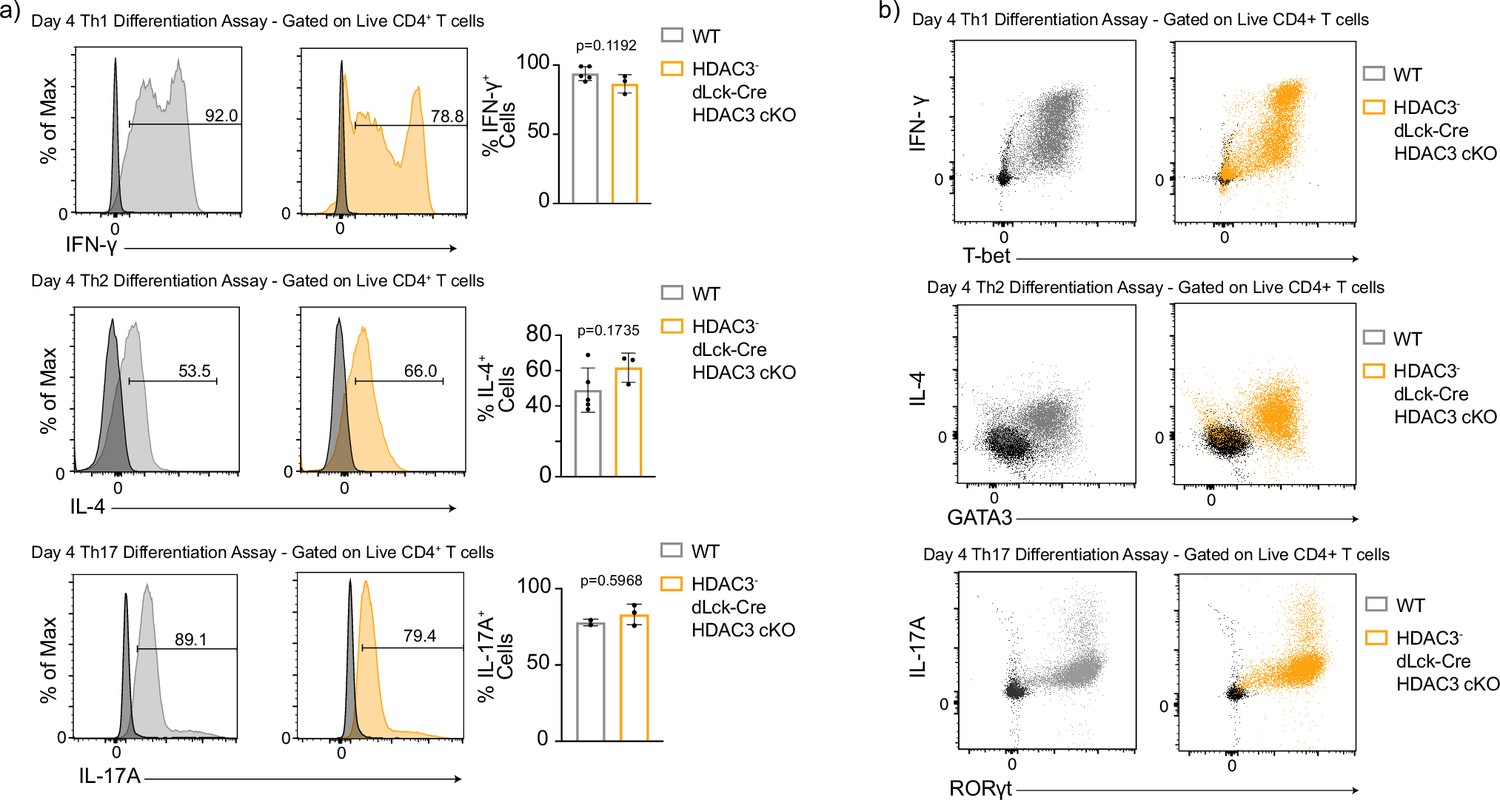
Histone deacetylase 3 (HDAC3)-deficient CD4 T cells are capable of producing lineage-specific cytokines during in vitro differentiation.
(a) In vitro differentiation assays were performed to examine differentiation into the Th1, Th2, and Th17 lineages characterized by cytokine expression. Splenocytes from wild-type (WT) and dLck-Cre HDAC3 cKO mice were harvested and magnetically enriched for naive (CD44−) CD4+ T cells by negative selection. Cells in all assays were stimulated with 2 µg/ml plate-bound αCD3 and 0.5 µg/ml αCD28 for 4 days. For Th1 differentiation, 1 µg/ml αIL-4 antibody and 10 ng/ml of IL-12 were added to the media. For Th2 differentiation, 1 µg/ml of each αIFNγ and αIL-12 antibody, as well as 10 ng/ml of IL-4 was added to the media. For Th17 differentiation, media was supplemented with 10 µg/ml of αIFNγ and αIL-4 antibody as well as 10 ng/mL of rIL-23, 5 ng/ml TGF-β1, and 20 ng/ml IL-6. Unstimulated control samples did not receive αCD3/αCD28, stimulation, but did receive 10 ng/ml IL-7 to maintain cell survival during culture. Bar plots on the right show % of cells from the total culture that are positive for the cytokine ± standard deviation (SD). Negative controls (black histograms) represent unstimulated, but stained samples from the same mouse as the stimulated sample shown (n = 2–4 mice/group from two to three independent experiments for each). (b) In vitro differentiation assays were performed as in (a), and examined for coexpression of lineage-defining transcription factors and cytokines. Dot plots are representative of two to three independent experiments (n = 2–4 mice/group). Negative controls (black dots) represent unstimulated, but stained samples from the same mouse as the stimulated sample shown. Statistical significance was determined for all indicated comparisons using an unpaired t-test.
Figure 3—figure supplement 2
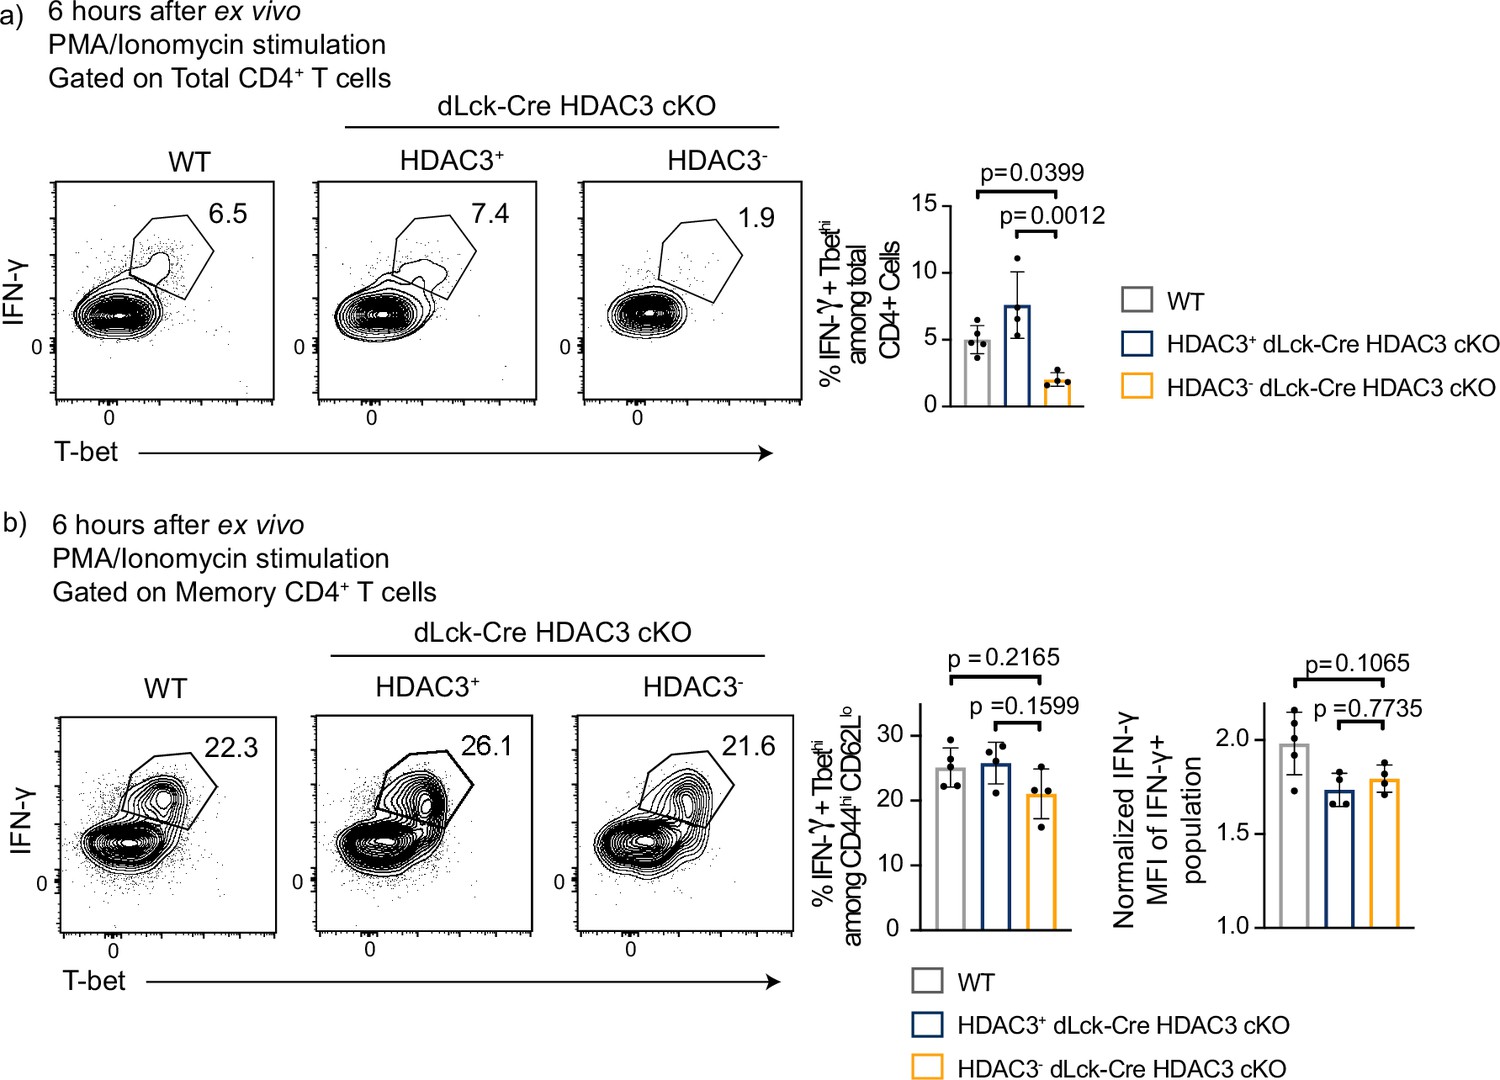
Histone deacetylase 3 (HDAC3)-deficient CD4 T cells are capable of producing IFNγ ex vivo.
Splenocytes from wild-type (WT) and dLck-Cre HDAC3 cKO mice were harvested and magnetically enriched for total CD4+ T cells by negative selection. Cells were stimulated with 20 ng/ml PMA and 1 µg/ml of ionomycin for 6 hr. After stimulation, (a) total CD4 and (b) memory (CD44hiCD62Llo) cells were analyzed by flow cytometry for expression of T-bet and IFNγ. Bar graph on the right shows % of memory cells that are IFNγ+ T-bethi ± standard deviation (SD; n = 4–5 mice/group from two independent experiments).
Figure 4 with 1 supplement
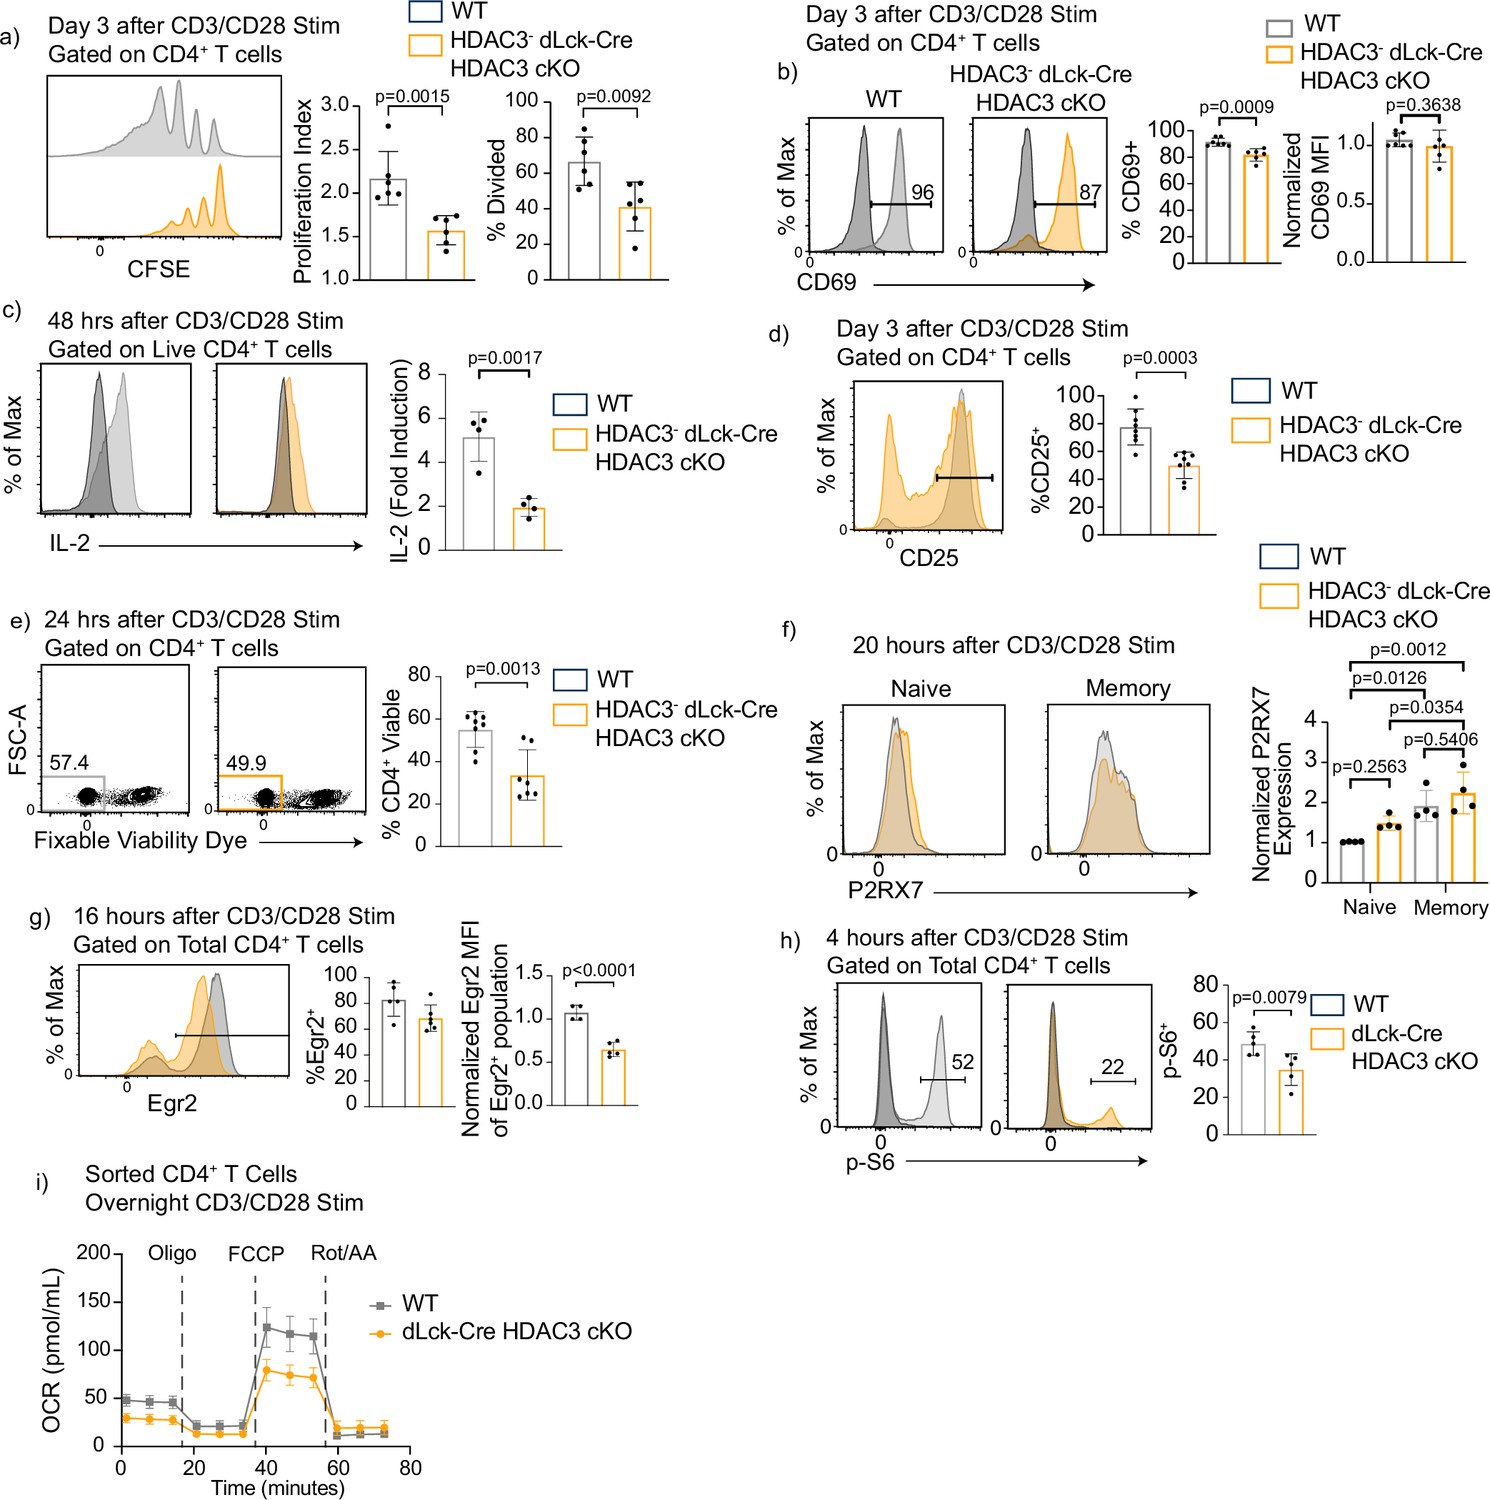
Histone deacetylase 3 (HDAC3)-deficient CD4+ T cells have reduced proliferation and diminished mechanistic target of rapamycin (mTOR) signaling after in vitro stimulation.
(a) Splenocytes were isolated from wild-type (WT) or dLck-Cre HDAC3 cKO mice, and magnetically enriched for CD4+ T cells by magnetic negative selection. Enriched CD4+ T cells were labeled with CFSE and stimulated with 5 µg of plate-bound αCD3 and 1 µg/ml of αCD28 for 3 days and examined by flow cytometry for proliferation. Cells from dLck-Cre HDAC3 cKO were gated on HDAC3− cells to eliminate contaminating HDAC3+ events. Bar graphs on right show proliferation index ± standard deviation (SD) and % divided ± SD (n = 6 mice/group from three independent experiments). One nonlittermate, but age- and sex-matched WT B6 control was used in this experiment. (b) Enriched CD4+ T cells were stimulated with 5 µg plate-bound αCD3 and 1 µg/ml soluble αCD28 and analyzed for CD69 expression after 16 hr. Bar graph on right shows MFI ± SD (n = 6–7 mice/group from three independent experiments). (c) Enriched CD4+ T cells were analyzed for interleukin-2 (IL-2) production 48 hr after stimulation with 2 µg of plate-bound αCD3 and 0.5 µg/ml of αCD28. Bar graph on right shows fold induction ± SD (n = 4 mice/group from two independent experiments). (d) Enriched CD4+ T cells were stimulated with 5 µg plate-bound αCD3 and 1 µg/ml soluble αCD28 and analyzed for CD25 receptor expression after 3 days. Bar graph on right shows percent CD25 positive ± SD (n = 8 mice/group from four independent experiments). (e) Enriched CD4+ T cells were stimulated with 5 µg plate-bound αCD3 and 1 µg/ml soluble αCD28 and analyzed for viability after 24 hr. Bar graph on right shows percent viability dye positive ± SD (n = 7 mice/group from four independent experiments). (f) Enriched CD4+ T cells were stimulated with 5 µg plate-bound αCD3 and 1 µg/ml soluble αCD28 and analyzed for expression of P2RX7 after 20 hr. Bar graph on right shows MFI ± SD (n = 4 mice/group from two independent experiments). (g) Enriched CD4+ T cells were stimulated with 5 µg plate-bound αCD3 and 1 µg/ml soluble αCD28 and analyzed for Early Growth Response Protein 2 (Egr2) expression after 16 hr. Bar graphs on right shows percent Egr2+ ± SD and Egr2 MFI of Egr2+ population ± SD (n = 4–5 mice/group from three independent experiments). (h) Enriched CD4+ T cells were stimulated with 5 µg plate-bound αCD3 and 1 µg/ml soluble αCD28 and analyzed for phosphorylation of ribosomal protein S6 after 4 hr. Bar graph on right shows percent p-S6 positive ± SD (n = 5 mice/group from three independent experiments). (i) Enriched CD4+ T cells were stimulated overnight with 5 µg plate-bound αCD3 and 1 µg/ml soluble αCD28, then a Mito Stress Assay was conducted to measure oxygen consumption rate (OCR). Data are pooled, and show mean OCR ± standard error of the mean (SEM; n = 3 mice/group from two independent experiments). Statistical significance for indicated comparisons in all panels except for (f) was determined by an unpaired t-test. For (f), statistical significance was determined for the indicated comparisons using one-way analysis of variance (ANOVA) and with Tukey’s multiple comparisons test.
Figure 4—figure supplement 1
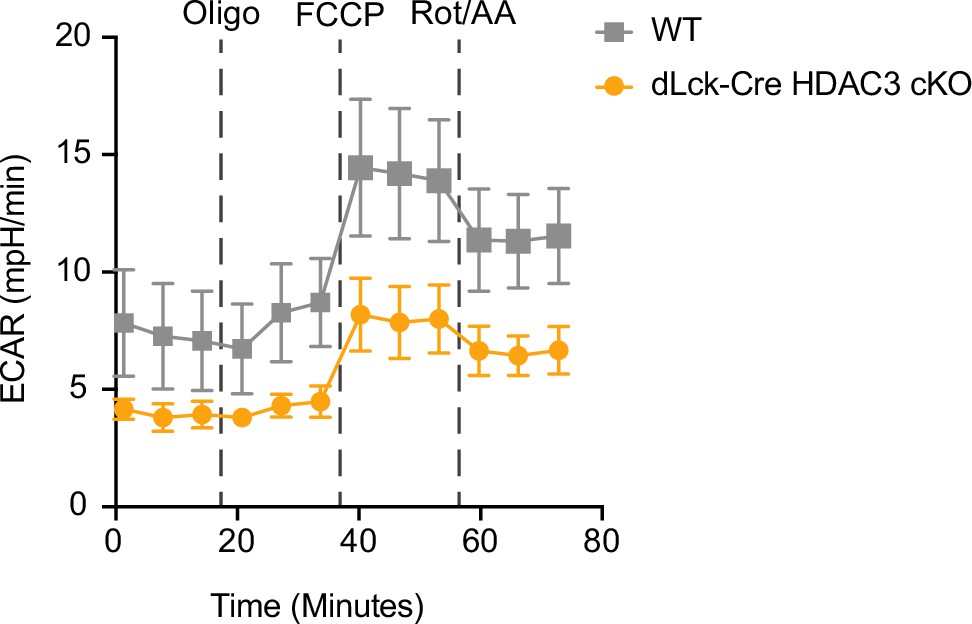
dLck-Cre histone deacetylase 3 (HDAC3) cKO cells have reduced basal extracellular acidification rate after activation.
Enriched CD4+ T cells were stimulated overnight with 5 µg/ml plate-bound αCD3 and 1 µg/ml soluble αCD28, then a Mito Stress Assay was conducted to measure extracellular acidification rate (ECAR). Data are pooled, and show mean ECAR ± standard deviation (SD; n = 3 mice/group from two independent experiments).
Figure 5
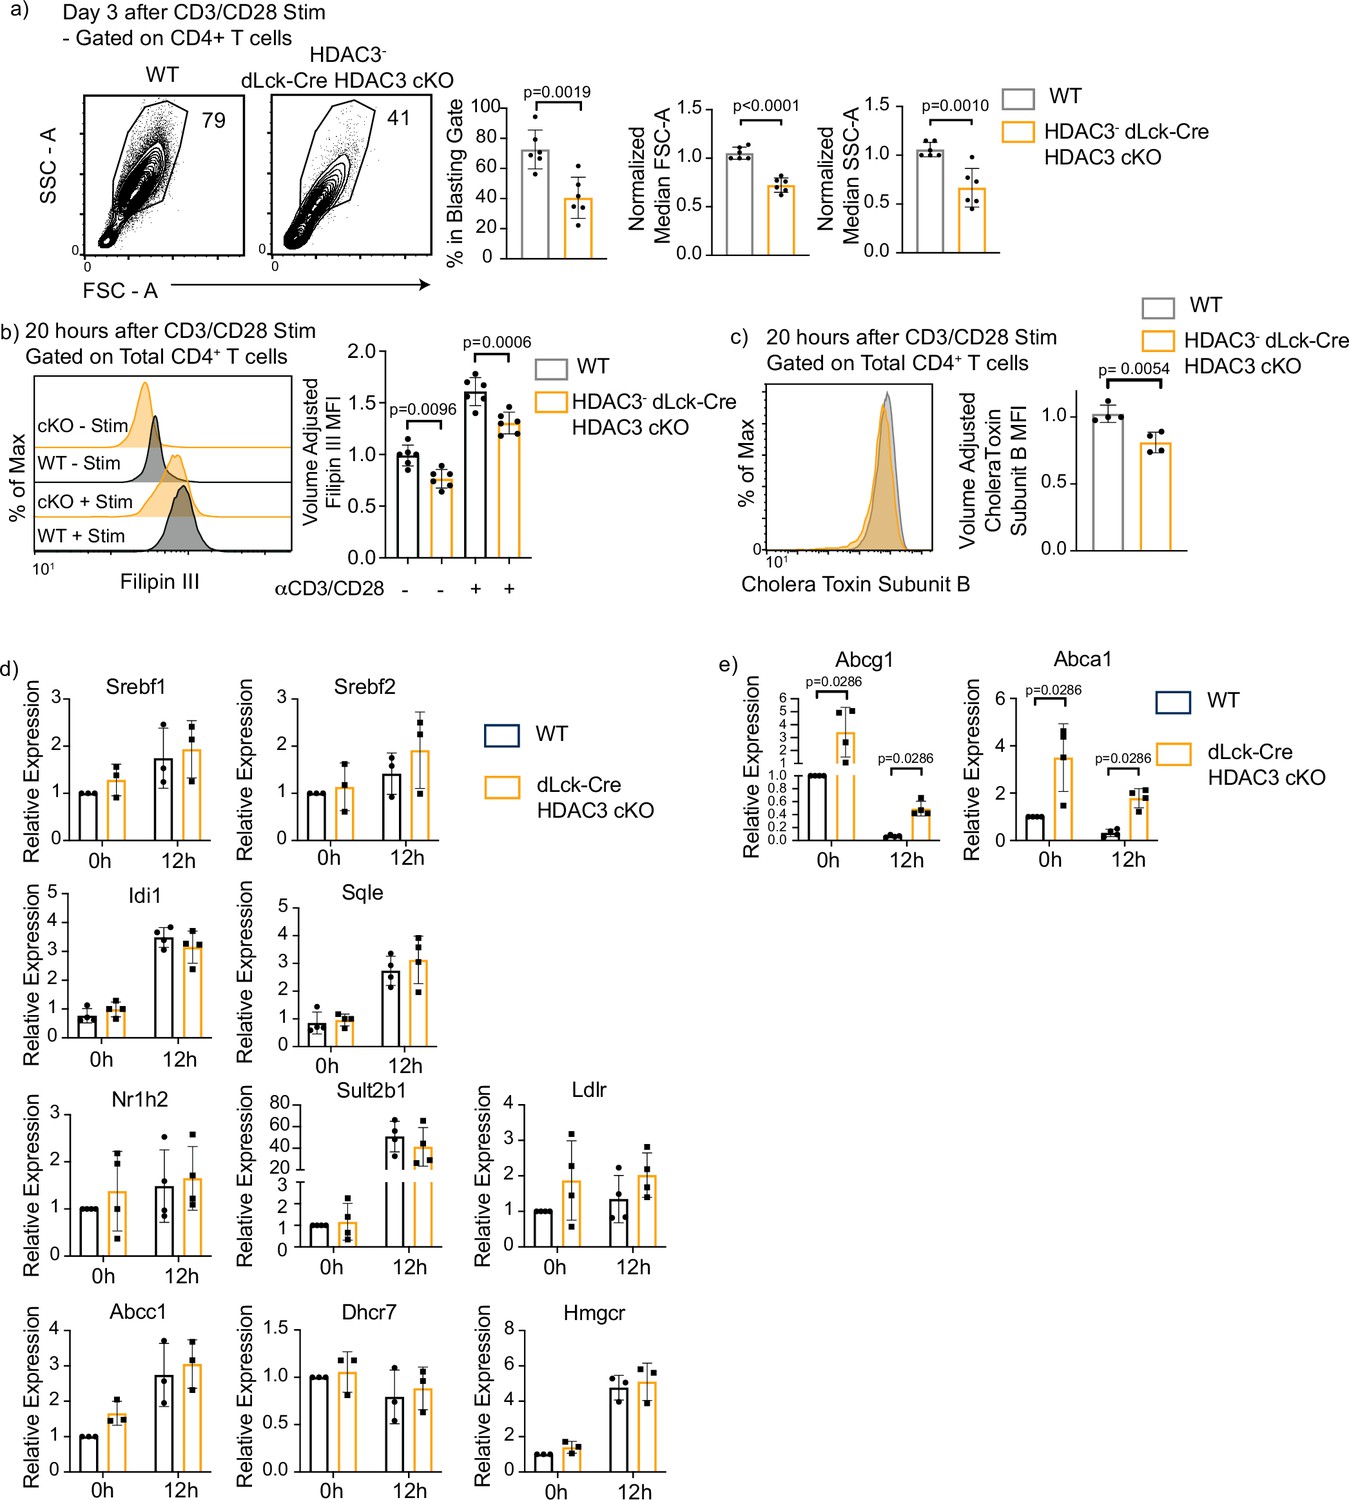
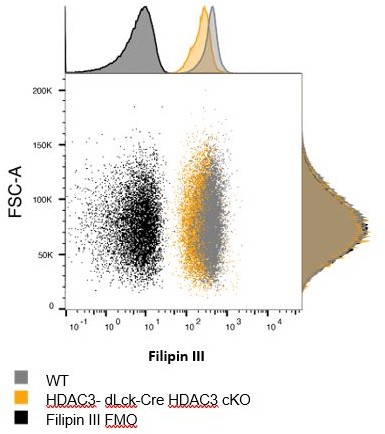
Histone deacetylase 3 (HDAC3)-deficient CD4+ T cells have defective blasting, reduced cholesterol levels, and increased cholesterol efflux transporter expression.
(a) Enriched CD4+ T cells were stimulated with 5 µg plate-bound αCD3 and 1 µg/ml soluble αCD28 and analyzed for blasting by size (forward scatter area, FSC-A) and granularity (side scatter area, SSC-A) after 3 days. Bar graphs on right represent mean ± standard deviation (SD; n = 6 mice/group from three independent experiments). One nonlittermate, but age- and sex-matched wild-type (WT) B6 control was used in this experiment. Statistical significance was determined for the indicated comparisons using an unpaired t-test. (b) Splenocytes were isolated from WT or dLck-Cre HDAC3 cKO mice, and labeled for cholesterol using Filipin III 20 hr after stimulation with 5 µg of plate-bound αCD3 and 1 µg/ml of αCD28. Flow cytometry was conducted. Bar plot (right) shows volume-adjusted MFI ± SD quantified across three independent experiments (n = 6 mice/group). MFI was adjusted to approximate cell volume by taking MFI divided by FSC-W3. Statistical significance was determined for the indicated comparisons using one-way analysis of variance (ANOVA) with Tukey’s multiple comparisons test. (c) Enriched CD4+ T cells were labeled with AF488-conjugated Cholera Toxin Subunit B 20 hr after stimulation with 5 µg of plate-bound αCD3 and 1 µg/ml of αCD28. Bar graph on right represents mean ± SD (n = 4 mice/group from two independent experiments). MFI was adjusted to approximate cell volume by taking MFI divided by FSC-W3. Statistical significance was determined for the indicated comparison using an unpaired t-test. (d, e) Enriched CD4+ T cells from Rag1-GFP WT and Rag1-GFP dLck-Cre HDAC3 cKO mice were sorted by fluorescence-activated cell sorting (FACS) for mature naive T cells (GFP−). After sorting, cells were stimulated with 5 µg of plate-bound αCD3 and 1 µg/ml of αCD28, and RT-qPCR was conducted to examine gene expression of genes involved in cholesterol homeostasis. Bar graphs represent mean ± SD (n = 3–4 mice/group from three independent experiments). Statistical significance was determined for the indicated comparisons using an unpaired t-test.
Figure 6

Defective proliferation and blasting in histone deacetylase 3 (HDAC3)-deficient CD4+ T cells is rescued by addition of exogenous cholesterol in vitro.
(a) Enriched CD4+ T cells were labeled with CFSE and stimulated with 5 µg of plate-bound αCD3 and 1 µg/ml of αCD28 in the presence or absence of 5 µg cholesterol-methyl-β-cyclodextrin for 3 days and examined by flow cytometry for proliferation. Bar graphs represent mean proliferation index ± standard deviation (SD; n = 5 mice/group from three independent experiments). (b) Splenocytes were isolated from wild-type (WT) or dLck-Cre HDAC3 cKO mice, and magnetically enriched for CD4+ T cells by magnetic negative selection. Enriched CD4+ T cells were stimulated with 5 µg plate-bound αCD3 and 1 µg/ml soluble αCD28 in the presence or absence of 5 µg cholesterol-methyl-β- cyclodextrin, and analyzed for blasting by size (forward scatter area, FSC-A) and granularity (side scatter area, SSC-A) after 3 days. Bar graphs represent mean ± SD (n = 6–8 mice/group from three independent experiments). (c) Enriched CD4+ T cells were labeled with AF488-conjugated Cholera Toxin Subunit B 20 hr after stimulation with 5 µg of plate-bound αCD3 and 1 µg/ml of αCD28 in the presence or absence of 5 µg cholesterol-methyl-β-cyclodextrin. Bar graph on right represents mean ± SD (n = 4 mice/group from two independent experiments). MFI was adjusted to approximate cell volume by taking MFI divided by FSC-W3. (d) Enriched CD4+ T cells were labeled with Filipin III 20 hr after stimulation with 5 µg of plate-bound αCD3 and 1 µg/ml of αCD28 in the presence or absence of 5 µg cholesterol-methyl-β-cyclodextrin. MFI was adjusted to approximate cell volume by taking MFI divided by FSC-W3. Bar graph on right represents adjusted MFI ± SD (n = 6 mice/group from three independent experiments). (e) Enriched CD4+ T cells were stimulated with 5 µg plate-bound αCD3 and 1 µg/ml soluble αCD28 in the presence or absence of 5 µg cholesterol-methyl-β-cyclodextrin and analyzed for CD25 receptor expression after 3 days. Bar graphs represent mean percent CD25+ ± SD (n = 4 mice/group from two independent experiments). (f) Enriched CD4+ T cells were stimulated with 5 µg plate-bound αCD3 and 1 µg/ml soluble αCD28 in the presence or absence of 5 µg cholesterol-methyl-β-cyclodextrin and analyzed for Early Growth Response Protein 2 (Egr2) expression after 16 hr. Bar graphs represent percent Egr2+ ± SD and normalized Egr2 MFI ± SD among Egr2+ population (n = 8 mice/group from four independent experiments). (g) Enriched CD4+ T cells were stimulated with 5 µg plate-bound αCD3 and 1 µg/ml soluble αCD28 in the presence or absence of 5 µg cholesterol-methyl-β-cyclodextrin and analyzed phosphorylation of S6 after 4 hr. Bar graphs represent percent p-S6+ ± SD (n = 4 mice/group from two independent experiments). Statistical significance was determined for all indicated comparisons in this figure using a one-way analysis of variance (ANOVA) with Tukey’s multiple comparisons test.
Figure 7 with 1 supplement
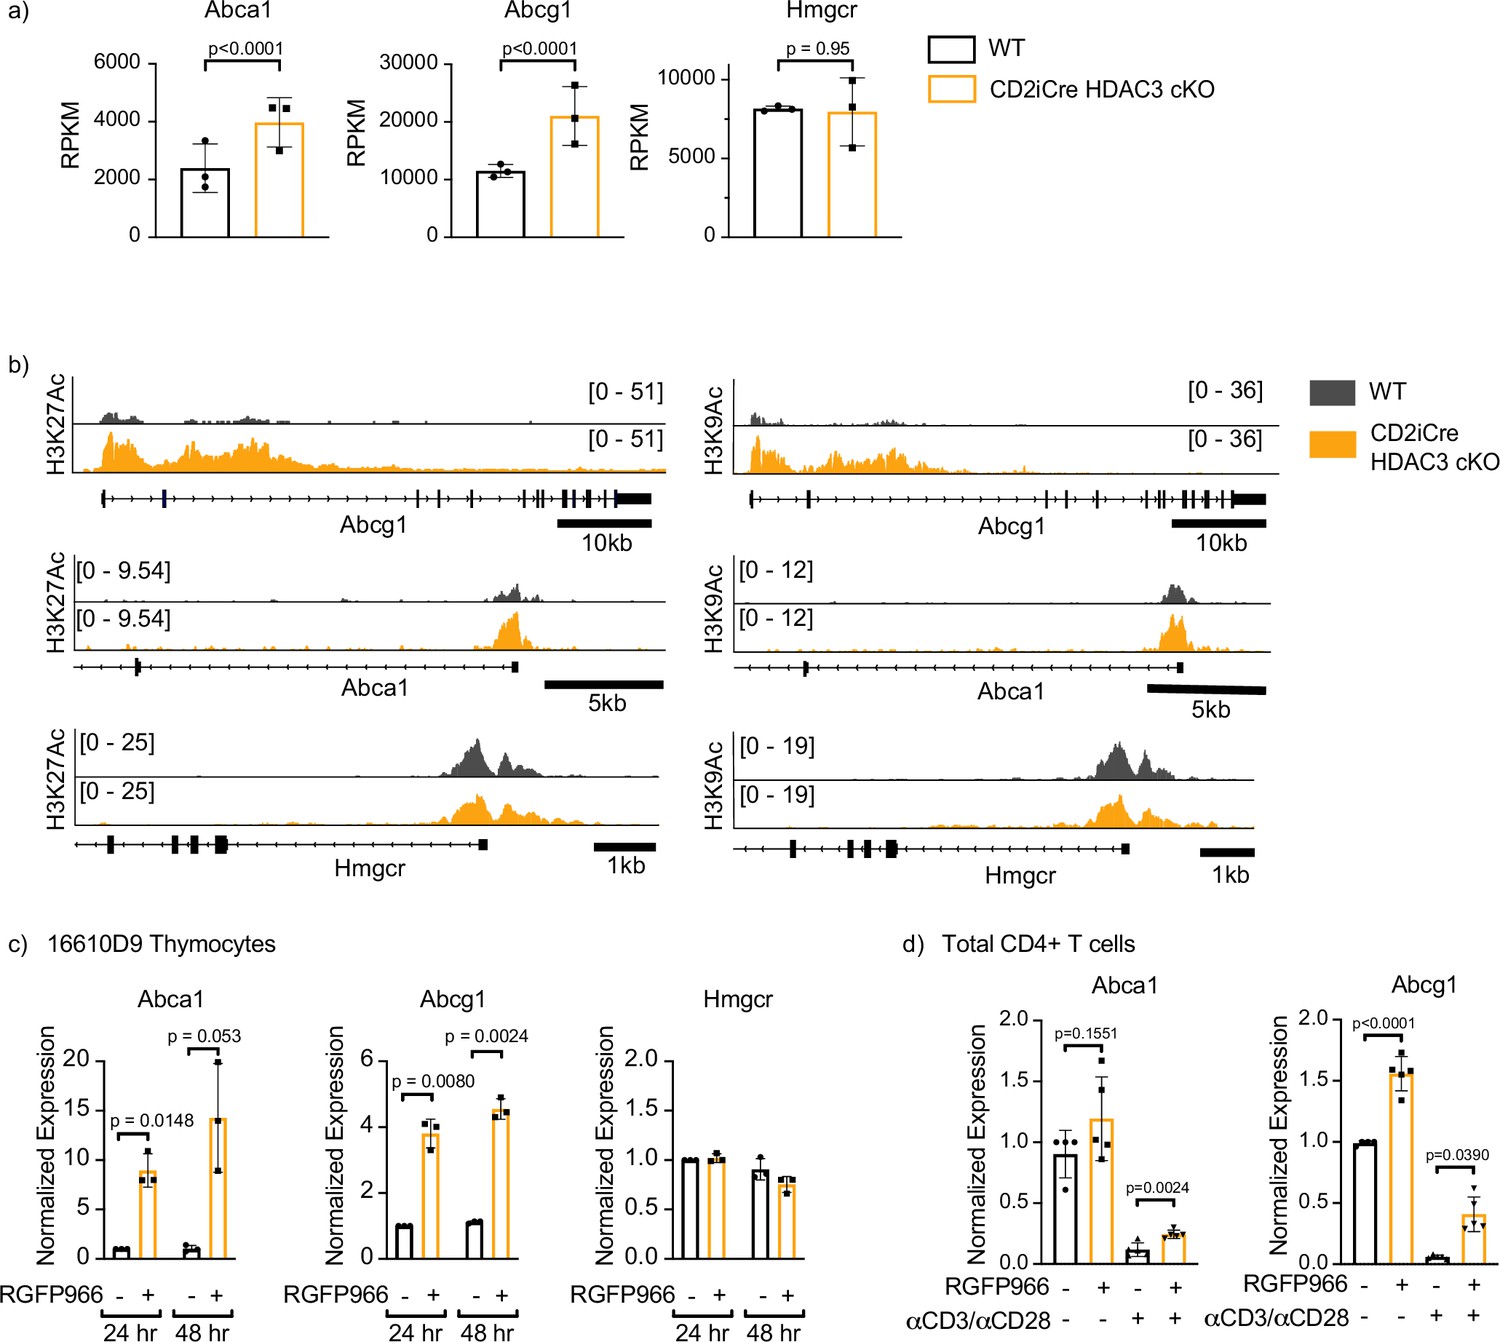
Histone deacetylase 3 (HDAC3) loss results in increased expression and hyperacetylation of ABCA1 and ABCG1.
(a) Gene expression (RNA-Seq) of Abca1, Abcg1, and Hmgcr in selecting (TCRβint CD69+) thymocytes from OT-II and OT-II CD2-iCre HDAC3 cKO mice. Bar graphs show mean RPKM (reads per kilobase million) ± standard deviation (SD). The exactTest (edgeR software) was used to compare mRNA levels (RPKM) from individual genes in RNA-Seq datasets. (b) Snapshot of H3K27Ac (left) and H3K9Ac (right) ChIP-seq tracks for the Abca1, Abcg1, and Hmgcr loci in selecting thymocytes from OT-II (wild-type, WT) and OT-II CD2-iCre HDAC3 cKO (CD2-iCre HDAC3-cKO) mice. (c) 16610D9 thymocytes were treated with competitive HDAC3 inhibitor RGFP966 for 24 or 48 hr, and expression of Abca1, Abcg1, and Hmgcr was measured by RT-qPCR at timepoints. Bar graphs show mean expression ± SD (n = 3 from three independent experiments). Statistical significance was determined for all indicated comparisons using an unpaired t-test. (d) WT splenocytes were harvested and magnetically enriched for CD4+ T cells. Cells were cultured with 5 µg of plate-bound αCD3 and 1 µg/ml of αCD28 or left unstimulated. Cells were also treated with competitive inhibitor of HDAC3 RGFP966. After 24 hr, expression of Abca1 and Abcg1 was examined by RT-qPCR. Bar graphs show mean expression ± SD (n = 4–5 mice/group from three independent experiments).
Figure 7—figure supplement 1
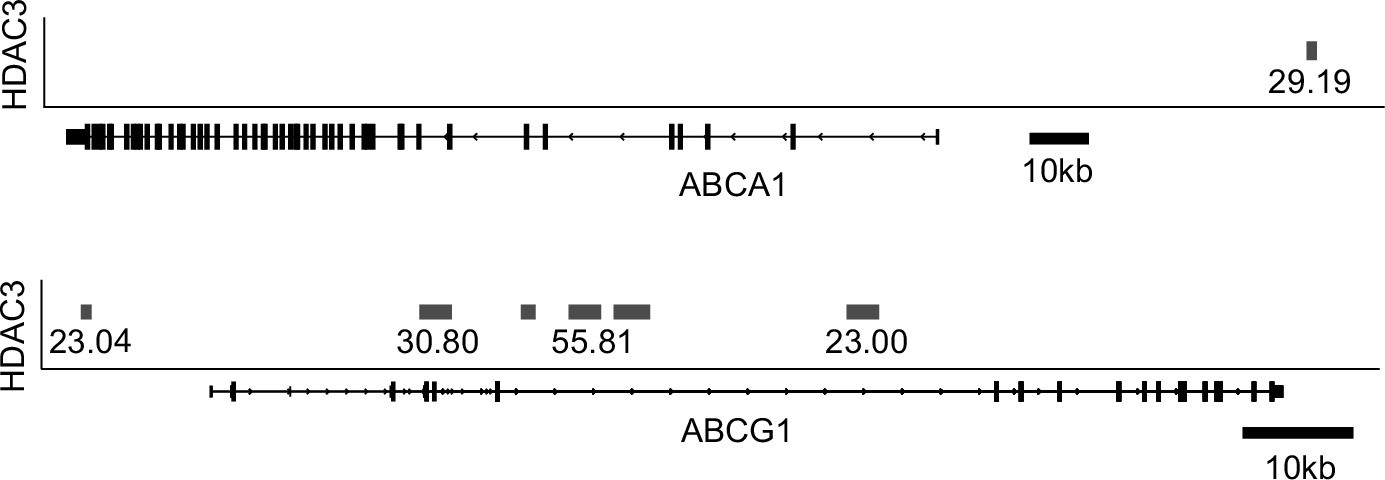
Histone deacetylase 3 (HDAC3) binds to Abcg1 gene locus, upstream of the Abca1 locus in human CD4+ T cells.
Bedgraph from GSM393952 showing called peaks (gray bars) from HDAC3 ChIP-Seq in human CD4+ T cells. Value of peak height is listed below the bars.
Author response image 1
Tables
Appendix 1—key resources table
| Reagent type (species) or resource | Designation | Source or reference | Identifiers | Additional information |
|---|---|---|---|---|
| Strain, strain background (M. musculus) | Hdac3flox | Scott Hiebert | MGI: 379477 | PMID:18406327 |
| Strain, strain background (M. musculus) | dLck-Cre | Jackson Laboratory # 012837 | MGI: 4819511 | PMID:11748274 |
| Strain, strain background (M. musculus) | Cd4-Cre | Jackson Laboratory # 017336 | MGI: 2386448RRID:IMSR_JAX:017336 | PMID:11728338 |
| Strain, strain background (M. musculus) | Rag1-GFP | Nobuo Sakaguchi | MGI: 2388344 | PMID:10586023 |
| Strain, strain background (M. musculus) | Cd2-iCre | Jackson Labs # 008520 | MGI: 2449947RRID:IMSR_JAX:008520 | PMID:12548562 |
| Cell line (M. musculus) | 16610D9 | Stephen Hedrick | RRID:CVCL_0111 | PMID:10587351 |
| Antibody | Anti-CD4 PerCP (rat monoclonal) | Biolegend | Cat #100538RRID:AB_893325 | Flow cytometry (1:500) |
| Antibody | Anti-CD4, BV510 (rat monoclonal) | Biolegend | Cat #100559 RRID:AB_2562608 | Flow cytometry (1:1000) |
| Antibody | Anti-CD55 af647 (Armenian hamster monoclonal) | Biolegend | Cat #131806 RRID:AB_1279261 | Flow cytometry (1:200) |
| Antibody | Anti-CD45RB Pacific Blue (rat monoclonal) | Biolegend | Cat #103316 RRID:AB_2174405 | Flow cytometry (1:200) |
| Antibody | Anti-CD8a BV510 (rat monoclonal) | Biolegend | Cat #100752 RRID:AB_2563057 | Flow cytometry (1:200) |
| Antibody | Anti-HDAC3 (rabbit monoclonal) | Cell Signaling | Cat #85057S RRID:AB_2800047 | Flow cytometry (1:1500) |
| Antibody | Anti-HDAC3 (mouse monoclonal) | Cell Signaling | Cat #3949S RRID:AB_2118371 | Flow cytometry (1:1000) |
| Antibody | Anti-TCRβ FITC (Armenian hamster monoclonal) | Biolegend | Cat #109206 RRID:AB_313429 | Flow cytometry (1:500) |
| Antibody | Anti-CD62L APC-Cy7 (rat monoclonal) | Tonbo Biosciences | Cat #25-0621U100 RRID:AB_2893432 | Flow cytometry (1:200) |
| Antibody | Anti-CD62L BV510 (rat monoclonal) | Biolegend | Cat #104441 RRID:AB_2561537 | Flow cytometry (1:200) |
| Antibody | Anti-CD44 BV510 (rat monoclonal) | Biolegend | Cat #103043 RRID:AB_2561391 | Flow cytometry (1:200) |
| Antibody | Anti-CD44 BV785 (rat monoclonal) | Biolegend | Cat #103041 RRID:AB_11218802 | Flow cytometry (1:200) |
| Antibody | Anti-CD44 v450 (rat monclonal) | Tonbo Biosciences | Cat #75-0441U025 RRID:AB_2621946 | Flow cytometry (1:200) |
| Antibody | Anti-Tbet PE-Cy7 (mouse monoclonal) | Biolegend | Cat #644824 RRID:AB_2561761 | Flow cytometry (1:100) |
| Antibody | Anti-GATA3 eFluor 660 (rat monoclonal) | eBioscience | Cat #50-9966-42 RRID:AB_10596663 | Flow cytometry (1:100) |
| Antibody | Anti-RORγt BV421 (mouse monoclona) | BD Horizon | Cat #562894 RRID:AB_2687545 | Flow cyotmetry (1:100) |
| Antibody | Anti-RORγt PE (rat monoclonal) | eBioscience | Cat #12-6981-82 RRID:AB_10807092 | Flow cytometry (1:100) |
| Antibody | Anti-Foxp3 Biotin (rat monoclonal) | eBioscience | Cat #13-5773-82 RRID:AB_763540 | Flow cytometry (1:100) |
| Antibody | Anti-Foxp3 PE (rat monclonal) | Tonbo Biosciences | Cat #50-5773U100 RRID:AB_11218868 | Flow cytometry (1:100) |
| Antibody | AAnti-CD25 PE-Cy7 (rat monoclonal) | Biolegend | Cat #102016 RRID:AB_312865 | Flow cytometry (1:500) |
| Antibody | Anti-PD-1 FITC (Armenian hamster monoclonal) | eBioscience | Cat #11-9985-85 RRID:AB_465473 | Flow cytometry (1:100) |
| Antibody | Anti-IL-4 BV421 (rat monoclonal) | Biolegend | Cat #504120 RRID:AB_2562102 | Flow cytometry (1:100) |
| Antibody | Anti-IFNγ FITC (rat monoclonal) | Invitrogen | Cat #RM9001 RRID:AB_10375014 | Flow cytometry (1:100) |
| Antibody | Anti-IL-17A Af488 (rat monoclonal) | Biolegend | Cat #506910 RRID:AB_536012 | Flow cytometry (1:100) |
| Antibody | Anti-CXCR5 BV421 (rat monoclonal) | Biolegend | Cat #145512 RRID:AB_2562128 | Flow cytometry (1:100) |
| Antibody | Anti-Bcl6 PE (mouse monoclonal) | Biolegend | Cat #648304 RRID:AB_2561375 | Flow cytometry (1:200) |
| Antibody | Anti-TNF-α PE (rat monoclonal) | Biolegend | Cat #506306 RRID:AB_315427 | Flow cytometry (1:100) |
| Antibody | Anti-IL-2 PE (rat monoclonal) | Biolegend | Cat #503808 RRID:AB_315302 | Flow cytometry (1:100) |
| Antibody | Anti-Egr2 PE (rat monoclonal) | eBioscience | Cat #12-6691-82 RRID:AB_10717804 | Flow cytometry (1:100) |
| Antibody | Anti-p-S6 (rabbit monoclonal) | Cell Signaling | Cat #5364S RRID:AB_10694233 | Flow cytometry (1:100) |
| Antibody | Anti-CD69 (Armenian hamster monoclonal) | Biolegend | Cat #104512 RRID:AB_493564 | Flow cytomery (1:200) |
| Antibody | Anti-P2RX7 (rabbit polyclonal) | Enzo Life Sciences | Cat #ALX-215-035R100RRID:AB_2052434 | Flow cytometry (1:100) |
| Antibody | Anti-CD3 (Armenian hamster monoclonal) | Bio X Cell | Cat #BE0001-1 RRID:AB_1107634 | Stimulation of cultured cells (coated plate 3 hr at 37°C) |
| Antibody | Anti-CD28 (syrian hamster monoclonal) | Bio X Cell | Cat # BE0015-1 RRID:AB_1107624 | Stimulation of cultured cells (soluble) |
| Antibody | Anti IL-4 (rat monoclonal) | Bio X Cell | Cat #BE0045 RRID:AB_1107707 | Blocking for in vitro differentiation assays |
| Antibody | Anti-IFNγ (rat monoclonal) | Bio X Cell | Cat #BE0055 RRID:AB_1107694 | Blocking for in vitro differentiation assays |
| Antibody | Anti-IL-12 (rat monoclonal) | Bio X Cell | Cat #BE0233 AB_2687715 | Blocking for in vitro differentiation assays |
| Peptide, recombinant protein | TGF-β1 | PeproTech | Cat #100-21 | In vitro differentiation assays |
| Peptide, recombinant protein | IL-12 | PeproTech | Cat #210-12 | In vitro differentiation assays |
| Peptide, recombinant protein | IL-4 | PeproTech | Cat #214-14 | In vitro differentiation assays |
| Peptide, recombinant protein | IL-23 | PeproTech | Cat #200-23 | In vitro differentiation assays |
| Peptide, recombinant protein | IL-6 | PeproTech | Cat #216-16 | In vitro differentiation assays |
| Peptide, recombinant protein | IL-2 | PeproTech | Cat #212-12 | In vitro differentiation assays |
| Chemical compound, drug | Methyl-β-cyclodextrin-cholesterol | Millipore Sigma | Cat #C4951 | |
| Chemical compound, drug | Filipin III | Millipore Sigma | Cat #F4767 | Flow cytometry (1:100) |
| Chemical compound, drug | Cholera Toxin Subunit B – Af488 | Thermo Fisher | Cat #C34775 | Flow cytometry (1:200) |
| Commercial assay or kit | BD Fix/Perm Buffer Kit (Phosflow) | BD Biosciences | Cat #558049; 558050 | |
| Commercial assay or kit | Foxp3/ Transcription Factor Staining Buffer Kit | Tonbo Biosciences | Cat #TNB-0607-KIT | |
| Chemical compound, drug | CFSE | Sigma | Cat #21888 | |
| Commercial assay or kit | EasySep Mouse Streptavadin Rapidspheres Isolation Kit | StemCell | Cat #19860 | |
| Antibody | Anti-CD8 Biotin (rat monoclonal) | Biolegend | Cat #100704 RRID:AB_312743 | Magnetic Enrichment – Negative Selection (1:100) |
| Antibody | Anti-TCRγδ Biotin (Armenian hamster monoclonal) | eBioscience | Cat #13-5811-85RRID:AB_466685 | Magnetic Enrichment – Negative Selection (1:100) |
| Antibody | Anti-NK1.1 Biotin (mouse monoclonal) | Bioegend | Cat #13-5941-85 RRID:AB_466805 | Magnetic Enrichment – Negative Selection (1:100) |
| Antibody | Anti-B220 Biotin (rat monoclonal) | eBioscience | Cat #13-0452-85 RRID:AB_466450 | Magnetic Enrichment – Negative Selection (1:100) |
| Antibody | Anti-CD11b Biotin (rat monoclonal) | Bioegend | Cat #101207 RRID:AB_312787 | Magnetic Enrichment – Negative Selection (1:100) |
| Antibody | Anti-CD19 Biotin (rat monoclonal) | Bioegend | Cat #115503 RRID:AB_313638 | Magnetic Enrichment – Negative Selection (1:100) |
| Antibody | Anti-Cd11c Biotin (Armenian hamster monoclonal) | Bioegend | Cat #117303 RRID:AB_313772 | Magnetic Enrichment – Negative Selection (1:100) |
| Antibody | Anti-Gr-1 Biotin (rat monoclonal) | Bioegend | Cat #117303 RRID:AB_313368 | Magnetic Enrichment – Negative Selection (1:100) |
| Antibody | Anti-Ter-119 Biotin (rat monoclonal) | Bioegend | Cat #116203 RRID:AB_313704 | Magnetic Enrichment – Negative Selection (1:100) |
| Other | Fixable Viability Dye Ghost 510 | Tonbo Biosciences | Cat #13-0870 | Flow cytometry (1:1000) |
| Other | Fixable Viability Ghost 780 | Tonbo Biosciences | Cat #13-0865 | Flow cytometry (1:1000) |
| Other | Fixable Viability Dye Ghost 510 | Tonbo Biosciences | Cat #13-0870 | Flow cytometry (1:1000) |
| Commercial assay or kit | Seahorse XF Cell Mito Stress Test Kit | Agilent | Cat #103015-100 | |
| Sequence-based reagent | Srebf1 | Thermo Fisher Scientific | #Mm00550338_m1 | |
| Sequence-based reagent | Srebf2 | Thermo Fisher Scientific | #Mm01306292_m1 | |
| Sequence-based reagent | Idi1 | Thermo Fisher Scientific | #Mm01337454_m1 | |
| Sequence-based reagent | Sqle | Thermo Fisher Scientific | #Mm00436772_m1 | |
| Sequence-based reagent | Nr1h2 | Thermo Fisher Scientific | #Mm00437265_g1 | |
| Sequence-based reagent | Sult2b1 | Thermo Fisher Scientific | #Mm00450550_m1 | |
| Sequence-based reagent | ldlr | Thermo Fisher Scientific | #Mm00440169_m1 | |
| Sequence-based reagent | Abcc1 | Thermo Fisher Scientific | #Mm01344332_m1 | |
| Sequence-based reagent | Dhcr7 | Thermo Fisher Scientific | #Mm00514571_m1 | |
| Sequence-based reagent | Hmgcr | Thermo Fisher Scientific | #Mm01282499_m1 | |
| Sequence-based reagent | Abcg1 | Thermo Fisher Scientific | #Mm00437390_m1 | |
| Sequence-based reagent | Abca1 | Thermo Fisher Scientific | #Mm00442646_m1 | |
| Sequence-based reagent | hmgcr | Thermo Fisher Scientific | Mm01282499_m1 | |
| Sequence-based reagent | 18S | Applied Biosystems | Cat #4352930 | |
| Software, algorithm | Prism 8 | GraphPad | RRID:SCR_002798 | |
| Software, algorithm | FlowJo v10 | Treestar | RRID:SCR_008520 | |
| Software, algorithm | Illustrator | Adobe | RRID:SCR_010279 | |
| Software, algorithm | IGV | Broad Institute | RRID:SCR_011793 |
Additional files
Download links
A two-part list of links to download the article, or parts of the article, in various formats.
Downloads (link to download the article as PDF)
Open citations (links to open the citations from this article in various online reference manager services)
Cite this article (links to download the citations from this article in formats compatible with various reference manager tools)
Histone deacetylase 3 represses cholesterol efflux during CD4+ T-cell activation
eLife 10:e70978.
https://doi.org/10.7554/eLife.70978


