Ssl2/TFIIH function in transcription start site scanning by RNA polymerase II in Saccharomyces cerevisiae
- Department of Biological Sciences, University of Pittsburgh, United States
- Department of Genetics and Waksman Institute, Rutgers University, United States
- Department of Molecular Biology and Genetics, Cornell University, United States
Figures
Figure 1 with 1 supplement
Genetic screening identifies novel ssl2 alleles with transcriptional defects.
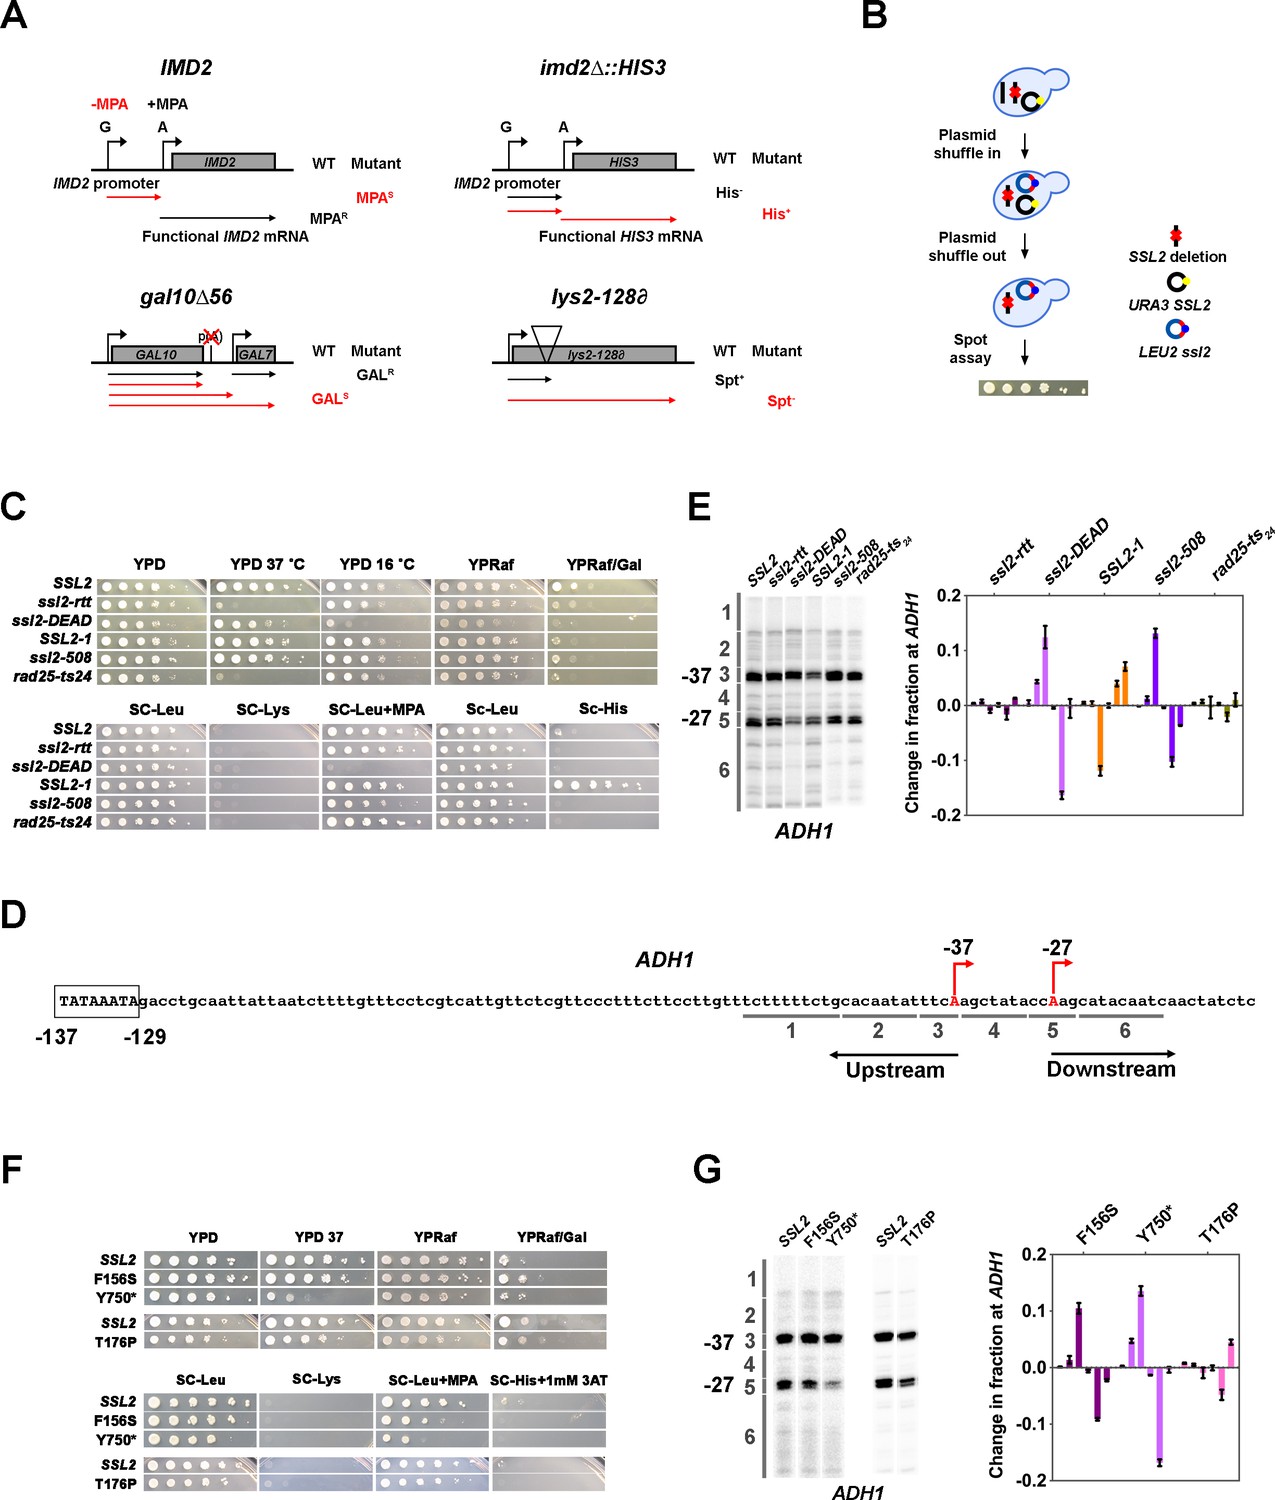
(A) Schematics illustrating four transcriptional phenotypes utilized in this study (IMD2, imd2Δ::HIS3, gal10∆56, lys2-128∂). (IMD2) In GTP replete conditions, IMD2 transcription initiates at upstream transcription start sites (TSSs) utilizing GTP as the first nucleotide. These are non-functional due to the presence of a terminator prior to the IMD2 coding sequence. Upon GTP starvation induced by the drug mycophenolic acid (MPA), initiation shifts to a downstream ATP-initiated TSS, enabling functional IMD2 expression, conferring resistance to MPA. Inability to shift to the downstream IMD2 TSS in the presence of MPA leads to MPA sensitivity (MPAS), commonly found in mutants that shift TSSs upstream. (imd2Δ::HIS3) The IMD2 ORF is replaced by the HIS3 ORF creating a transcriptional fusion between the IMD2 promoter and HIS3. If the downstream IMD2 TSS is used constitutively, HIS3 mRNA production supports growth on medium lacking histidine (SC-His). Constitutive use of the downstream IMD2 start site by downstream TSS shifting mutants in the absence of MPA can be detected by a His+ phenotype in cells with the imd2∆::HIS3 reporter. (gal10∆56) Deletion of GAL10 polyadenylation signal at p(A) site interferes with GAL10 3’-end formation and GAL7 initiation, resulting in galactose toxicity (Nogales and Greber, 2019). Transcription mutants that increase GAL10 3’-end formation or GAL7 initiation allow suppression of galactose toxicity and display galactose resistance (GALR). (lys2-128∂) Insertion of a Ty transposon ∂ element into LYS2 causes premature termination of Pol II initiating at LYS2, resulting in lysine auxotrophy. Certain mutants allow expression of LYS2 from a cryptic site within the Ty ∂ element and allow yeast growth on medium lacking lysine (SC-Lys), conferring the ‘Suppressor of Ty’ (Spt-) phenotype. (B) Schematic illustrating the plasmid shuffle assay to examine ssl2 mutant phenotypes (see Materials and methods). (C) Transcription-related growth phenotypes of five classical ssl2 alleles. All spot dilutions shown throughout the figures are representative of at least two independent transformants. (D) Schematic illustrating the TSS region of Saccharomyces cerevisiae ADH1. The ADH1 promoter contains two commonly used TSSs (red letters), which are 37 nt (–37) and 27 nt (–27) upstream from the translational start codon. For quantification of changes to ADH1 TSS distribution by primer extension, ADH1 TSS usage is separated into six bins. (E) Left panel, primer extension-detected TSS usage of the wild-type (WT) and five existing ssl2 mutants at ADH1. Right panel, quantitative analysis of five classical ssl2 alleles at ADH1. Average of ≥3 biological replicates ± standard deviation are shown. (F) Transcription-related growth phenotypes of ssl2 alleles homologous to human disease alleles of XPB. (G) Primer extension detection of TSS usage at ADH1 for alleles shown in (F). Average of ≥3 biological replicates ± standard deviation are shown.
-
Figure 1—source data 1
Figure 1E Primer extension gel (annotated).
- https://cdn.elifesciences.org/articles/71013/elife-71013-fig1-data1-v2.zip
-
Figure 1—source data 2
Figure 1G Primer extension gel (annotated).
- https://cdn.elifesciences.org/articles/71013/elife-71013-fig1-data2-v2.zip
-
Figure 1—source data 3
Figure 1E and G Graph data.
- https://cdn.elifesciences.org/articles/71013/elife-71013-fig1-data3-v2.csv
-
Figure 1—source data 4
Figure 1E Primer extension gel (raw).
- https://cdn.elifesciences.org/articles/71013/elife-71013-fig1-data4-v2.zip
-
Figure 1—source data 5
Figure 1G Primer extension gel (raw).
- https://cdn.elifesciences.org/articles/71013/elife-71013-fig1-data5-v2.zip
Figure 1—figure supplement 1

Growth phenotypes of human disease related and RED motif ssl2 mutants.
(A) Example of transcription start site (TSS) usage quantification at ADH1. Left panel, primer extension detected TSS usage at ADH1 in wild-type (WT) and rpb1 E1103G, an upstream shifting TSS mutant. Middle panel, distribution of WT and mutant TSS signal within six ADH1 bins. Each bin is quantified as the percentage of the total signal in the lane and displayed in a bar graph. Averages of ≥3 biological replicates ± standard deviation are shown. Right panel, quantitative showing the changes of TSS usage in rpb1 E1103G compared to WT. (B) Viability of ssl2 alleles with mutations homologous to human disease but inviability of RED motif substitutions (allele marked as ‘RED’ is a triple substitution of R519A/E520A/D521A).
Figure 2 with 3 supplements
ssl2 alleles have distinct behavior from polymerase II (Pol II) and other general transcription factors (GTFs) alleles for transcription start site (TSS) usage.
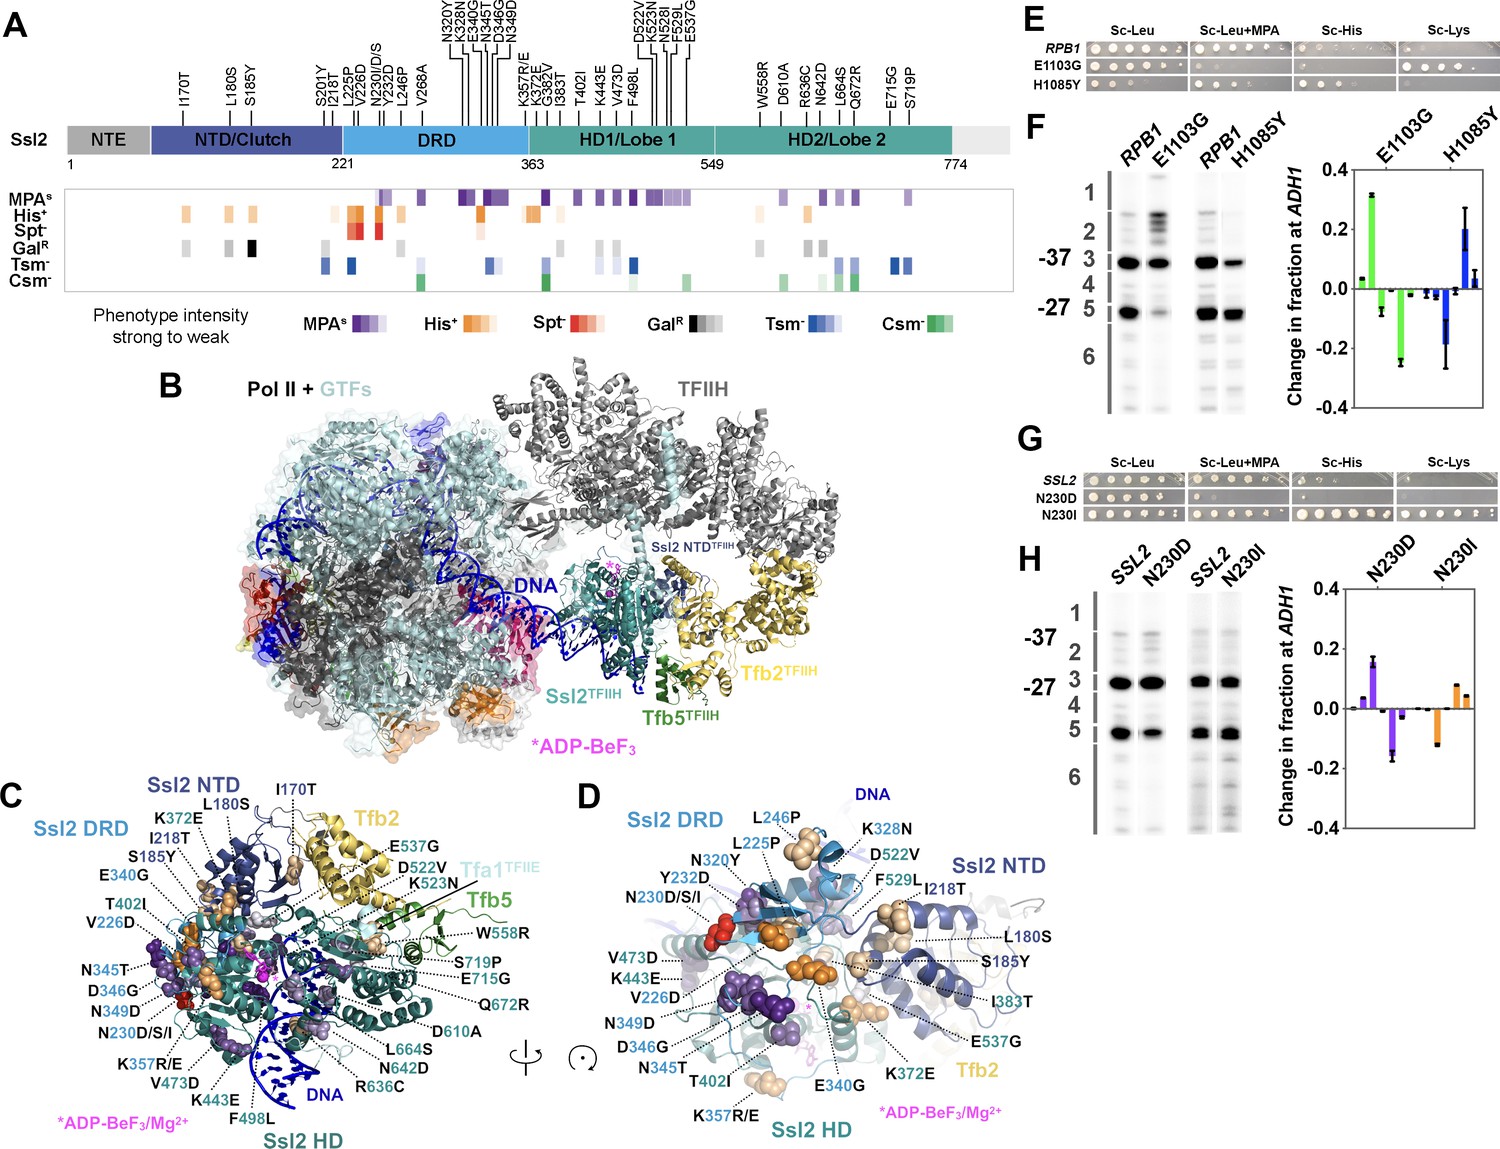
(A) Identified ssl2 substitutions and their phenotypes relative to Ssl2 domains. Structure colored by identified Ssl2 domains as in Greber et al., 2019. Light gray areas in the schematic have not yet been observed in any Ssl2 or homolog structures. (B) Position of Ssl2 relative to TFIIH and Pol II in the yeast PIC (PDB 7O4I). (C) Identified substituted residues illustrated as spheres on cartoon of the Ssl2 structure from (B). Residue numbers are color-coded by Ssl2 domain color from (A). (D) Rotation of (C) illustrating the mutants clustered at NTD/DRD/helicase domain (HD) one interface. (E) Spot assay showing example rpb1 mutant transcription phenotypes. (F) Primer extension and quantification showing rpb1 mutant effects on ADH1 TSS distribution. Color coding of rpb1 allele class in this graph is used throughout the figures. Green bars represent upstream shifting rpb1 alleles when used to annotate figures. Blue bars represent downstream shifting rpb1 alleles. Averages of ≥3 biological replicates ± standard deviation are shown. (G) Spot assay showing example ssl2 mutant transcription phenotypes. (H) Primer extension and quantification showing example ssl2 mutant effects on ADH1 TSS distribution. Color coding of ssl2 allele class in this graph is used throughout the figures. Orange bars represent downstream shifting ssl2 alleles when used to annotate figures. Purple bars represent upstream shifting ssl2 alleles. Averages of ≥3 biological replicates ± standard deviation are shown.
-
Figure 2—source data 1
Figure 2F and H Graph data.
- https://cdn.elifesciences.org/articles/71013/elife-71013-fig2-data1-v2.csv
Figure 2—figure supplement 1

Growth phenotypes of ssl2 mutants.
Growth phenotypes of novel ssl2 mutants illustrated by spotting of serial dilution (10-fold) of strains on different media. Phenotypes and media are as described in Figure 1. Serial dilution phenotypes shown are representative of at least two independent transformants (biological replicates).
Figure 2—figure supplement 2
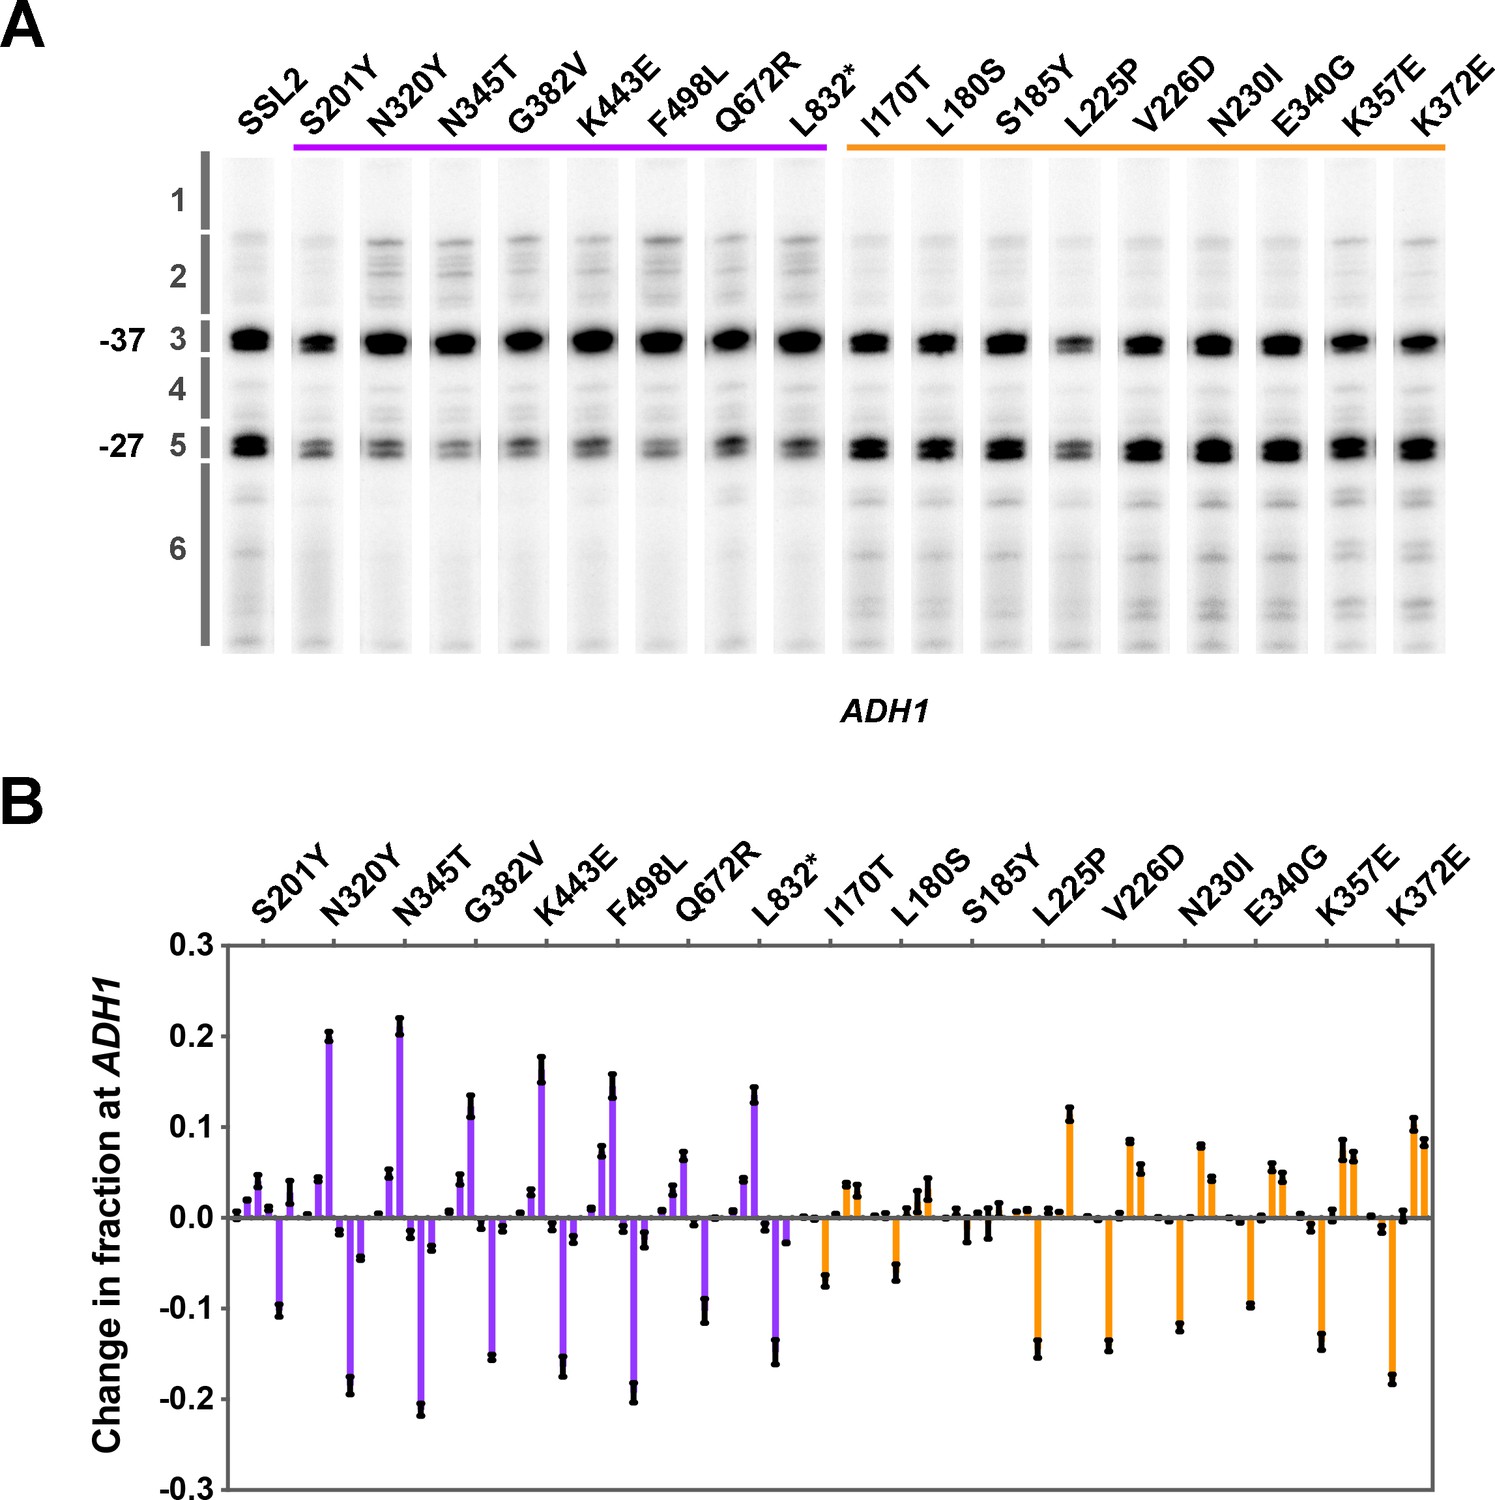
Transcription start site (TSS) usage of representative ssl2 single mutants.
(A) TSS usage for selected ssl2 alleles at ADH1 detected by primer extension. The purple bar indicates mutants showing mycophenolic acid (MPA) sensitivity (upstream shifting) and the orange bar indicates mutants showing the His+ phenotype (downstream shifting). Primer extensions shown are representative of ≥3 independent biological replicates. (B) Quantification of TSS usage for selected ssl2 alleles at ADH1 in (A). Error bars indicate average ± SD of at least three independent biological replicates.
-
Figure 2—figure supplement 2—source data 1
Figure 2—figure supplement 2A Primer extension gel (annotated).
- https://cdn.elifesciences.org/articles/71013/elife-71013-fig2-figsupp2-data1-v2.zip
-
Figure 2—figure supplement 2—source data 2
Figure 2—figure supplement 2A Primer extension gel (annotated).
- https://cdn.elifesciences.org/articles/71013/elife-71013-fig2-figsupp2-data2-v2.zip
-
Figure 2—figure supplement 2—source data 3
Figure 2—figure supplement 2B Graph data.
- https://cdn.elifesciences.org/articles/71013/elife-71013-fig2-figsupp2-data3-v2.csv
-
Figure 2—figure supplement 2—source data 4
Figure 2—figure supplement 2A Primer extension gel (raw).
- https://cdn.elifesciences.org/articles/71013/elife-71013-fig2-figsupp2-data4-v2.zip
-
Figure 2—figure supplement 2—source data 5
Figure 2—figure supplement 2A Primer extension gel (raw).
- https://cdn.elifesciences.org/articles/71013/elife-71013-fig2-figsupp2-data5-v2.zip
Figure 2—figure supplement 3
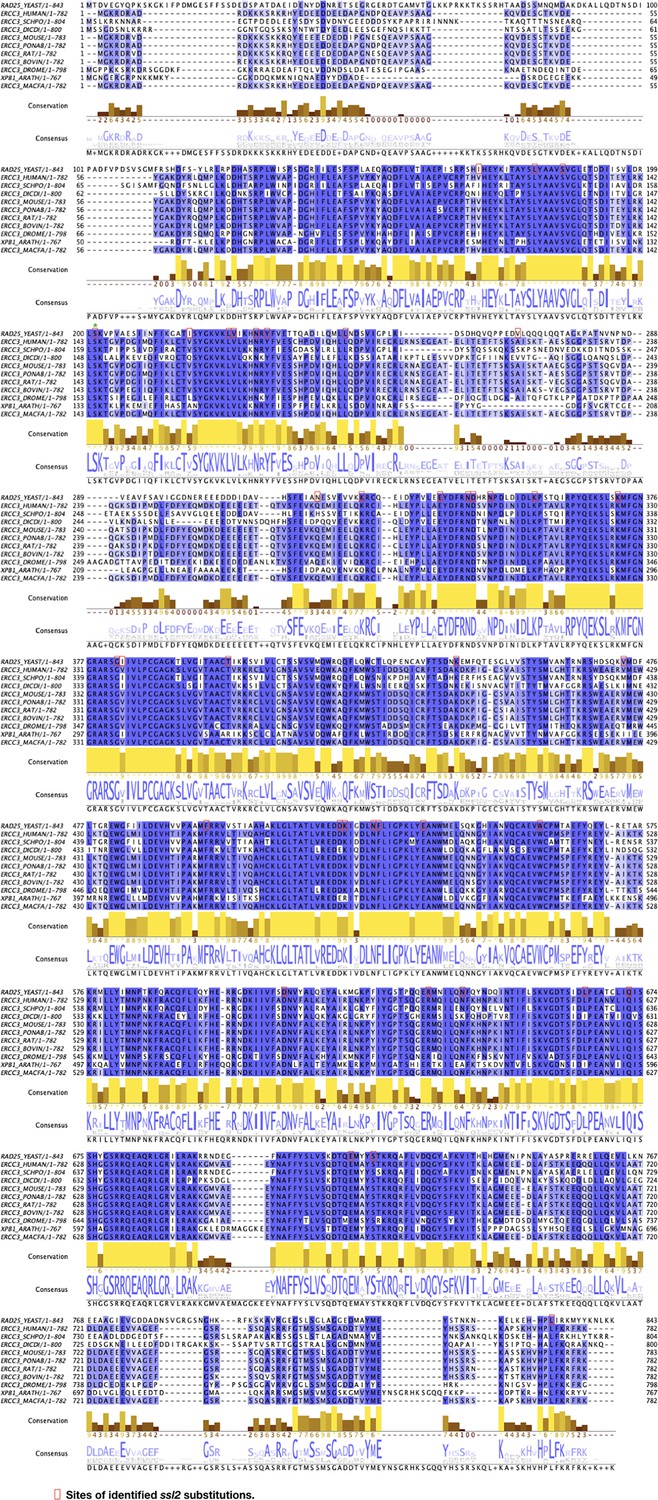
Alignment of Ssl2 homologs illustrating position of substitutions and the conservation of affected residues.
Protein sequences of Ssl2 and homologs from a selection of eukaryotes were aligned and displayed in Jalview. Locations of ssl2 mutations identified in this research were red-boxed on the S. cerevisiae sequence (‘RAD25_YEAST’).
Figure 3 with 1 supplement
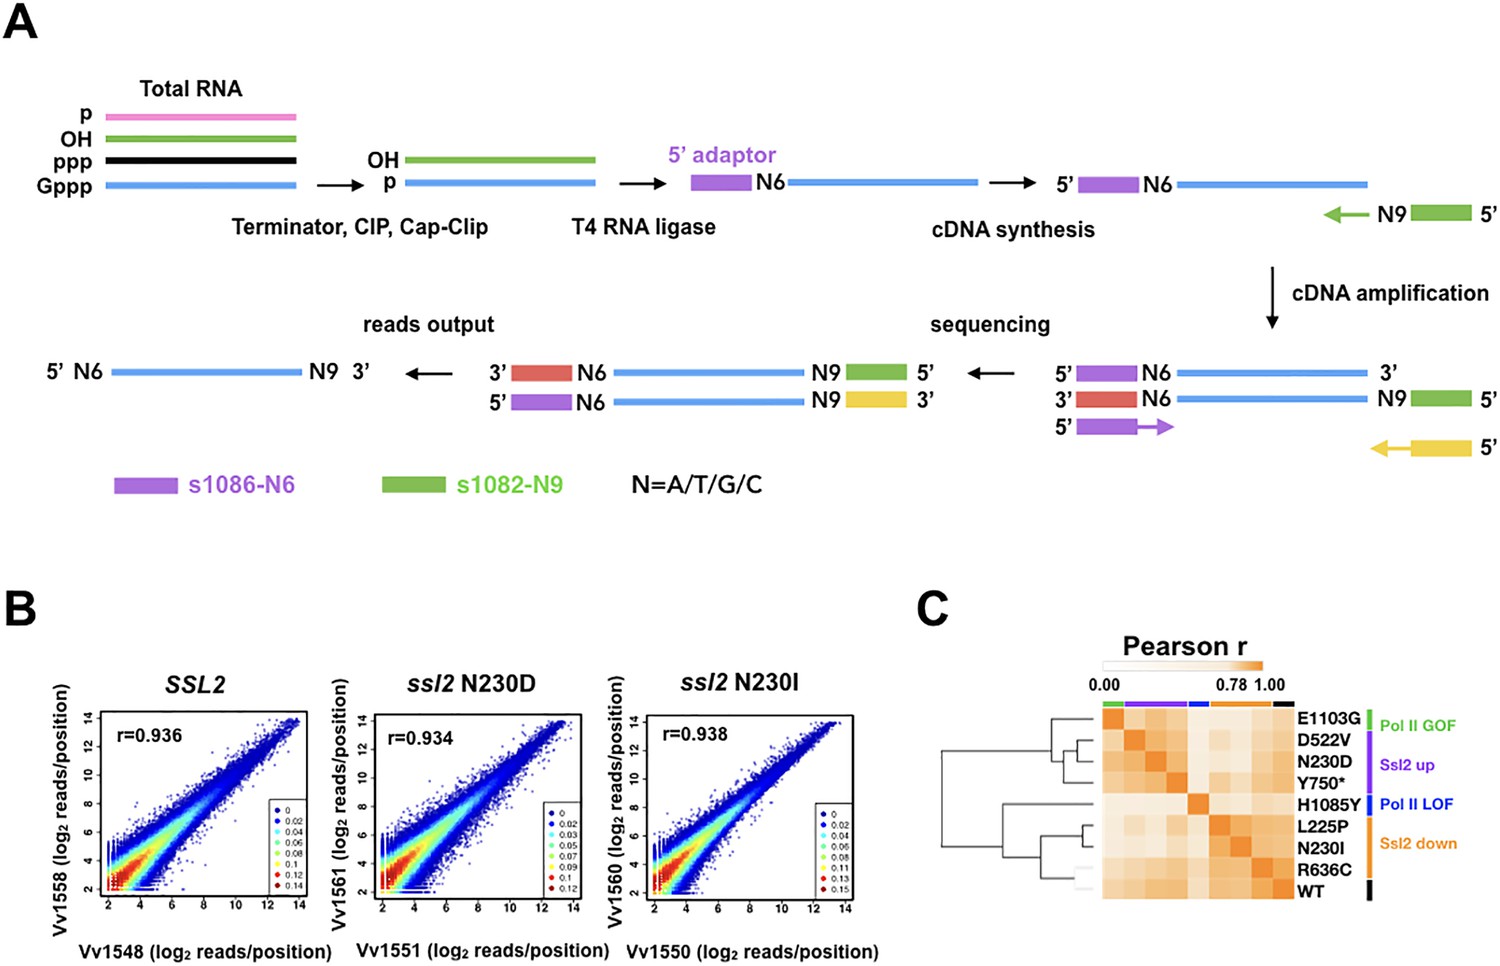
Transcription start site sequencing (TSS-seq) identifies global ssl2 initiation effects.
(A) TSS-seq library construction as in Vvedenskaya et al., 2015. See Materials and methods for details. (B) Scatter plot showing the correlation of log2 transformed reads at individual genome positions for all positions ≥ 3 reads for each library for example replicate pairs for SSL2 wild type (WT), ssl2 N230D, or ssl2 N230I, see Figure supplements for other libraries and description of biological replicates performed for all genotypes. (C) Hierarchical clustering of Pearson r correlation coefficients for libraries of combined biological replicates.
-
Figure 3—source data 1
Figure 3C Heatmap data.
- https://cdn.elifesciences.org/articles/71013/elife-71013-fig3-data1-v2.csv
Figure 3—figure supplement 1
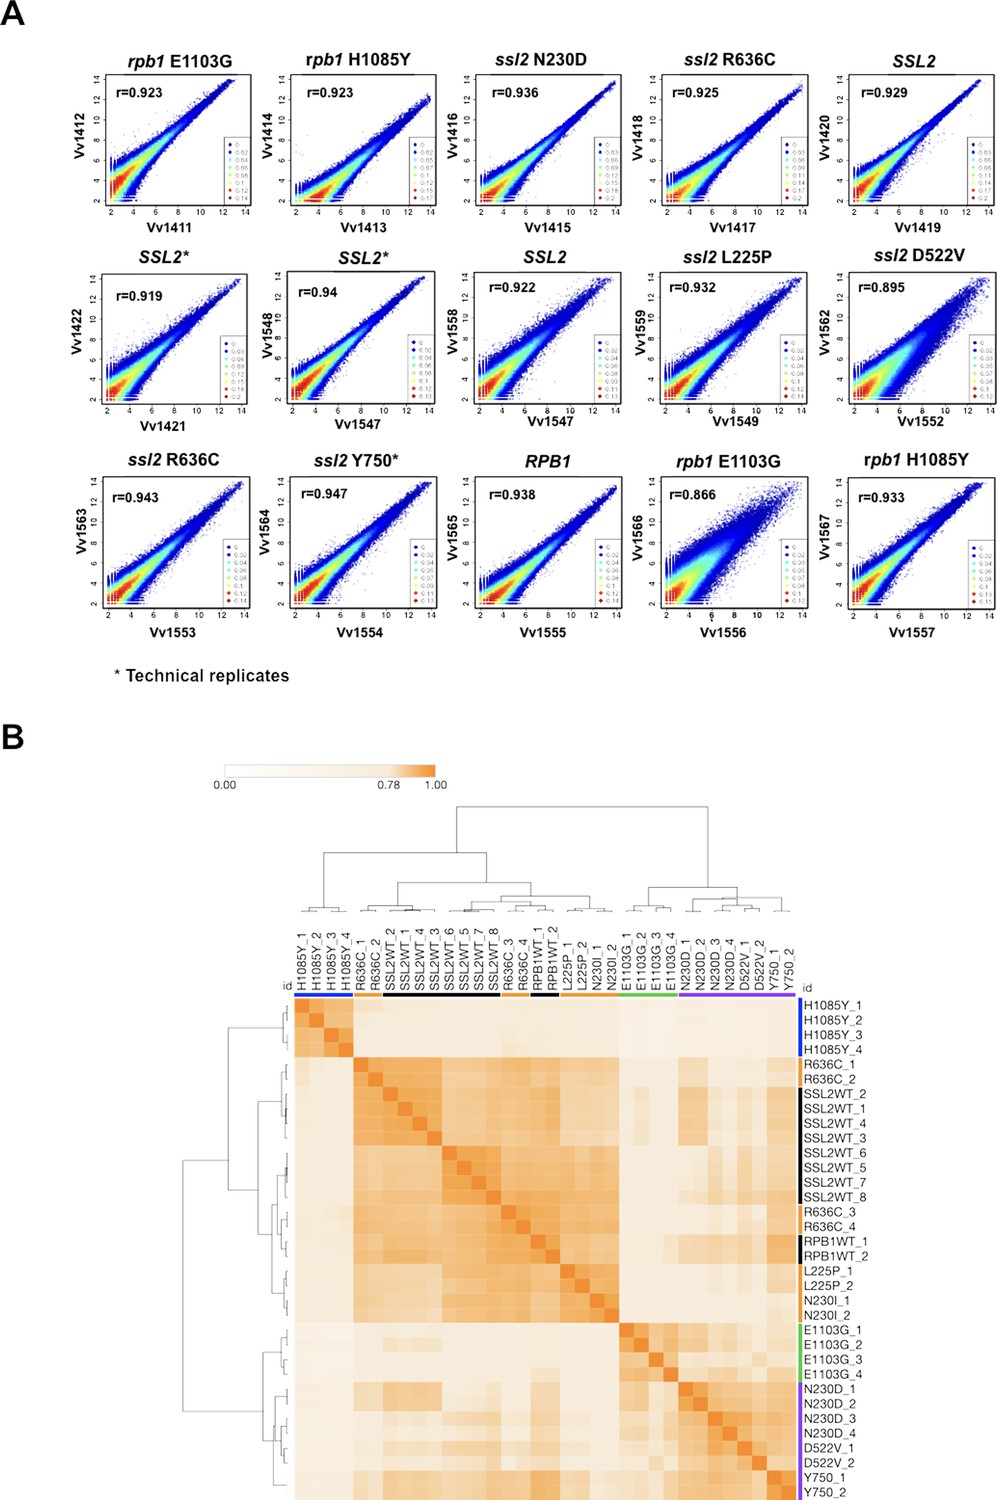
Correlation of read counts between transcription start site sequencing (TSS-seq) replicates at TSSs across the genome.
(A) Scatter plot showing the correlation of sequencing reads across all genome positions for all positions ≥ 3 reads between replicates in ssl2 and polymerase II (Pol II) mutants. (B) Matrix heatmap and the hierarchical clustering of Pearson correlation coefficients between TSS-seq libraries from independent biological replicates labeled by substitution and replicate number (H1085Y and E1103G are rpb1 alleles, all others are ssl2). SSL2WT_2,3,4 are technical replicates as are SSL2WT_5,6,7. All other libraries represent biological replicates. Color bars indicate allele class as described in Figure 1.
-
Figure 3—figure supplement 1—source data 1
Figure 3—figure supplement 1B Heatmap data.
- https://cdn.elifesciences.org/articles/71013/elife-71013-fig3-figsupp1-data1-v2.csv
Figure 4 with 2 supplements
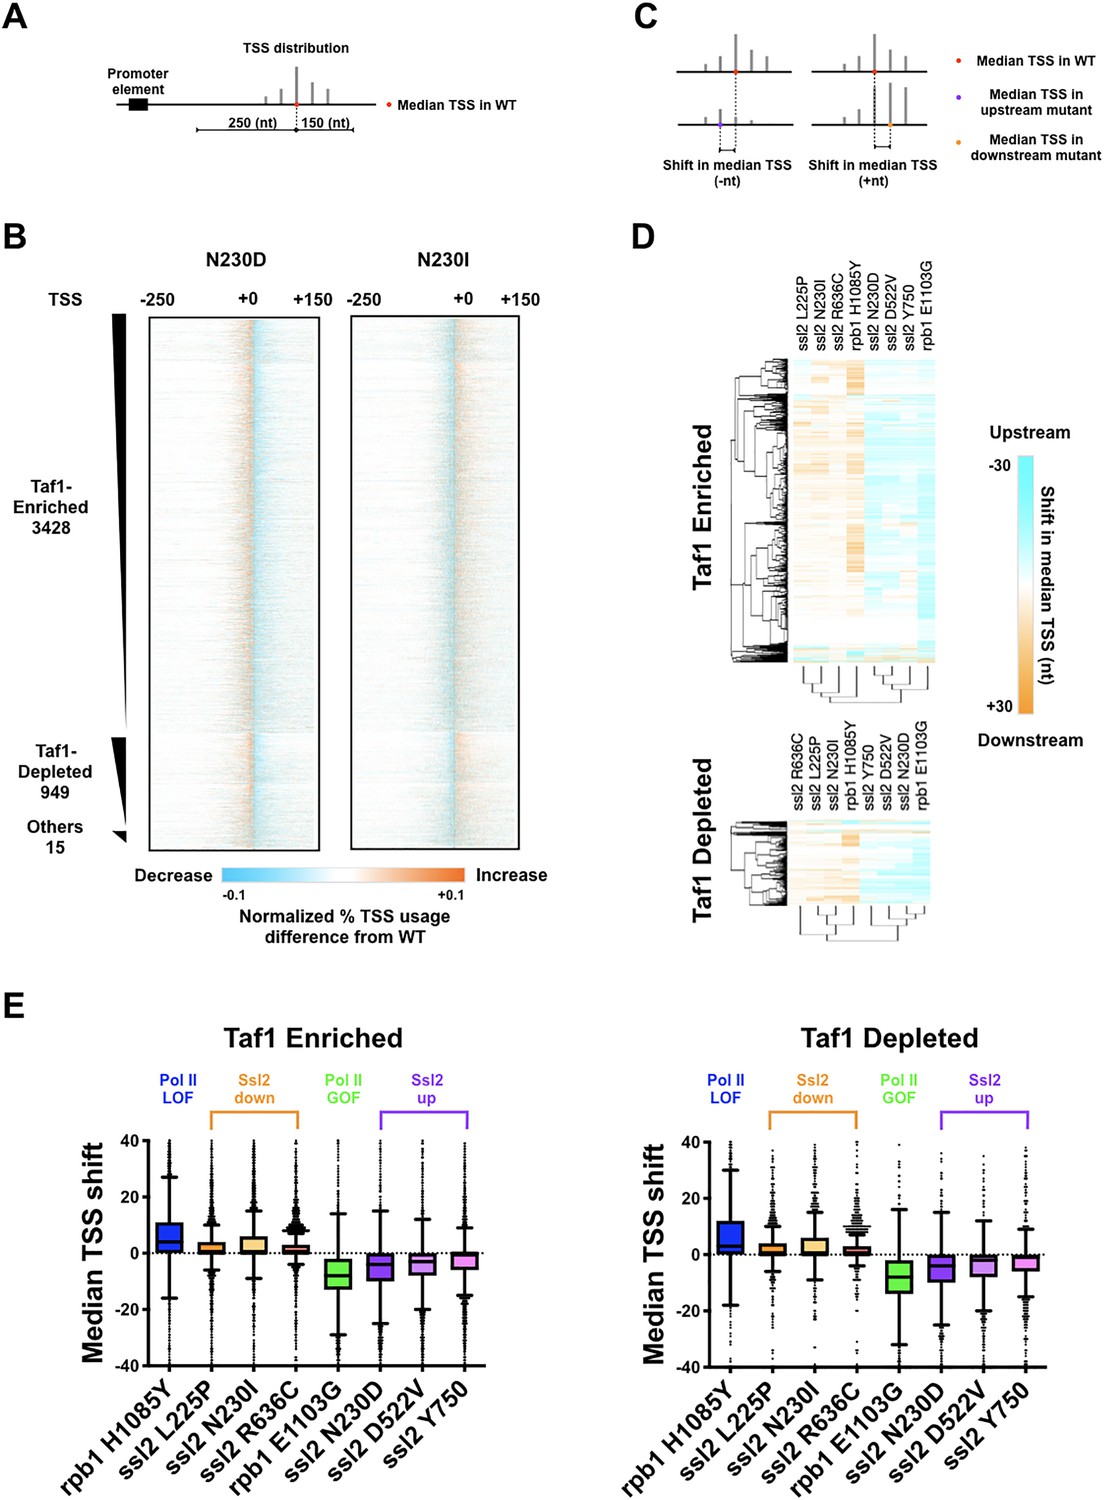
ssl2 alleles shift transcription start site (TSS) distribution genome-wide.
(A) Schematic indicating TSS distribution within a promoter window defined by median of the wild-type (WT) TSS distribution. (B) Heatmaps of TSS normalized read differences between WT and ssl2 mutants within defined promoter windows. Promoter classes defined by enrichment or depletion of Taf1 were rank-ordered according to total reads in WT. The promoter-normalized read differences between mutant and WT are shown by a color scheme ranging from cyan (negative)-orange (positive). (C) Schematic illustrating median TSS upstream or downstream shift in a mutant relative to WT. (D) Heatmap and hierarchical clustering of median TSS shifts for ssl2 or rpb1 mutants for Taf1-enriched or -depleted promoter classes (promoters as in (B)). The shift of median TSS is indicated by cyan (upstream) or orange (downstream). (E) TSS shifts in ssl2 mutants are less strong than in Pol II mutants. Median TSS shifts across promoters, regardless of promoter class are statistically distinguished from zero at p < 0.0001 for all mutants (Wilcoxon signed rank test).
-
Figure 4—source data 1
Figure 4B ssl2 N230D heatmap data.
- https://cdn.elifesciences.org/articles/71013/elife-71013-fig4-data1-v2.csv
-
Figure 4—source data 2
Figure 4B ssl2 N230I heatmap data.
- https://cdn.elifesciences.org/articles/71013/elife-71013-fig4-data2-v2.csv
-
Figure 4—source data 3
Figure 4DE Taf1-enriched heatmap and graph data.
- https://cdn.elifesciences.org/articles/71013/elife-71013-fig4-data3-v2.csv
-
Figure 4—source data 4
Figure 4DE Taf1-depleted heatmap and graph data.
- https://cdn.elifesciences.org/articles/71013/elife-71013-fig4-data4-v2.csv
Figure 4—figure supplement 1
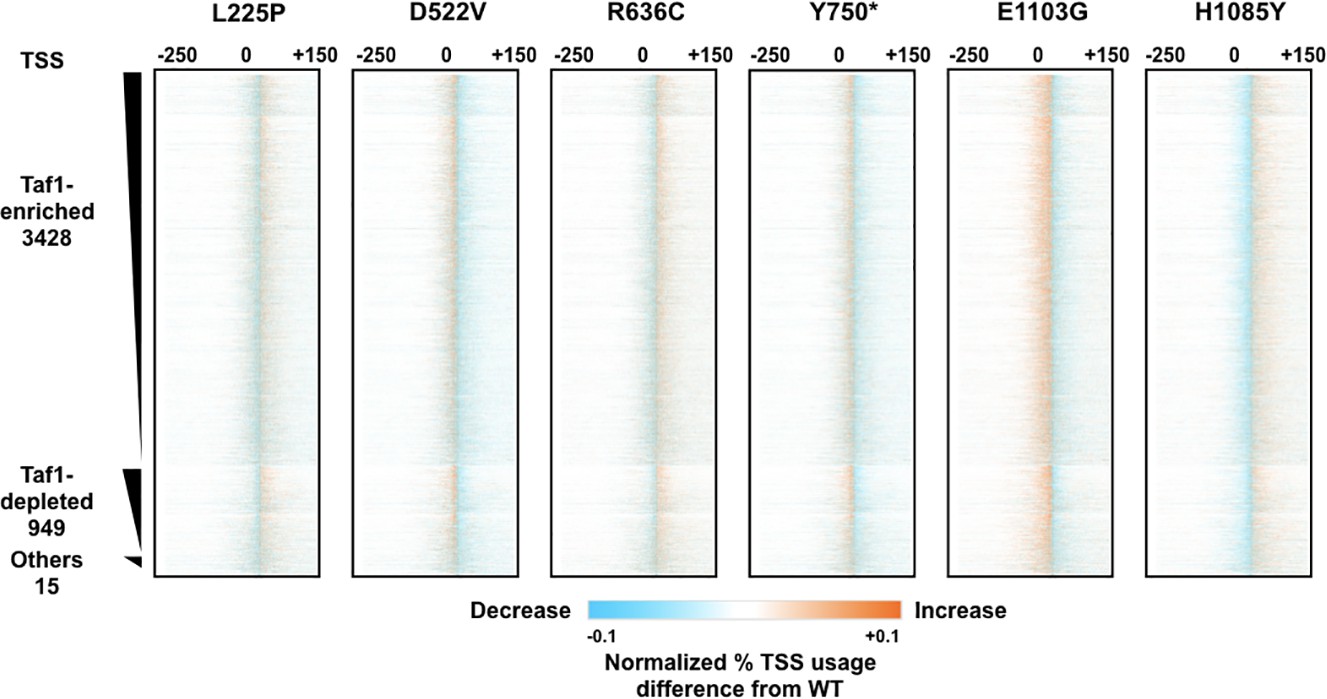
Analysis of transcription start site (TSS) shifts in ssl2 and polymerase II (Pol II) mutants.
Difference heatmaps of TSS distributions between wild-type (WT) and other ssl2 mutants as described in Figure 4B. The number of points in the figure is higher than the resolution so some averaging will be present. Note that the color scale has been set with sensitive thresholds to have effects be more visually obvious.
-
Figure 4—figure supplement 1—source data 1
Figure 4—figure supplement 1 rpb1 E1103G heatmap data.
- https://cdn.elifesciences.org/articles/71013/elife-71013-fig4-figsupp1-data1-v2.csv
-
Figure 4—figure supplement 1—source data 2
Figure 4—figure supplement 1 rpb1 H1085Y heatmap data.
- https://cdn.elifesciences.org/articles/71013/elife-71013-fig4-figsupp1-data2-v2.csv
-
Figure 4—figure supplement 1—source data 3
Figure 4—figure supplement 1 ssl2 L225P heatmap data.
- https://cdn.elifesciences.org/articles/71013/elife-71013-fig4-figsupp1-data3-v2.csv
-
Figure 4—figure supplement 1—source data 4
Figure 4—figure supplement 1 ssl2 D522V heatmap data.
- https://cdn.elifesciences.org/articles/71013/elife-71013-fig4-figsupp1-data4-v2.csv
-
Figure 4—figure supplement 1—source data 5
Figure 4—figure supplement 1 ssl2 R636C heatmap data.
- https://cdn.elifesciences.org/articles/71013/elife-71013-fig4-figsupp1-data5-v2.csv
-
Figure 4—figure supplement 1—source data 6
Figure 4—figure supplement 1 ssl2 Y750* heatmap data.
- https://cdn.elifesciences.org/articles/71013/elife-71013-fig4-figsupp1-data6-v2.csv
Figure 4—figure supplement 2
Analysis of transcription start site (TSS) shifts in ssl2 and polymerase II (Pol II) mutants.
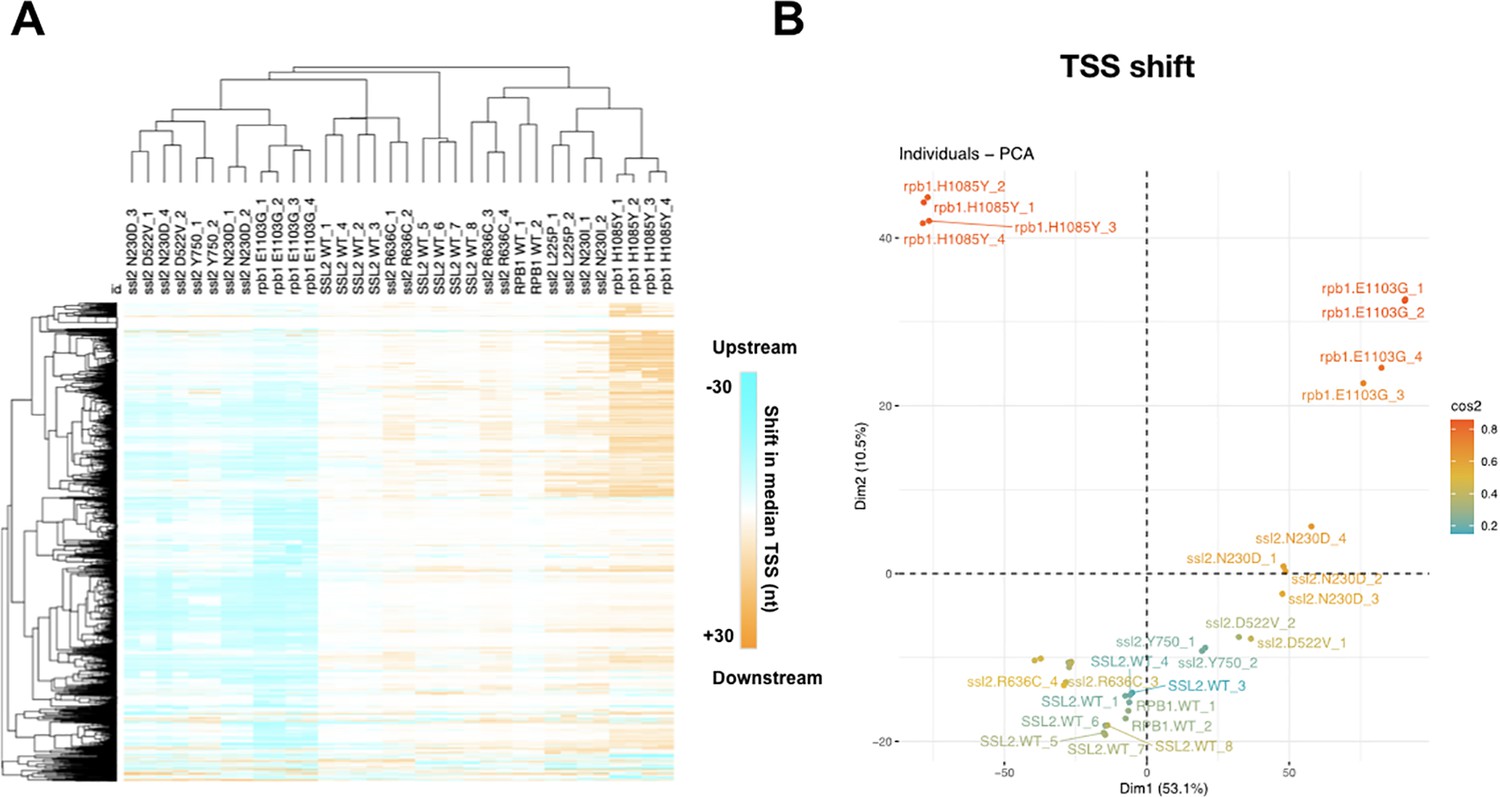
(A) Heatmap and hierarchical clustering of median TSS shifts for ssl2 or rpb1 mutants in individual replicates. As described in Figure 4D except performed for individual replicate TSS sequencing (TSS-seq) libraries. SSL2WT_2,3,4 are technical replicates as are SSL2WT_5,6,7. All other libraries represent biological replicates. (B) Principal component analysis (PCA) for median TSS shift of ssl2 and Pol II mutants in individual replicate TSS-seq libraries. TSS-seq libraries are separated into five major classes (ssl2 upstream and downstream mutants, WT, Pol II upstream and downstream mutants) by the first dimension consistent with direction of shift, and the second dimension consistent with the different genes.
-
Figure 4—figure supplement 2—source data 1
Figure 4—figure supplement 2A Heatmap data.
- https://cdn.elifesciences.org/articles/71013/elife-71013-fig4-figsupp2-data1-v2.csv
Figure 5 with 2 supplements

Distinct alterations to transcription start site (TSS) distribution in ssl2 mutants.
(A) Schematic illustrating TSS ‘spread’ reflecting the distance encompassing 80% of TSSs in a promoter window and the measurement of mutant changes in TSS spread. (B) TSS spreads in ssl2 and Pol II mutants at Taf1-enriched or -depleted promoters. All mutants show a statistical difference in medians from wild type (WT) at p < 0.05 (Kruskal-Wallis test with Dunn’s multiple comparisons test). Asterisks indicate differences in means from WT (*p < 0.05, **p < 0.01, ***p < 0.005, ****p < 0.001). (C) Heatmap showing TSS spread changes for ssl2 or rpb1 mutants by promoter class (hierarchical clustering by mutant on the x-axis and promoter on the y-axis). (D) ssl2 upstream and downstream shifting mutants narrow and widen TSS distributions at promoters as measured in (A). The median TSS spread changes of all the ssl2 and Pol II mutants are statistically distinguished from zero at p < 0.0001 (Wilcoxon signed rank test).
-
Figure 5—source data 1
Figure 5B Taf1-enriched graph data.
- https://cdn.elifesciences.org/articles/71013/elife-71013-fig5-data1-v2.csv
-
Figure 5—source data 2
Figure 5B Taf1-depleted graph data.
- https://cdn.elifesciences.org/articles/71013/elife-71013-fig5-data2-v2.csv
-
Figure 5—source data 3
Figure 5CD Taf1-enriched heatmap and graph data.
- https://cdn.elifesciences.org/articles/71013/elife-71013-fig5-data3-v2.csv
-
Figure 5—source data 4
Figure 5CD Taf1-depleted heatmap and graph data.
- https://cdn.elifesciences.org/articles/71013/elife-71013-fig5-data4-v2.csv
Figure 5—figure supplement 1
Analysis of transcription start site (TSS) spread in ssl2 and polymerase II (Pol II) mutants.
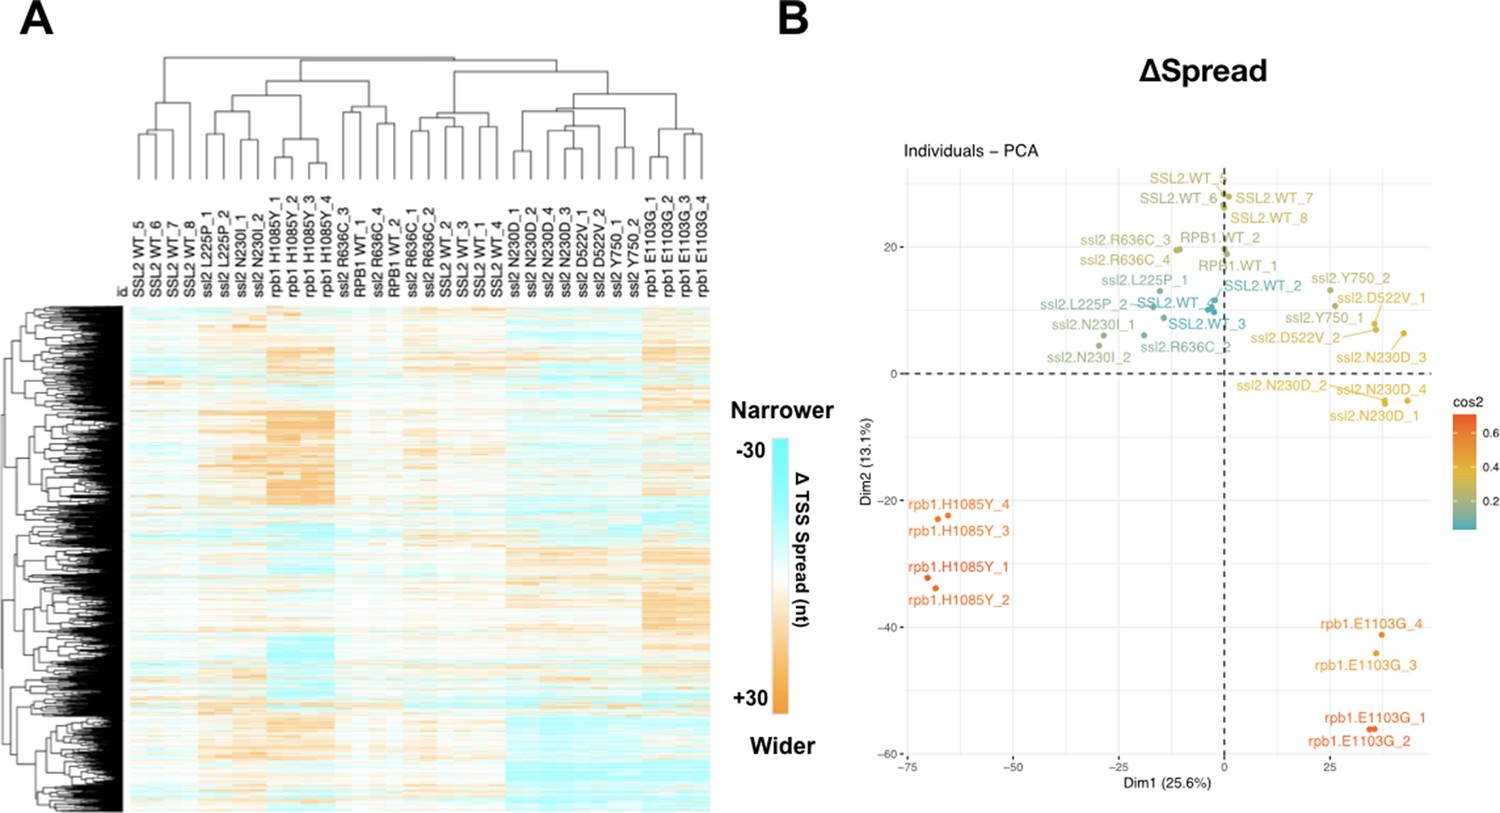
(A) Heatmap and hierarchical clustering of TSS spread change for ssl2 or rpb1 mutant in individual replicate. As described in Figure 5C. SSL2WT_2,3,4 are technical replicates as are SSL2WT_5,6,7. All other libraries represent biological replicates. (B) Principal component analysis (PCA) for change of TSS spread in ssl2 and Pol II individual TSS sequencing (TSS-seq) libraries. TSS-seq libraries are separated into five major classes (ssl2 upstream and downstream mutants, wild type [WT], Pol II upstream and downstream mutants).
-
Figure 5—figure supplement 1—source data 1
Figure 5—figure supplement 1A Heatmap data.
- https://cdn.elifesciences.org/articles/71013/elife-71013-fig5-figsupp1-data1-v2.csv
Figure 5—figure supplement 2
Number of promoters affected by ssl2 or polymerase II (Pol II) mutants.
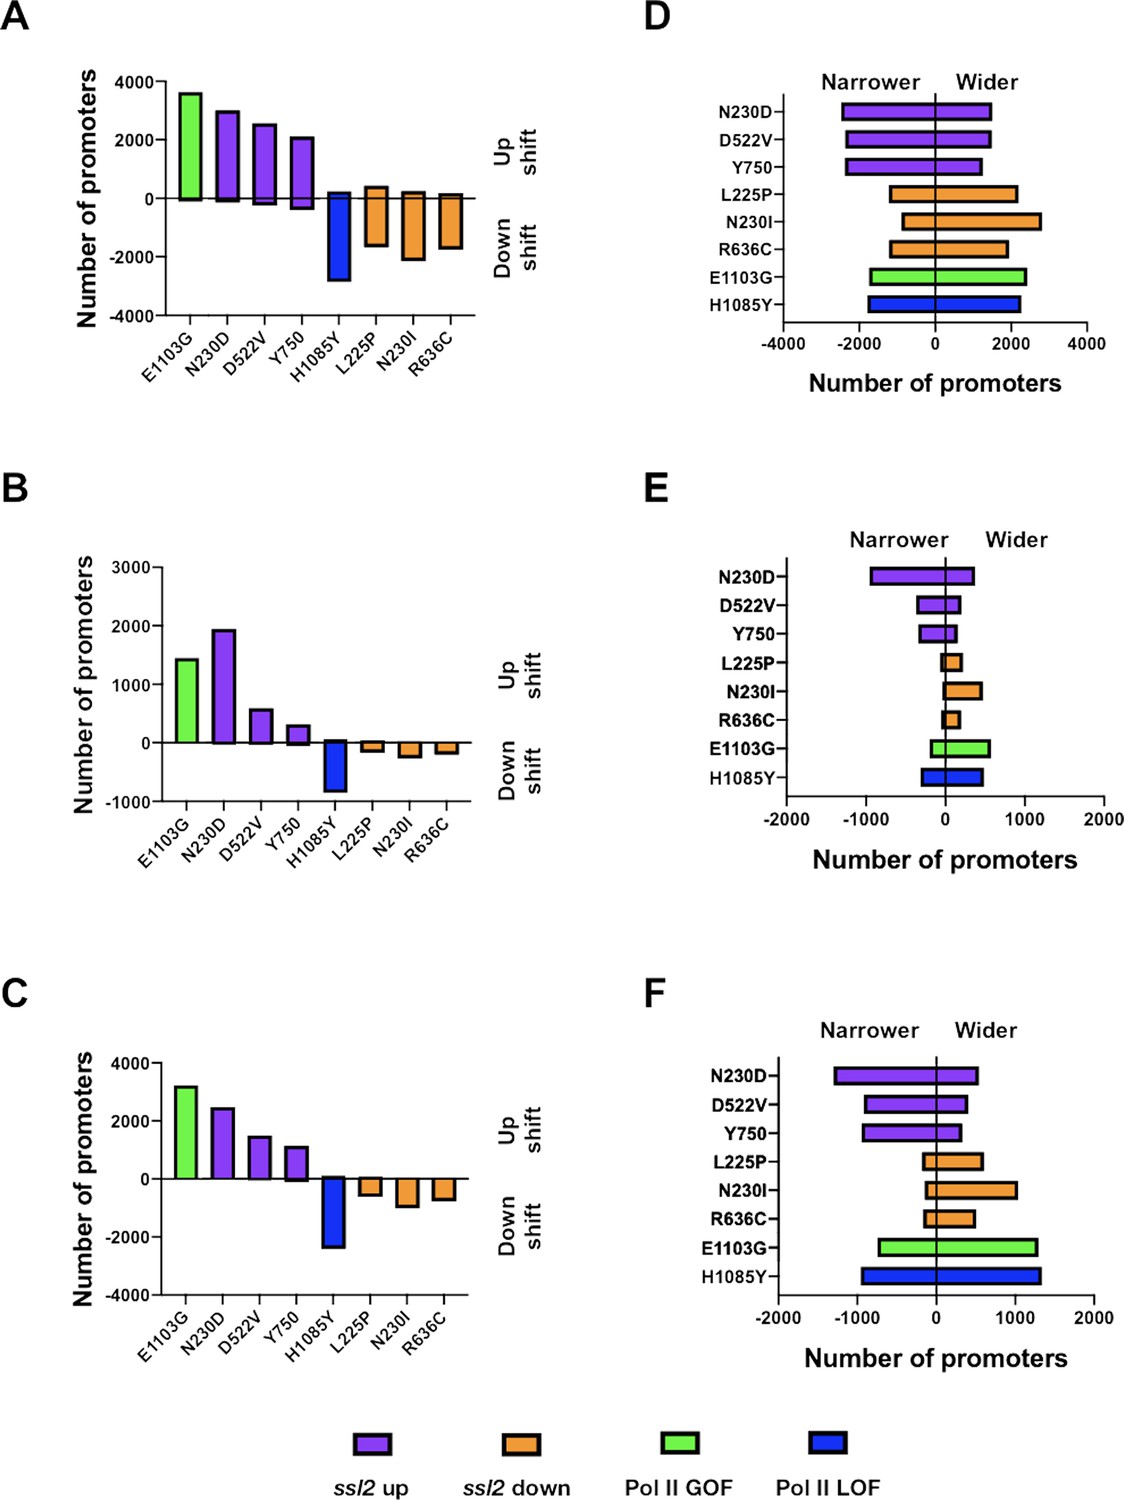
(A) Bar plot showing number of promoters that shift median transcription start sites (TSS) position either upstream or downstream in each mutant for any degree of shift. (B) Bar plot indicating number of promoters that shift median TSS position significantly upstream or downstream in each mutant, as determined by Kruskal-Wallis test with Dunn’s correction for multiple comparisons (p ≤ 0.05). The test was performed individually on each promoter and all mutants were taken into account. (C) Bar plot showing number of promoters that shift median TSS position significantly upstream or downstream in each mutant as in (B) but determined by Mann-Whitney U test (p ≤ 0.05). (D–F) As tested in A–C but examined for change of TSS spread instead of median TSS shift. (D) Bar plot showing number of promoters that have narrower or wider TSS spread in each mutant. TSS spread was determined as described in Figure 5A. (E) Bar plot indicating number of promoters that have significantly increased or decreased TSS spread in each mutant as determined by Kruskal-Wallis test with Dunn’s correction for multiple comparisons (p ≤ 0.05). The test was also performed individually on each promoter and all the mutants were taken into account. (F) Bar plot showing number of promoters that have significantly increased or decreased TSS spread in each mutant as in E but determined by Mann-Whitney U test (p ≤ 0.05).
-
Figure 5—figure supplement 2—source data 1
Figure 5—figure supplement 2A Graph data.
- https://cdn.elifesciences.org/articles/71013/elife-71013-fig5-figsupp2-data1-v2.csv
-
Figure 5—figure supplement 2—source data 2
Figure 5—figure supplement 2B Data table.
- https://cdn.elifesciences.org/articles/71013/elife-71013-fig5-figsupp2-data2-v2.csv
-
Figure 5—figure supplement 2—source data 3
Figure 5—figure supplement 2B Graph data.
- https://cdn.elifesciences.org/articles/71013/elife-71013-fig5-figsupp2-data3-v2.csv
-
Figure 5—figure supplement 2—source data 4
Figure 5—figure supplement 2C Data table.
- https://cdn.elifesciences.org/articles/71013/elife-71013-fig5-figsupp2-data4-v2.csv
-
Figure 5—figure supplement 2—source data 5
Figure 5—figure supplement 2C Graph data.
- https://cdn.elifesciences.org/articles/71013/elife-71013-fig5-figsupp2-data5-v2.csv
-
Figure 5—figure supplement 2—source data 6
Figure 5—figure supplement 2D Graph data.
- https://cdn.elifesciences.org/articles/71013/elife-71013-fig5-figsupp2-data6-v2.csv
-
Figure 5—figure supplement 2—source data 7
Figure 5—figure supplement 2E Data table.
- https://cdn.elifesciences.org/articles/71013/elife-71013-fig5-figsupp2-data7-v2.csv
-
Figure 5—figure supplement 2—source data 8
Figure 5—figure supplement 2E Graph data.
- https://cdn.elifesciences.org/articles/71013/elife-71013-fig5-figsupp2-data8-v2.csv
-
Figure 5—figure supplement 2—source data 9
Figure 5—figure supplement 2F Data table.
- https://cdn.elifesciences.org/articles/71013/elife-71013-fig5-figsupp2-data9-v2.csv
-
Figure 5—figure supplement 2—source data 10
Figure 5—figure supplement 2F Graph data.
- https://cdn.elifesciences.org/articles/71013/elife-71013-fig5-figsupp2-data10-v2.csv
Figure 6 with 3 supplements
Genetic interactions between ssl2 and polymerase II (Pol II) initiation alleles suggest distinct functions of each in initiation by scanning.
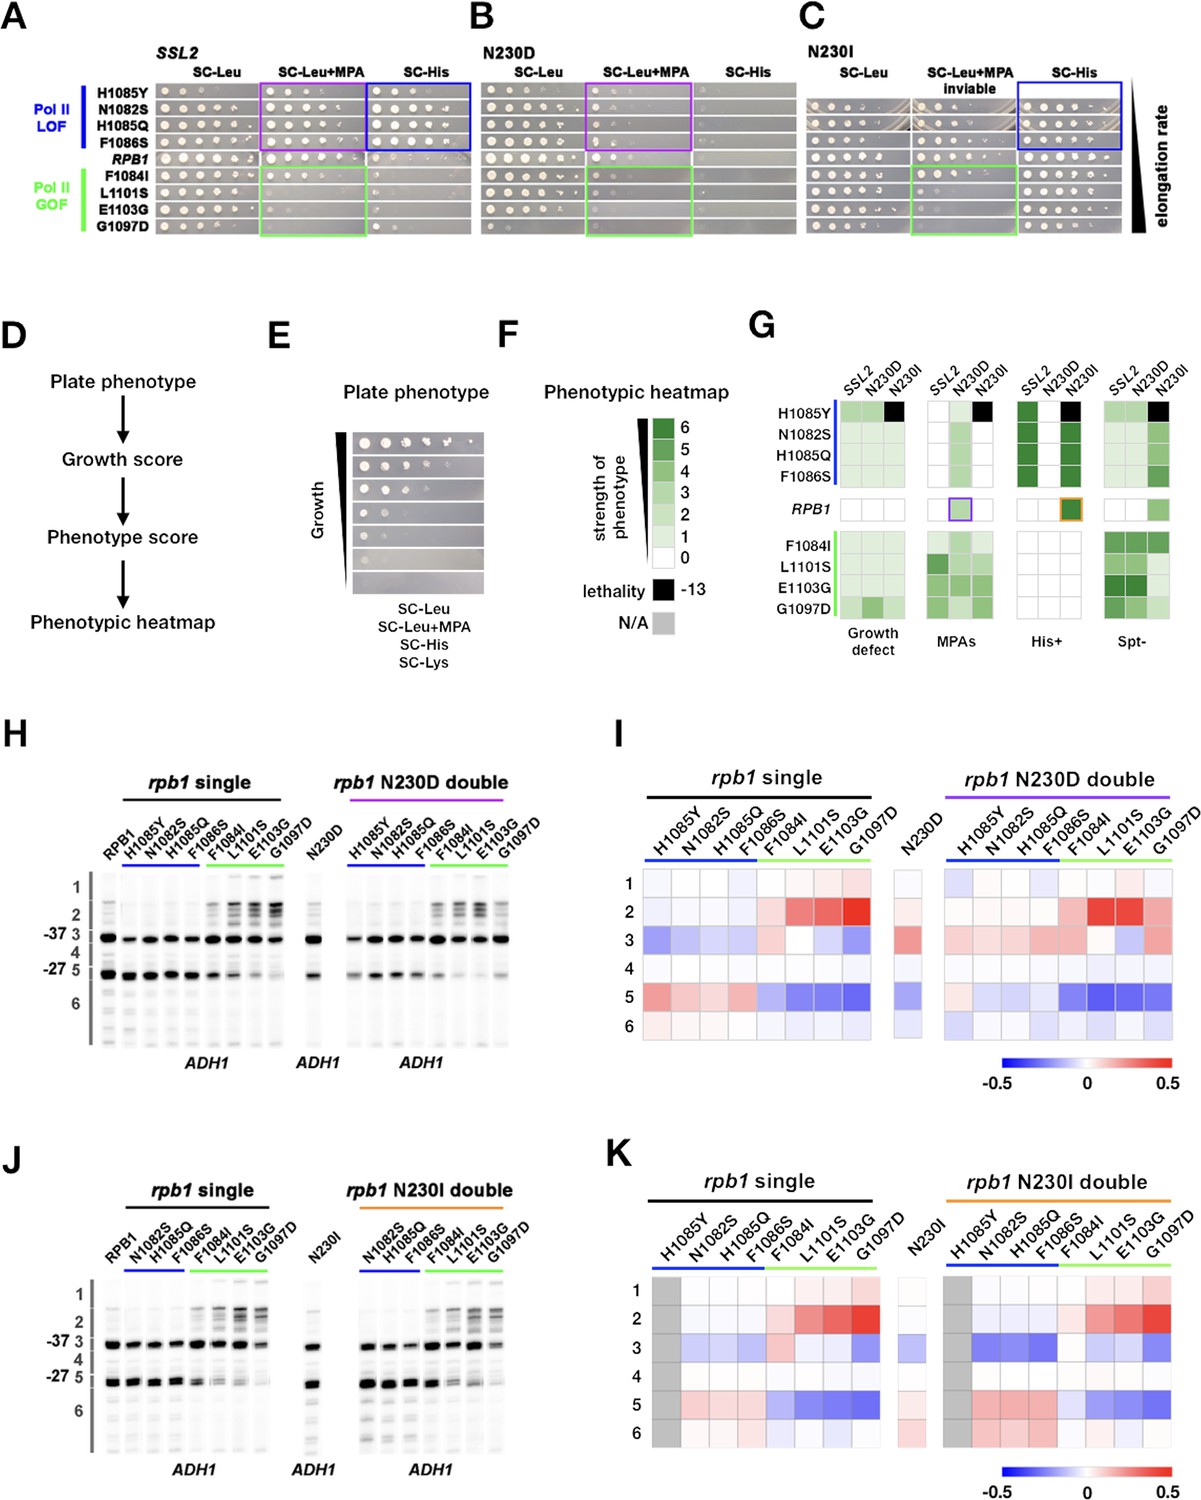
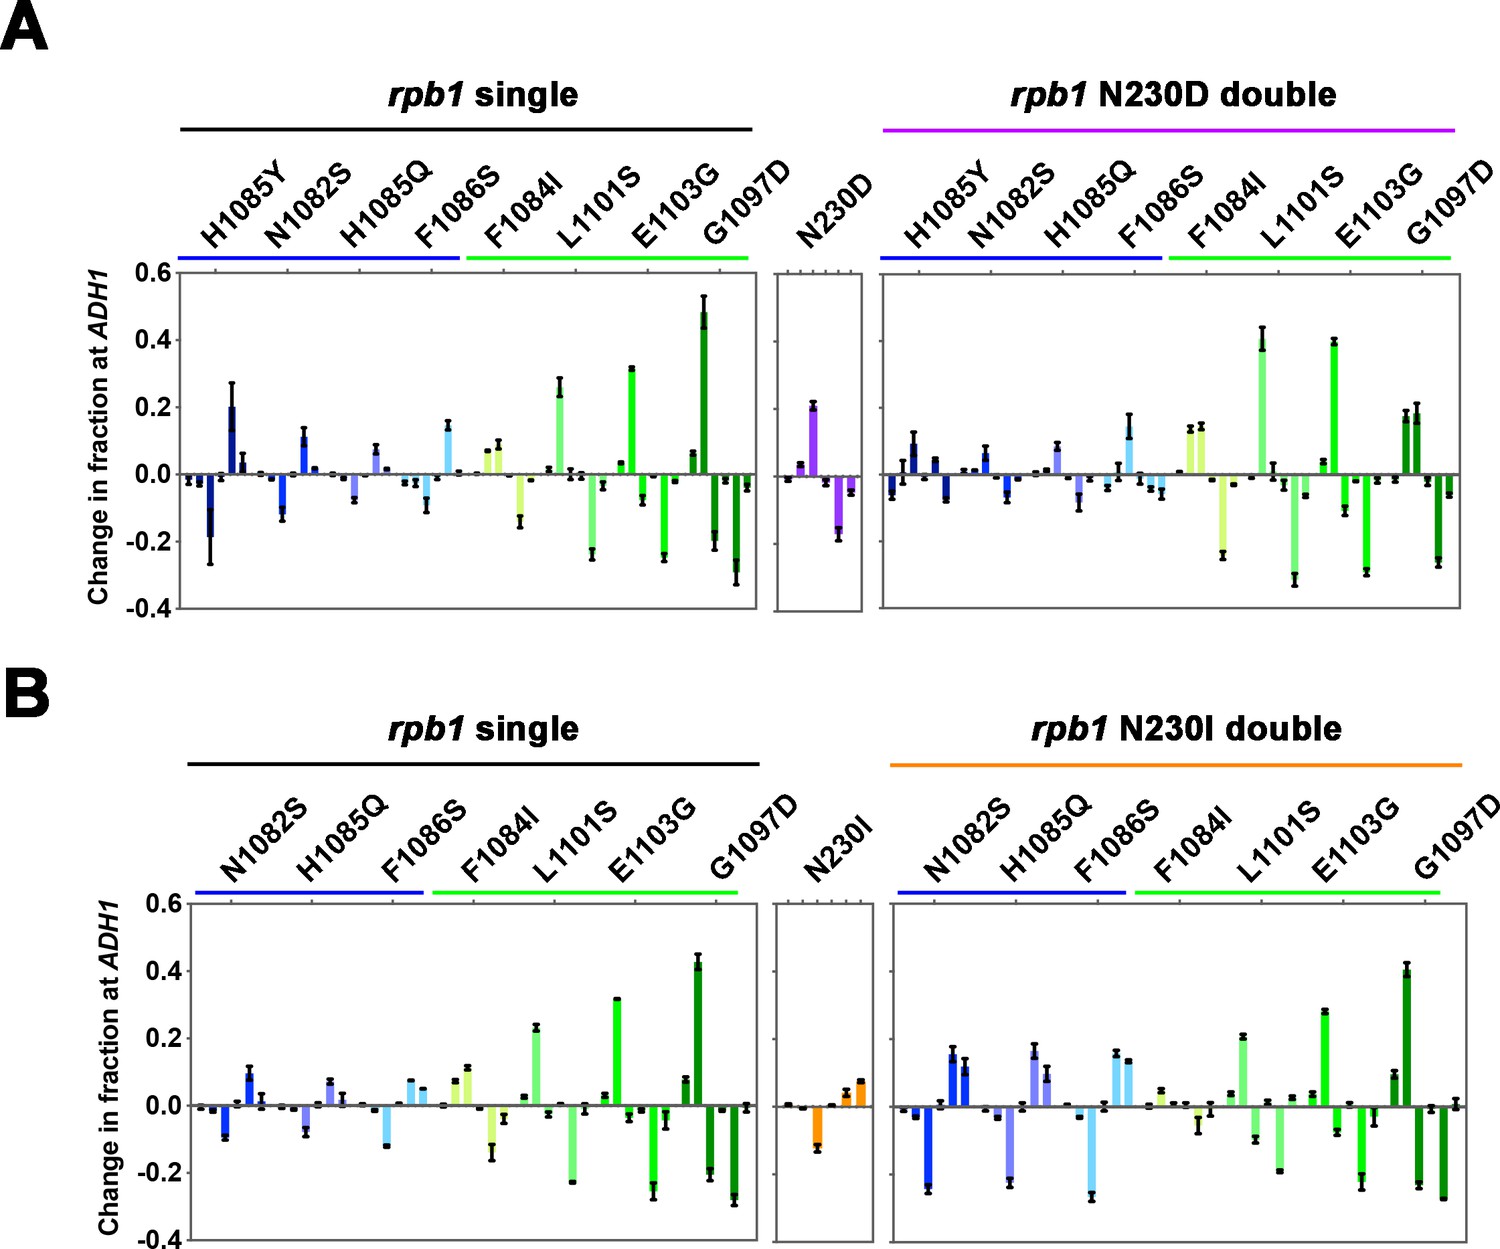
(A) Growth phenotypes of rpb1, ssl2 N230D, ssl2 N230I single or double mutants. rpb1 mutants represent known catalytically hyperactive alleles or genetically similar (G1097D, E1103G, L1101S, F1084I) and four with reduced catalytic activity (F1086S, H1085Q, N1082S, H1085Y). Strains are arranged according to measured Pol II elongation rate in vitro (slowest at top). (B) ssl2 mycophenolic acid (MPA)-sensitive alleles are epistatic to Pol II LOF alleles’ His+ phenotypes (double mutants retain MPAS of ssl2 single mutant while His+ phenotypes of rpb1 mutants are suppressed). Conversely, Pol II transcription start site (TSS) upstream shifting alleles appear epistatic/non-additive with ssl2 MPAS alleles and do not show synthetic growth phenotypes. (C) Pol II upstream TSS shifting alleles appear epistatic to ssl2 N230I phenotypes (MPAS retained and His+ suppressed in double mutants). There are only minor synthetic defects between ssl2 N230I and Pol II downstream TSS shifting mutants suggesting lack of synergistic defect and either mild additivity or epistasis. (Double mutant of N230I and H108Y is nearly dead and was not tested here or in E.) (D,E) Schematic (D) indicating how qualitative growth data of mutants encoded (E) for visualization in heatmaps. (F) Phenotyping heatmap legend. (G) Qualitative heatmaps for ssl2 and rpb1 genetic interactions. Growth phenotypes are detected using reporters described in Figure 1. (H) Primer extension of ssl2 N230D and rpb1 mutants at ADH1. ssl2 N230D appears to truncate distribution of TSSs on downstream side and is epistatic to downstream shifting rpb1 alleles (blue bar) while upstream shifting rpb1 alleles (green bar) are non-additive or epistatic to ssl2 N230D. Numbered regions indicate TSS positions that were binned for quantification in (I). Representative primer extension of ≥3 independent biological replicates is shown. (I) Quantification of (H) with heatmap showing relative differences in TSS distribution binned by position (bins are numbered and shown in H). Mean changes of ≥3 independent biological replicates are shown in the heatmap. (J) Primer extension of ssl2 N230I and rpb1 mutants at ADH1. ssl2 N230I appears to enhance usage of downstream TSSs and is additive with downstream shifting rpb1 alleles (blue bar) while upstream shifting rpb1 alleles (green bar) are epistatic to ssl2 N230I. Numbered regions indicate TSS positions that are binned for quantification in (K). Representative primer extension of ≥3 independent biological replicates is shown. (K) Quantification of (J) with heatmap showing relative differences in TSS distribution binned by position (bins are numbered and shown in (J)). Mean changes of ≥3 independent biological replicates are shown in the heatmap.
-
Figure 6—source data 1
Figure 6G Heatmap data.
- https://cdn.elifesciences.org/articles/71013/elife-71013-fig6-data1-v2.xlsx
-
Figure 6—source data 2
Figure 6H Primer extension gel (annotated).
- https://cdn.elifesciences.org/articles/71013/elife-71013-fig6-data2-v2.zip
-
Figure 6—source data 3
Figure 6H Primer extension gel (annotated).
- https://cdn.elifesciences.org/articles/71013/elife-71013-fig6-data3-v2.zip
-
Figure 6—source data 4
Figure 6I rpb1 single heatmap data.
- https://cdn.elifesciences.org/articles/71013/elife-71013-fig6-data4-v2.csv
-
Figure 6—source data 5
Figure 6I N230D single heatmap data.
- https://cdn.elifesciences.org/articles/71013/elife-71013-fig6-data5-v2.csv
-
Figure 6—source data 6
Figure 6I N230D double heatmap data.
- https://cdn.elifesciences.org/articles/71013/elife-71013-fig6-data6-v2.csv
-
Figure 6—source data 7
Figure 6J Primer extension gel (annotated).
- https://cdn.elifesciences.org/articles/71013/elife-71013-fig6-data7-v2.zip
-
Figure 6—source data 8
Figure 6J Primer extension gel (annotated).
- https://cdn.elifesciences.org/articles/71013/elife-71013-fig6-data8-v2.zip
-
Figure 6—source data 9
Figure 6K rpb1 single heatmap data.
- https://cdn.elifesciences.org/articles/71013/elife-71013-fig6-data9-v2.csv
-
Figure 6—source data 10
Figure 6K N230I single heatmap data.
- https://cdn.elifesciences.org/articles/71013/elife-71013-fig6-data10-v2.csv
-
Figure 6—source data 11
Figure 6K N230I double heatmap data.
- https://cdn.elifesciences.org/articles/71013/elife-71013-fig6-data11-v2.csv
-
Figure 6—source data 12
Figure 6H Primer extension gel (raw).
- https://cdn.elifesciences.org/articles/71013/elife-71013-fig6-data12-v2.zip
-
Figure 6—source data 13
Figure 6H Primer extension gel (raw).
- https://cdn.elifesciences.org/articles/71013/elife-71013-fig6-data13-v2.zip
-
Figure 6—source data 14
Figure 6J Primer extension gel (raw).
- https://cdn.elifesciences.org/articles/71013/elife-71013-fig6-data14-v2.zip
-
Figure 6—source data 15
Figure 6J Primer extension gel (raw).
- https://cdn.elifesciences.org/articles/71013/elife-71013-fig6-data15-v2.zip
Figure 6—figure supplement 1
Design of ssl2 genetic interaction tests with efficiency alleles.
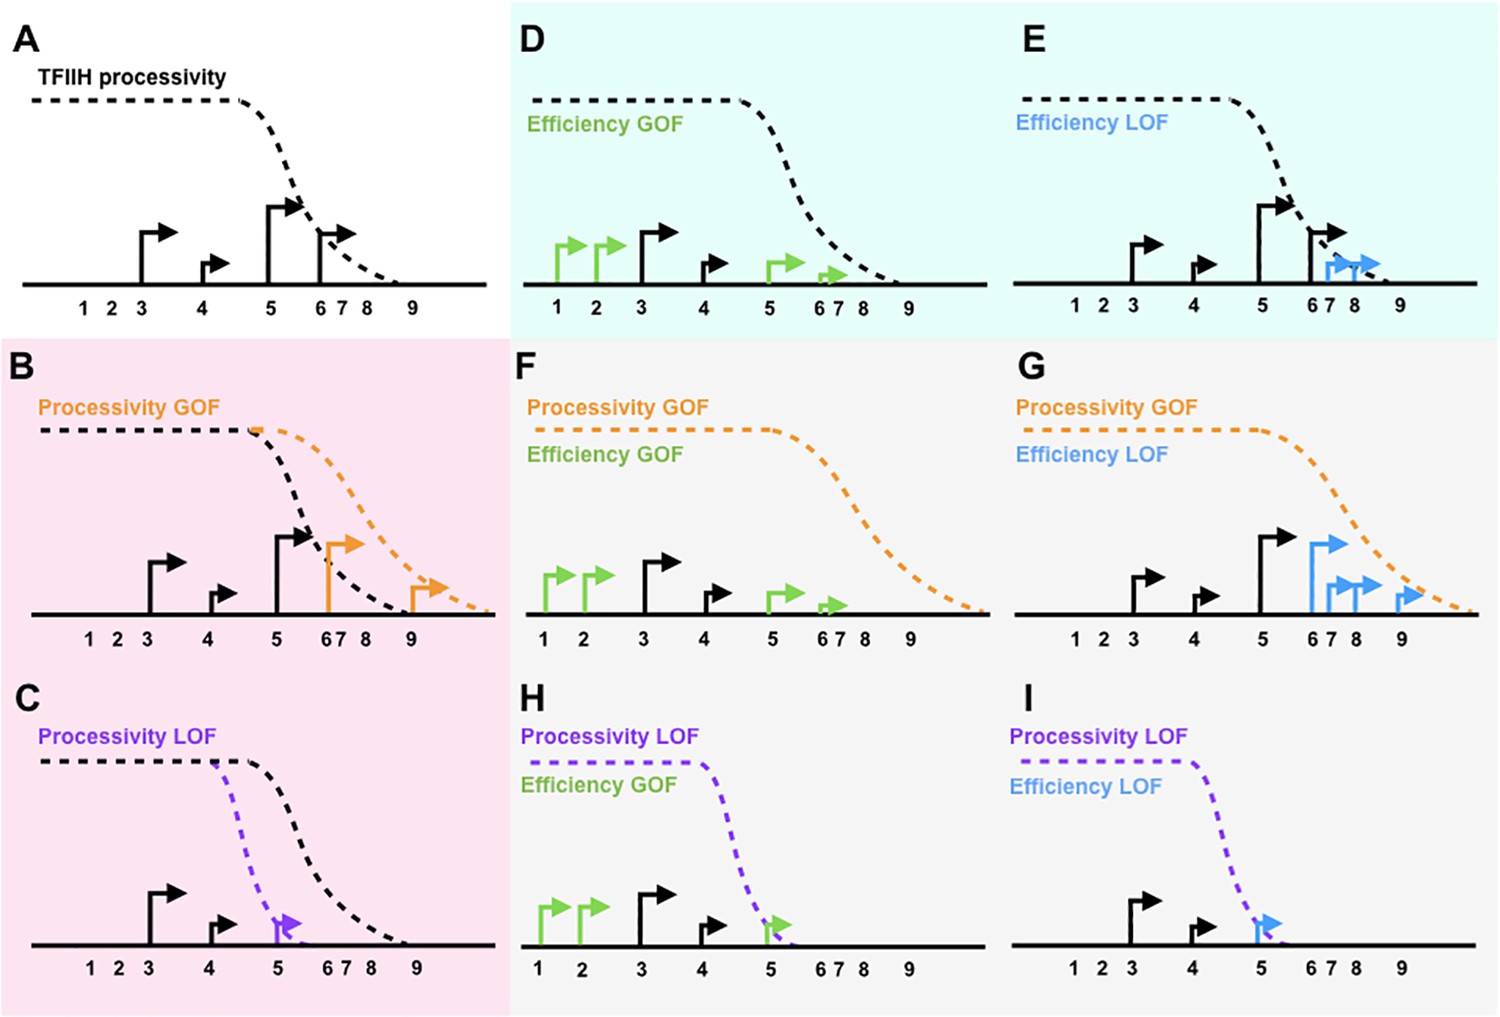
(A) Schematic showing a promoter window with transcription start sites (TSSs). (B) Increased processivity is hypothesized to increase TSS usage downstream. (C) Decreased processivity is hypothesized to reduce TSS usage downstream. (D) Increased efficiency is expected to activate TSS usage upstream. (E) Decreased efficiency is expected to increase apparent TSS usage downstream. (F) A processivity gain-of-function (GOF) allele and efficiency GOF double mutant is expected to show efficiency GOF single mutant allele’s effects on activating upstream TSSs (epistasis). (G) A processivity GOF and efficiency loss-of-function (LOF) double mutant is expected to allow or enhance efficiency LOF single allele’s effect on increasing apparent TSS usage downstream (potential additivity). (H) A processivity LOF and efficiency GOF double mutant is expected to show efficiency GOF single allele’s effect on activation TSS usage upstream (epistasis). (I) A processivity LOF and efficiency LOF double mutant is expected to show processivity LOF single allele’s effect on reducing downstream TSS usage (epistasis).
Figure 6—figure supplement 2
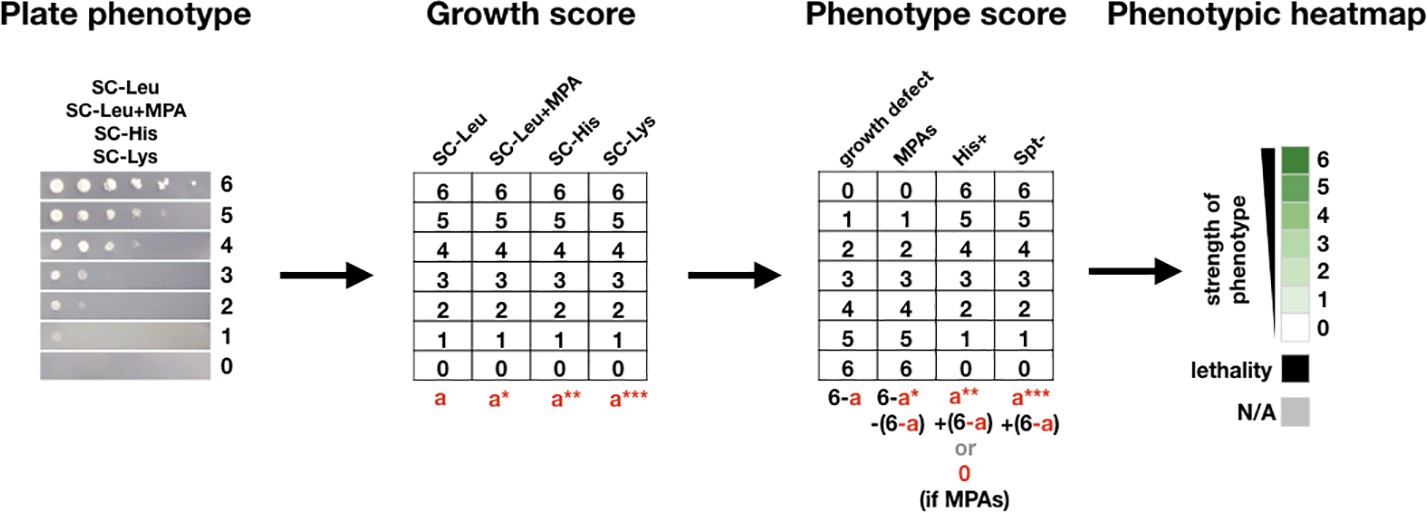
The scoring method used to quantify yeast growth phenotypes and make phenotypic heatmaps.
Figure 6—figure supplement 3
Polymerase II (Pol II) efficiency alleles are able to increase transcription start site (TSS) efficiency within the processivity defined scanning window.
(A) Quantification of TSS usage at ADH1 in rpb1 single mutant, ssl2 N230D single mutant and the double mutants. TSS usage in single or double mutants is compared to wild-type (WT) TSS usage. Bars are average ± standard deviation of ≥3 independent biological replicates. (B) Quantification of TSS usage at ADH1 in rpb1 single mutant, ssl2 N230I single mutant and the double mutants. TSS usage in double mutants is compared to WT TSS usage. Bars are averages ± standard deviation of ≥3 independent biological replicates.
-
Figure 6—figure supplement 3—source data 1
Figure 6—figure supplement 3A Graph data.
- https://cdn.elifesciences.org/articles/71013/elife-71013-fig6-figsupp3-data1-v2.csv
-
Figure 6—figure supplement 3—source data 2
Figure 6—figure supplement 3B Graph data.
- https://cdn.elifesciences.org/articles/71013/elife-71013-fig6-figsupp3-data2-v2.csv
Figure 7 with 2 supplements
Complex genetic interactions between general transcription factor (GTF) initiation alleles suggest multiple distinct activities in initiation by scanning.
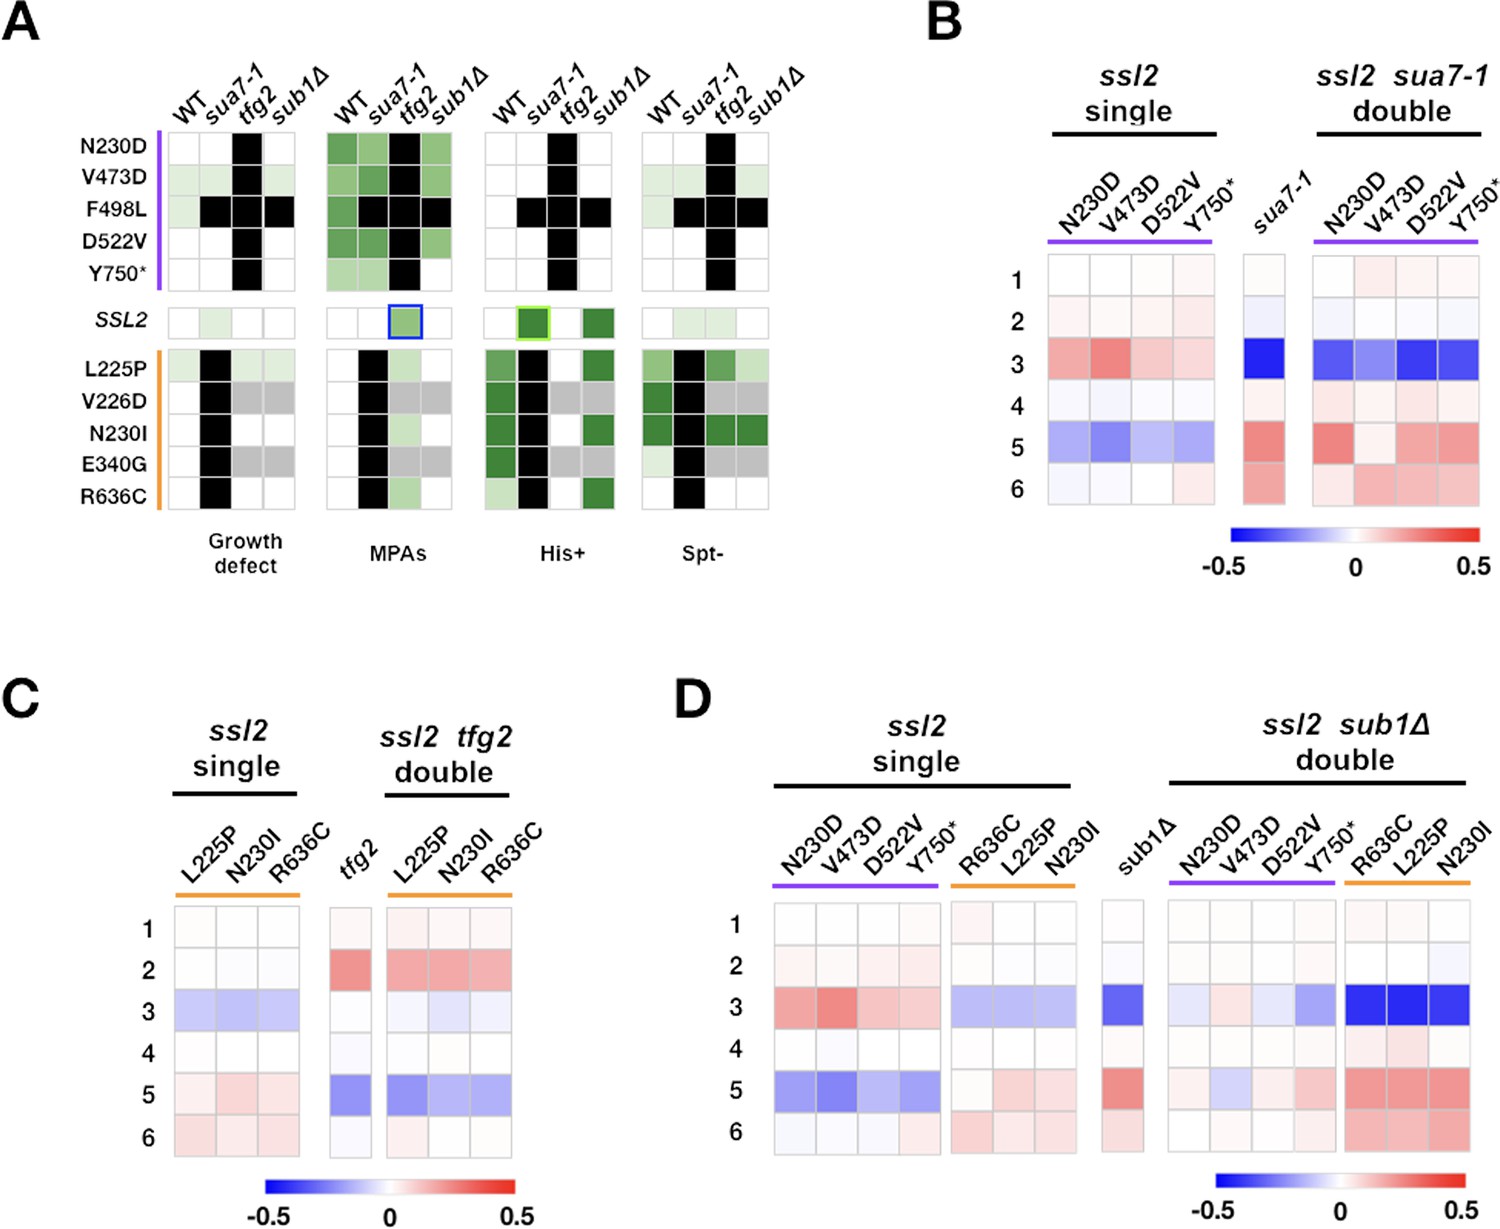
(A) Genetic interactions between ssl2, TFIIB, TFIIF, and sub1 mutants shown as a heatmap indicating phenotypic strength of single and double mutants. Scaling as in Figure 6F. (B–D) Heatmaps showing quantified ADH1 primer extension data for ssl2, sua7-1, tfg2, sub1Δ single and double mutants. Primer extension as in Figure 1E, etc. Mean changes of ≥3 independent biological replicates are shown in the heatmaps.
-
Figure 7—source data 1
Figure 7A Heatmap data.
- https://cdn.elifesciences.org/articles/71013/elife-71013-fig7-data1-v2.xlsx
-
Figure 7—source data 2
Figure 7B Heatmap data.
- https://cdn.elifesciences.org/articles/71013/elife-71013-fig7-data2-v2.csv
-
Figure 7—source data 3
Figure 7C Heatmap data.
- https://cdn.elifesciences.org/articles/71013/elife-71013-fig7-data3-v2.csv
-
Figure 7—source data 4
Figure 7D Heatmap data.
- https://cdn.elifesciences.org/articles/71013/elife-71013-fig7-data4-v2.csv
Figure 7—figure supplement 1
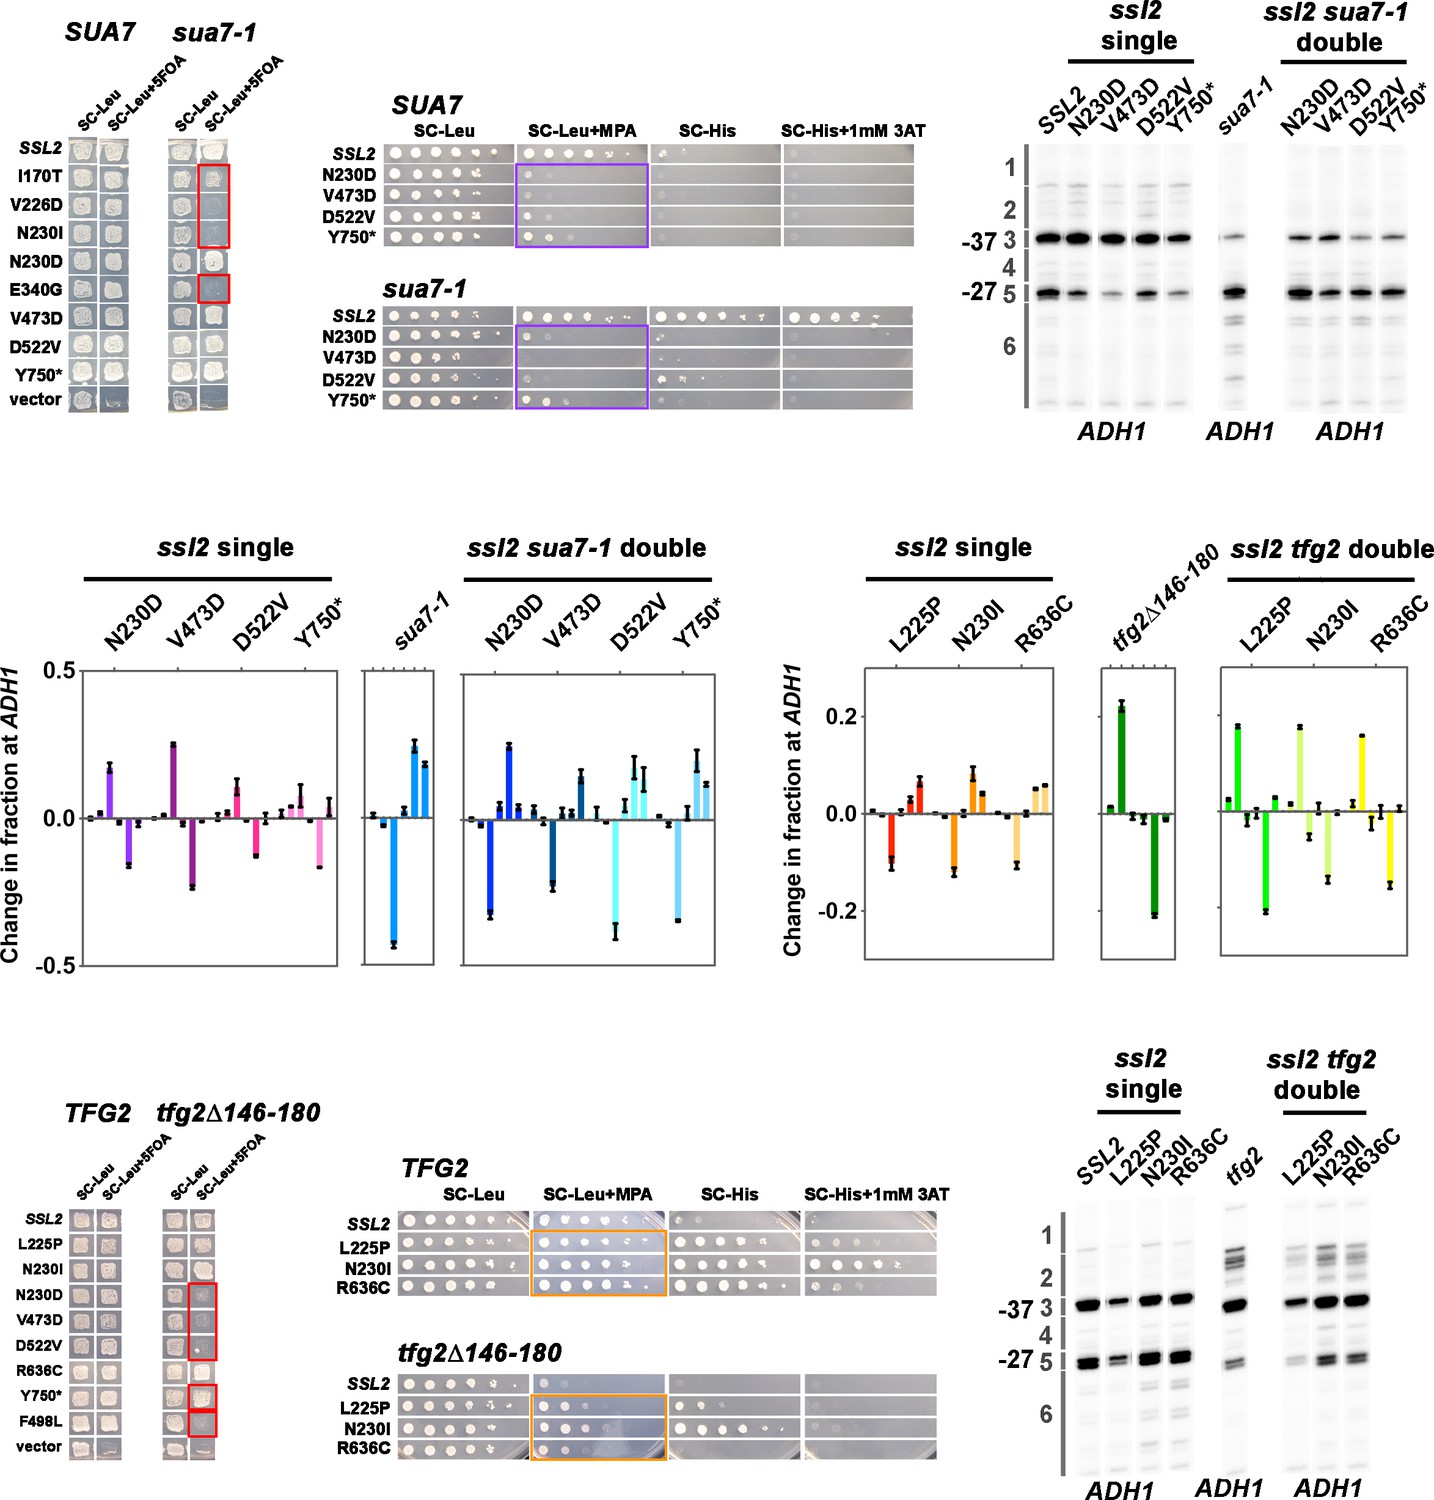
TFIIB and TFIIF alleles show strong and distinct genetic interaction behavior with ssl2 alleles.
(A) Lethality is broadly observed between ssl2 downstream shifting alleles and the sua7-1 downstream shifting allele. Patch assay showing that six downstream shifting alleles I170T, V226D, N230I, E340G, L225P, and R636C show synthetic lethality phenotypes when combined with sua7-1 allele (ssl2 I170T and sua7-1 double mutant is very sick on 5FOA plate but cannot be propagated to single colonies). Four ssl2 upstream shifting alleles N230D, V473D, D522V, Y750* show normal growth phenotypes when sua7-1 is incorporated. One ssl2 upstream shifting allele F498L showed unique (lethality) genetic interactions compared to other ssl2 upstream shifting alleles (normal growth). This allele additionally shows lethality with both TFIIF and sub1∆ alleles as discussed in the corresponding sections. (B) ssl2 upstream shifting alleles show epistasis with the sua7-1 downstream shifting allele for MPAS phenotypes. Spot assay shows that four upstream shifting ssl2 alleles’ strong MPAS phenotypes (N230D, V473D, D522V, and Y750*) are almost completely unaffected when sua7-1 allele, which shows a His+ phenotype by itself, is incorporated. Primer extensions shown are representative of ≥3 independent biological replicates. (C) Double mutants of ssl2 upstream shifting alleles and sua7-1 downstream shifting allele shift TSS distribution downstream. Primer extension results show that ssl2 alleles’ effect on shifting TSS distribution upstream is almost completely reversed to downstream shifting after incorporation of sua7-1 allele, with only slight additive effect seen in double mutants’ TSS usage. Primer extensions shown are representative of ≥3 independent biological replicates. (D) Quantification of primer extension detected TSS usage at ADH1 in ssl2, sua7-1 single or double mutants. Bars are averages ± standard deviation of ≥3 independent biological replicates. (E) Lethality is observed between ssl2 upstream shifting alleles and the tfg2∆146–180 upstream shifting allele. Patch assay illustrates that upstream shifting alleles N230D, V473D, D522V, and F498L show synthetic lethality phenotypes when combined with tfg2∆146–180 allele (ssl2 Y750* and tfg2∆146–180 double mutant shows moderate level of growth on 5FOA plate, however, shows strong sickness when propagated to single colonies). Three ssl2 downstream shifting alleles L225P, N230I, and R636C show normal growth phenotypes when tfg2∆146–180 is incorporated. (R636C in double mutant shows slight sicker growth phenotype than as single mutant.) (F) ssl2 downstream shifting alleles show both epistasis and additive effects with tfg2∆146–180 downstream shifting allele. Spot assay shows that the double mutants of ssl2 downstream alleles and tfg2∆146–180 allele show MPAS phenotypes; however, double mutants’ MPAS phenotypes are not as strong as observed in single tfg2∆146–180 allele. (G) Double mutants of ssl2 downstream shifting alleles and tfg2∆146–180 upstream shifting allele shift TSS distribution upstream. Primer extension results show that ssl2 alleles’ effect on shifting TSS distribution upstream is almost completely reversed to upstream shifting after incorporation of tfg2∆146–180 allele. Primer extensions shown are representative of ≥3 independent biological replicates. (H) Quantification of primer extension detected TSS usage at ADH1 in ssl2, tfg2∆146–180 single or double mutants. Bars are averages ± standard deviation of ≥3 independent biological replicates.
-
Figure 7—figure supplement 1—source data 1
Figure 7—figure supplement 1C Primer extension gel (annotated).
- https://cdn.elifesciences.org/articles/71013/elife-71013-fig7-figsupp1-data1-v2.zip
-
Figure 7—figure supplement 1—source data 2
Figure 7—figure supplement 1D Graph data.
- https://cdn.elifesciences.org/articles/71013/elife-71013-fig7-figsupp1-data2-v2.csv
-
Figure 7—figure supplement 1—source data 3
Figure 7—figure supplement 1G Primer extension gel (annotated).
- https://cdn.elifesciences.org/articles/71013/elife-71013-fig7-figsupp1-data3-v2.zip
-
Figure 7—figure supplement 1—source data 4
Figure 7—figure supplement 1H Graph data.
- https://cdn.elifesciences.org/articles/71013/elife-71013-fig7-figsupp1-data4-v2.csv
-
Figure 7—figure supplement 1—source data 5
Figure 7—figure supplement 1C Primer extension gel (raw).
- https://cdn.elifesciences.org/articles/71013/elife-71013-fig7-figsupp1-data5-v2.zip
-
Figure 7—figure supplement 1—source data 6
Figure 7—figure supplement 1G Primer extension gel (raw).
- https://cdn.elifesciences.org/articles/71013/elife-71013-fig7-figsupp1-data6-v2.zip
Figure 7—figure supplement 2

Multiple genetic interactions between ssl2 and sub1Δ alleles.
(A) Three types of genetic interactions are observed between ssl2 alleles and sub1Δ for the IMD2 promoter. First, three ssl2 upstream shifting alleles (N230D, V473D, or D522V) are epistatic to sub1Δ allele for genetic phenotypes. Spot assay shows that the double mutants of sub1Δ (His+) and ssl2 upstream shifting alleles (MPAS) show MPAS phenotypes like ssl2 upstream single alleles. Second, sub1Δ is epistatic to ssl2 allele Y750*. Double mutant of sub1Δ (His+) and Y750* (MPAS) shows a His+ phenotype. Third, sub1Δ is epistatic to ssl2 downstream shifting alleles (L225P, N230I, R636C). Double mutants of sub1Δ (His+) and ssl2 downstream shifting alleles (His+) show His+ phenotypes that are not stronger than in sub1Δ alone. (B) Genetic interactions between ssl2 and sub1Δ alleles at the ADH1 promoter. First, additive effects are observed between ssl2 upstream shifting alleles and sub1Δ. Double mutants of ssl2 upstream shifting alleles and sub1Δ show a compromised TSS distribution. Second, additive effects are also observed between ssl2 downstream shifting alleles and sub1Δ. Double mutants show stronger downstream shift than either single alone. Third, epistasis is observed between ssl2 Y750* and sub1Δ. In the double mutant, ssl2 Y750*’s effect on shifting TSS distribution upstream is completely reversed to downstream shifting by sub1Δ. Primer extensions shown are representative of ≥3 independent biological replicates. (C) Quantification of primer extension detected TSS usage at ADH1 in ssl2, sub1Δ single or double mutants. Bars are average ± standard deviation of ≥3 independent biological replicates.
-
Figure 7—figure supplement 2—source data 1
Figure 7—figure supplement 2B Primer extension gel (annotated).
- https://cdn.elifesciences.org/articles/71013/elife-71013-fig7-figsupp2-data1-v2.zip
-
Figure 7—figure supplement 2—source data 2
Figure 7—figure supplement 2B Primer extension gel (annotated).
- https://cdn.elifesciences.org/articles/71013/elife-71013-fig7-figsupp2-data2-v2.zip
-
Figure 7—figure supplement 2—source data 3
Figure 7—figure supplement 2B Primer extension gel (annotated).
- https://cdn.elifesciences.org/articles/71013/elife-71013-fig7-figsupp2-data3-v2.zip
-
Figure 7—figure supplement 2—source data 4
Figure 7—figure supplement 2B Primer extension gel (annotated).
- https://cdn.elifesciences.org/articles/71013/elife-71013-fig7-figsupp2-data4-v2.zip
-
Figure 7—figure supplement 2—source data 5
Figure 7—figure supplement 2C Graph data.
- https://cdn.elifesciences.org/articles/71013/elife-71013-fig7-figsupp2-data5-v2.csv
-
Figure 7—figure supplement 2—source data 6
Figure 7—figure supplement 2B Primer extension gel (raw).
- https://cdn.elifesciences.org/articles/71013/elife-71013-fig7-figsupp2-data6-v2.zip
-
Figure 7—figure supplement 2—source data 7
Figure 7—figure supplement 2B Primer extension gel (raw).
- https://cdn.elifesciences.org/articles/71013/elife-71013-fig7-figsupp2-data7-v2.zip
-
Figure 7—figure supplement 2—source data 8
Figure 7—figure supplement 2B Primer extension gel (raw).
- https://cdn.elifesciences.org/articles/71013/elife-71013-fig7-figsupp2-data8-v2.zip
-
Figure 7—figure supplement 2—source data 9
Figure 7—figure supplement 2B Primer extension gel (raw).
- https://cdn.elifesciences.org/articles/71013/elife-71013-fig7-figsupp2-data9-v2.zip
Figure 8
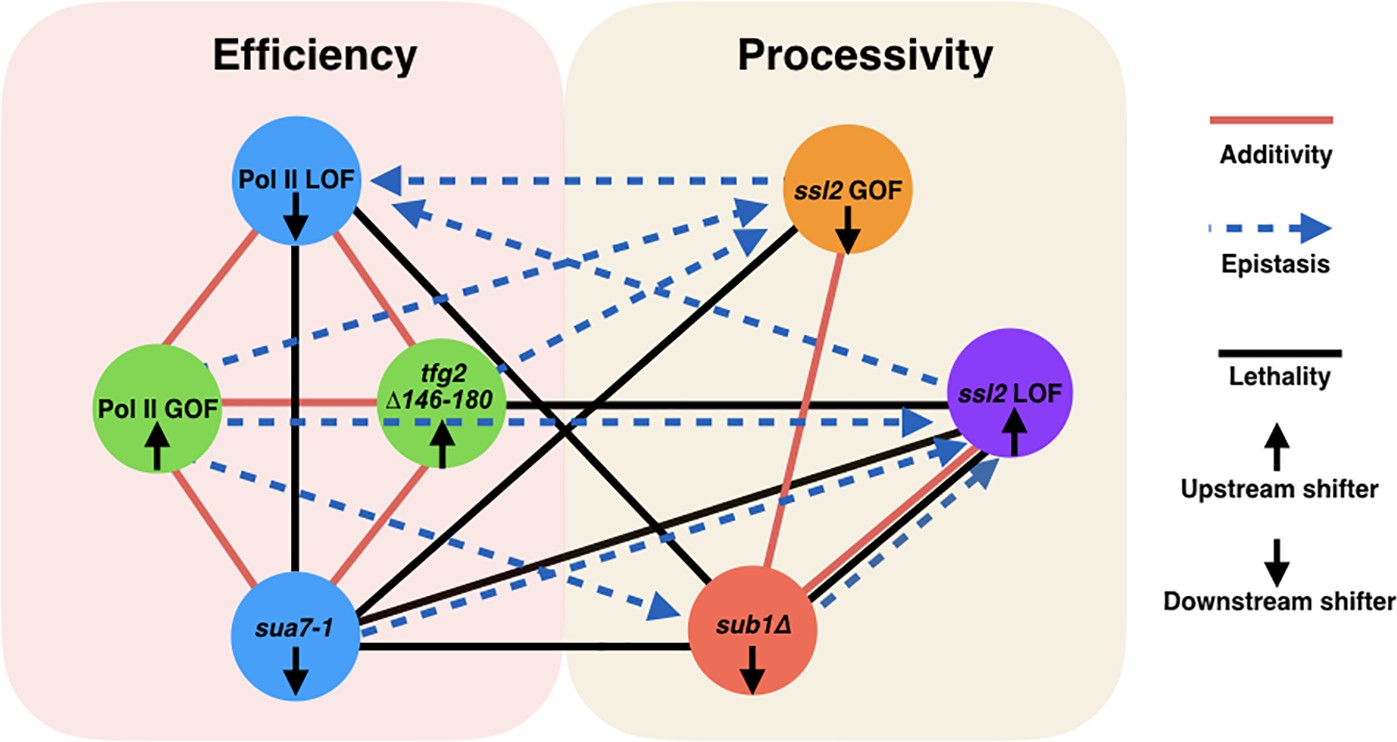
Two major functional networks controlling initiation by scanning.
In our genetic experiments, additive/suppressive effects are mainly observed between alleles predicted to function by alteration to initiation efficiency (rpb1 and tested alleles of TFIIB/TFIIF). Multiple lines between classes indicate allele-specific interactions between a factor and individuals of an allele class, for example, sub1∆ and ssl2 LOF alleles. In contrast to interactions within the ‘efficiency’ network, widespread epistasis was observed between ssl2 and other factors as predicted for interactions between processivity and efficiency alleles. sub1∆ generally shows additivity/suppression with ssl2 alleles, consistent with it functioning as a scanning processivity factor. Unique lethal interactions between ssl2 loss-of-function (LOF) upstream shifter F498L and sua7-1 and sub1∆ indicate distinct behavior within the ssl2 LOF class.
Figure 9 with 2 supplements
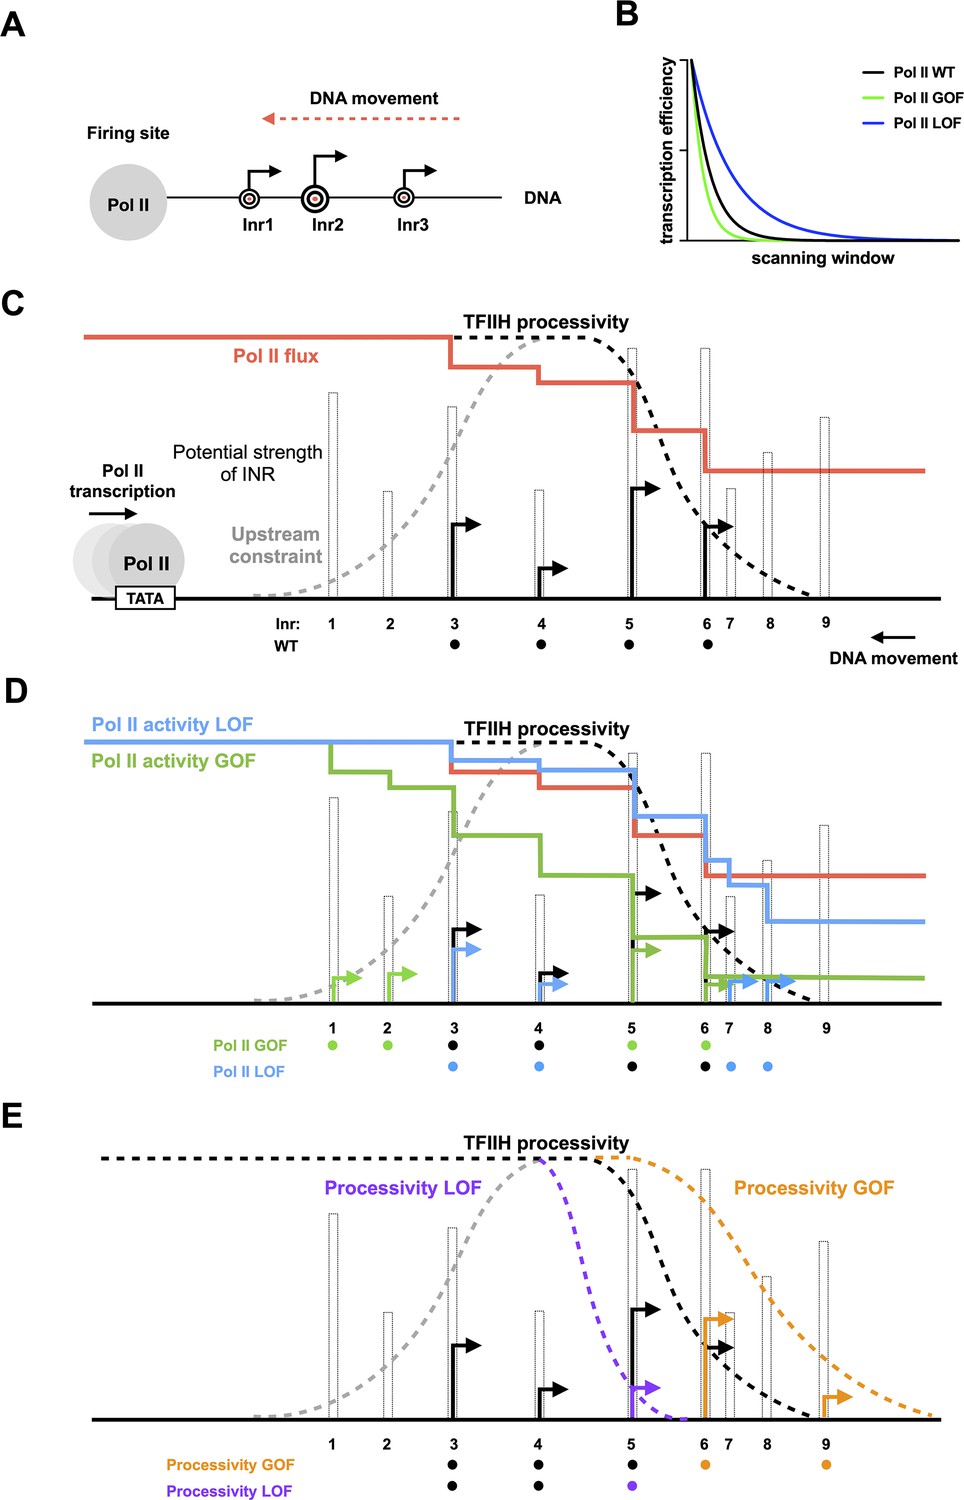
Model for interaction between initiation efficiency and scanning processivity.
(A) The ‘Shooting Gallery’ model. The polymerase II (Pol II) active site controls initiation efficiency, that is, ‘the rate of firing’. TFIIH controls the rate and extent of scanning, that is, ‘the speed of target passage and number of targets reached’. (B) Reduction in relative transcription start site (TSS) usage as scanning Pol II initiates. As Pol II (wild-type [WT]) scans from upstream to downstream, successful initiation at upstream positions will reduce the amount of Pol II continuing to scan downstream. Increasing initiation efficiency at each position as is predicted for increased Pol II catalytic activity will result in a more rapid decrease in observed initiation from upstream to downstream. Conversely, reducing initiation efficiency at each position will flatten observed TSS distribution because more Pol II will reach downstream positions. (C) TSS distributions during promoter scanning in the ‘Shooting Gallery’ model. The TSS distribution (black arrows) of a promoter window can be affected by Pol II catalytic activity, preinitiation complex (PIC) scanning rate and processivity, TSS strength, Pol II flux, and additional observed (upstream limitation on initiation too close to PIC assembly) or potential (downstream limitation through chromatin structure) constraints. (D) Effects of Pol II catalytic activity on TSS distributions. Increased Pol II catalytic activity increases the efficiency of upstream TSSs that are encountered by Pol II and decreases the usage of downstream TSSs due to quickly reduced Pol II flux (changes indicated as green arrows). Decreased Pol II catalytic activity decreases TSS efficiency of upstream TSSs encountered by Pol II and increases apparent TSS usage at downstream sites due to failed upstream initiation, resulting in a downstream shifted TSS distribution within a window determined by PIC scanning potential (changes shown as blue arrows). (E) Effects of altered scanning processivity on TSS distributions. Increased processivity alleles are hypothesized to increase the probability of Pol II scanning further downstream if Pol II flux remains, thus expanding the scanning window and allowing Pol II usage of downstream TSSs if Pol II flux is not limiting (orange TSS). In contrast, decreased processivity will limit Pol II scanning downstream, truncating the distribution of observed TSSs (purple TSS).
Figure 9—figure supplement 1
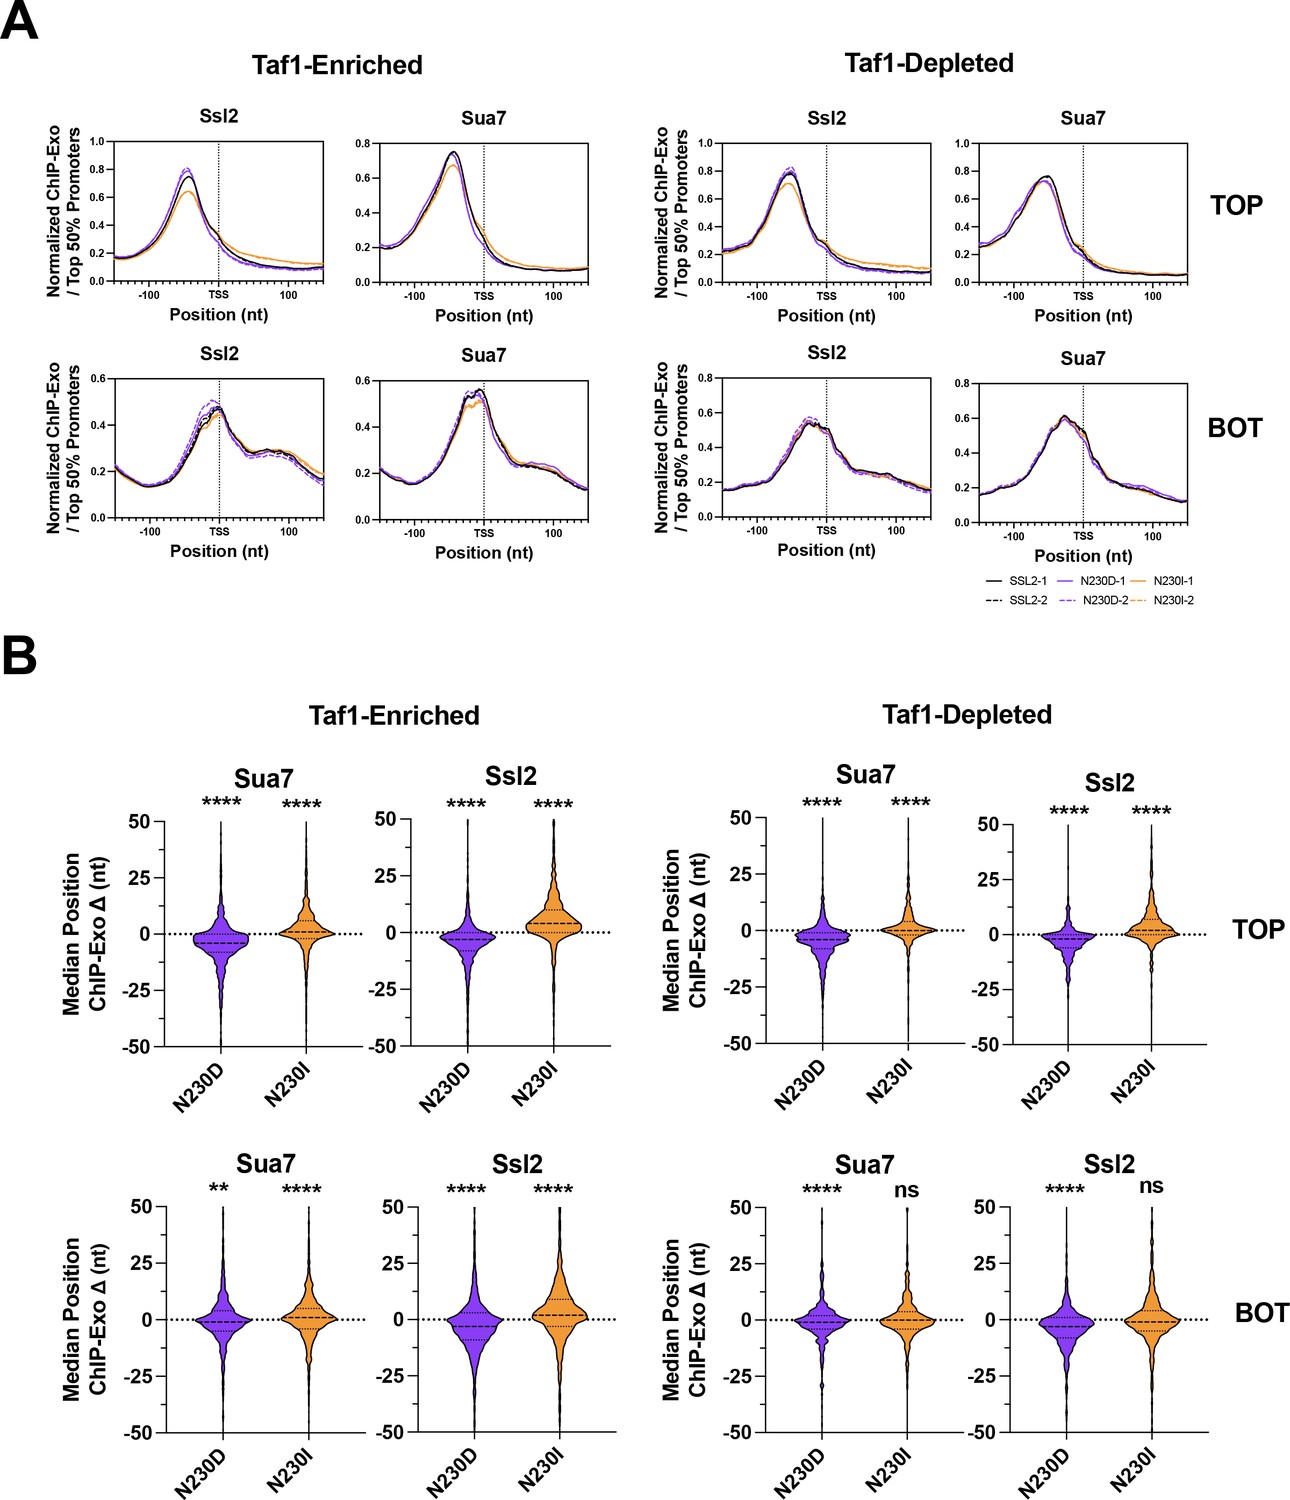
ssl2 alleles shift preinitiation complex (PIC)-component positioning genome-wide as predicted for mutants altering scanning processivity.
(A) Positions of PIC components Sua7 and Ssl2 determined by ChIP-exo in wild-type (WT) and ssl2 mutant strains. Aggregated genome-wide ChIP-exo signals on top (TOP) or bottom (BOT) strand for transcription start site (TSS) ± 150 nt centered promoter windows. Enrichment of ChIP-exo signals from the top or bottom strand of Sua7 or Ssl2 sites are shown for two biological replicates per genotype. Curves are LOWESS smoothing of aggregated ChIP-exo reads from the top 50% promoters in WT. (B) ssl2 alleles shift positioning of PIC components Sua7 and Ssl2 at most promoters. Shown is the shift of median Sua7 or Ssl2 position determined by ChIP-exo as illustrated in (A). Statistical analysis shows that the shift of the average median positions of Sua7 and Ssl2 in the two replicates is significantly different from zero (Wilcoxon signed rank test) at ****p < 0.0001.
-
Figure 9—figure supplement 1—source data 1
Figure 9—figure supplement 1A Graph data.
- https://cdn.elifesciences.org/articles/71013/elife-71013-fig9-figsupp1-data1-v2.csv
-
Figure 9—figure supplement 1—source data 2
Figure 9—figure supplement 1B Graph data.
- https://cdn.elifesciences.org/articles/71013/elife-71013-fig9-figsupp1-data2-v2.csv
Figure 9—figure supplement 2
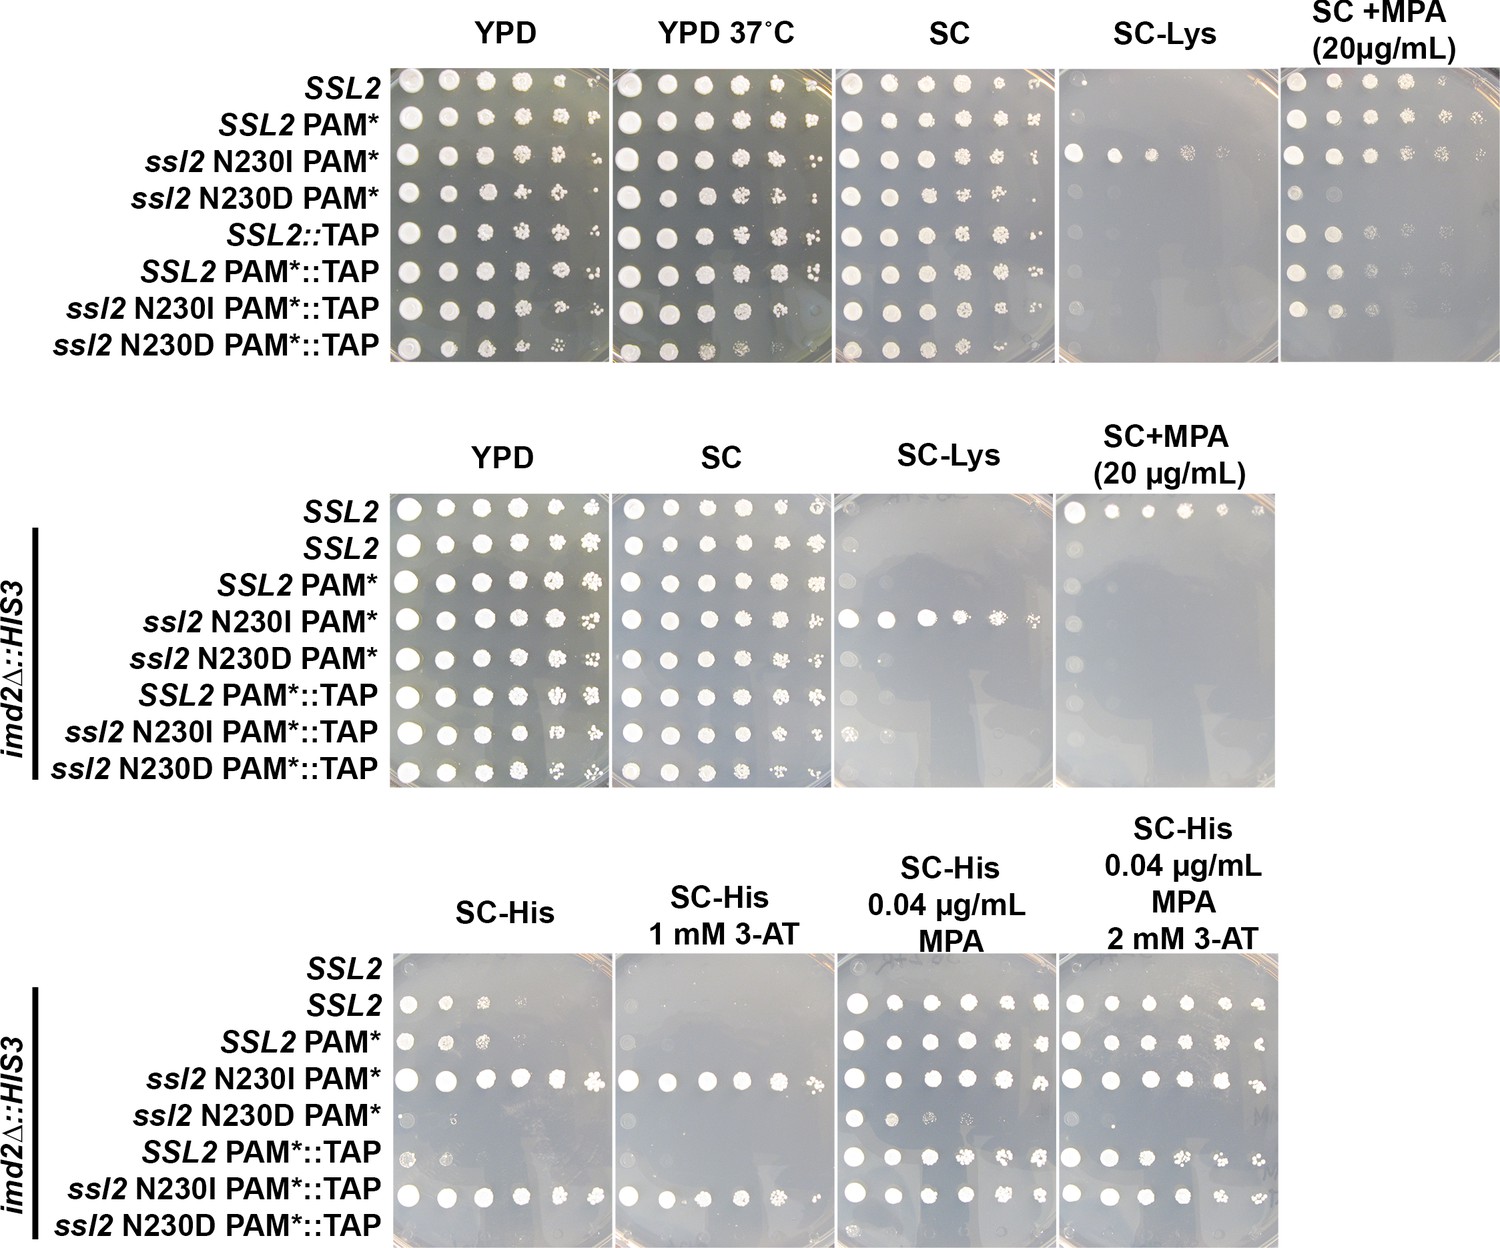
Effects of TAP-tagging SSL2.
A TAP-tag was integrated at the 3’ end of SSL2 and CRISPR-Cas9 was used to introduce mutations at codon 230 along with an adjacent silent PAM site mutation to prevent Cas9 recutting. It was discovered that the TAP-tag modulated SSL2 phenotypes, behaving like a slight loss of function, causing mild mycophenolic acid (MPA) sensitivity in WT, enhancing MPA sensitivity of ssl2 N230D (top row, SC + MPA plate), suppressing the Spt- phenotype of N230I (SC-Lys plates), but having no effect on the His+ phenotype of N230I in the background of the imd2∆::HIS3 initiation reporter (bottom row, SC-His, SC-His 1 mM 3-AT). 3-Aminotriazole (3-AT) is a competitive inhibitor of the HIS3 gene product. All serial dilution phenotyping results are representative of at least two independently constructed strains (biological replicates).
Author response image 1
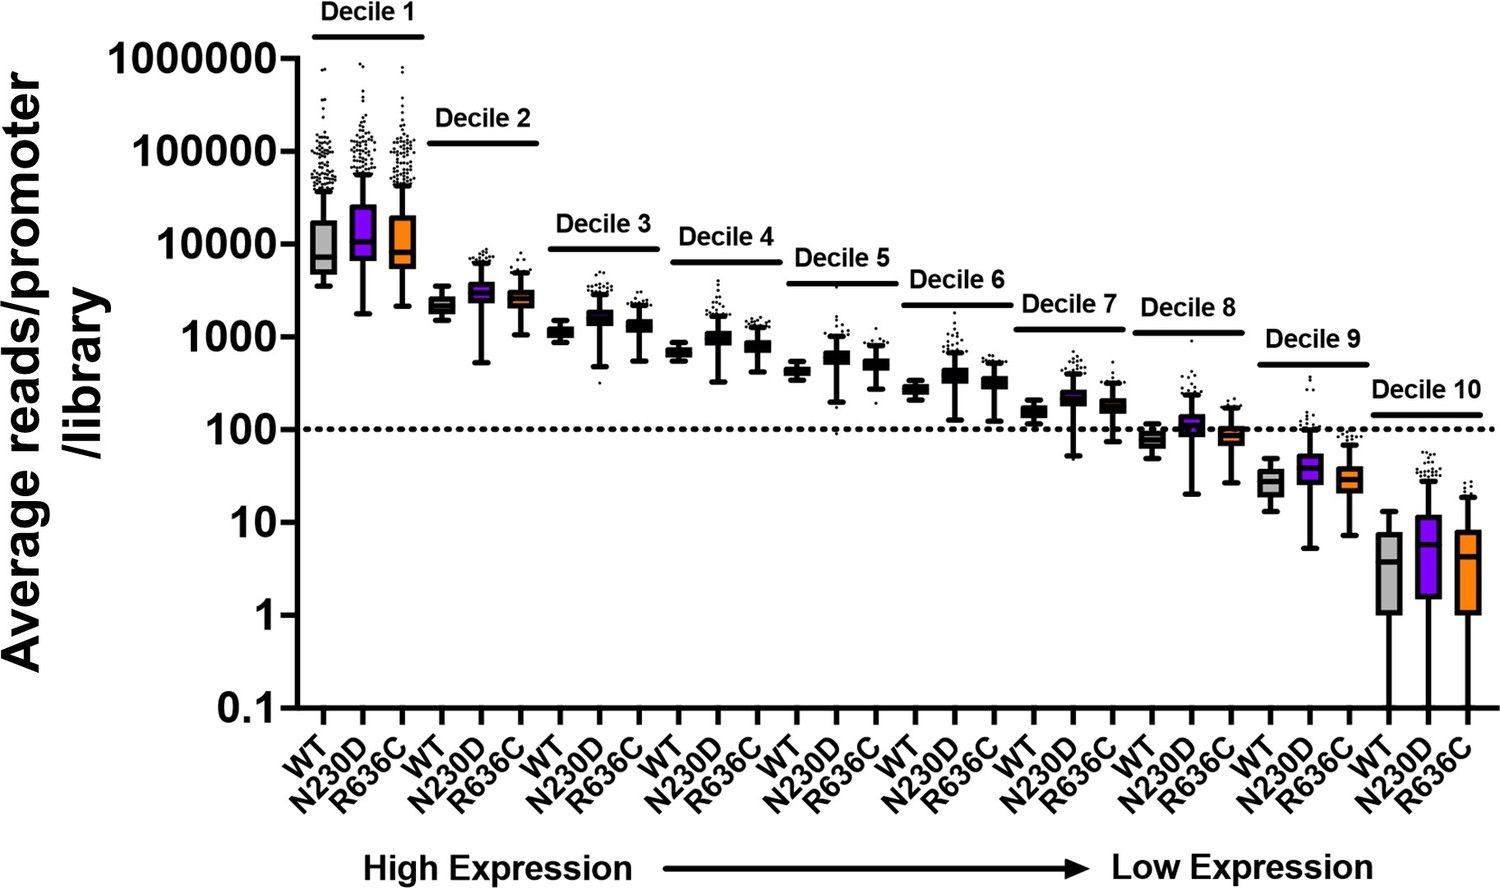
Example of average reads per promoter per library for WT and two representative ssl2 alleles.
The dotted line indicates that just over 70% of promoters are included in our “Average of 100 reads per WT library” cutoff. Mutant libraries are not undersampled by this cutoff as coverage was similar across libraries and there were not extensive differences in read fractions/promoter (mRNA 5’ end levels). Box plots are Tukey plots.
Author response image 2
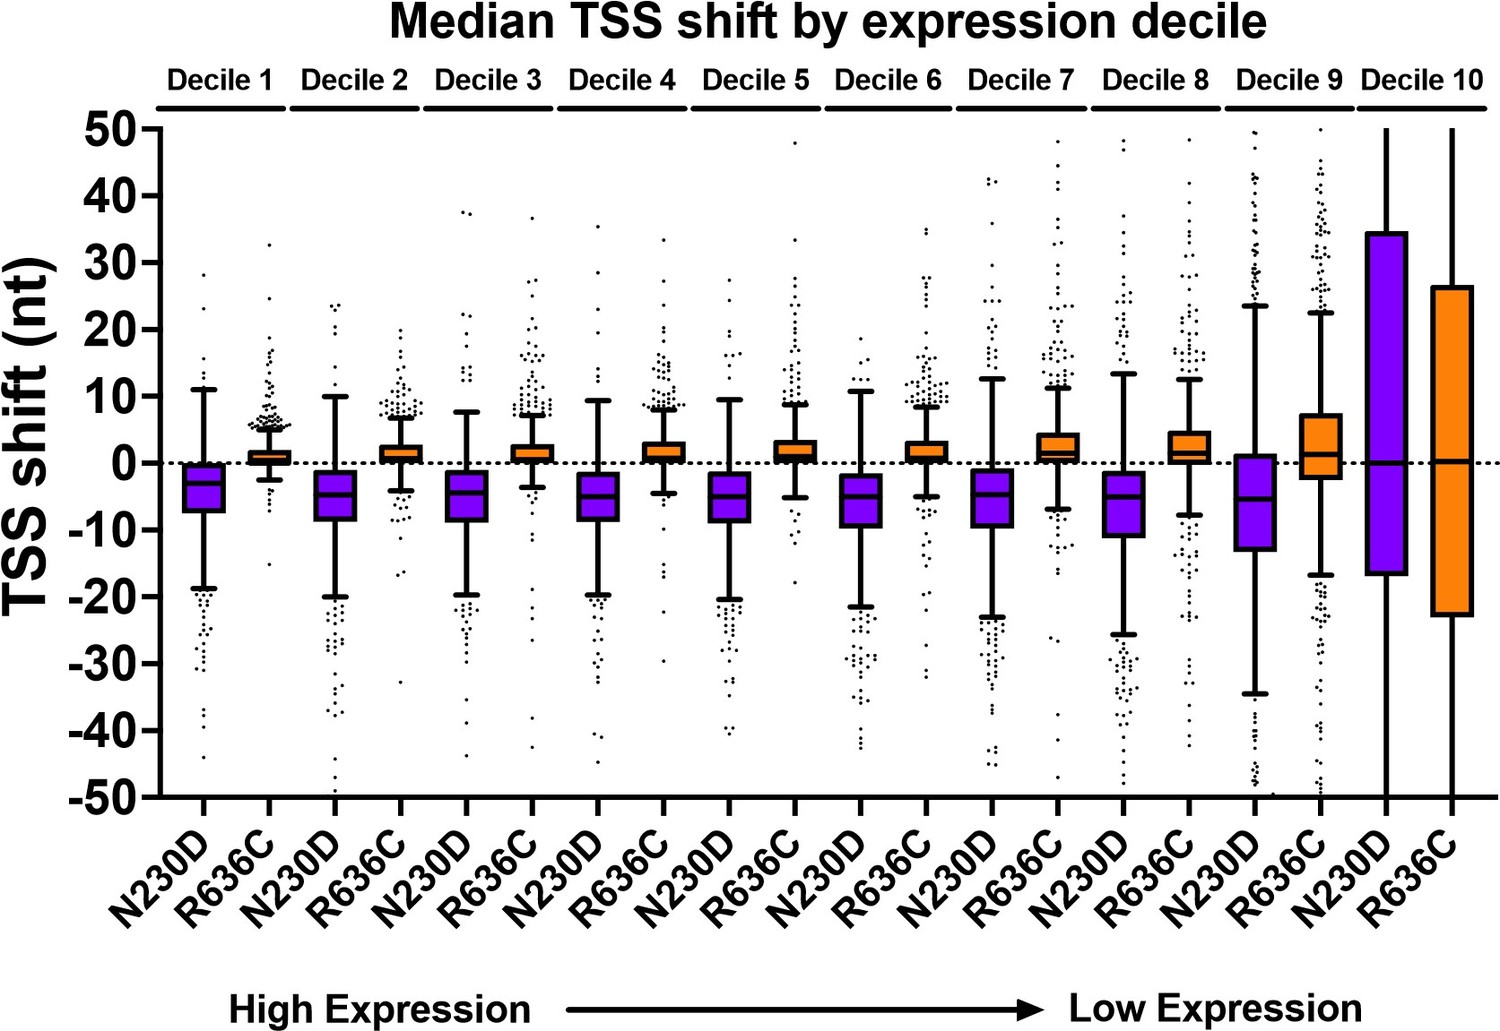
TSS-shift in ssl2 alleles relative to WT is apparent across all expression deciles.
Our current cutoff is just within Decile 8. There would be essentially no effect on results if our cutoff only included top 20% of expressed genes. Box plots are Tukey plots.
Additional files
-
Supplementary file 1
Yeast strains used in this study.
- https://cdn.elifesciences.org/articles/71013/elife-71013-supp1-v2.xlsx
-
Supplementary file 2
Bacterial strains and plasmids used in this study.
- https://cdn.elifesciences.org/articles/71013/elife-71013-supp2-v2.xlsx
-
Supplementary file 3
List of sources data files and their association with figures in this study.
- https://cdn.elifesciences.org/articles/71013/elife-71013-supp3-v2.docx
-
Transparent reporting form
- https://cdn.elifesciences.org/articles/71013/elife-71013-transrepform1-v2.pdf
Download links
A two-part list of links to download the article, or parts of the article, in various formats.
Downloads (link to download the article as PDF)
Open citations (links to open the citations from this article in various online reference manager services)
Cite this article (links to download the citations from this article in formats compatible with various reference manager tools)
Ssl2/TFIIH function in transcription start site scanning by RNA polymerase II in Saccharomyces cerevisiae
eLife 10:e71013.
https://doi.org/10.7554/eLife.71013


