Lying in a 3T MRI scanner induces neglect-like spatial attention bias
- Centre of Neurology, Division of Neuropsychology, Hertie-Institute for Clinical Brain Research, University of Tübingen, Germany
- Tübingen Center for Mental Health (TüCMH), Department of Psychiatry and Psychotherapy, University of Tübingen, Germany
- Department of Psychology, University of South Carolina, United States
Figures
Figure 1 with 2 supplements

MVS-induced oculomotor behavior.
The figure provides exemplary data from an individual subject. The three task phases are represented by individual rows. Horizontal eye position data from the looking straight-ahead task are shown in the left column. The figure inset additionally expands parts of the inside time course to better illustrate the alternation between the slow phase VOR toward the right and the fast resetting saccades directed in the opposite direction. Saccade endpoints are depicted by the cyan circles and the blue lines reflect the respective SSA estimates. Corresponding horizontal eye velocity traces of the looking straight ahead-task are shown in the middle column. Note that the cyan peaks in these time-courses refer to individual saccades, which have been removed from the eye velocity records to allow estimation of slow-phase velocity in isolation (the blue lines indicate the respective horizontal VOR-estimates). Finally, 2D eye-position eye data from the visual search task are depicted in the rightmost column (time periods with search targets plus 5 s are excluded). The horizontal center of visual search is depicted by the blue vertical lines, reflecting the median of horizontal saccade endpoints (cyan circles). Positive values indicate the rightward/upward direction.
Figure 1—figure supplement 1

Experimental setup.
The photographs on the left (a & b) show the positioning of a subject representative for the outside 1 and 2 phases. (a) The subject was lying with the head inside the head-coil (1); a mirror and eye-tracking system were mounted on top of the coil (2). The search screen (3) was inside the MRI bore and could be viewed via the mirror. The subject was holding a MRI-compatible response box in the right hand (4). (b) After positioning of the subject, we covered her with a black blanket (5) that was attached to the front of the MRI scanner. We further covered any light sources inside the scanner room with black cardboard (6). Note that we also covered the opening of the scanner bore in the back (not shown) and we also turned off any lights inside the scanner room and in all neighboring rooms. These measures allowed us to guarantee a completely dark environment for our experiments. (c) The schematic diagram shall further illustrate our setup. Note that the diagram is not plotted at scale. Viewing distance (compare the black dotted line) amounted to approximately 110 cm. (d) The illustration on the right shows a field-line drawing from our scanner manufacturer and depicts the position and orientation of subject’s head for the respective experimental phases.
Figure 1—figure supplement 2

'Feet first’ control experiment.
In order to rule out factors such as diminishing alertness inside the MRI scanner as well as other putative behavioral effects on subjects’ behavior that could result from asymmetrical cortical representations and/or activation related to arousal, we repeated our measurements in a smaller sample of seven subjects. In contrast to our main experiment, however, these subjects now entered the scanner in the reverse position, that is with their feet first. One of these subjects was excluded due to poor quality of eye fixation. The residual sample of six subjects comprised of 1 male and 5 females (average age 26.3 ± 3.4 years SD; sample size was guided by a power analysis that assumed an effect size of 1.2 [based on the average effect size of our main visual search experiment] and with α = 0.05 and power = 80%). Again all subjects reported to be right-handed, had normal or corrected to normal vision, reported no vestibular or neurological deficit, and provided their informed consent according to our institutional ethics board guidelines prior to our experiment. We repeated the measurements of our main experiment in exactly the same way. This altered geometric setting (i.e. feet first) should lead to an inversion of the MVS-effects and thus induce now a leftward VOR (compare Roberts et al., 2011), while there is no change in alertness or arousal as compared to our main experiment. In correspondance to the now inverted MVS-effect we expected to see that the behavioral effects are inverted as well, that is show a bias to the left instead of right side. The photographs show the ‘feet first’-positioning of a subject representative for the outside 1 and 2 phases. The numbers identifying relevant parts of our setup correspond to those in Figure 1—figure supplement 1. The illustration in the right part shows the field-line drawing with the position and orientation of subject’s head for the respective experimental phases in the control experiment. The horizontal coil-displacement from the center of the scanner was ~10 cm for the inside phase and ~215 cm for the outside 1 and 2 phases.
Figure 2 with 2 supplements
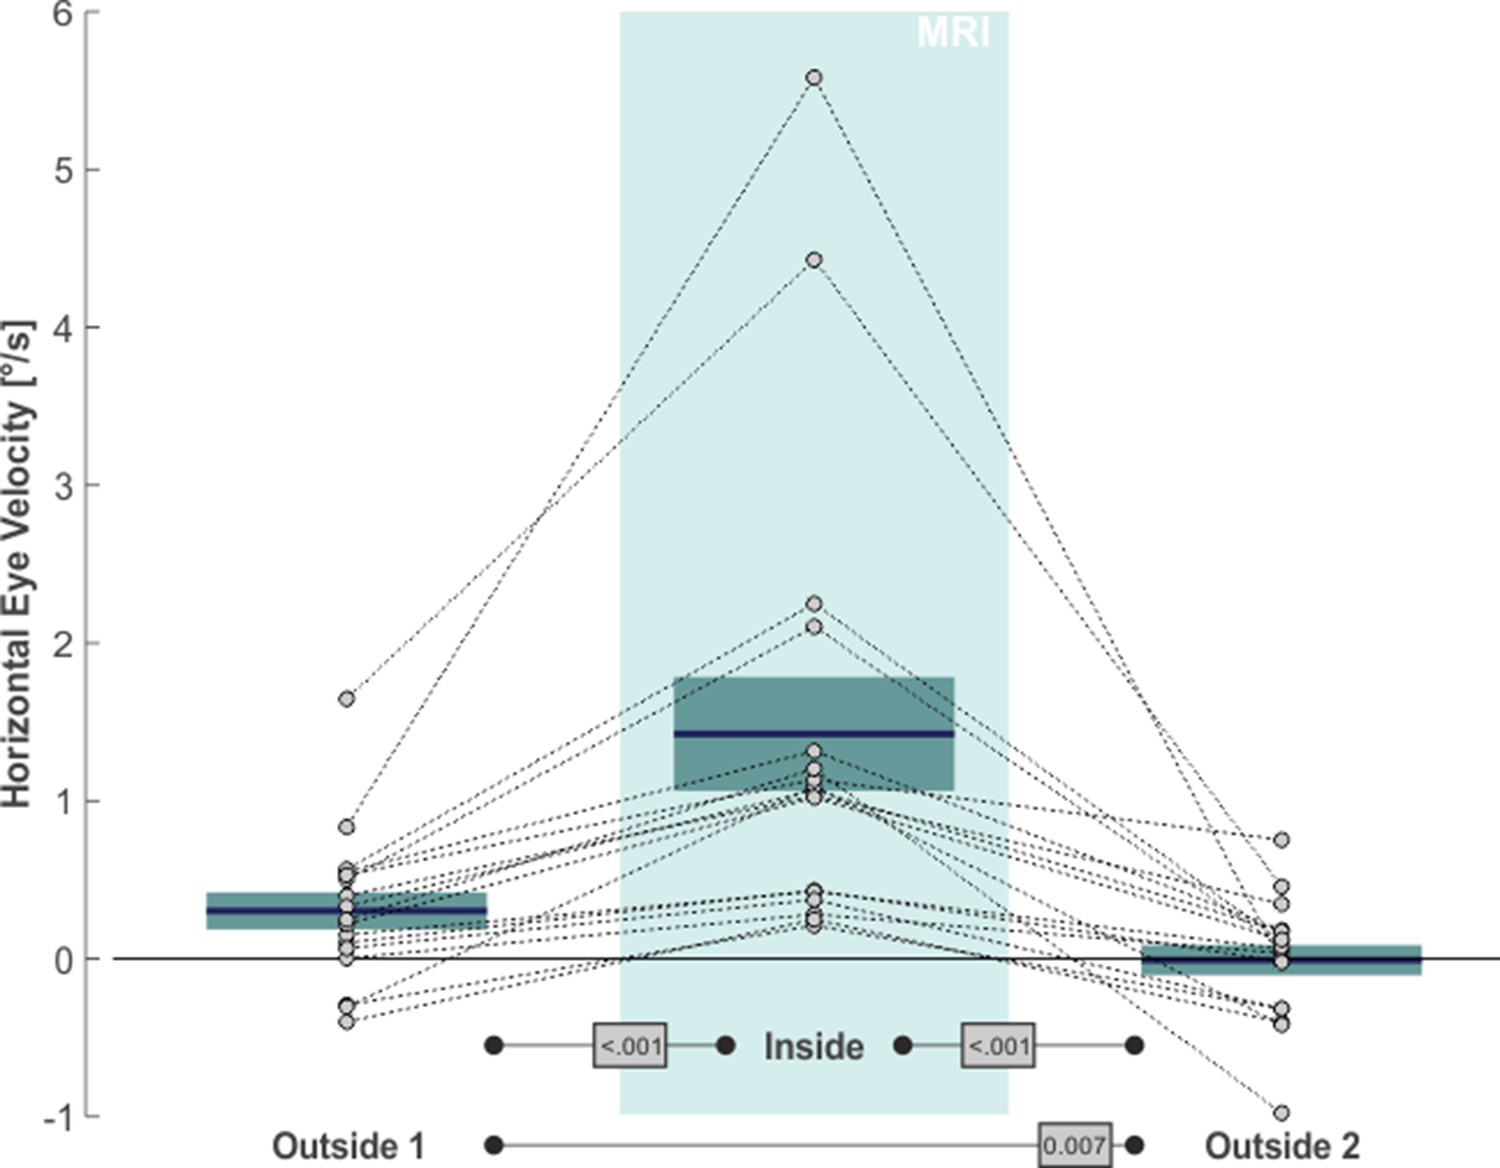
MVS-induced increase in de-saccaded horizontal eye velocity towards the right.
Horizontal eye velocity of individual subjects (circles, N = 17) are shown for all three task phases. Positive values denote rightward motion. The blue lines and the boxes reflect across subjects mean and standard error (SE; to account for our within-subject design, we removed the between-subject variance for calculation of the SE according to the procedure described by Masson and Loftus, 2003). The p-values of pairwise statistical comparisons are indicated in grey boxes.
Figure 2—figure supplement 1
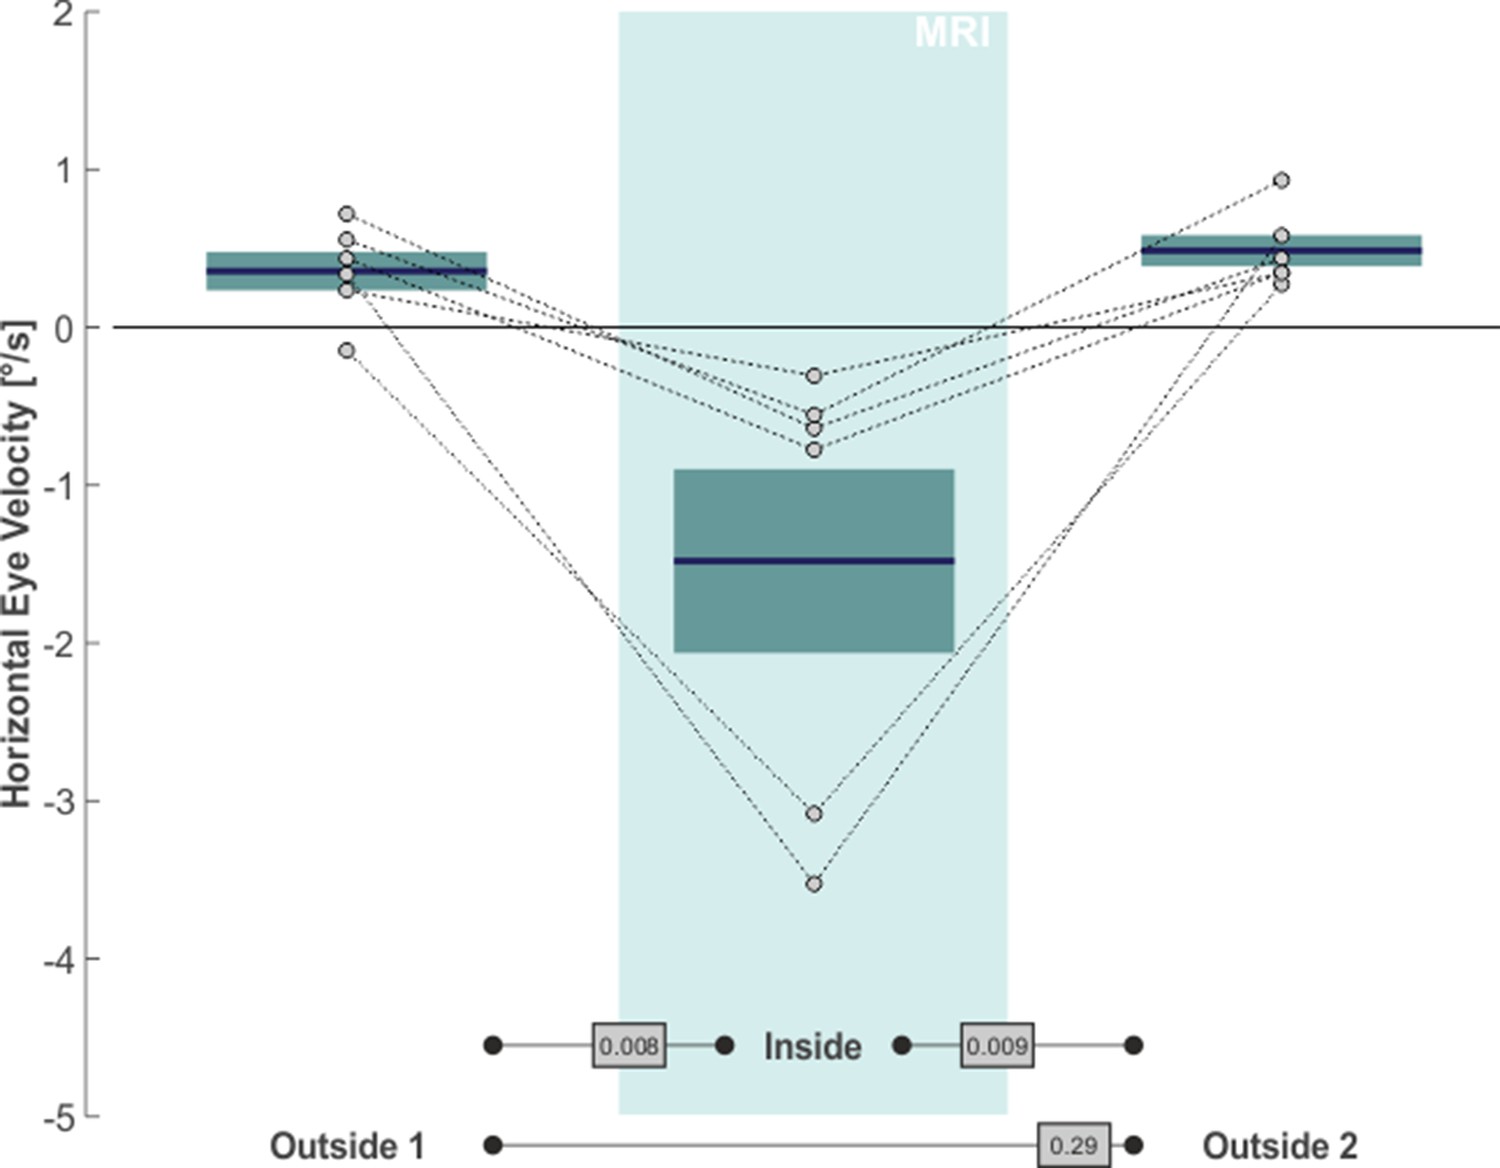
Increase in de-saccaded horizontal eye velocity towards the left during ‘feet first’ control experiment.
Horizontal eye velocity of individual subjects (circles, N = 6) are shown for all three task phases. Positive values denote rightward motion. The blue lines and the boxes reflect across subjects mean and standard error (SE; to account for our within-subject design, we removed the between-subject variance for calculation of the SE according to the procedure described by Masson and Loftus, 2003). The p-values of pairwise statistical comparisons are indicated in grey boxes. The Diagram reveals an MVS-induced increase in de-saccaded horizontal eye velocity toward the left. The within-subject differences in velocity between outside 1 and inside and between inside and outside 2 were significant (one-tailed paired t-test: t(5)=3.53, p = 0.006, g1[CI95%] = −1.44 [-2.59,–0.23] and t(5)=-3.42, p = 0.009, g1[CI95%] = −1.40 [-2.53,–0.21], respectively). Average horizontal eye velocity during outside 1 did not differ from outside 2 (two-tailed paired t-test: t(5)=-1.17, p = 0.29, g1[CI95%] = 0.48 [-0.39, 1.31]).
Figure 2—figure supplement 2

MVS-induced changes in VOR predict spatial biases in visual search and SSA.
To investigate whether the MVS-induced changes in VOR would predict the observed changes in visual search and SSA across our experiments, we performed exploratory regression analyses. The analyses were performed on the average difference (Δ) of the respective measures between inside and outside 1 and between inside and outside 2, respectively (calculated separately for each individual subject and for both the main experiment and the control experiment; N = 23 values, each). Green symbols represent respective measure for Δvisual search while blue symbols represent ΔSSA. Measures obtained in the main experiment are represented by circles, while the measure of the 'feet first' control experiment are shown as boxes. ΔVOR significantly predicted changes in both visual search (R² = 0.53; F(1,21)=23.43; p < 0.001) and in subjects’ SSA (R² = 0.46; F(1,21)=18.04; p < 0.001). The resulting parameters of the regressions are provided as equations within the figure.
Figure 3 with 1 supplement

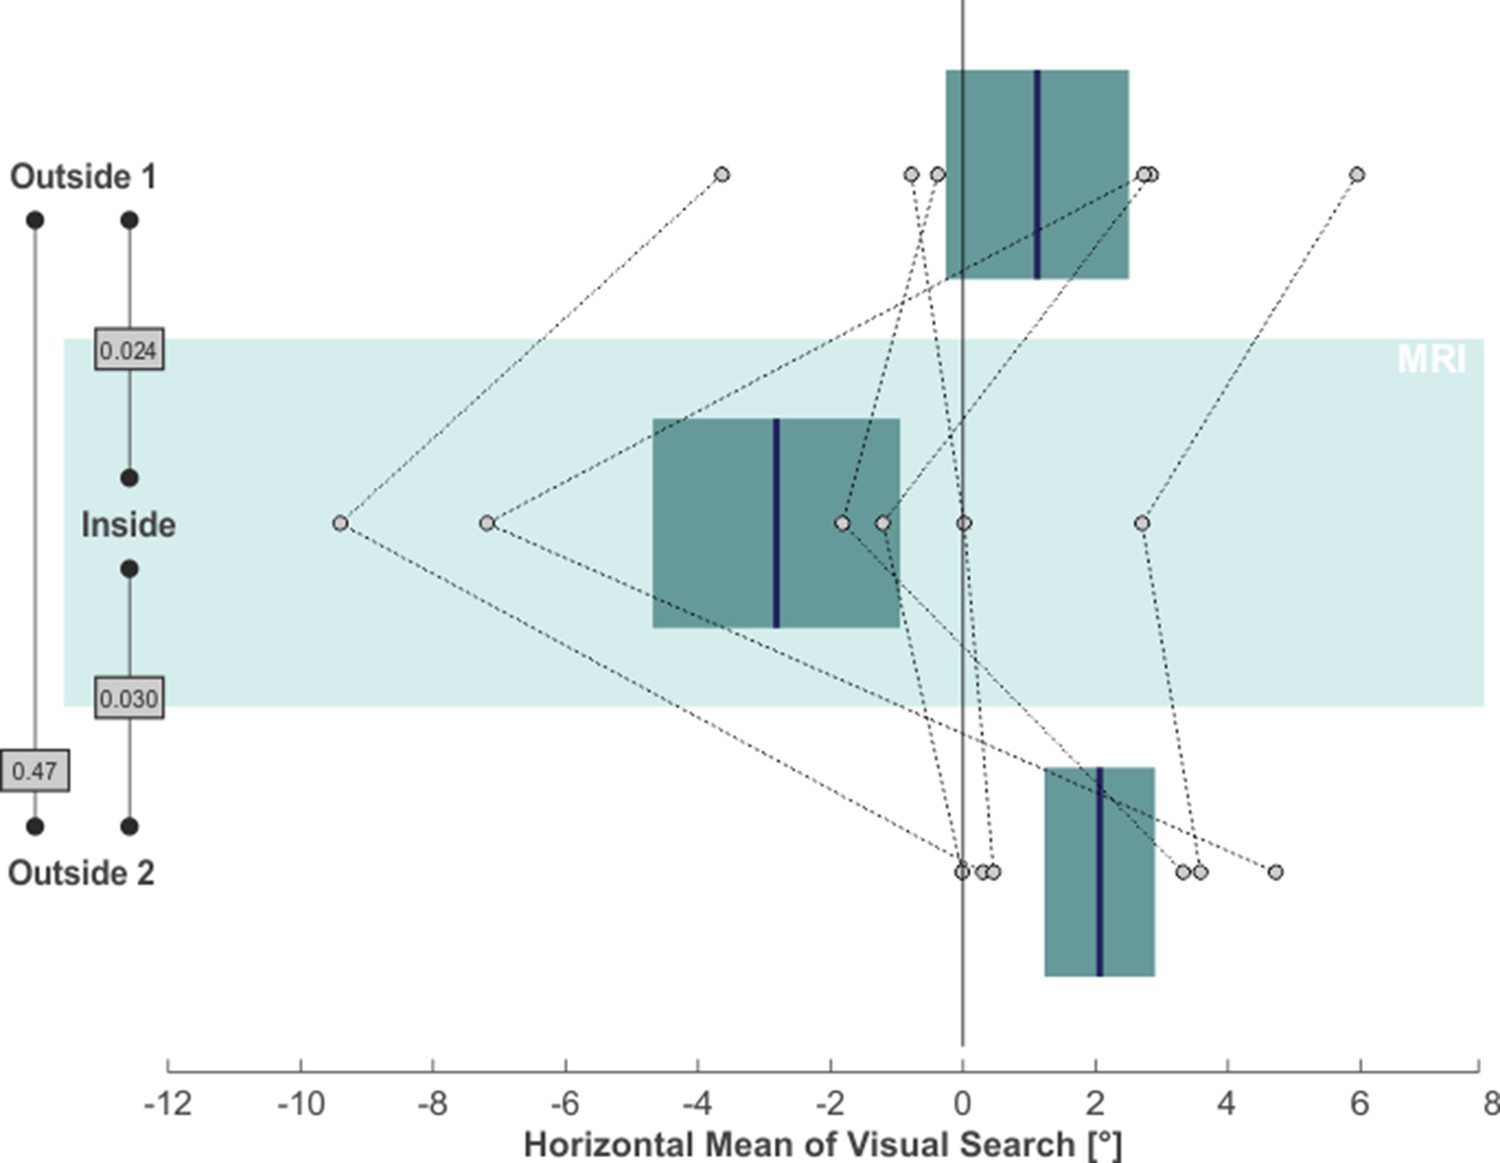
MVS-induced rightward bias in visual search.
Individual subjects’ horizontal mean saccade endpoints during visual search (in the absence of targets) are depicted as individual circles and for all three task phases (N = 17; positive values = right). The blue lines and the boxes reflect across subjects mean and SE (to account for our within-subject design, we removed the between-subject variance for calculation of the SE according to the procedure described by Masson and Loftus, 2003). The p-values of pairwise statistical comparisons are indicated in grey boxes.
Figure 3—figure supplement 1
Leftward bias in visual search during ‘feet first’ control experiment.
Individual subjects’ horizontal mean saccade endpoints during visual search (in the absence of targets) are depicted as individual circles and for all three task phases (N = 6; positive values = right). The blue lines and the boxes reflect across subjects mean and SE (to account for our within-subject design, we removed the between-subject variance for calculation of the SE according to the procedure described by Masson and Loftus, 2003). The p-values of pairwise statistical comparisons are indicated in grey boxes. The figure exhibits an MVS-induced leftward bias in visual search. The average horizontal mean of visual search t was significantly shifted towards the left for the inside phase (one-tailed paired t-tests; outside 1 vs. inside: t(5)=2.61, p = 0.024, g1[CI95%] = −1.07 [-2.06,–0.01]; inside vs. outside 2: t(5)=-2.42, p = 0.030, g1[CI95%] = −0.99 [-1.96, 0.04]). The measures did not significantly differ between phases outside 1 and 2 (two-tailed paired t-test: t(5)=-0.79, p = 0.47, g1[CI95%] = 0.32 [-0.52, 1.13]).
Figure 4 with 1 supplement
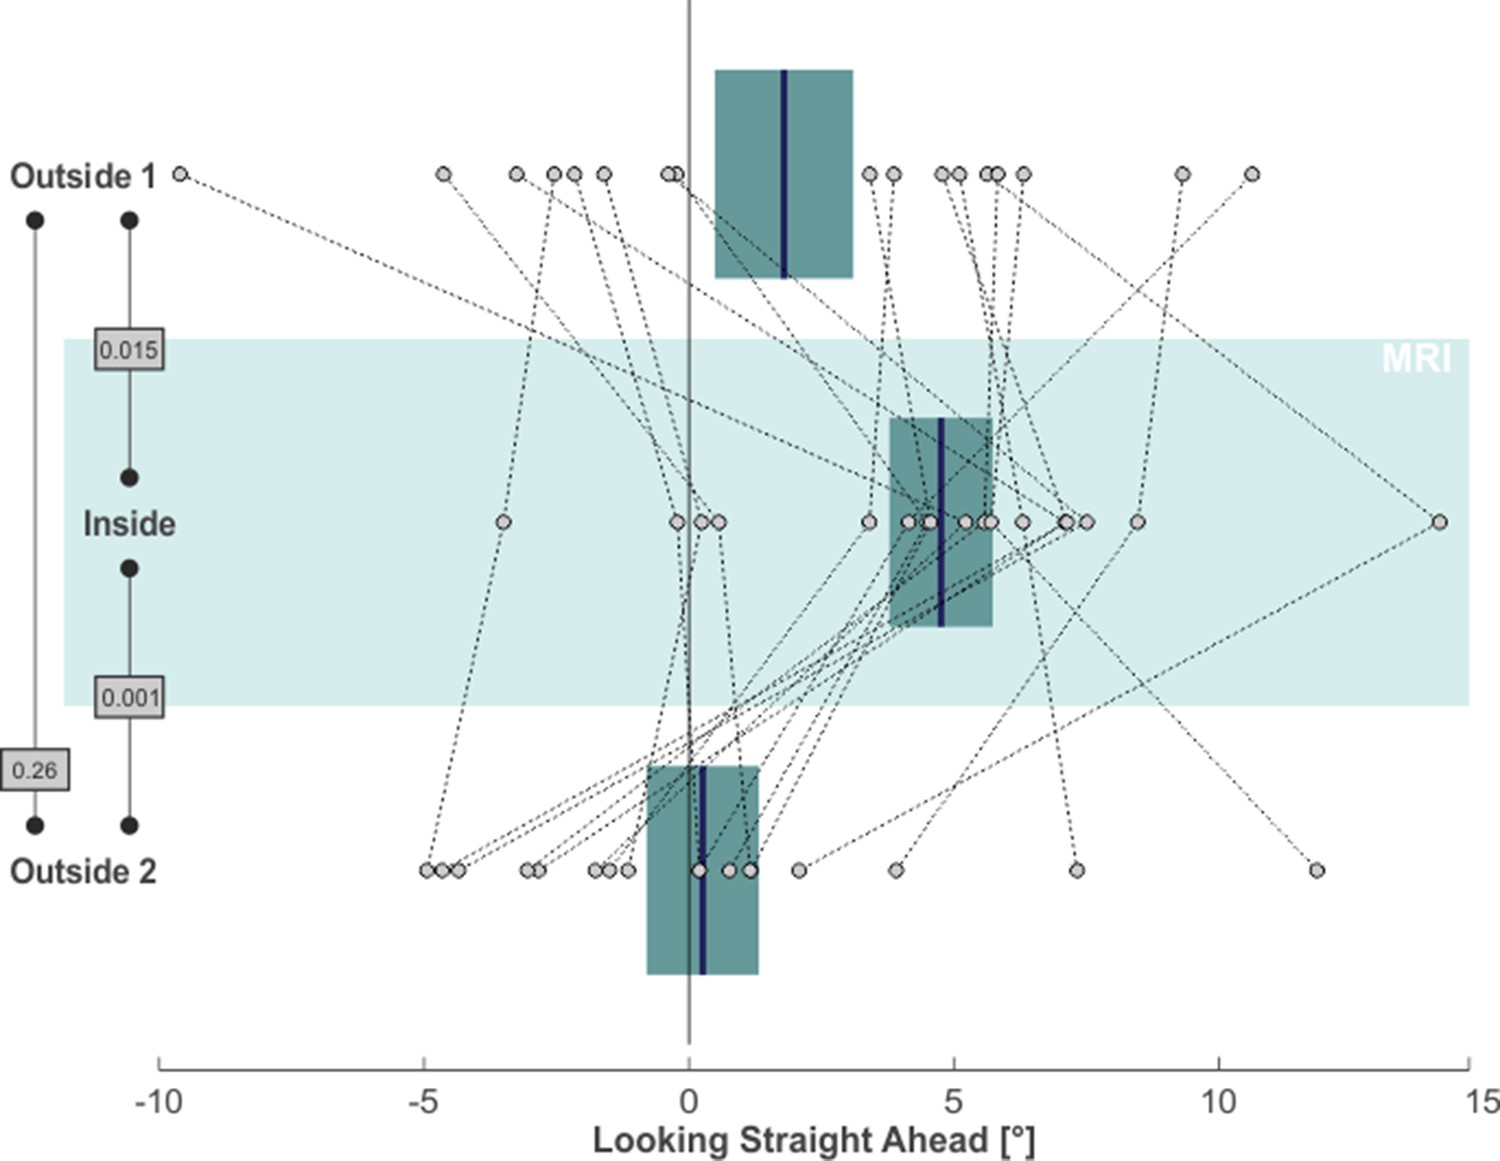
MVS-induced rightward bias in subjective straight-ahead (SSA).
Individual subjects’ SSA, namely the median horizontal saccade endpoint when trying to look straight ahead, is depicted by individual circles for all three task phases (N = 17; positive values = right). The blue lines and the boxes reflect across subjects mean and SE (to account for our within-subject design, we removed the between-subject variance for calculation of the SE according to the procedure described by Masson and Loftus, 2003). The p-values of pairwise statistical comparisons are indicated in grey boxes.
Figure 4—figure supplement 1

Leftward bias in subjective straight ahead (SSA) during ‘feet first’ control experiment.
Individual subjects’ SSA, namely the median horizontal saccade endpoint when trying to look straight ahead, is depicted by individual circles for all three task phases (N = 6; positive values = right). The blue lines and the boxes reflect across subjects means and SE (to account for our within-subject design, we removed the between-subject variance for calculation of the SE according to the procedure described by Masson and Loftus, 2003). The p-values of pairwise statistical comparisons are indicated in grey boxes. An MVS-induced leftward bias in subjective straight ahead (SSA) is apparent in this diagram. The SSA exhibited a significant leftward shift from the outside 1 to the inside phase (one-tailed paired t-test: t(5)=4.52, p = 0.003, g1[CI95%] = −1.24 [-2.3,–0.11]). This effect vanished after removing subjects from the scanner in the outside 2 phase (one-tailed paired t-test: t(5)=-3.86, p = 0.006, g1[CI95%] = −1.58 [-2.79,–0.31]). There was no significant difference between the SSA for phases outside 1 and 2 (two-tailed paired t-test: t(5)=0.82, p = 0.45, g1[CI95%] = 0.22 [-0.60, 1.02]).
Videos
Video 1
This video was taken after completion of our experiment.
It serves to illustrate the MVS-induced effects on eye movements in complete darkness. There was no obvious horizontal nystagmus when the subject was outside the scanner (at a position identical to outside 1 and 2 phases). A pronounced horizontal nystagmus was present inside the scanner (and already when the subject was being moved into the scanner). The horizontal nystagmus was alleviated when moving the subject outside the scanner. At the outside position virtually no nystagmus was present. Note that longer exposure times to the magnetic field inside the MRI-scanner would typically lead to an aftereffect of the VOR in the opposite direction (e.g. compare Roberts et al., 2011).
Additional files
Download links
A two-part list of links to download the article, or parts of the article, in various formats.
Downloads (link to download the article as PDF)
Open citations (links to open the citations from this article in various online reference manager services)
Cite this article (links to download the citations from this article in formats compatible with various reference manager tools)
Lying in a 3T MRI scanner induces neglect-like spatial attention bias
eLife 10:e71076.
https://doi.org/10.7554/eLife.71076


