Placental uptake and metabolism of 25(OH)vitamin D determine its activity within the fetoplacental unit
- The Institute of Developmental Sciences, Human Development and Health, Faculty of Medicine University of Southampton, United Kingdom
- Beckman Research Institute, City of Hope National Medical Center, United States
- Proteas Bioanalytics Inc, BioLabs at the Lundquist Institute, United States
- Institute of Metabolism and Systems Research, The University of Birmingham, United Kingdom
- NIHR Cambridge Biomedical Research Centre, Nutritional Biomarker Laboratory. MRC Epidemiology Unit, University of Cambridge School of Clinical Medicine, Clifford Allbutt Building, Cambridge Biomedical Campus, United Kingdom
- Formerly at MRC Elsie Widdowson Laboratory, Cambridge, CB1 9NL l Merck Exploratory Science Center, Merck Research Laboratories, United States
- Centre for Genomics and Child Health, Blizard Institute, Barts and The London School of Medicine and Dentistry, Queen Mary University of London, United Kingdom
- School of Water, Energy and Environment, Cranfield University, United Kingdom
- Merck Exploratory Science Center, Merck Research Laboratories, United States
- MRC Lifecourse Epidemiology Centre, University of Southampton, United Kingdom
- NIHR Applied Research Collaboration Wessex, Southampton Science Park, United Kingdom
- NIHR Southampton Biomedical Research Centre, University of Southampton and University Hospital Southampton NHS Foundation Trust, United Kingdom
- NIHR Oxford Biomedical Research Center, University of Oxford, United Kingdom
Figures
Figure 1
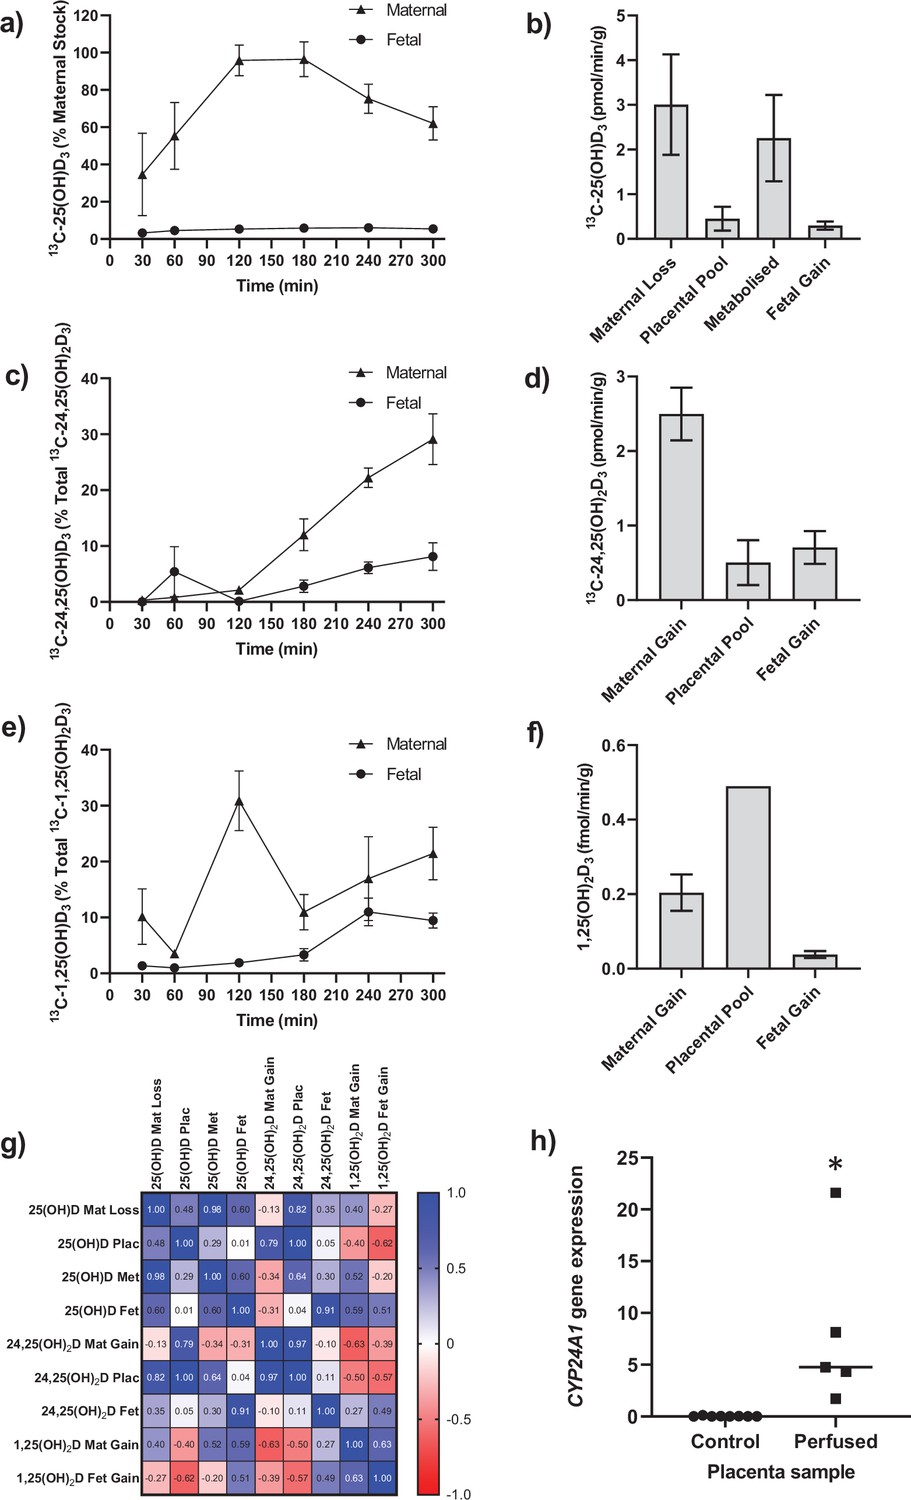
Transfer and metabolism of 13C-25(OH)D3 by the term perfused human placenta over 5 hr.
(a) 13C-25(OH)D3 in maternal and fetal circulations as a % of maternal perfusate concentration. (b) Rate of maternal 13C-25(OH)D3 lost from the maternal circulation, accumulated in placental tissue, metabolized, or transferred to the fetal circulation. (c) 13C-24,25(OH)2D3 transfer into the maternal and fetal circulations as a % of 13C-24,25(OH)2D3 metabolized by the placenta. (d) Rate of placental production of 13C-25(OH)D3 and transfer rate into the maternal and fetal circulations. (e) 1,25(OH)2D3 transfer into the maternal and fetal circulations as a % of 1,25(OH)2D3 produced by the placenta. (f) Rate of placental production of 13C-1,25(OH)2D3 and 1,25(OH)2D3 transfer into the maternal and fetal circulations. (g) Pearson’s correlations between metabolites. (h) Placental CYP24A1 relative mRNA expression was significantly increased in 13C-25(OH)D3 perfused placental samples compared to non-perfused control placental tissue samples (*p<0.05). Data are presented as mean (SEM).
-
Figure 1—source data 1
Metabolism data.
- https://cdn.elifesciences.org/articles/71094/elife-71094-fig1-data1-v1.xlsx
Figure 2
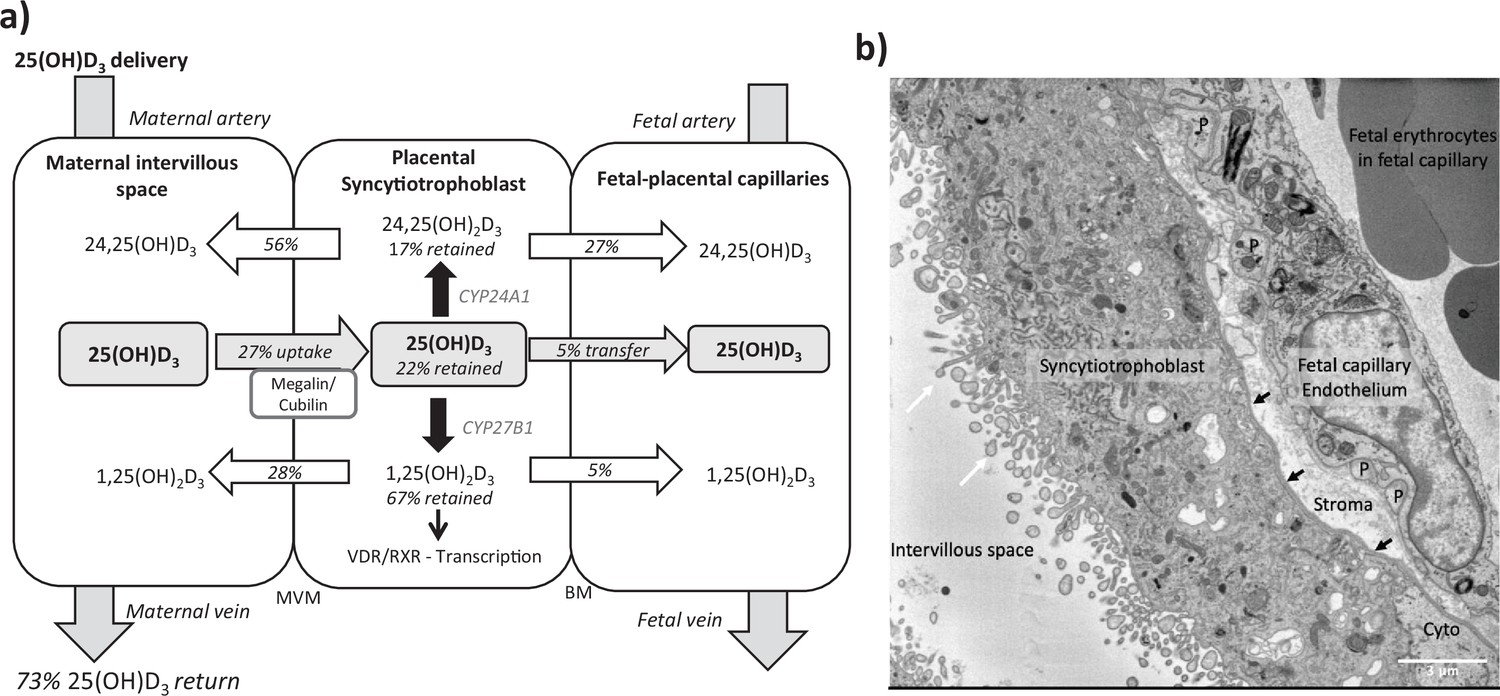
Summary of vitamin D transport and metabolism by the placenta.
(a) Schematic model of 13C-25(OH)D3 transfer and metabolism by the term perfused human placenta over 5 hr. (b) Electron microscopy image showing a cross section of the human placental barrier at term. The intervillous space is filled with maternal blood, the syncytiotrophoblast forms a continuous barrier across the surface of the villi, the microvilli on the apical plasma membrane are indicated by white arrows, and the syncytiotrophoblast basal membrane can be seen abutting the trophoblast basal lamina, which is indicated by black arrows. A small region of cytotrophoblast can be seen labeled ‘cyto’ between the syncytiotrophoblast and trophoblast basal lamina. The connective tissue of the villous stroma lies between the trophoblast and the fetal capillaries. The stroma also contains fibroblasts and macrophages that are not shown here. Pericyte fingers around the fetal capillary are labeled ‘P’. The fetal capillary endothelial cells form the fetal blood vessel.
Figure 3
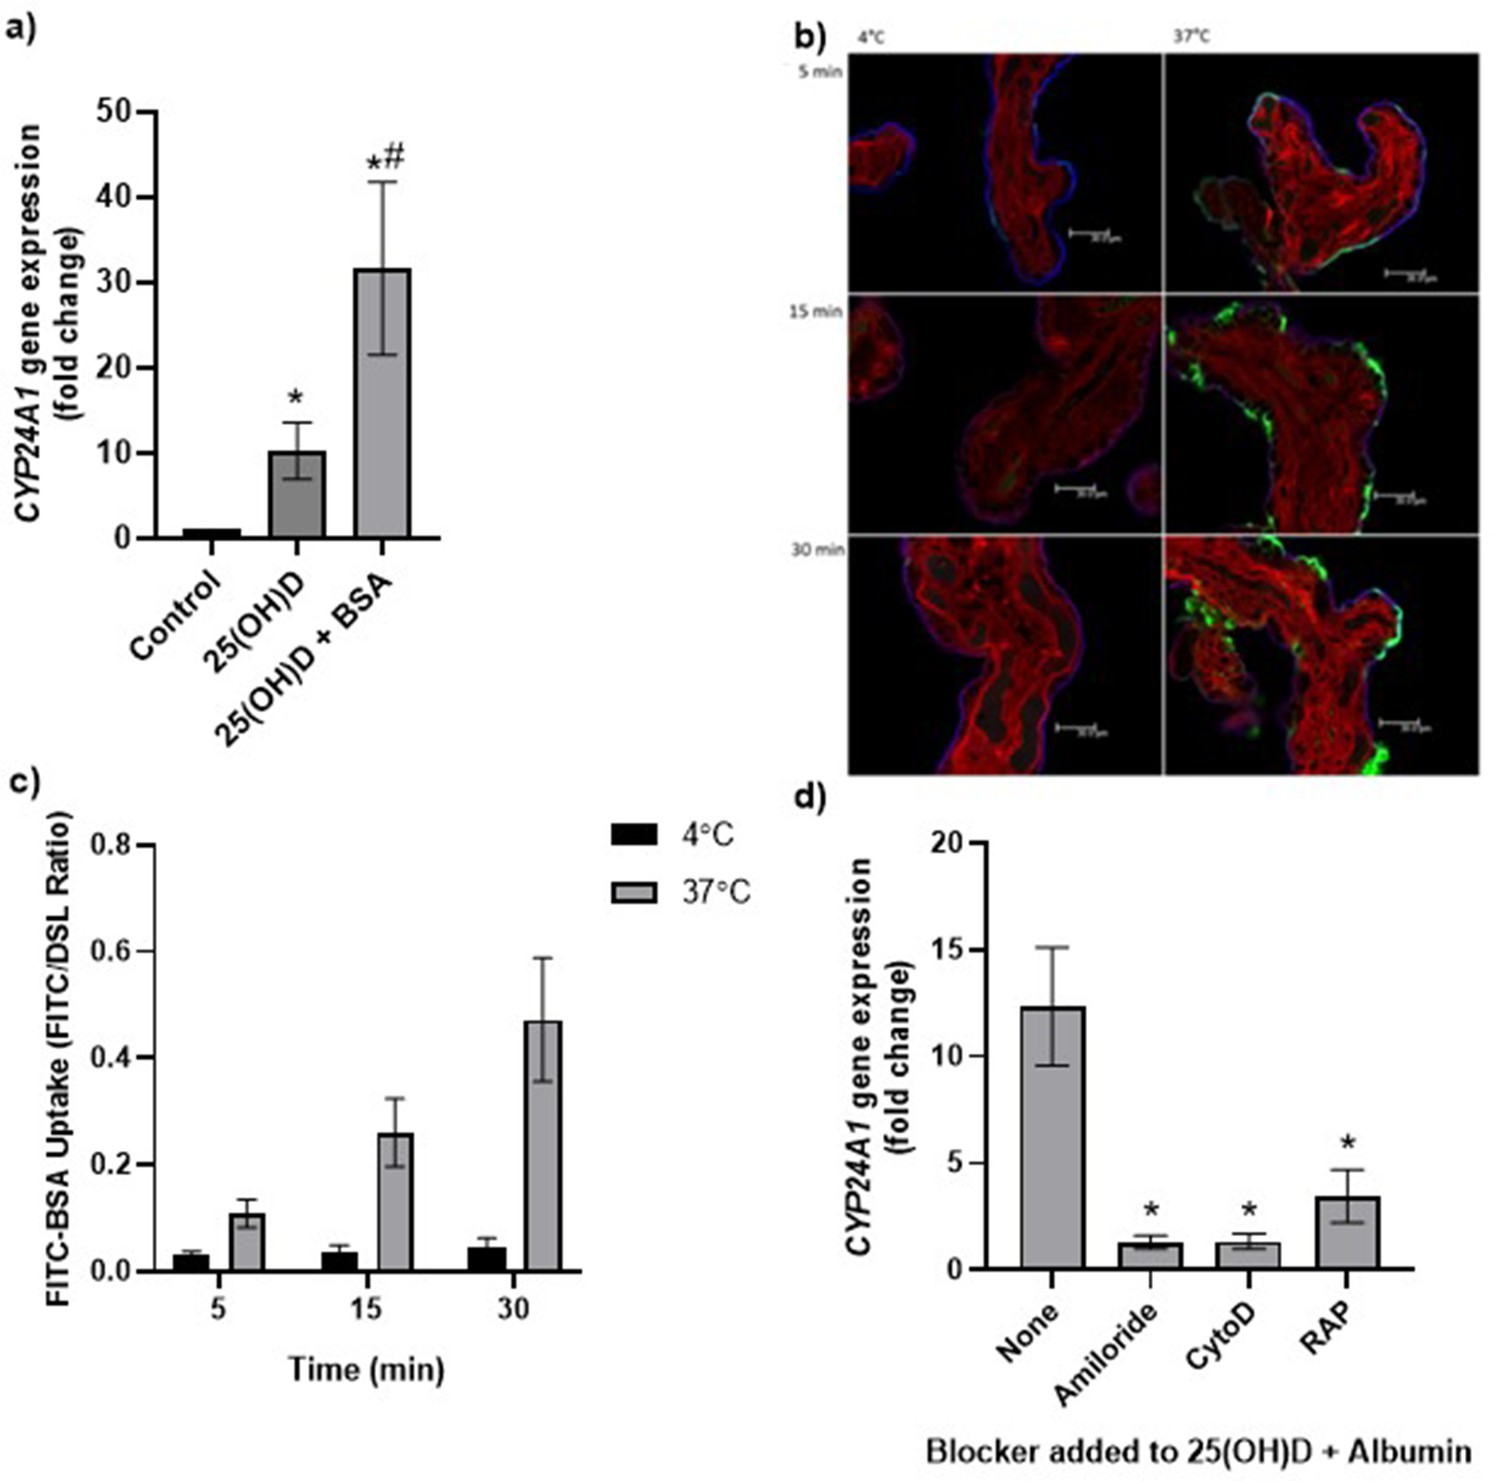
Uptake of 25(OH)D3 in placental villous fragments is facilitated by albumin and mediated by endocytic processes.
(a) Relative CYP24A1 mRNA expression was increased in placental villous fragments incubated with 25(OH)D3 (n = 15) compared to control (ethanol plus albumin, n = 15; *p<0.001) and was increased further with 25(OH)D3 and albumin (n = 6) compared to 25(OH)D3 alone (#p<0.05).
Uptake of FITC-albumin to placental fragments is mediated by endocytic mechanisms. (b) Representative images showing FITC-albumin uptake into placental villous fragments at 5, 15, and 30 min. Green, FITC-albumin; red, villous stroma stained by rhodamine-PSA; blue, MVM stained by biotin-DSL. (c) FITC-albumin uptake increased with time (p=0.03) and temperature (p=0.03), n = 3. (d) CYP24A1 gene expression was reduced by addition of the blockers amiloride, cytochalasin D (CytoD), and receptor-associated protein (RAP) compared to 25(OH)D plus albumin-stimulated expression with no blocker (*p<0.05; n = 4–5). BSA, bovine serum albumin. Data are presented as mean (SEM).
-
Figure 3—source data 1
Uptake data.
- https://cdn.elifesciences.org/articles/71094/elife-71094-fig3-data1-v1.xlsx
Figure 4 with 1 supplement
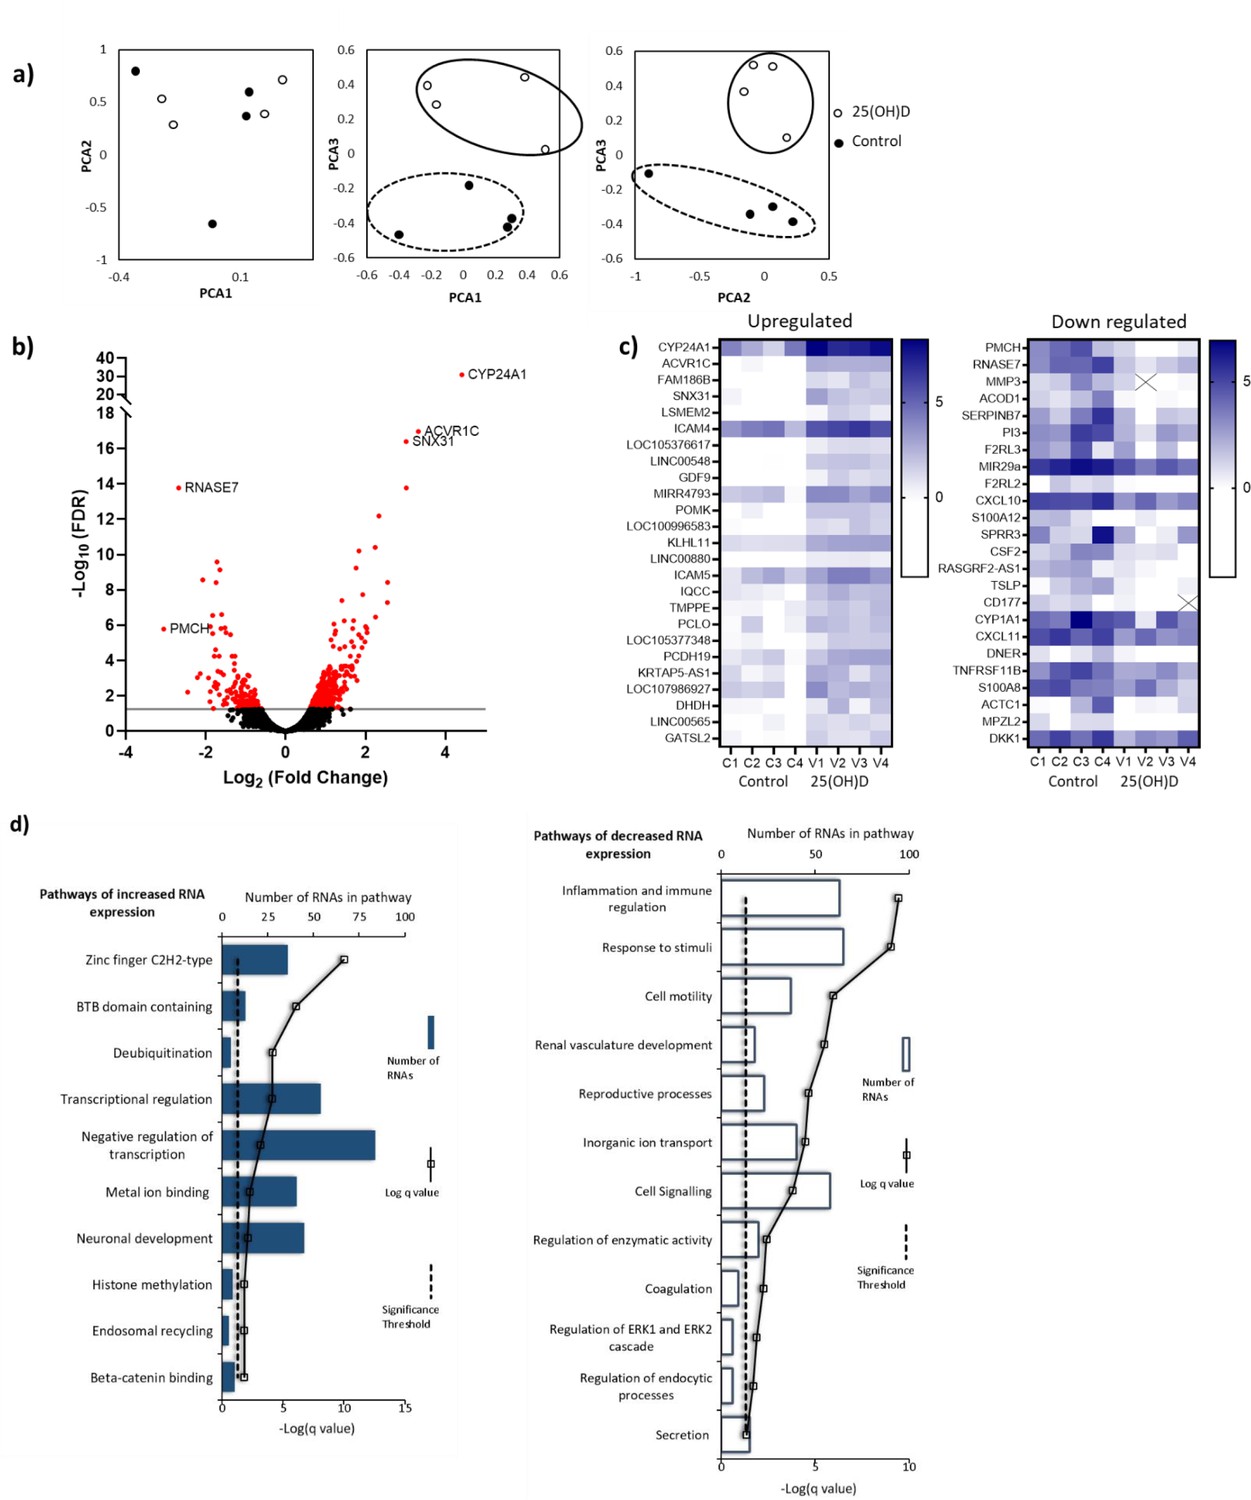
RNA-seq-derived gene signatures of human placental samples following 8 hr 25(OH)D3 incubation.
(a) Principal component analysis indicated clustering of 25(OH)D3-treated samples (clear) compared with control samples (black). (b) Volcano plot showing 493 genes were differentially expressed (red) at a false discovery rate (FDR)-adjusted p-value<0.05 (gray line). (c) Differentially expressed genes with a fold change of 1.5 or above at FDR 0.05 are presented as heatmaps [log2(normalized expression)]. (d) Pathway analysis (ToppGene) of all differentially expressed genes (no fold change cutoff) reveals both up- and downregulation of molecular function and biological process gene pathways following 8 hr 25(OH)D3 incubation. For pathway analysis, significance was adjusted using the Benjamini–Hochberg correction depicted by –log(B&H q-value) with a significance threshold of 1% (dashed line).
Figure 4—figure supplement 1
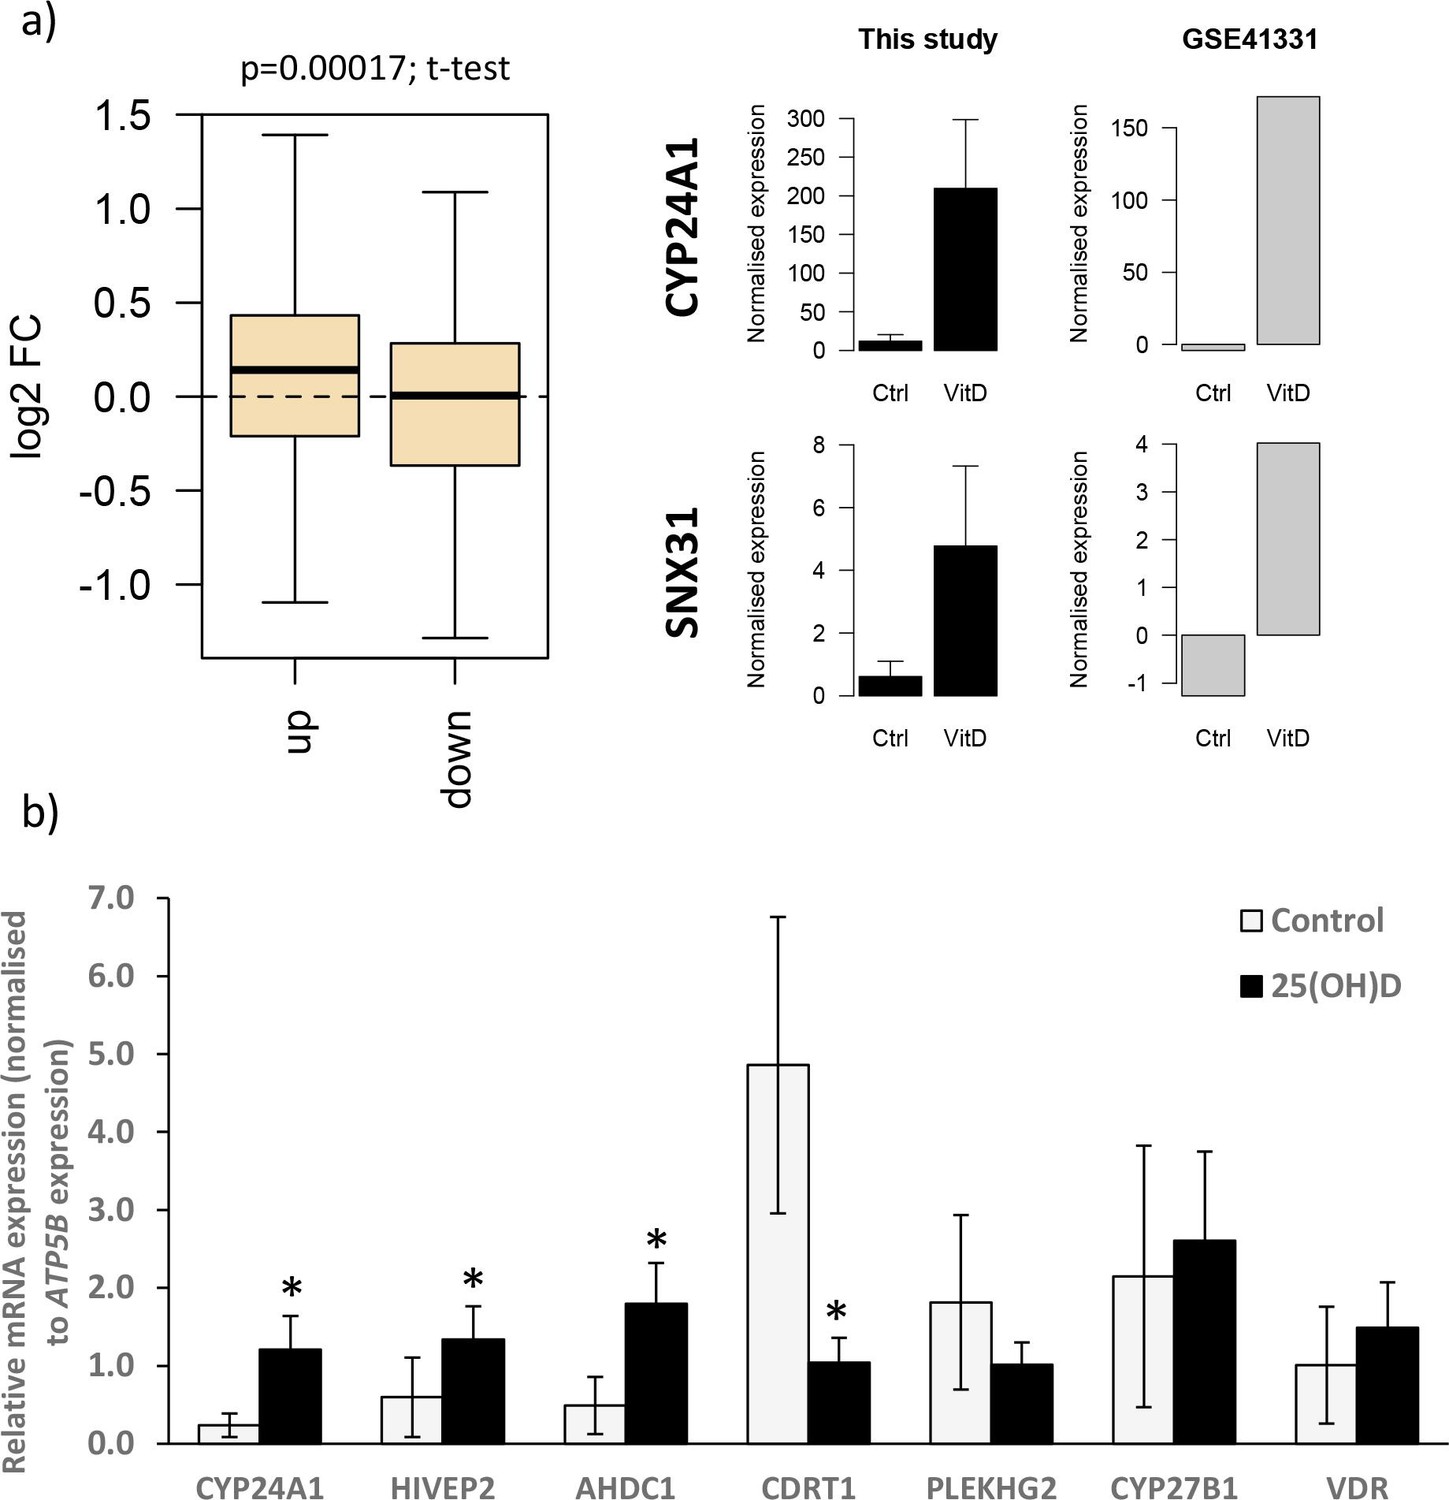
Gene expression changes following vitamin D incubation.
(a) Gene expression changes observed in this study following 8 hr 25(OH)D3 exposure were compared with those in a published dataset from human placenta (GSE41331), which looked at longer-term vitamin D response (24 hr). Genes that were upregulated following 8 hr exposure also tended to have increased expression in the 24 hr dataset, whereas downregulated genes were unchanged. Differentially expressed genes in common between both placental datasets included CYP24A1 and SNX31. (b) Relative mRNA expression levels for selected genes that in the RNA-seq dataset had increased (CYP24A1, HIVEP2, AHDC1), decreased (CDRT1, PLEKHG2), or unaltered (CYP27B1, VDR) expression levels following 8 hr 25(OH)D3 incubation (*p<0.05). Data are presented as mean (SD).
Figure 5 with 1 supplement
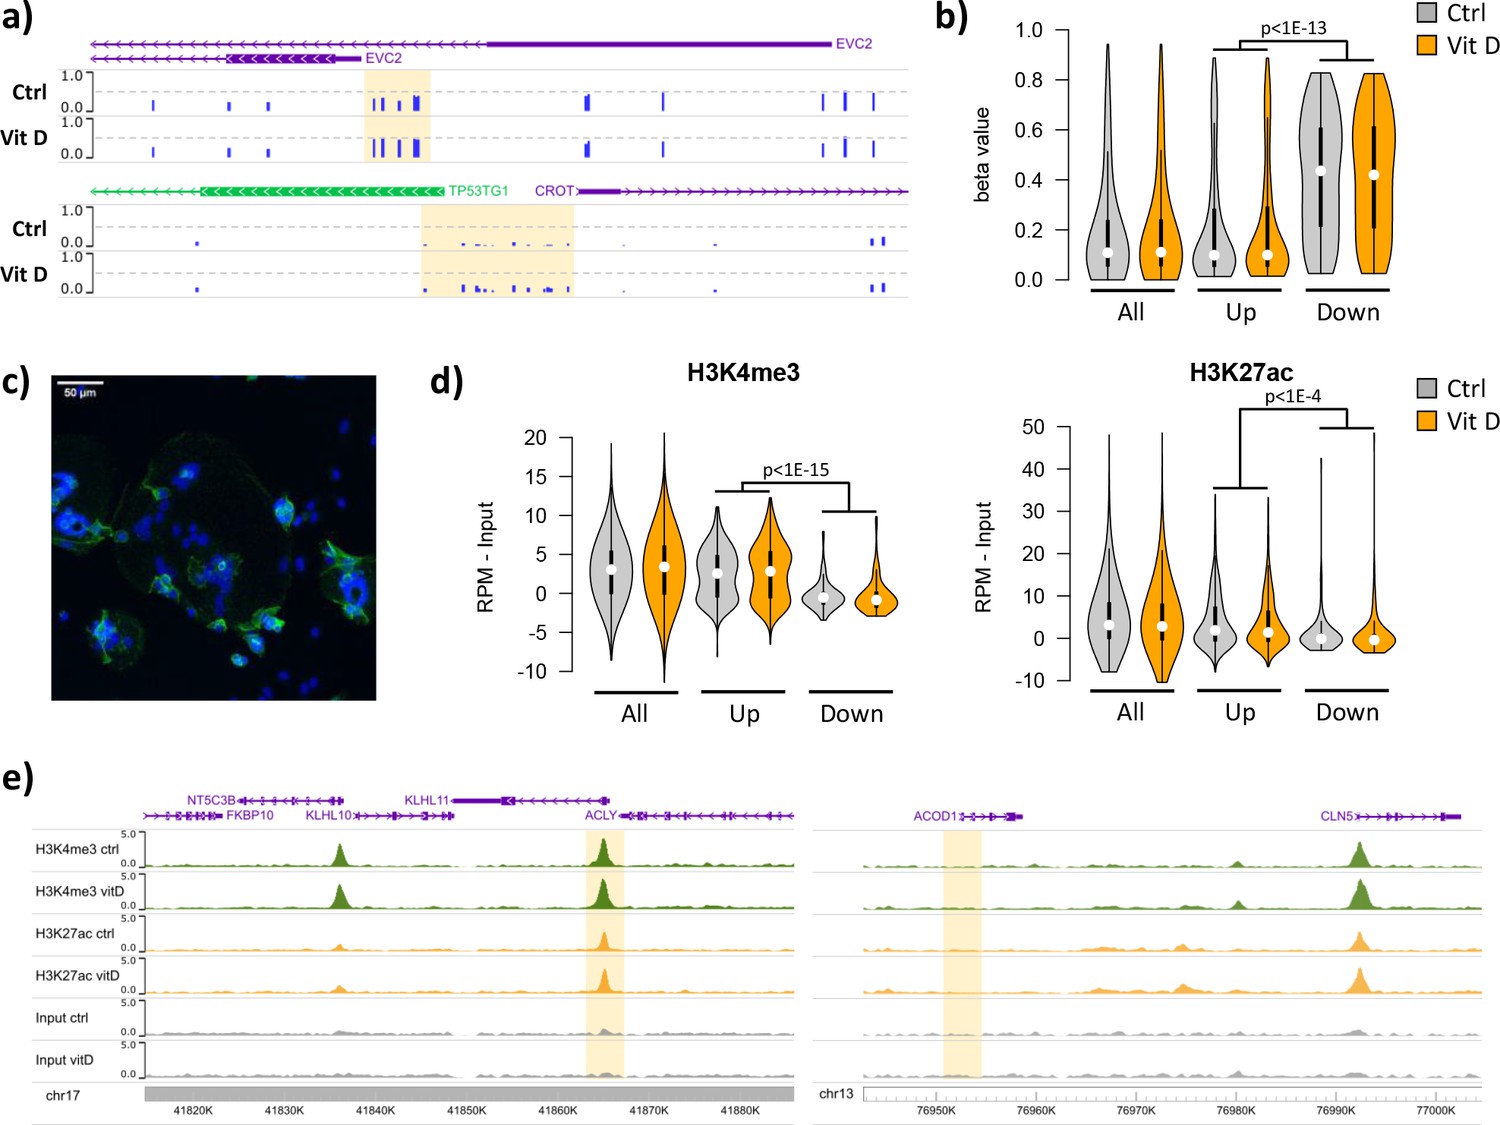
Short-term vitamin D exposure has limited effects on placental methylation, but the pre-existing epigenetic landscape has a major effect on vitamin D-mediated transcription.
(a) Placental fragments were exposed for 8 hr to 25(OH)D3, which led to limited alterations in DNA methylation compared to incubation with control buffer. Shown are two examples of clusters of hypermethylated CpGs (highlighted in yellow), where the blue bars represent the array’s beta value for individual CpGs. (b) The promoters of the upregulated genes identified in the RNA-seq data displayed lower methylation than those of downregulated genes in both control and 25(OH)D3-treated conditions. To extend these observations, we performed ChIP-seq on syncytialized cytotrophoblast cells incubated with 20 μM 25(OH)D3 or control cell culture medium for 24 hr (n = 2 placentas). (c) Representative confocal microscopy image of cytotrophoblast cells cultured for 90 hr and stained with DAPI (blue; nuclei) and desmoplakin (green), present on the cell surface. Multiple nuclei within a single-cell demonstrate syncytialization has occurred. (d) The promoters of upregulated genes (identified in the RNA-seq data) displayed higher levels of both H3K4me3 and H3K27ac than those seen at downregulated genes. (e) Examples of specific upregulated (KLHL11) and downregulated (ACOD1) genes, showing no changes in the enrichment of H3K4me3 or H3K27ac at the promoter (highlighted in yellow) when comparing control and vitamin D conditions.
Figure 5—figure supplement 1
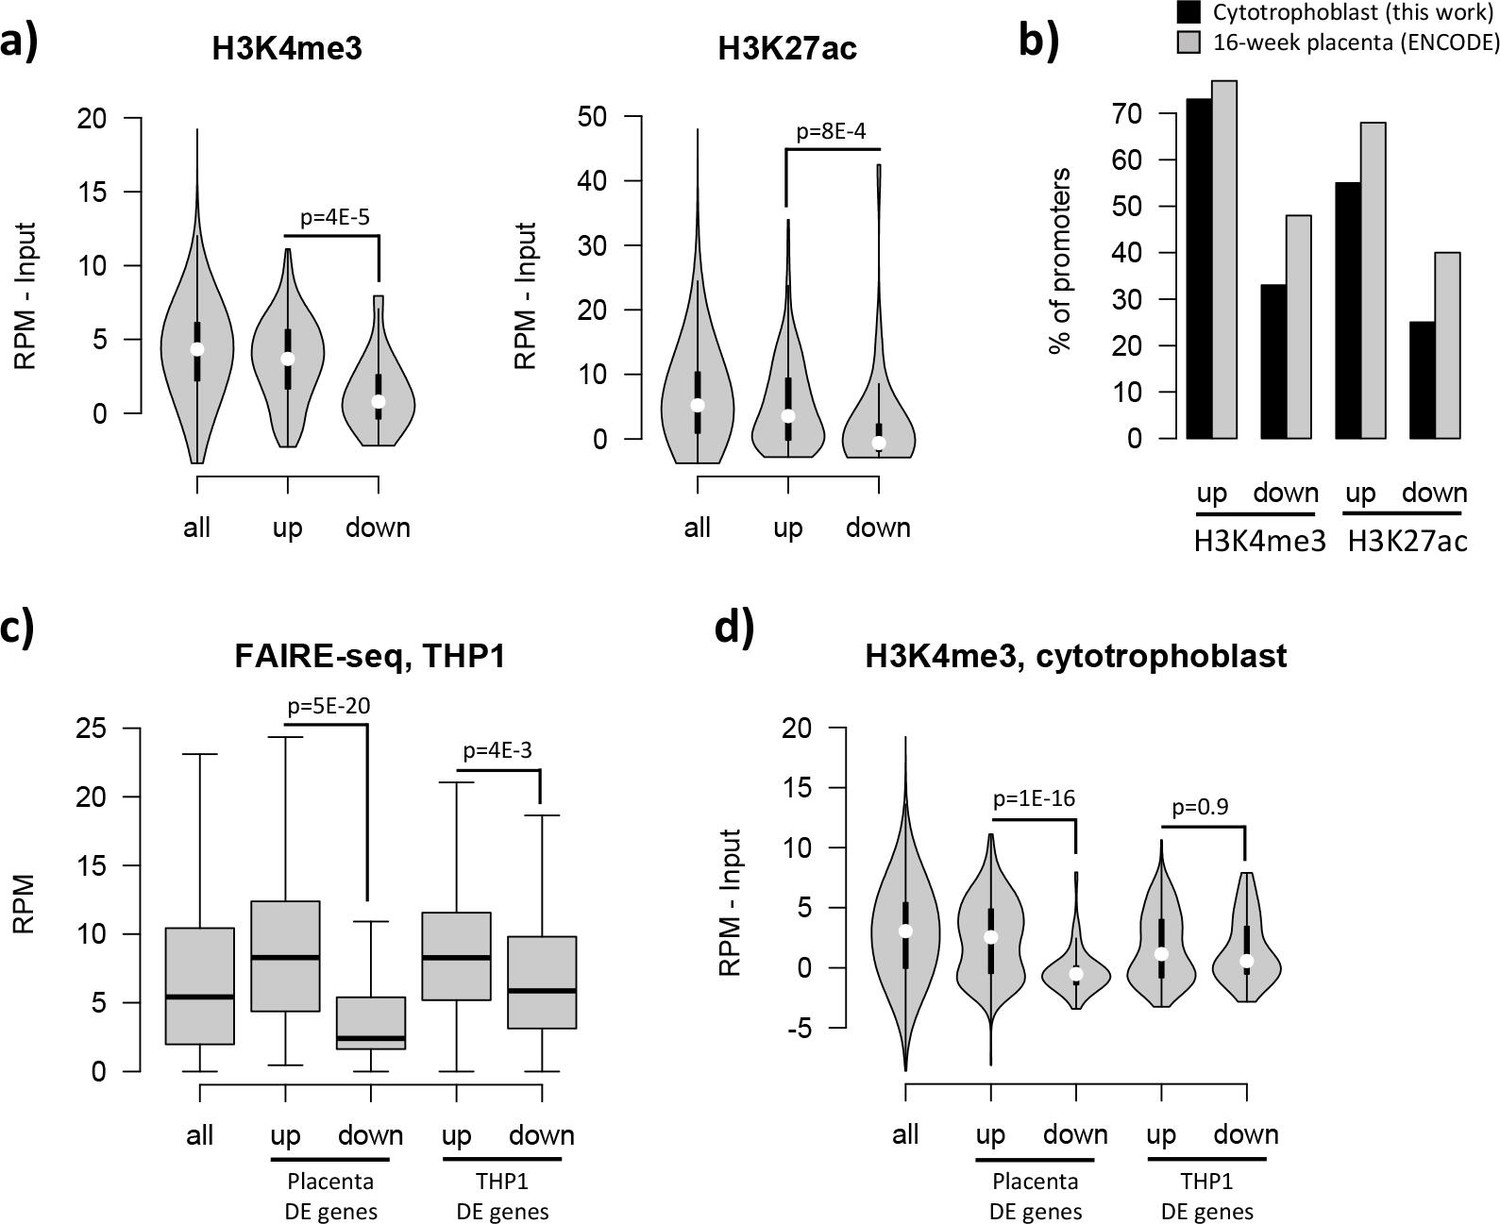
The effects of the pre-existing epigenetic landscape on vitamin D mediated transcription.
(a) Promoters of upregulated genes displayed higher levels of both H3K4me3 and H3K27ac than those seen at downregulated genes: this pattern was also seen when focusing only on CpG island promoters. (b) Although our ChIP-seq data is from isolated cytotrophoblast, very similar patterns were observed in ENCODE data from 16-week placenta. (c) Open chromatin (FAIRE-seq) data from THP1 cells treated with 1,25(OH)2D3 for 4 hr. The promoters of both placenta- and THP1-upregulated genes displayed open chromatin in THP1 cells. (d) H3K4me3 levels in the placenta were higher for promoters of placenta-upregulated genes than for THP1-upregulated ones.
Figure 6
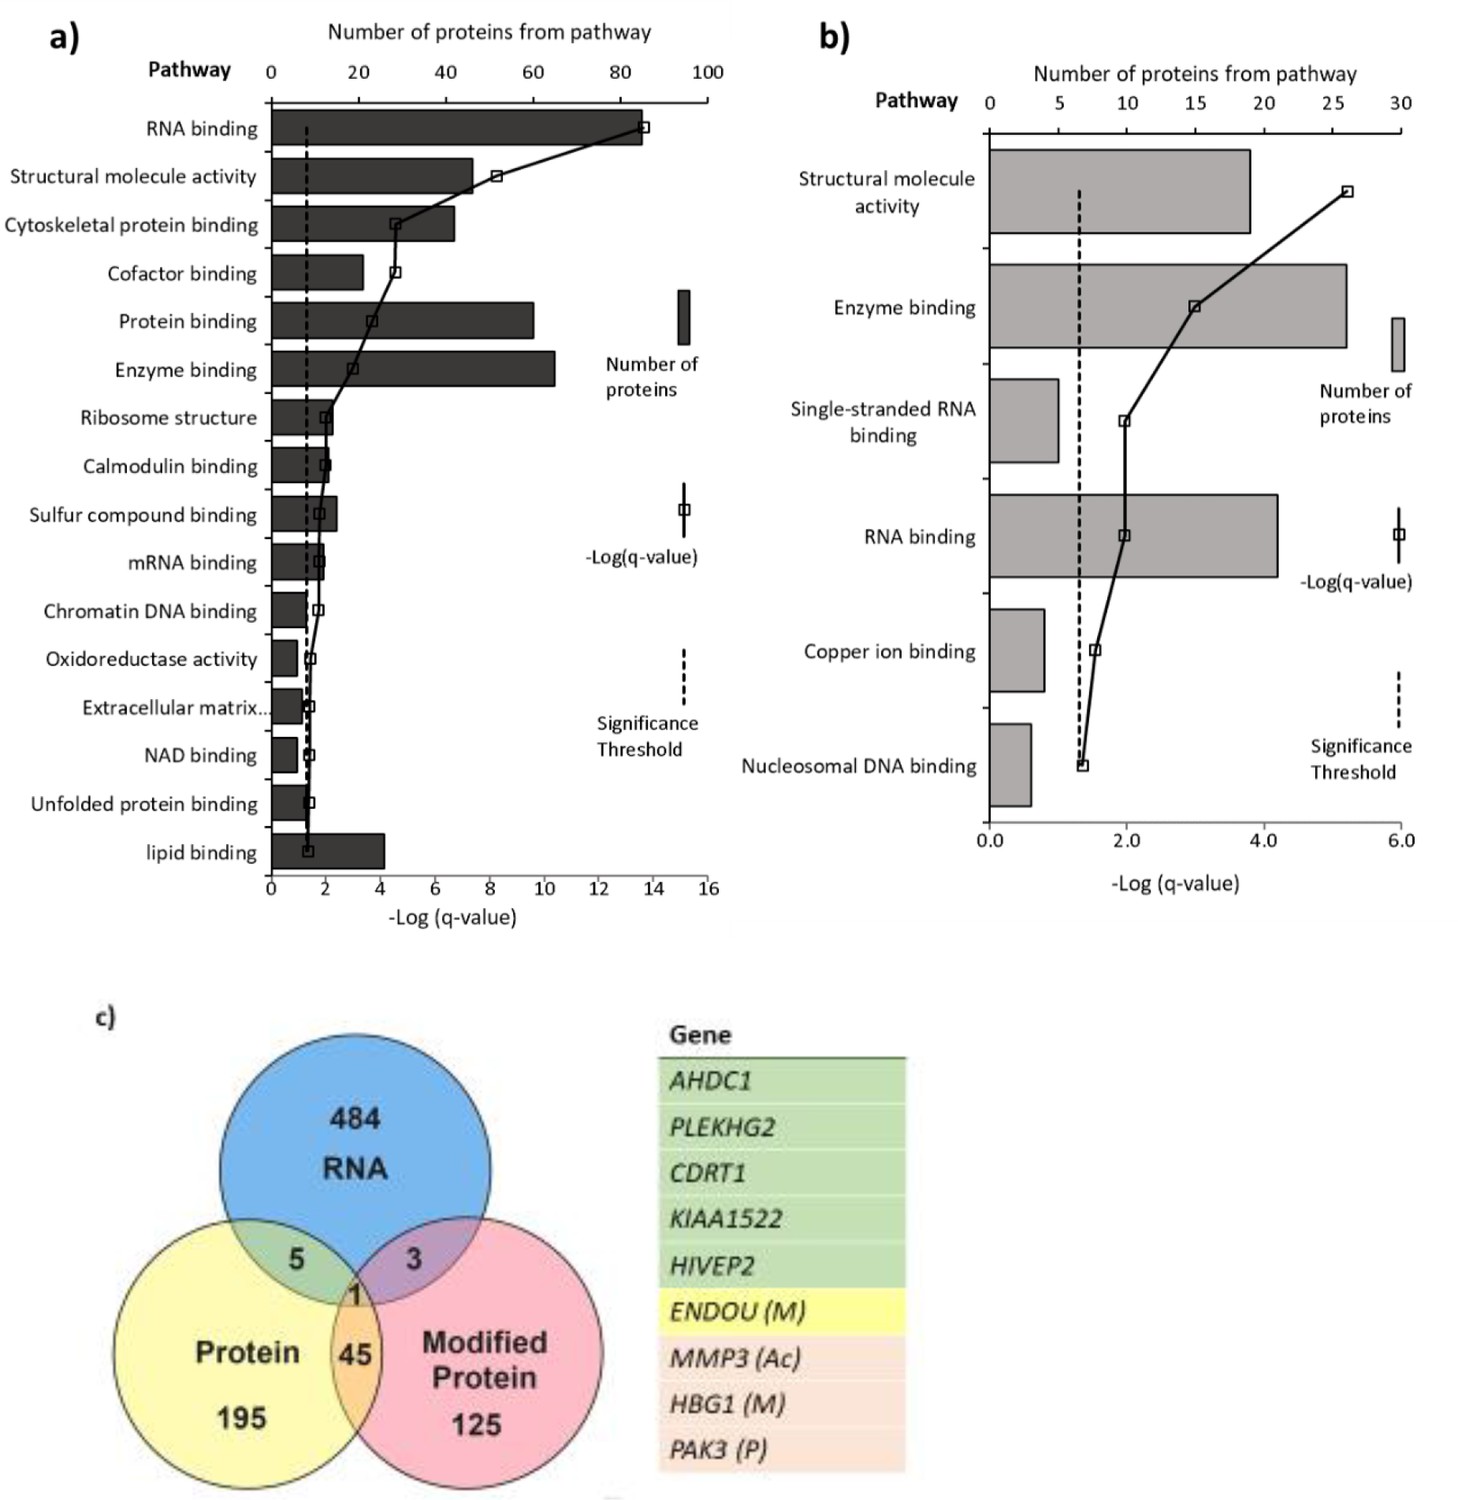
Pathways with (a) altered protein and (b) methylated protein expression in response to 25(OH)D3 treatment.
Significantly altered pathways from genes mapped to sites of altered protein expression. Pathways identified using ToppGene and displayed as –log q-value. (c) Alignment of RNA and protein expression data. Nine genes were altered at both the RNA and protein level. M, methylated protein; Ac, acetylated protein; P, phosphorylated protein.
Tables
Table 1
Associations of offspring size and vitamin D receptor relative mRNA expression in the Southampton Women’s Survey.
| VDR mRNA expression | |||
|---|---|---|---|
| r | p | n | |
| Size z-scores | |||
| 19-week HC | –0.20 | 0.25 | 58 |
| 19-week AC | –0.03 | 0.83 | 58 |
| 19-week FL | –0.05 | 0.74 | 58 |
| 34-week HC | –0.33 | 0.001 | 59 |
| 34-week AC | –0.32 | 0.02 | 59 |
| 34-week FL | –0.28 | 0.04 | 59 |
| Birth data | |||
| Placenta weight (g) | –0.22 | 0.03 | 101 |
| Birth weight (g) | –0.19 | 0.06 | 102 |
| CHL (cm) | –0.22 | 0.03 | 102 |
| DXA lean mass (g) | –0.24 | 0.02 | 102 |
| DXA fat mass (g) | –0.22 | 0.03 | 102 |
| 4-year data | |||
| DXA lean mass (kg) | –0.42 | 0.005 | 46 |
| DXA fat mass (kg) | –0.35 | 0.02 | 46 |
| Weight (kg) | –0.32 | 0.02 | 56 |
-
AC: abdominal circumference; CHL: crown-heel length; DXA: dual-energy X-ray absorptiometry measurements; FL: femur length; HC: head circumference; VDR: vitamin D receptor.
-
Table 1—source data 1
qPCR vitamin D receptor data.
- https://cdn.elifesciences.org/articles/71094/elife-71094-table1-data1-v1.xlsx
Key resources table
| Reagent type (species) or resource | Designation | Source or reference | Identifiers | Additional information |
|---|---|---|---|---|
| Sequence- based reagent | CYP24A1_F | This paper | PCR primers | GAAAGAATTGTA TGCTGCTGTCA |
| Sequence- based reagent | CYP24A1_R | This paper | PCR primers | CACATTAGACTG TTTGCTGTCGT |
| Sequence- based reagent | CYP24A1_Probe | Universal ProbeLibrary (human): https://lifescience.roche.com/global_en/brands/universal-probe-library.html | PCR probe | UPL# 78 |
| Sequence- based reagent | CDRT1_F | This paper | PCR primers | TGCAACCCC AAATTACTGCT |
| Sequence- based reagent | CDRT1_R | This paper | PCR primers | GATGTCTTGA TTGAGCCCTGA |
| Sequence- based reagent | CDRT1_Probe | Universal ProbeLibrary | PCR probe | UPL# 74 |
| Sequence- based reagent | CYP27B1_F | This paper | PCR primers | CGCAGCTGT ATGGGGAGA |
| Sequence- based reagent | CYP27B1_R | This paper | PCR primers | CACCTCAAAAT GTGTTAGGATCTG |
| Sequence- based reagent | CYP27B1_Probe | Universal ProbeLibrary | PCR probe | UPL# 53 |
| Sequence- based reagent | HIVEP2_F | This paper | PCR primers | CGGCAAGCT TACATCATCAA |
| Sequence- based reagent | HIVEP2_R | This paper | PCR primers | AGGACGCATC AGGTTTCATC |
| Sequence- based reagent | HIVEP2_Probe | Universal ProbeLibrary | PCR probe | UPL# 38 |
| Sequence- based reagent | PLEKHG2_F | This paper | PCR primers | TCCCCTAGGA TTCTCTGAAGC |
| Sequence- based reagent | PLEKHG2_R | This paper | PCR primers | GGAGGACCCA CACCAAATAA |
| Sequence- based reagent | PLEKHG2_Probe | Universal ProbeLibrary | PCR probe | UPL# 76 |
| Sequence- based reagent | VDR_F | This paper | PCR primers | TCTGTGACCC TAGAGCTGTCC |
| Sequence- based reagent | VDR_R | This paper | PCR primers | TCCTCAGAGGT GAGGTCTCTG |
| Sequence- based reagent | VDR_Probe | Universal ProbeLibrary | PCR probe | UPL# 43 |
| Sequence- based reagent | AHDC1_F | This paper | PCR primers | CCCCAGGACA CCTCTCTACC |
| Sequence- based reagent | AHDC1_R | This paper | PCR primers | CATTTAATTCTT CATACCAATCCTTG |
| Sequence- based reagent | AHDC1_Probe | Universal ProbeLibrary | PCR probe | UPL# 38 |
| Sequence- based reagent | CUBN_F | This paper | PCR primers | GGACAATGT CAGAATAG CTTCGT |
| Sequence- based reagent | CUBN_R | This paper | PCR primers | CAGTGGCT AGCAGGGCTTT |
| Sequence- based reagent | CUBN_Probe | Universal ProbeLibrary | PCR probe | UPL# 10 |
| Sequence- based reagent | LRP2_F | This paper | PCR primers | TTGTTTTGAT GCCTCTGATGA |
| Sequence- based reagent | LRP2_R | This paper | PCR primers | AGCTAGGCA TGTTCGCTCAG |
| Sequence- based reagent | LRP2_Probe | Universal ProbeLibrary | PCR probe | UPL# 34 |
| Sequence- based reagent | RXRα_F | This paper | PCR primers | ACATGCAGAT GGACAAGACG |
| Sequence- based reagent | RXRα_R | This paper | PCR primers | TCGAGAGCC CCTTGGAGT |
| Sequence- based reagent | RXRα_Probe | Universal ProbeLibrary | PCR probe | UPL# 26 |
Additional files
-
Supplementary file 1
RNA-seq data.
- https://cdn.elifesciences.org/articles/71094/elife-71094-supp1-v1.xlsx
-
Supplementary file 2
Differentially methylated promoters hg19.
- https://cdn.elifesciences.org/articles/71094/elife-71094-supp2-v1.xlsx
-
Transparent reporting form
- https://cdn.elifesciences.org/articles/71094/elife-71094-transrepform1-v1.docx
Download links
A two-part list of links to download the article, or parts of the article, in various formats.
Downloads (link to download the article as PDF)
Open citations (links to open the citations from this article in various online reference manager services)
Cite this article (links to download the citations from this article in formats compatible with various reference manager tools)
Placental uptake and metabolism of 25(OH)vitamin D determine its activity within the fetoplacental unit
eLife 11:e71094.
https://doi.org/10.7554/eLife.71094


