Live imaging reveals the cellular events downstream of SARM1 activation
- Washington University School of Medicine, United States
- Genetics, Washington University School of Medicine, United States
- Genetics, Hope Center for Neurological Disorders, Washington University School of Medicine, United States
- Developmental Biology, Needleman Center for Neurometabolism and Axonal Therapeutics, Washington University School of Medicine, United States
Figures
Figure 1 with 1 supplement
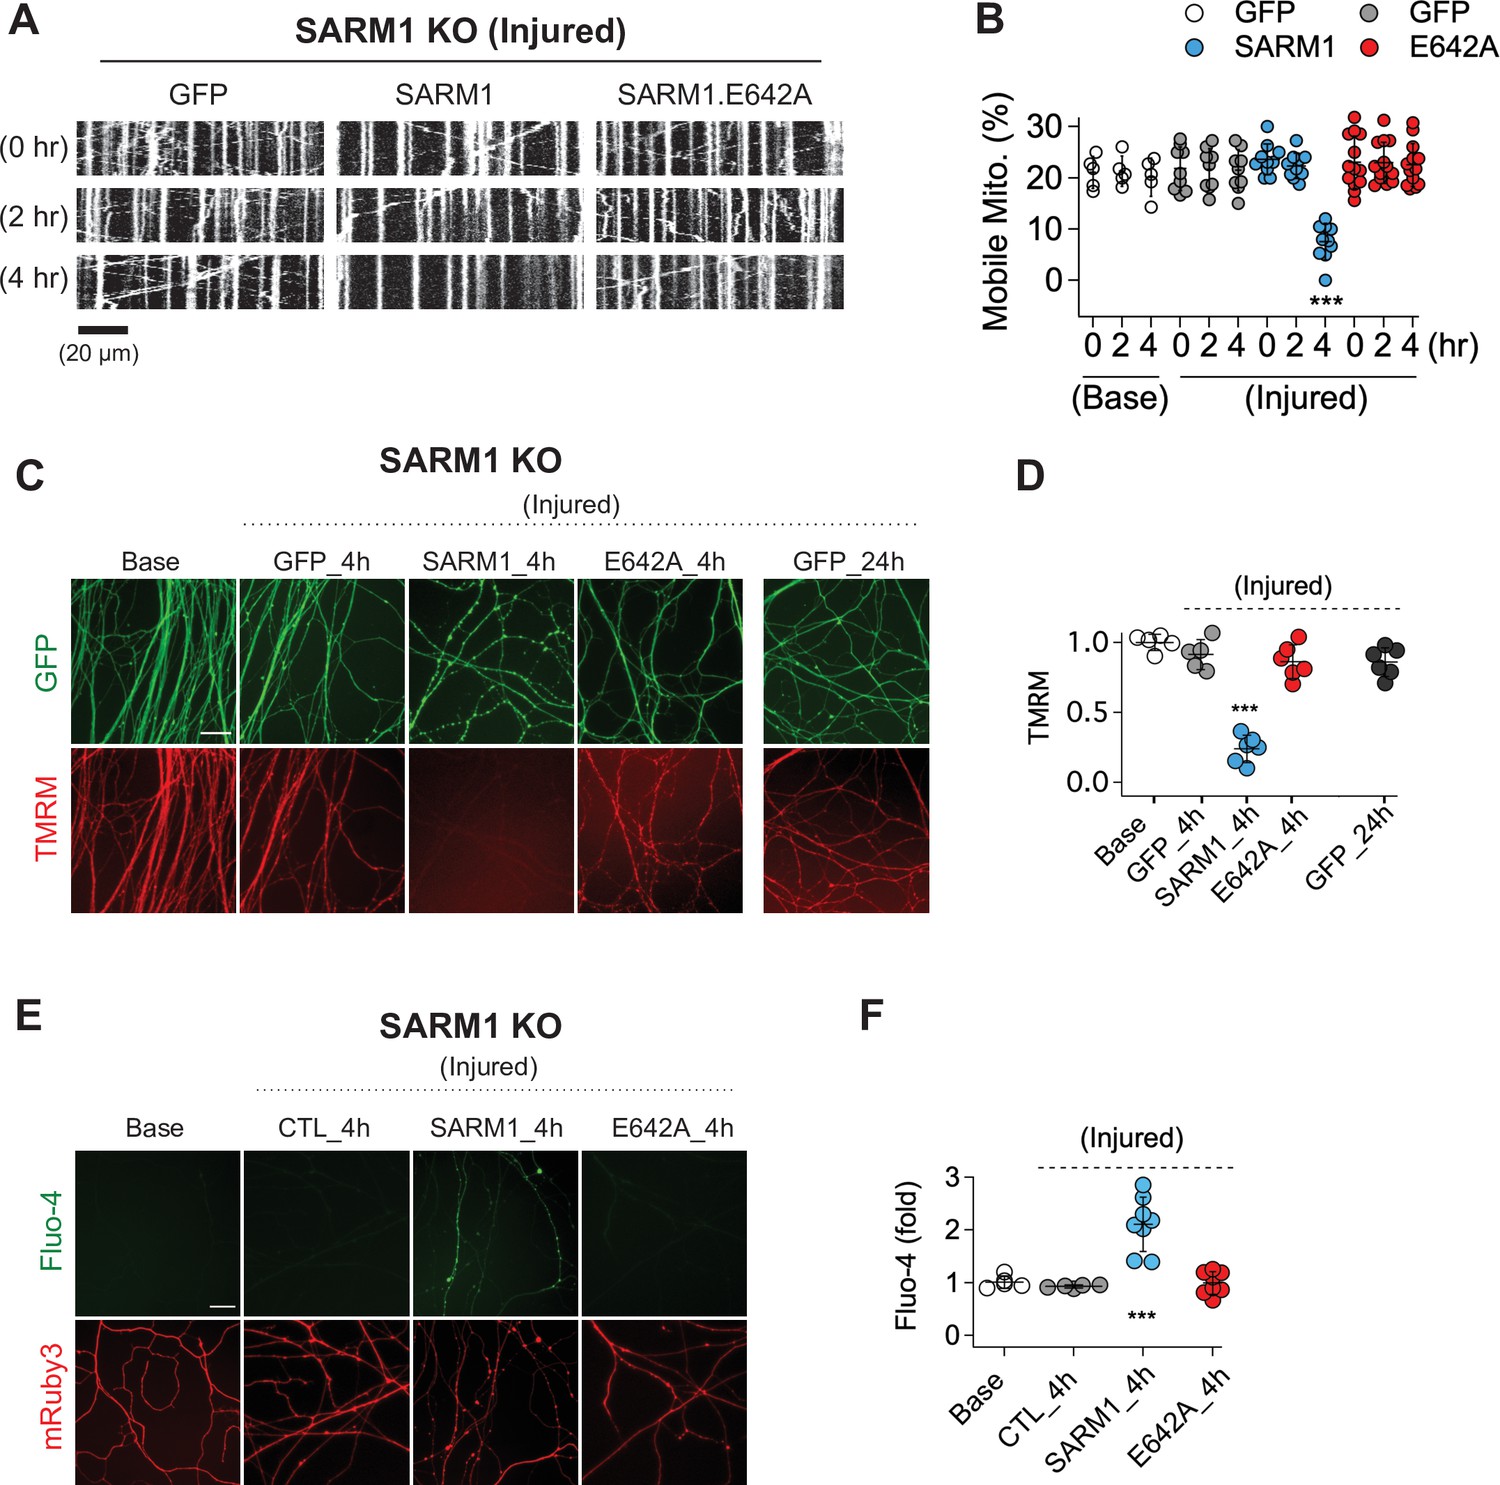
SARM1 enzymatic activity regulates mitochondrial movement and calcium homeostasis in injured axons.
(A) Representative kymograph of injured SARM1 KO axons expressing either GFP, SARM1, or SARM1.E642A (E642A). For imaging mitochondria movement, MitoDsRed lentivirus was transduced in all experimental conditions. Live cell imaging was performed at different times (0, 2, or 4 hr) after axon injury. Scale bar = 20 µm (B) Quantification of mobile mitochondria for the neurons in (A). Data represent the mean ± SEM; n = 5 ~ 13 axons for each condition; one-way ANOVA with post hoc Tukey test, F(11,99) = 12.28, p < 0.0001; NS, not significant; *, p < 0.05; **, p < 0.01 and ***, p < 0.001 (C) Representative images of mitochondrial potential imaged with 50 nM TMRM fluorescent dye in SARM1 KO axons expressing either of GFP, SARM1, or SARM1.E642A. Live-cell imaging was performed at the indicated times (0, 4, or 24 hr) after axon injury. Scale bar = 30 µm (D) Quantification of TMRM intensity from the experiment in (C). Injured SARM1 KO axons expressing the enzymatically disabled SARM1 mutant (E642A) maintained TMRM signal without significant loss. Data represent the mean ± SEM; n = 5 ~ 6 embryos for each condition; one-way ANOVA with post hoc Tukey test, F(4,23) = 53.11, p < 0.0001; NS, not significant; *, p < 0.05; **, p < 0.01 and ***, p < 0.001 (E) Representative images of calcium influx imaged with 1 µM Fluo-4 fluorescent dye in SARM1 KO axons expressing either of GFP, SARM1, or SARM1.E642A. Live-cell imaging was performed at different times (0, or 4 hr) after axon injury. Scale bar = 30 µm (F) Quantification of Fluo-4 intensity from the experiment in (E). Injured SARM1 KO axons expressing the enzymatically disabled SARM1 mutant (E642A) completely prevent calcium influx. Data represent the mean ± SEM; n = 5 ~ 8 embryos for each condition; one-way ANOVA with post hoc Tukey test, F(3,22) = 23.05, p < 0.0001; NS, not significant; *, p < 0.05; **, p < 0.01 and ***, p < 0.001.
Figure 1—figure supplement 1
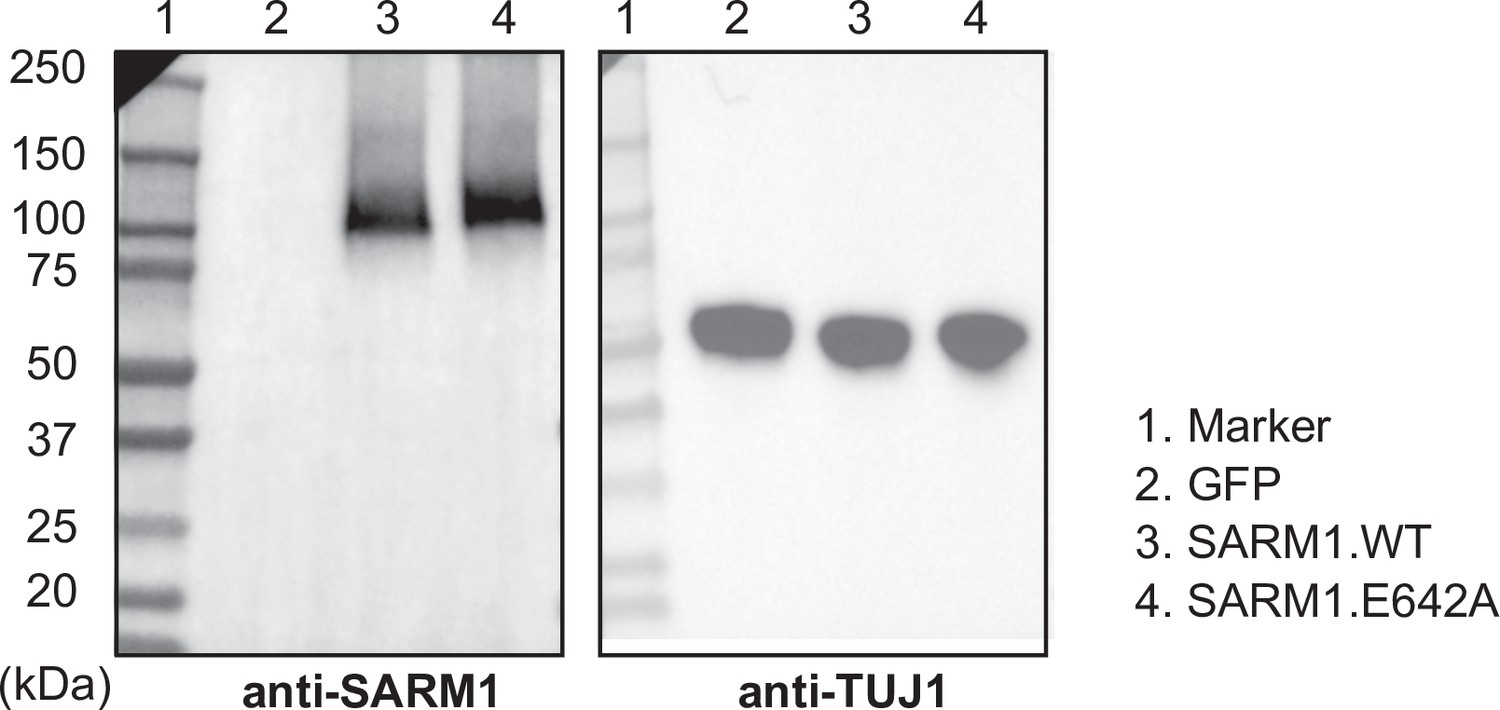
Expression level of SARM1.WT and SARM1.E642A.
Figure 2 with 1 supplement
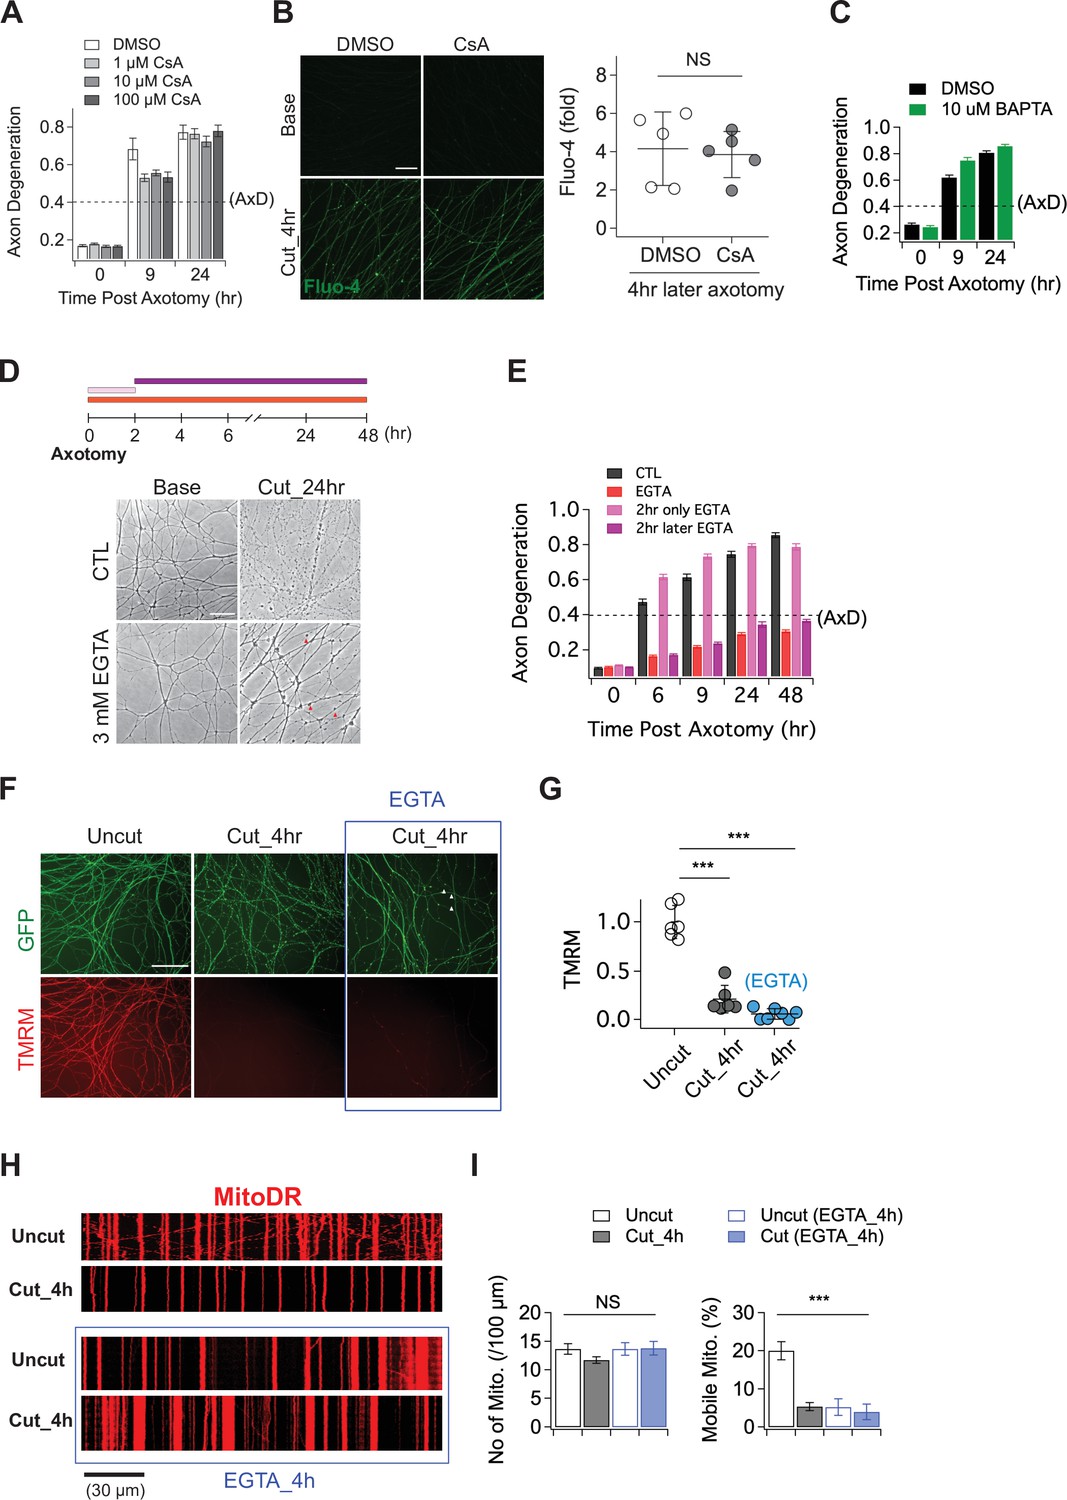
The role of calcium in axon degeneration.
(A) Pre-incubation of MPTP inhibitor (1, 10, or 100 µM CsA) did not significantly prevent the degeneration of wild-type axons after axon injury. Axon degeneration is defined as a degeneration index >0.4 (dashed line). n = 3 embryos for each condition. (B) (Left) Representative images of calcium influx acquired with 1 µM Fluo-4 dye. Scale bar = 30 µm (Right) The degree of calcium influx in CsA pre-incubated injured axons is not significantly different from DMSO pre-incubated injured axons. Fold increment of injured axons at 4 hr after axotomy is calculated from uninjured axons. Data represent the mean ± SEM; n = 5 embryos for each condition; two-tailed unpaired t test, p = 0.39; NS, not significant; *, p < 0.05; **, p < 0.01 and ***, p < 0.001 (C) Internal calcium chelator (pre-incubation with 10 µM BAPTA) did not delay axon degeneration after axonal injury. n = 3 embryos for each condition. Data represent the mean ± SEM; Axon degeneration is defined as a degeneration index >0.4 (dashed line). (D) (Top) Experimental design. Extracellular calcium chelator, 3 mM ETGA, was included in the culture medium at different time points (2 ~ 48 hr vs 0 ~ 2 hr vs 0 ~ 48 hr). For addition of EGTA from 0 ~ 2 hr, culture medium was replaced at 2 hr. (Bottom, left) Representative bright-field images of axons. (E) Quantification of axon degeneration for the experiment in (D). Although there are axonal swellings (red triangle) in the presence of EGTA, injured axons remain intact when the EGTA is present 2 hr after axotomy. n = 3 embryos for each condition. Data represent the mean ± SEM; Axon degeneration is defined as a degeneration index >0.4 (dashed line). (F) Representative images of mitochondria potential (TMRM fluorescent dye) and axon morphology (GFP lentivirus) in uncut axons and cut axons ±EGTA. Scale bar = 100 µm (G) Quantification of the TMRM staining for the experiment in (F). EGTA incubation in injured axons does not maintain mitochondrial hyperpolarization. Data represent the mean ± SEM; n = 6 ~ 7 embryos for each condition; one-way ANOVA with post hoc Tukey test, F(2,16) = 98.27, p < 0.0001; NS, not significant; *, p < 0.05; **, p < 0.01 and ***, p < 0.001 (H) Representative kymograph of uncut and cut axons ±EGTA as indicated. (I) Quantification of total number of mitochondria (left) and mobile mitochondria (right) for the experiment in (H). Data represent the mean ± SEM; n = 8 ~ 12 axons for each condition; one-way ANOVA with post hoc Tukey test, for mobile mitochondria F(3,24) = 16.34, p < 0.0001; for number of mitochondria, F(3,34) = 0.8787, p = 0.46; NS, not significant; *, p < 0.05; **, p < 0.01 and ***, p < 0.001.
Figure 2—figure supplement 1
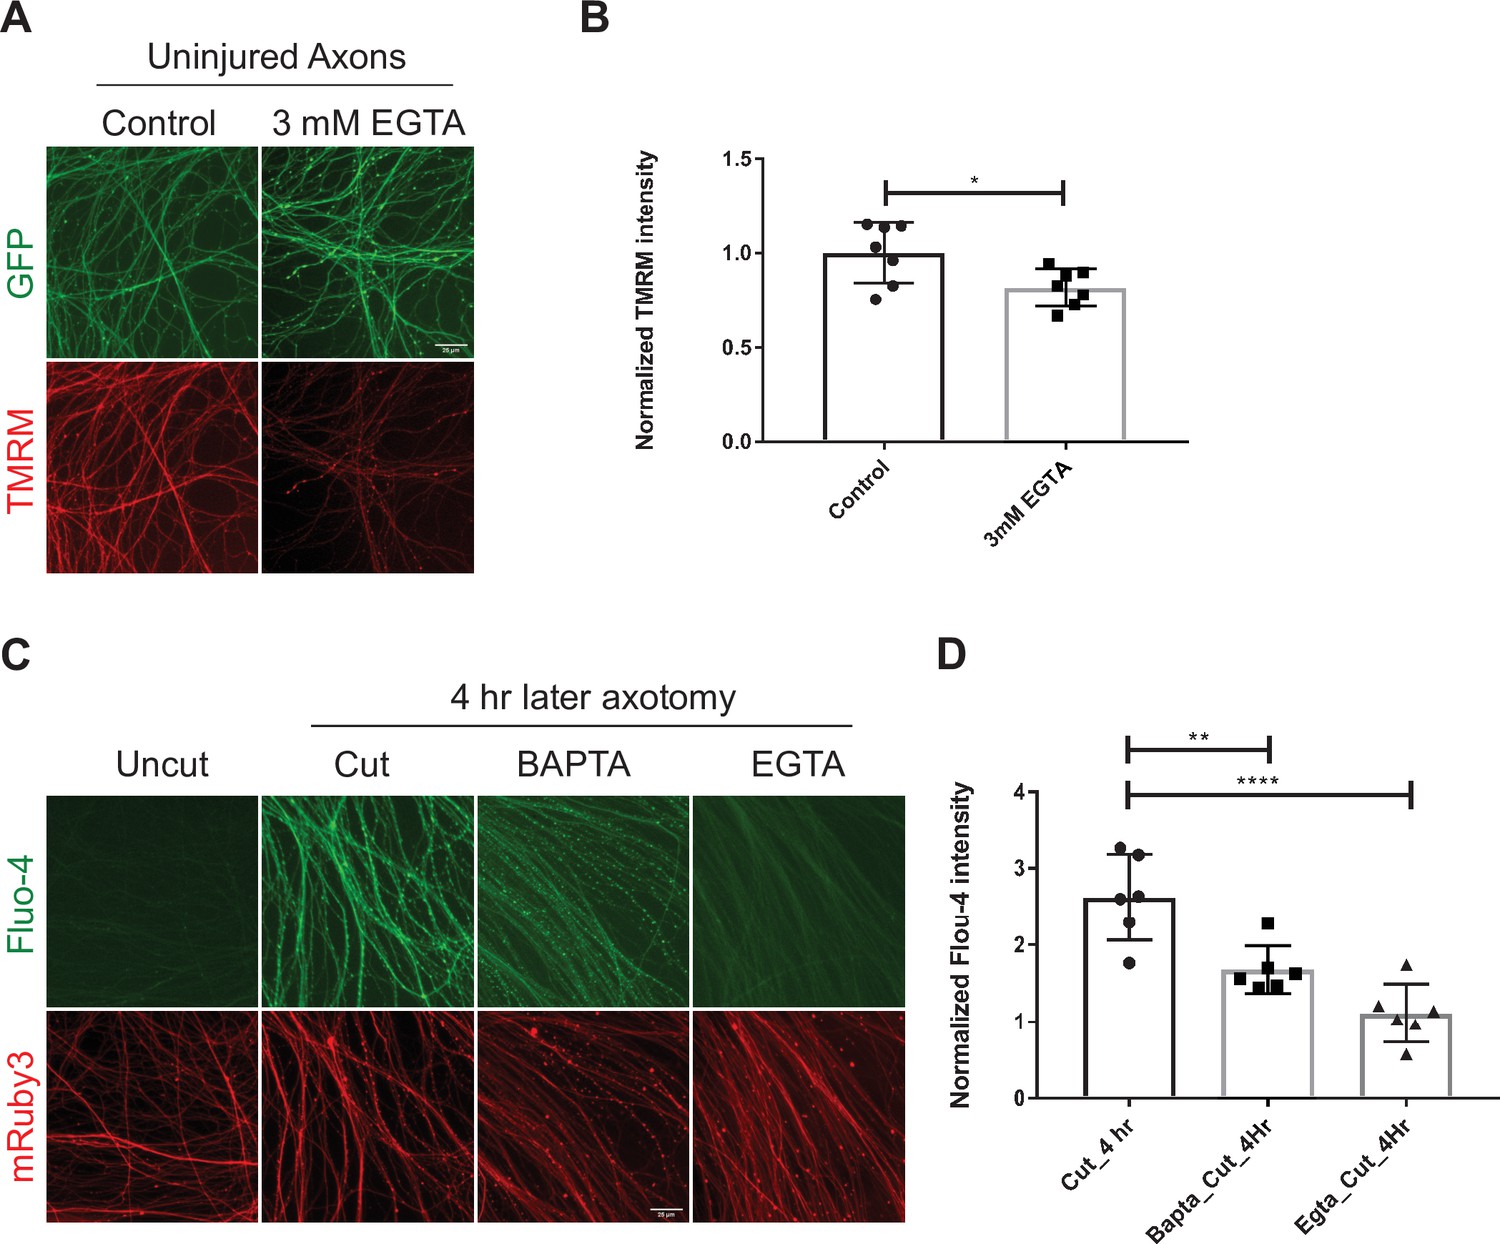
EGTA efficiently blocks calcium influx.
However, it is toxic to mitochondria.
Figure 3 with 1 supplement
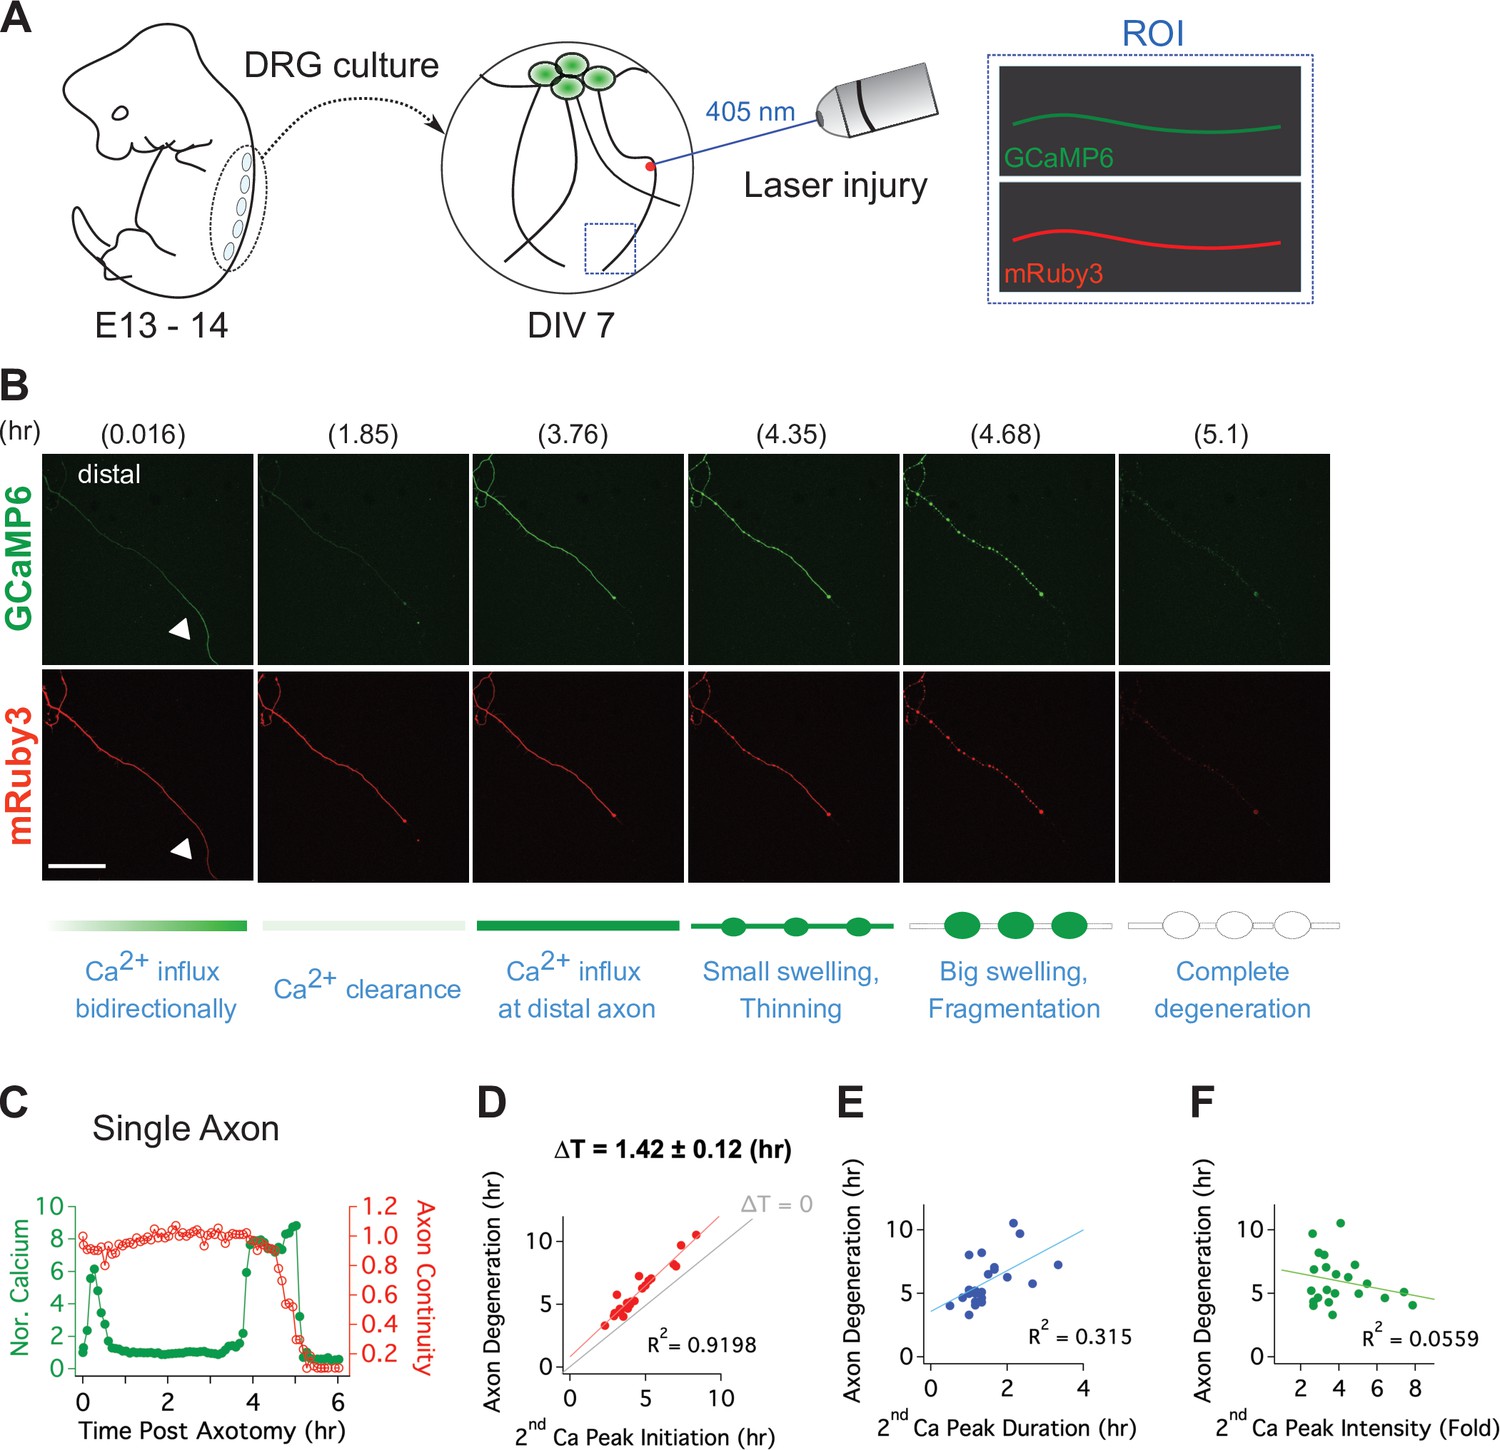
Live single axon imaging enables temporal dissection of cellular events in injured axons.
(A) Schematic diagram of laser axotomy in cultured embryonic DRG neurons. GCaMP6 and mRuby3 were expressed to observe calcium fluctuations and axonal morphology. (B) Snapshots of an injured wild-type axon. Also see Video 1. Progression of axon degeneration is described at the bottom of the schematic. Note that there is both an early and late phase of calcium influx. The first peak of calcium occurs at the injury site (white triangle) before calcium levels return to normal. The second calcium peak persists until the axon degenerates. Scale bar = 100 µm (C) Representative analysis of a single injured axon. The calcium response (left y-axis) and measure of axon continuity (right y-axis) for a single axon is plotted over time after axonal injury. Note the two distinct calcium peaks.
Figure 3—figure supplement 1
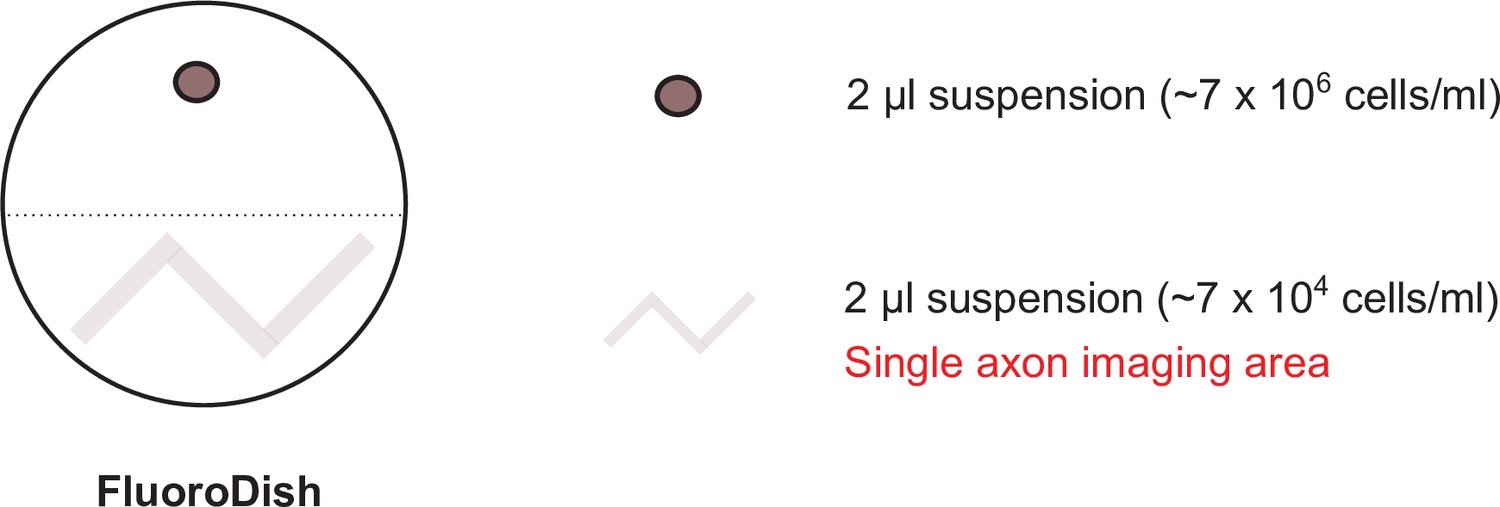
DRG neuron culture for single axon imaging.
Figure 4 with 1 supplement
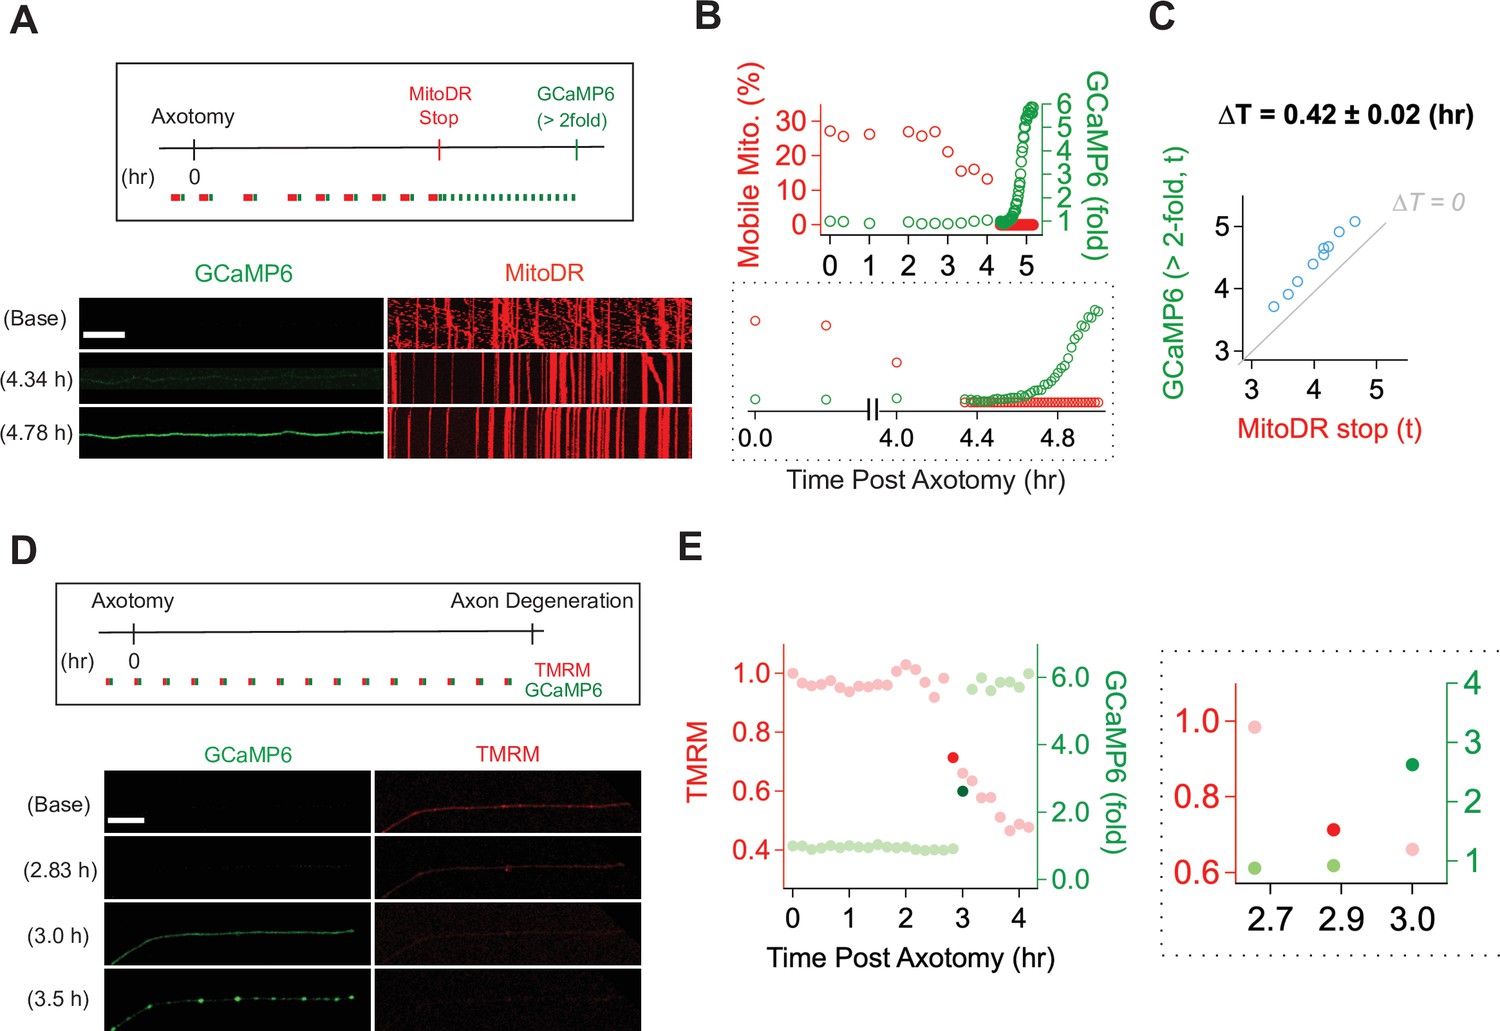
Mitochondrial dysfunction precedes calcium influx in injured axons.
(A) (Top) Experimental design for observing calcium influx (GCaMP6) and mitochondria movement (MitoDR) after axon injury. MitoDR images were acquired every 5 s (for 300 s, 60 frames) followed by GCaMP6 imaging. Once the mitochondria in that axon stopped, GCaMP6 images were then acquired once/minute. (Bottom) Representative images of GCaMP6 and kymograph at the indicated times. Note that mitochondria stop prior to calcium influx. Scale bar = 30 µm (B) (Top) Single axon analysis after injury. The percentage of mobile mitochondria (red, left y-axis) and the fold change in calcium (green, right y-axis) for a single axon were plotted over time after axonal injury. (Bottom) Inset from graph highlights that mitochondria stop moving before calcium levels rise. (C) Group data from single axons show that the time difference (∆T) between cessation of mitochondrial mobility and calcium influx, defined as a twofold increase from baseline, is ~0.42 ± 0.02 hr, indicating that mitochondria stop before calcium influx in injured axons. The gray line (∆T = 0) shows expected results if mitochondria stopped and calcium influx occurred simultaneously. n = 9 axons. (D) (Top) Experimental design to observe calcium influx (GCaMP6) and loss of mitochondrial potential (TMRM) after axonal injury. GCaMP6 and TMRM were imaged every 10 min until axon fragmentation. (Bottom) Representative images shown at the indicated times. The TMRM signal declines by 2.83 hr after axonal injury, while calcium influx does not occur until 3.0 hr after injury. Scale bar = 30 µm (E) (Left) Analysis of the single axon in D. The ratio of TMRM signal from baseline (left y-axis) and the fold increment of calcium (right y-axis) were plotted over time after axonal injury. (Right) The enlarged insight highlights the point at which there is a dramatic change in the mitochondria potential (brighter red dot) and calcium levels brighter green dot. Note that the change in TMRM from baseline precedes the change in calcium. This was observed in 5 out of 7 axons, while in 2 out of 7 axons the change occurred in the same 10 min imaging bout.
Figure 4—figure supplement 1

Assessing mitochondrial potential and calcium influx in injured axons.
(Left) Differentiation of TMRM and GCaMP6 measurements in Figure 4E. The differentiation is defined as the percentage change from the previous measurement. The percentage change (y-axis) of both mitochondrial potential and calcium influx is shown over time after axon injury. (Right) This graph highlights the time window when the calcium level (brighter green dot) increases at least twofold and the mitochondria potential (brighter red dot) are maximally changed.
Figure 5 with 2 supplements
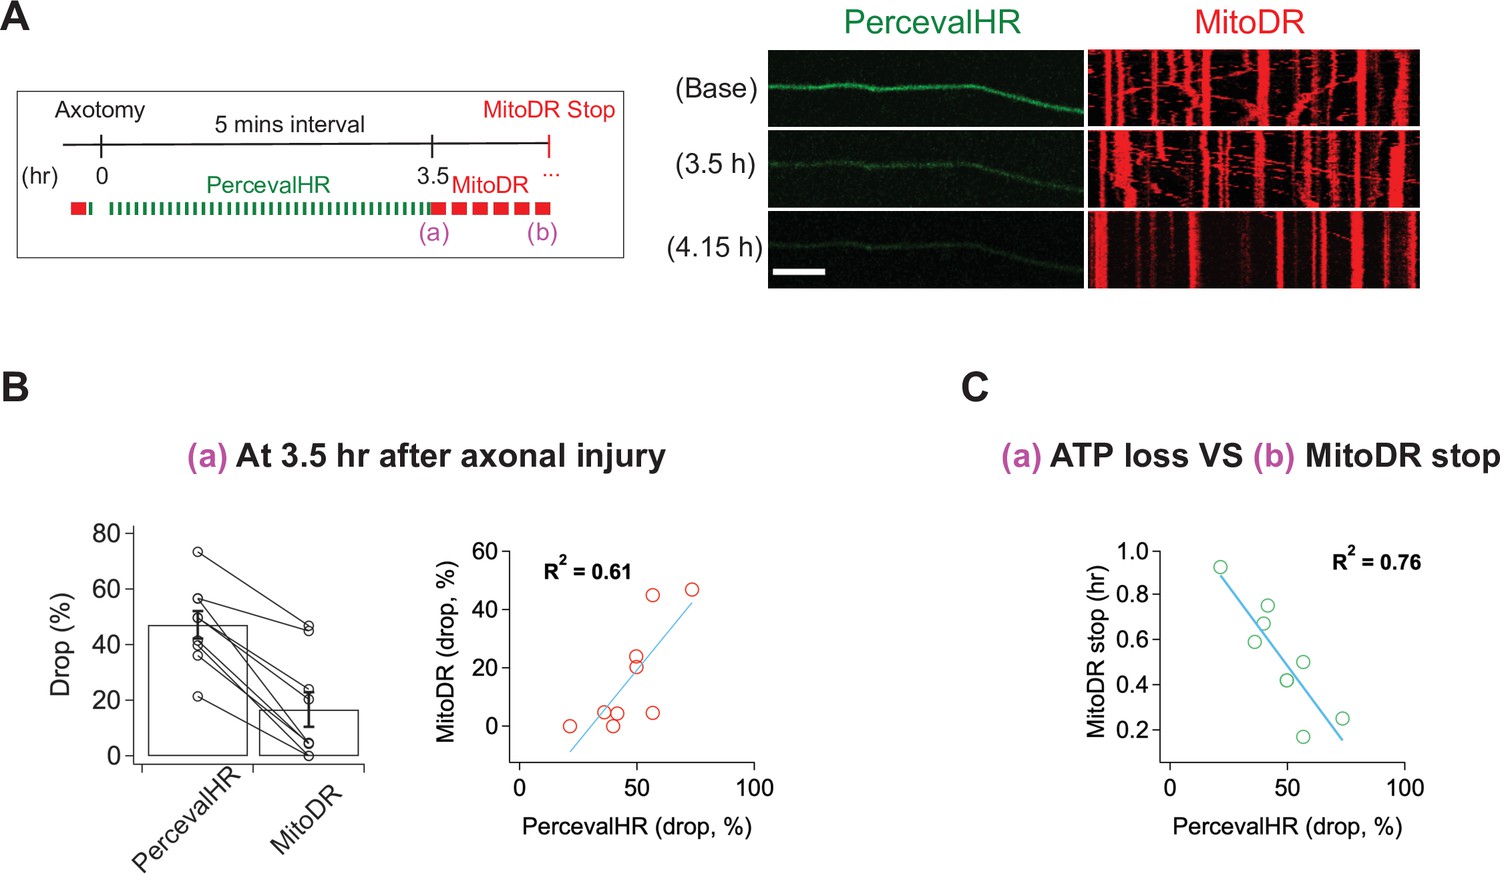
ATP levels drop before mitochondria stop in injured axons.
(A) (Left) Experimental design for imaging changes to ATP (PercevalHR) and mitochondrial movement (MitoDR) after axonal injury. Prior to axotomy, baseline PercevalHR intensity and mitochondrial movement were measured. PercevalHR was imaged every 5 min until 3.5 hr after axonal injury, while mitochondria were imaged every 5 min starting 3.5 hr after axotomy until movement ceased. (Right) Representative images for PercevallHR and kymographs of moving mitochondria at the indicated times. Scale bar = 30 µm (B) (Left) Percentage decline from baseline at 3.5 hr post-axotomy for PercevalHR intensity and for the fraction of motile mitochondria. Lines connect data for individual cells. (Right) Linear regression plot of group data. n = 9 axons. (C) The percentage decline of PercevalHR intensity at 3.5 hr after axonal injury is plotted against the subsequent time until mitochondria stop moving for that axon. Linear regression plot of group data. n = 9 axons.
Figure 5—figure supplement 1

Validation of PercevalHR.
(Left) Representative images of either DMSO or 50 µm CCCP treated DIV7 axons at baseline and 2 hr after treatment. Lentivirus of PercevalHR was transduced at DIV2 (Right). Fluorescent signal of PercevalHR was normalized to baseline for each condition. n = 4 embryos.
Figure 5—figure supplement 2

Axonal ATP level in WT and SARM1 KO after axotomy.
Figure 6
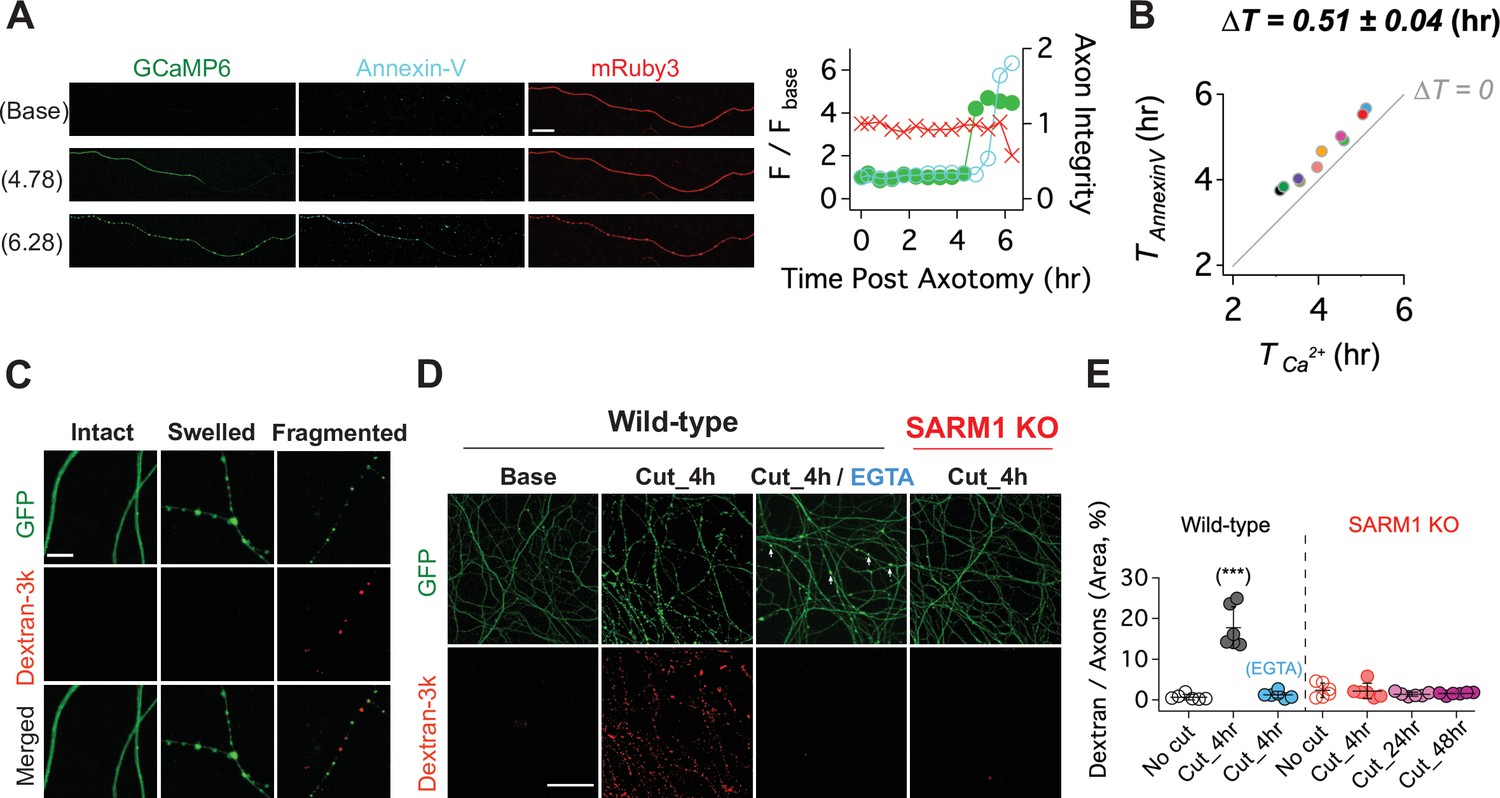
Calcium influx disrupts membrane integrity.
(A) (Left) Snapshots of representative live axon images for GCaMP6, mRuby3, and Alex647-conjugated Annexin-V at baseline, and 4.78 and 6.28 hr after axotomy. (Right) Representative single axon analysis. Y-axis (left) is plotted by the fold increase of fluorescent intensity (F / F base) of either GCaMP6 (green color dots) or Annexin-V (cyan color dots) from the baseline after axon injury. Axon integrity (y-axis, right) is calculated by the relative mRuby3 intensity from the baseline. Note that calcium influx precedes Annexin-V exposure in an injured axon. Scale bar = 50 µm (B) After axotomy, the time until calcium influx is plotted vs the time until the rise in Annexin-V. Dashed line (∆T = 0) represents the values if phosphatidylserine exposure (Annexin-V staining) and calcium influx occurred simultaneously. Calcium influx precedes phosphatidylserine exposure by an average of 0.51 ± 0.04 hr. n = 10 axons. (C) (Top) Representative images of intact, swollen, and fragmented axons during the process of axon degeneration. The axonal morphology is labeled with GFP that was transduced through GFP-lentivirus. Texas Red conjugated Dextran-3kDa was pre-incubated 30 min prior to image acquisition. Note that Dextran-3kDa is only observed in the fragmented axons, not in swollen axons. Scale bar = 10 µm (D) Representative images of GFP-expressing axotomized wild-type and SARM1 KO axons. The membrane impermeable Dextran-3k enters injured wild-type axons, but after injury is excluded from both EGTA-treated wild-type axons and SARM1 KO axons (GFP labels axons). Scale bar = 100 µm (E) Group data. Quantification of dextran-3k staining intensity in the indicated genotypes and times. Data represent the mean ± SEM; n = 6 embryos for each condition; one-way ANOVA with post hoc Tukey test, F(6,35) = 46.16, p < 0.0001; NS, not significant; *, p < 0.05; **, p < 0.01 and ***, p < 0.001.
Figure 7 with 1 supplement
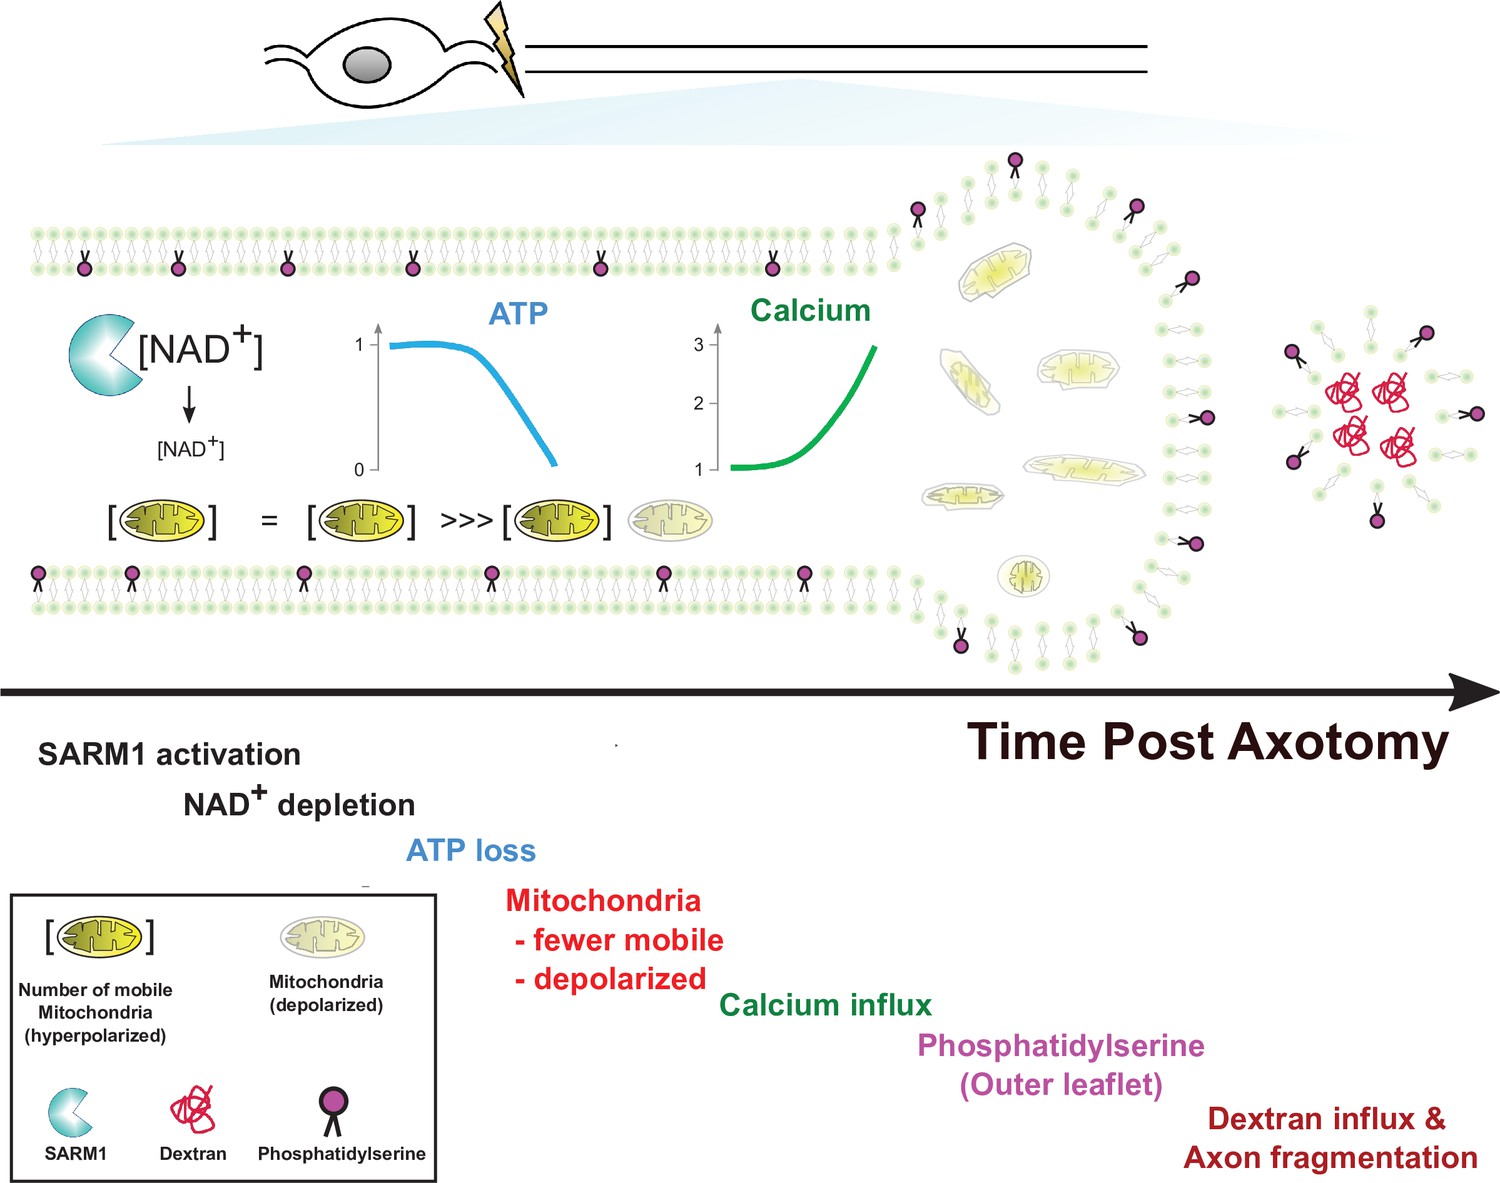
Model of axon degeneration.
Figure 7—figure supplement 1

Mitochondria accumulate in axonal swellings in injured axons.
(Top) Representative images of injured (a) and uninjured (b) axons labeled with GFP and MitoDR. (Bottom) Pixel intensity of each axon is plotted. Note that most axonal swellings overlap with mitochondria (Asterisks).
Videos
Video 1
Time lapse imaging of injured single axon.
Additional files
-
Transparent reporting form
- https://cdn.elifesciences.org/articles/71148/elife-71148-transrepform1-v2.docx
-
Source data 1
Data for figures.
- https://cdn.elifesciences.org/articles/71148/elife-71148-supp1-v2.zip
Download links
A two-part list of links to download the article, or parts of the article, in various formats.
Downloads (link to download the article as PDF)
Open citations (links to open the citations from this article in various online reference manager services)
Cite this article (links to download the citations from this article in formats compatible with various reference manager tools)
Live imaging reveals the cellular events downstream of SARM1 activation
eLife 10:e71148.
https://doi.org/10.7554/eLife.71148


