Clathrin-independent endocytic retrieval of SV proteins mediated by the clathrin adaptor AP-2 at mammalian central synapses
- Leibniz-Forschungsinstitut für Molekulare Pharmakologie (FMP), Germany
- Laboratory of Neural Membrane Biology, Graduate School of Brain Science, Doshisha University, Japan
- Department of Laboratory Medicine, The Jikei University School of Medicine, Japan
Figures
Figure 1
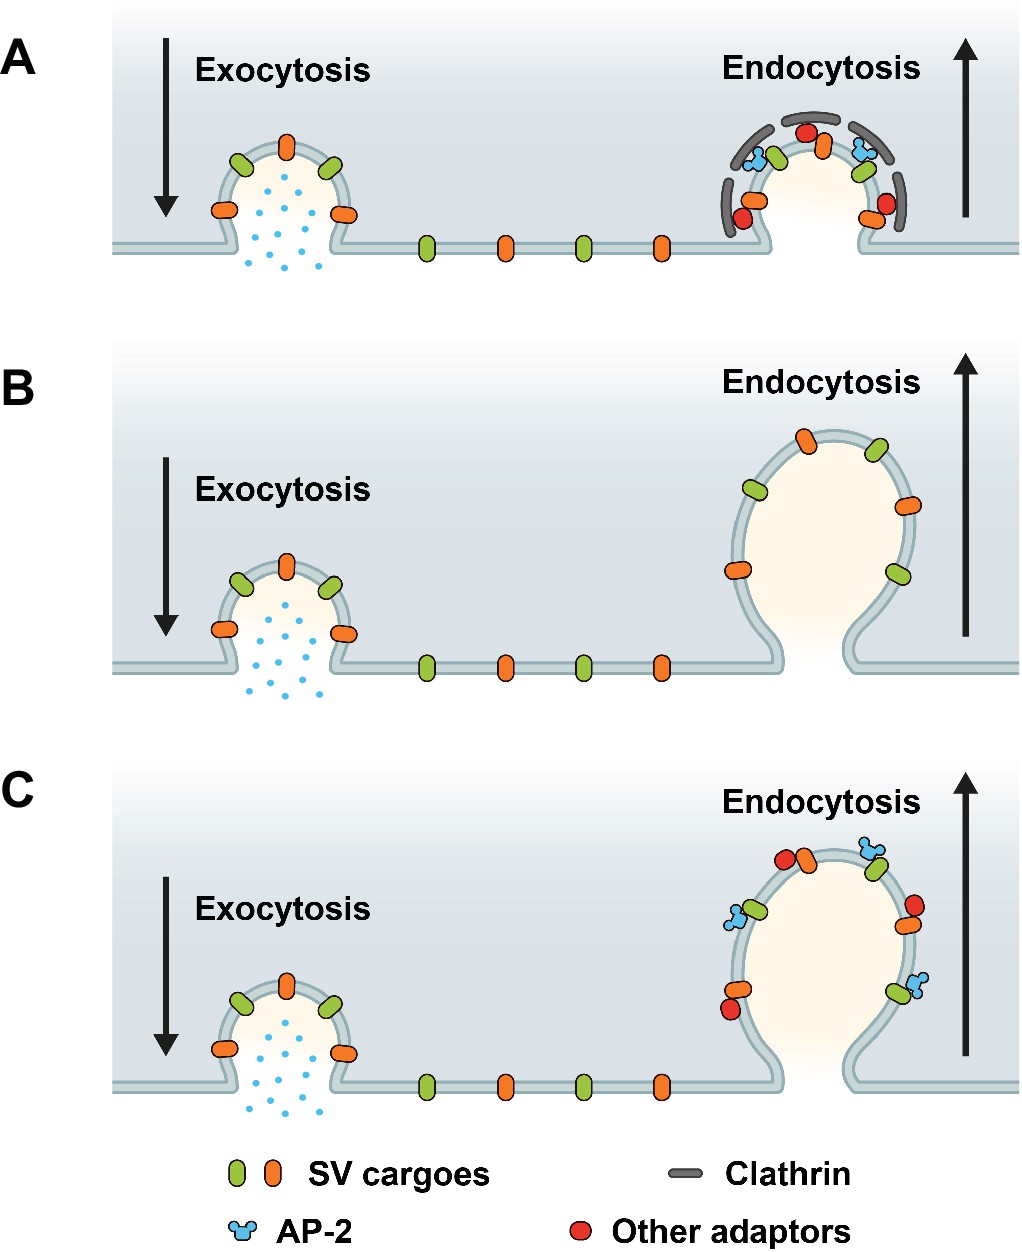
Possible roles of clathrin and adaptor protein complex 2 (AP-2) in synaptic vesicle (SV) endocytosis and SV cargo retrieval.
(A) A model predicting that SV retrieval following neurotransmitter release is mediated by clathrin-mediated endocytosis (CME) where AP-2 functions as bridge between SV cargos and clathrin to form clathrin-coated pits (CCPs) at plasma membrane. In this scenario, inactivation of both clathrin and AP-2 would slow either SV endocytosis as well as SV cargo retrieval. (B) A model predicting that SV endocytosis occurs in a clathrin-independent manner (CIE), and neither clathrin nor AP-2 mediate SV endocytosis and SV cargo retrieval at plasma membrane. If this were the case, inactivation of both clathrin and AP-2 would not change the kinetics rate of SV endocytosis and SV cargo retrieval. (C) A model predicting that dedicated adaptors such as AP-2 function as sorting protein for SV cargo even during CIE. If this were the case, inactivation of clathrin and AP-2 would produce distinct phenotypes between SV endocytosis and SV cargo retrieval.
Figure 2 with 1 supplement
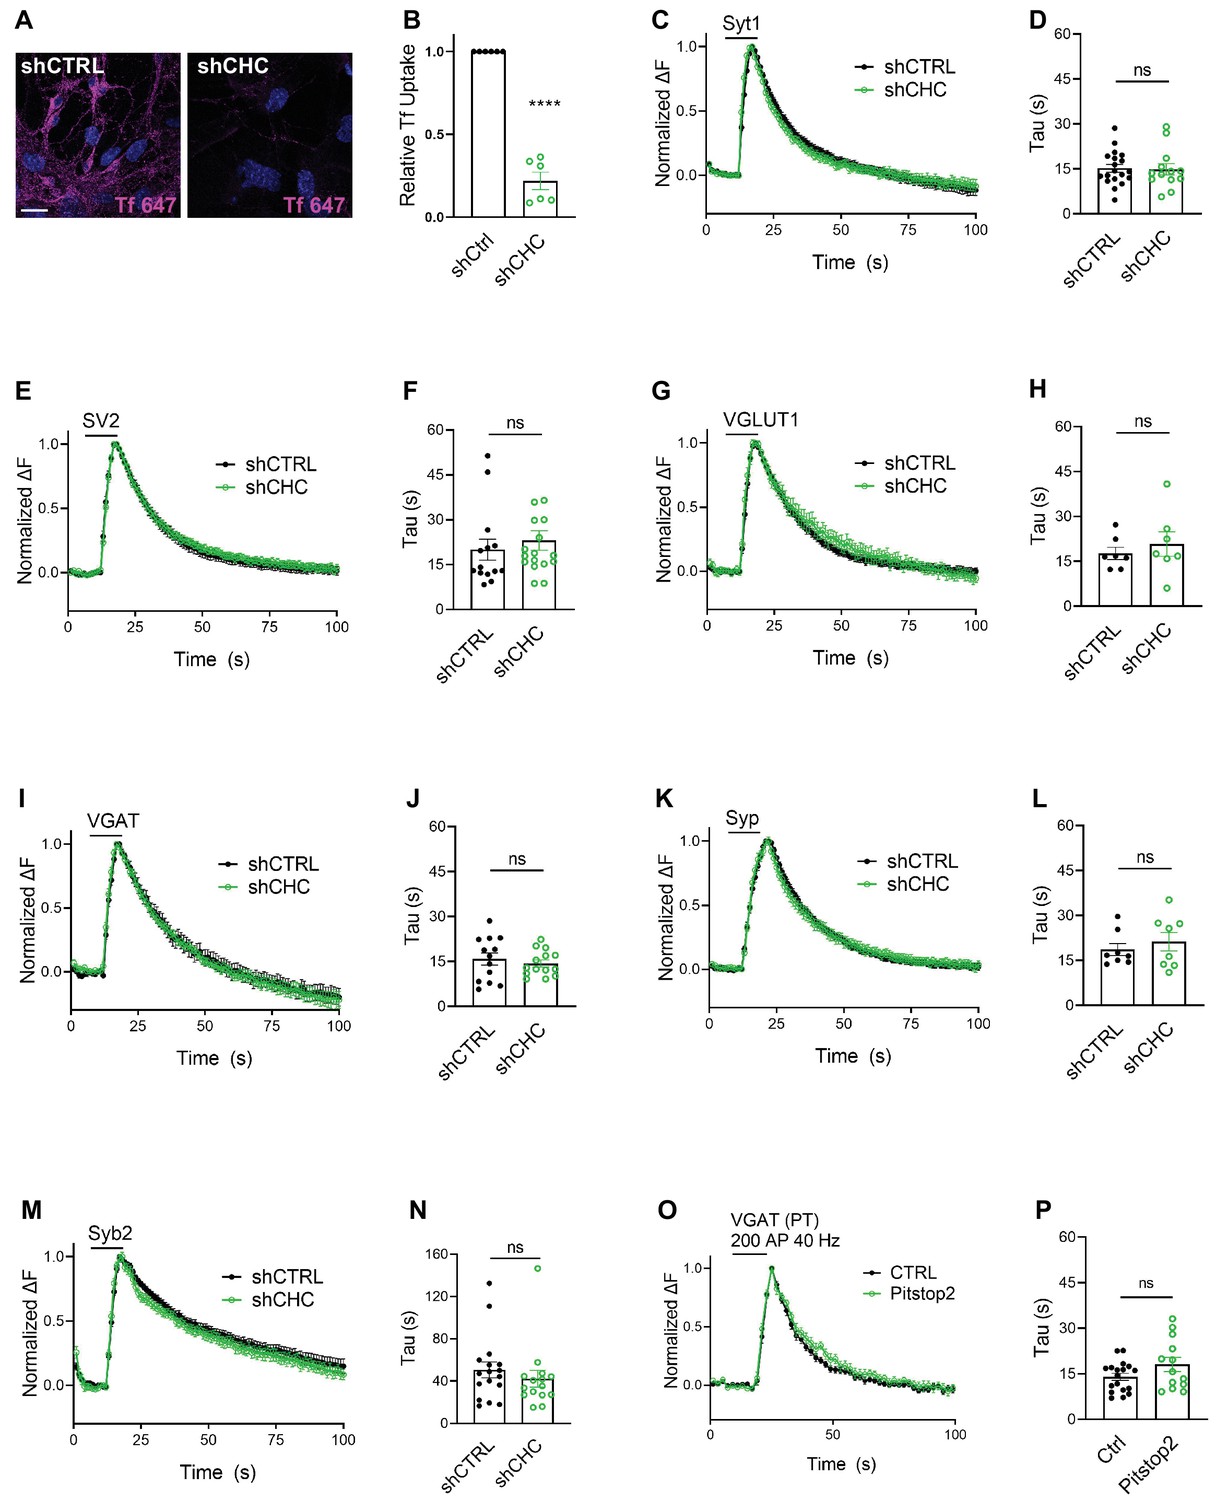
Synaptic vesicle (SV) endocytosis in hippocampal neurons occurs independent of clathrin at physiological temperature.
(A) Representative images of primary neurons transduced with shCTRL or shCHC and allowed to internalize AlexaFluor647-labeled transferrin (Tf647) for 20 min at 37°C. The scale bar represents 20 μm. (B) Quantification of data shown in (A). Values for shCTRL were set to 1. The data represent mean ± standard error of the mean (SEM) from n = 6 independent experiments. ****p = 0.0001, two-sided one-sample t-test. (C–N) Average normalized SEP fluorescence traces of neurons transduced with lentivirus expressing nonspecific shRNA (shCTRL) or shRNA-targeting CHC (shCHC) and cotransfected with SEP probes tagged to the luminal portion of Syt1 (C), SV2A (E), VGLUT1 (G), VGAT (I), Syp (K), and Syb2 (M) subjected to electrical stimulation of 40 Hz (200 APs) at physiological temperature. Endocytic decay time constant (τ) of transfected and lentivirally transduced neurons coexpressing, respectively, (D) Syt1-SEP and shCTRL (15.22 ± 1.30 s) or shCHC (14.87 ± 1.87 s); (F) SV2A-SEP and shCTRL (20.00 ± 3.53 s) or shCHC (23.06 ± 3.31 s); (H) VGLUT1-SEP and shCTRL (17.67 ± 2.05 s) or shCHC (20.79 ± 4.07 s); (J) VGAT-SEP and shCTRL (15.82 ± 2.04 s) or shCHC (14.38 ± 1.14 s); (L) Syp-SEP and shCTRL (18.65 ± 2.03 s) or shCHC (21.27 ± 3.10 s); and (N) Syb2-SEP and shCTRL (50.63 ± 7.49 s) or shCHC (42.32 ± 8.03 s). Data shown represent the mean ± SEM for Syt1 (nCTRL = 19 images, nshCHC = 13 images; p = 0.875), for SV2A (nshCTRL = 14 images, nshCHC = 17 images; p = 0.533), for VGLUT1 (nshCTRL = 7 images, nshCHC = 7 images; p = 0.506), for VGAT (nshCTRL = 13 images, nshCHC = 14 images; p = 0.534), for Syp (nshCTRL = 8 images, nshCHC = 8 images; p = 0.490), and for Syb2 (nshCTRL = 17 images, nshCHC = 15 images; p = 0.455). Two-sided unpaired t-test. (O, P) Endocytosis of VGAT upon acute inactivation of clathrin by Pitstop2 proceeds unaffected at physiological temperature. (O) Average normalized traces of neurons transfected with VGAT-SEP and treated either with DMSO (CTRL) or Pitstop2 in response to 200 APs applied at 40 Hz. (P) Endocytic decay time constant (τ) of neurons expressing VGAT-SEP (τCTRL = 14.03 ± 1.16 s, τPitstop2 = 18.11 ± 2.32 s). Data shown represent the mean ± SEM with n = 18 images and n = 13 images for CTRL and Pitstop2, respectively. p = 0.0976. Two-sided unpaired t-test. Raw data can be found in Figure 2—source data 1.
-
Figure 2—source data 1
Source data for Figure 2B-P.
- https://cdn.elifesciences.org/articles/71198/elife-71198-fig2-data1-v1.xlsx
Figure 2—figure supplement 1

Temperature-sensitive, clathrin-independent synaptic vesicle (SV) endocytosis at hippocampal synapses.
(A–D) shRNA-targeting clathrin heavy chain (CHC) efficiently depletes CHC in hippocampal neurons. (A) Representative images of neurons transduced with lentivirus expressing either nonspecific shRNA (shCTRL) or shRNA-targeting CHC (shCHC) immunostained for CHC (magenta) and the presynaptic marker Synaptophysin (Syp) (green). The scale bar represents 10 μm. (B) Quantification of CHC fluorescence intensity relative to Syp fluorescence. Values for shCTRL were set to 1. Data represent mean ± standard error of the mean (SEM) of n = 4 images for shCTRL and n = 4 images for shCHC. Two-sided unpaired t-test, ****p < 0.0001. (C) Representative immunoblot of lysates from neurons transduced with lentivirus expressing nonspecific control shRNA (shCTRL) or shRNA-targeting clathrin heavy chain (shCHC). Samples were probed with antibodies against CHC and β-actin as a loading control. (D) Quantification of clathrin (CHC) levels. Protein expression was normalized to that of β-actin. Values for shCTRL were set to 1. Data represent mean ± SEM of n = 4 independent experiments. ***p = 0.0007. Two-sided one-sample t-test. (E, F) Clathrin inactivation inhibits clathrin-mediated endocytosis (CME) of transferrin. (E) Representative images of primary neurons treated either with DMSO (CTRL) or the clathrin inhibitor Pitstop2 and allowed to internalize Tf647 for 20 min at 37°C. Scale bar, 20 μm. (F) Quantification of data shown in (E). Values for CTRL were set to 1. The data represent mean ± SEM from n = 4 independent experiments. ***p = 0.004, two-sided one-sample t-test. (G–J) Membrane retrieval induced by low-frequency stimulation at room temperature (RT) is sensitive to clathrin loss. Average normalized traces of neurons transduced with lentivirus expressing shCTRL or shCHC and cotransfected with either Syp-SEP (G) or VGLUT1-SEP (I) upon stimulation of 200 APs at 5 Hz at RT, a condition known to favor CME. Quantification of endocytic decay time constant (τ) in neurons coexpressing Syp-SEP (H) and shCTRL (18.50 ± 3.34 s) or shCHC (40.69 ± 4.61 s); and VGLUT1-SEP (J) and shCTRL (25.06 ± 4.18 s) or shCHC (48.45 ± 2.31 s). Data represent the mean ± SEM for Syp-SEP (nshCTRL = 4 images, nshCHC = 4 images; **p = 0.009) and for VGLUT1-SEP (nshCTRL = 5 images, nshCHC = 4 images; **p = 0.003). Two-sided unpaired t-test. Raw data can be found in Figure 2—figure supplement 1—source data 1 and Figure 2—figure supplement 1—source data 2.
-
Figure 2—figure supplement 1—source data 1
Source data for Figure 2—figure supplement 1B, D, F, G, H, I, J.
- https://cdn.elifesciences.org/articles/71198/elife-71198-fig2-figsupp1-data1-v1.xlsx
-
Figure 2—figure supplement 1—source data 2
Raw uncropped immunoblot image for Figure 2—figure supplement 1C.
- https://cdn.elifesciences.org/articles/71198/elife-71198-fig2-figsupp1-data2-v1.pdf
Figure 3 with 1 supplement
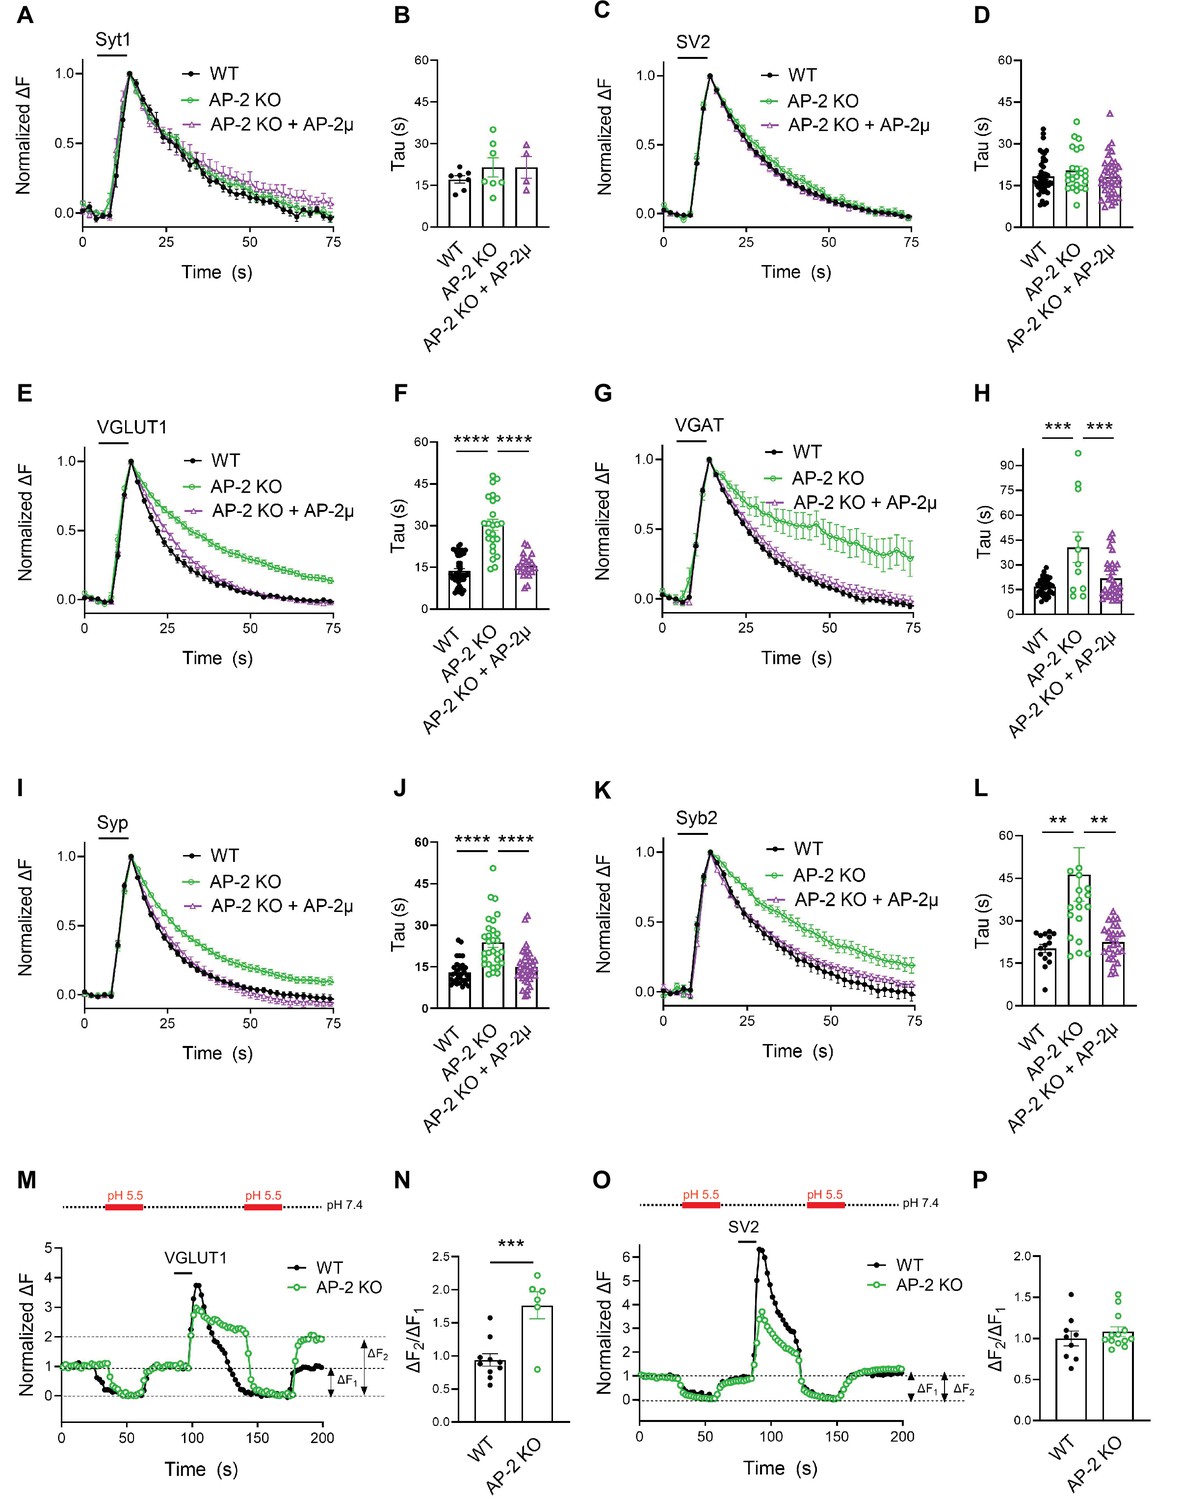
Clathrin-independent endocytic retrieval of select synaptic vesicle (SV) cargos by the clathrin adaptor adaptor protein complex 2 (AP-2) at physiological temperature.
(A–D) Poststimulus retrieval of Syt1 and SV2A in the absence of AP-2 persists unaffected in response to 200 APs applied at 40 Hz. Average normalized traces of WT and AP-2μ KO derived neurons cotransfected with Syt1-SEP (A) or SV2A-SEP (C) and mRFP or rescued by reexpression of untagged AP-2µ subunit together with soluble mRFP (AP-2μ) to identify transfected neurons in response to 200 APs applied at 40 Hz. Quantification of the endocytic decay time constant (τ) of neurons expressing Syt1-SEP (B) (τWT = 17.17 ± 1.35 s, τAP-2μ KO = 21.53 ± 3.43 s, τAP-2μ KO+AP-2μ = 21.51 ± 3.91 s) or SV2A-SEP (D) (τWT = 18.33 ± 0.99 s, τAP-2μ KO = 20.45 ± 1.56 s, τAP-2μ KO+AP-2μ = 18.04 ± 1.16 s). Data shown represent the mean ± standard error of the mean (SEM): Syt1 (nWT = 7 images, nAP-2μ KO = 7 images, nAP-2μ KO+AP-2μ = 4 images; p(WT vs AP-2μ KO) = 0.4994; p(AP-2μ KO vs AP-2μ KO+AP2-μ) > 0.9999); SV2A (nWT = 44 images, nAP-2μ KO = 23 images, nAP-2μ KO+AP-2μ = 37 images; p(WT vs AP-2μ KO) = 0.4665; p(AP-2μ KO vs AP-2μ KO+AP-2μ) = 0.3943). One-way analysis of variance (ANOVA) with Tukey’s post-test. (E–L) Loss of AP-2 significantly delay the endocytic retrieval of other major SV proteins. Average normalized traces of WT and AP-2μ KO neurons cotransfected with VGLUT1-SEP (E), VGAT-SEP (G), Syp-SEP (I), Syb2-SEP (K), and mRFP or AP-2μ to rescue AP-2μ expression stimulated with 200 APs at 40 Hz. Endocytic decay time constants (τ) were calculated from WT, AP-2μ KO neurons, and AP-2µ KO neurons rescued by reexpression of AP-2µ expressing VGLUT1-SEP (F) (τWT = 13.52 ± 0.90 s, τAP-2μ KO = 30.33 ± 2.01 s, τAP-2μ KO+AP-2μ = 16.38 ± 1.00 s), VGAT-SEP (H) (τWT = 16.76 ± 0.87 s, τAP-2μ KO = 40.56 ± 9.21 s, τAP-2μ KO+AP-2μ = 21.77 ± 2.15 s), Syp-SEP (J) (τWT = 13.05 ± 0.74 s, τAP-2μ KO = 23.76 ± 1.72 s, τAP-2μ KO+AP-2μ = 14.89 ± 1.04 s), VGAT-SEP (D) (τWT = 18.33 ± 0.99 s, τAP-2μ KO = 20.45 ± 1.56 s, τAP-2μ KO+AP-2μ = 18.04 ± 1.16 s), and Syb2-SEP (L) (τWT = 20.27 ± 1.48 s, τAP-2μ KO = 46.34 ± 9.43 s, τAP-2μ KO+AP-2μ = 22.46 ± 1.21 s). Data shown represent the mean ± SEM: VGLUT1 (nWT = 37 images, nAP-2μ KO = 24 images, nAP-2μ KO+AP-2μ = 23 images; ****p(WT vs AP-2μ KO) < 0.0001; ****p(AP-2μ KO vs AP-2μ KO+AP-2μ) < 0.0001); VGAT (nWT = 34 images, nAP-2μ KO = 11 images, nAP-2μ KO+AP-2μ = 32 images; ****p(WT vs AP-2μ KO) < 0.0001; ***p(AP-2μ KO vs AP-2μ KO+AP-2μ) = 0.0008); Syp (nWT = 33 images, nAP-2μ KO = 29 images, nAP-2μ KO+AP-2μ = 37 images; ****p(WT vs AP-2μ KO) < 0.0001; ****p(AP-2μ KO vs AP-2μ KO+AP-2μ) < 0.0001); Syb2 (nWT = 15 images, nAP-2μ KO = 20 images, nAP-2μ KO+AP-2μ = 26 images; **p(WT vs AP-2μ KO) = 0.0083; **p(AP-2μ KO vs AP-2μ KO+AP-2μ) = 0.0052). One-way ANOVA with Tukey’s post-test. (M–P) Delayed poststimulus retrieval of major SV proteins in the absence of AP-2 is not caused by defects in re-acidification of endocytosed vesicles. Representative normalized traces of WT and AP-2μ KO neurons expressing VGLUT1-SEP (M) or SV2A-SEP (O) stimulated with 200 APs applied at 40 Hz and subjected to low pH imaging buffer before and after train stimulation. Fluorescence quenching by application of acidic buffer poststimulus (ΔF2) vs prestimulus (ΔF1) of VGLUT1-SEP (N) (nWT = 10 images, nAP-2µ KO = 6 images) or SV2A-SEP (P) (nWT = 8 images, nAP-2µ KO = 13 images) is taken as a measure to probe the SEP surface pool in WT and AP-2μ KO hippocampal neurons. Values for WT were set to 1. Data shown represent the mean ± SEM. VGLUT1: WT = 1.0 ± 0.1; AP-2µ KO = 1.8 ± 0.2. p = 0.0009. SV2: WT = 1.0 ± 0.1; AP-2µ KO = 1.1 ± 0.1. p = 0.4267. Two-sided unpaired t-test. Raw data can be found in Figure 3—source data 1.
-
Figure 3—source data 1
Source data for Figure 3A-P.
- https://cdn.elifesciences.org/articles/71198/elife-71198-fig3-data1-v1.xlsx
Figure 3—figure supplement 1
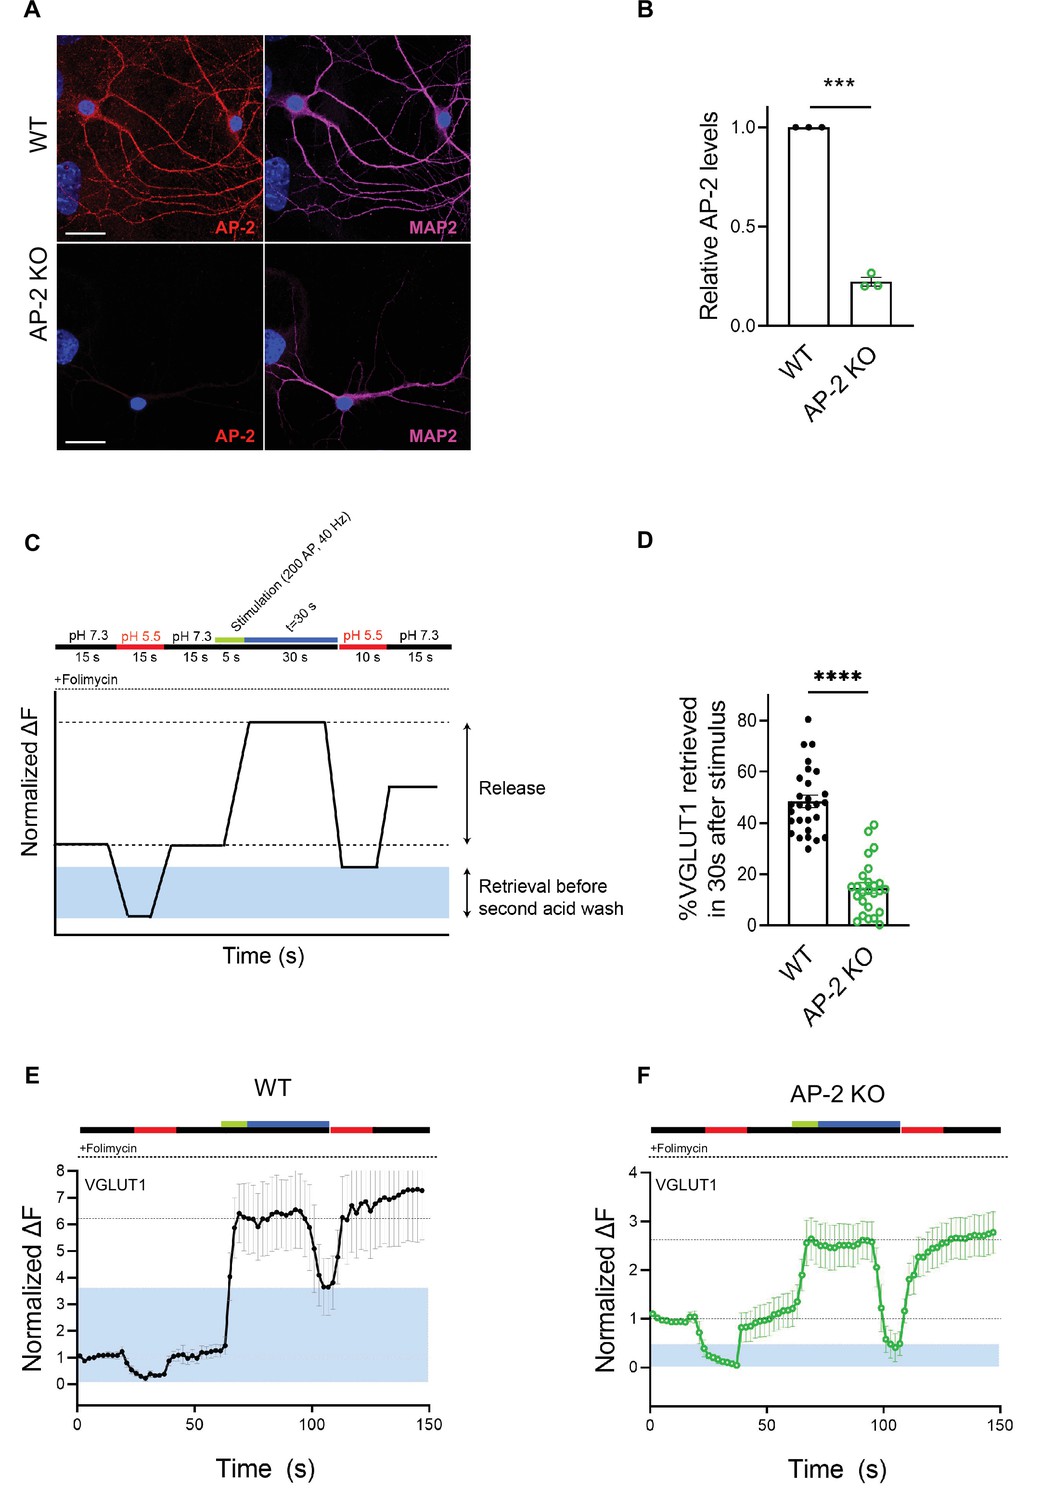
Adaptor protein complex 2 (AP-2) depletion in hippocampal neurons impairs endocytic retrieval of VGLUT1-SEP.
(A) Representative images of WT and AP-2μ KO neurons immunostained for AP-2 (red) and the neuronal marker MAP2 (magenta). The scale bars represent 20 μm. (B) Quantification of AP-2 fluorescence intensity. Values for WT neurons were set to 1. Data represent mean ± standard error of the mean (SEM) of n = 3 independent experiments with n = 9 images for WT and n = 8 images for AP-2μ KO neurons; ***p = 0.0008. p = 0.4267, two-sided unpaired t-test. (C–F) Decreased VGLUT1-SEP retrieval in the absence of AP-2 at physiological temperature. (C) Scheme of acid quench experiment in the presence of folimycin. WT and AP-2μ KO hippocampal neurons expressing VGLUT1-SEP were subjected to a brief pulse of external acidic buffer before and 30 s after a high-frequency stimulus train (200 APs at 40 Hz). The rise in fluorescence following stimulation corresponds to the relative amounts of VGLUT1-SEP exocytosed. The difference between the fluorescent signals during the first and the second acid wash corresponds to the fraction of VGLUT1-SEP retrieved from the surface during the stimulus and the subsequent 30 s chase (shaded in blue). (D) Decreased fraction of VGLUT1-SEP retrieval in AP-2μ KO neurons compared to WT. Data shown represent the mean ± SEM of nWT = 28 images and nAP-2μ KO = 25 images; ****p < 0.0001; two-sided unpaired t-test. Average normalized traces of WT (E) and AP-2μ KO derived neurons (F) transfected with VGLUT1-SEP stimulated with 200 APs applied at 40 Hz at 37°C and subjected to external acidic buffer before and 30 s after the stimulus train. Retrieved fractions are shaded in blue. Raw data can be found in Figure 3—figure supplement 1—source data 1.
-
Figure 3—figure supplement 1—source data 1
Source data for Figure 3—figure supplement 1B, D, E, F.
- https://cdn.elifesciences.org/articles/71198/elife-71198-fig3-figsupp1-data1-v1.xlsx
Figure 4 with 1 supplement
Clathrin-independent endocytic retrieval of synaptic vesicle (SV) proteins mediated by adaptor protein complex 2 (AP-2) is independent of the stimulation strength at physiological temperature.
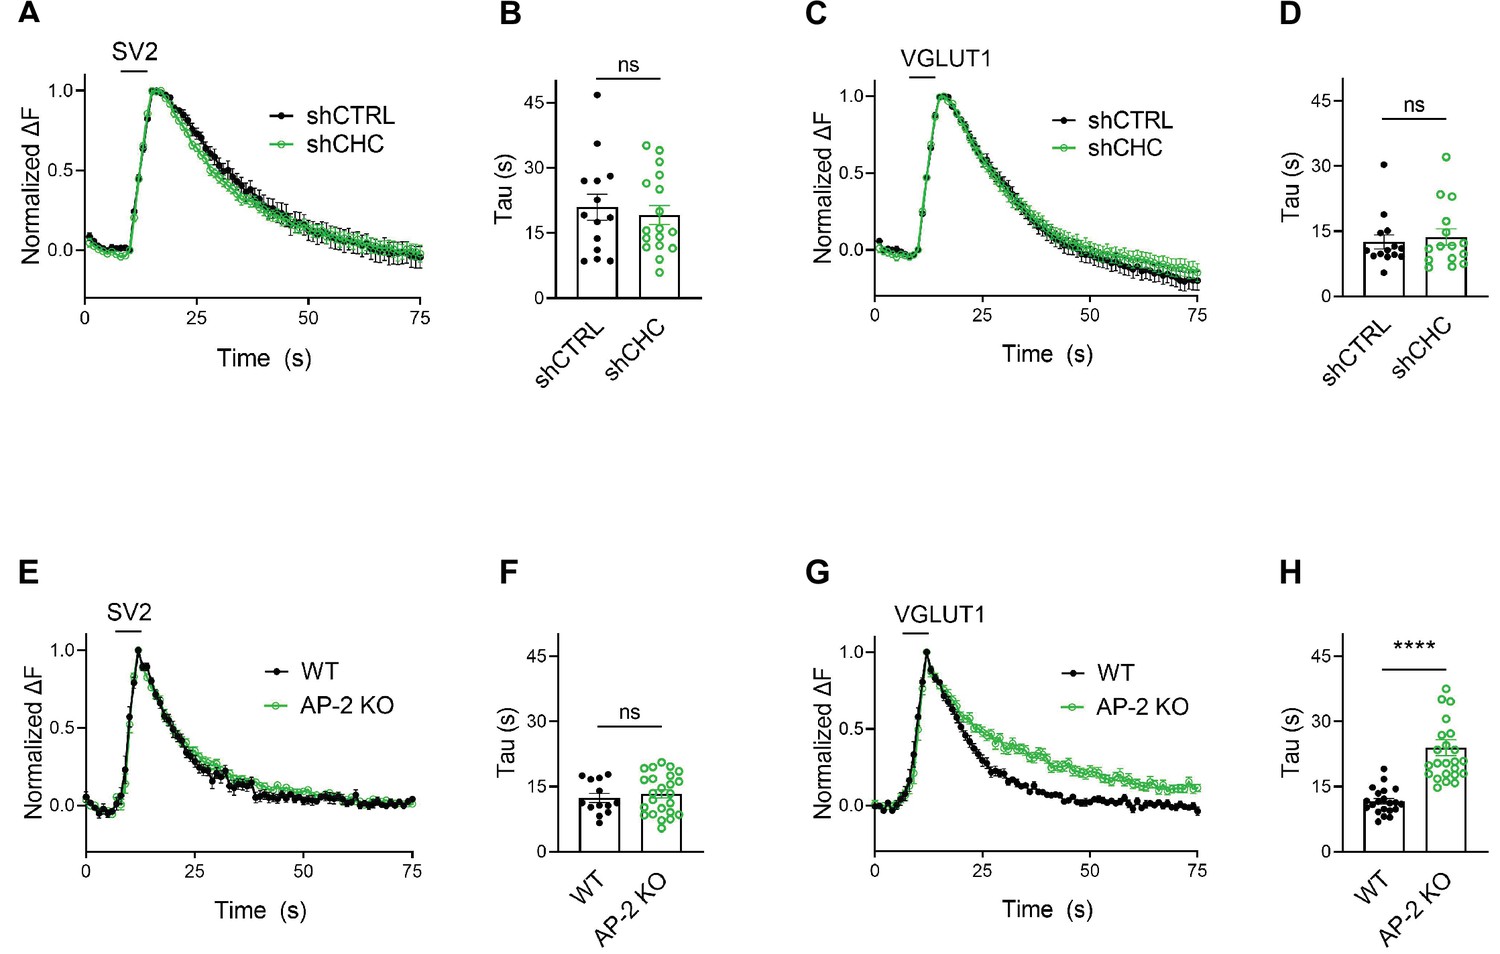
(A–D) Lack of clathrin does not alter the endocytosis of SV2 and VGLUT1 in response to stimulation with 50 APs (i.e., a stimulus that releases the RRP) at physiological temperature. Average normalized traces of neurons transduced with lentivirus expressing nonspecific shRNA (shCTRL) or shRNA-targeting CHC (shCHC) and cotransfected with either SEP-tagged SV2A (A) or VGLUT1 (C) stimulated with 50 APs applied at 20 Hz at physiological temperature. Quantification of the endocytic decay time constant (τ) in neurons coexpressing SV2A-SEP (B) and shCTRL (20.97 ± 2.99 s) or shCHC (19.18 ± 2.22 s); and VGLUT1-SEP (D) and shCTRL (12.51 ± 1.62 s) or shCHC (13.68 ± 1.90 s). Data represent the mean ± standard error of the mean (SEM) for SV2A (nshCTRL = 14 images, nshCHC = 17 images; p = 0.6274) and for VGLUT1 (nshCTRL = 14 images, nshCHC = 15 images; p = 0.6468). Two-sided unpaired t-test. (E–H) Endocytosis delay for VGLUT1 but not for SV2A in neurons depleted of AP-2 when stimulated with a mild train of 50 APs. Average normalized traces of neurons from WT and AP-2μ KO mice transfected with either SV2A-SEP (E) or VGLUT1-SEP (G) in response of 50 APs applied at 20 Hz at physiological temperature. Quantification of the endocytic decay time constant (τ) of SV2A-SEP-expressing neurons (F) (τWT = 12.40 ± 1.05 s, τAP-2μ KO = 13.34 ± 0.95 s) or VGLUT1-SEP (H) (τWT = 11.61 ± 0.65 s, τAP-2μ KO = 23.96 ± 1.87 s). Data represent the mean ± SEM for SV2A (nWT = 13 images, nAP-2μ KO = 24 images; p = 0.5355) and for VGLUT1 (nWT = 21 images, nAP-2μ KO = 24 images; ****p < 0.0001). Two-sided unpaired t-test. Raw data can be found in Figure 4—source data 1.
-
Figure 4—source data 1
Source data for Figure 4A-H.
- https://cdn.elifesciences.org/articles/71198/elife-71198-fig4-data1-v1.xlsx
Figure 4—figure supplement 1
Decreased fraction of active synapses in neurons lacking adaptor protein complex 2 (AP-2).
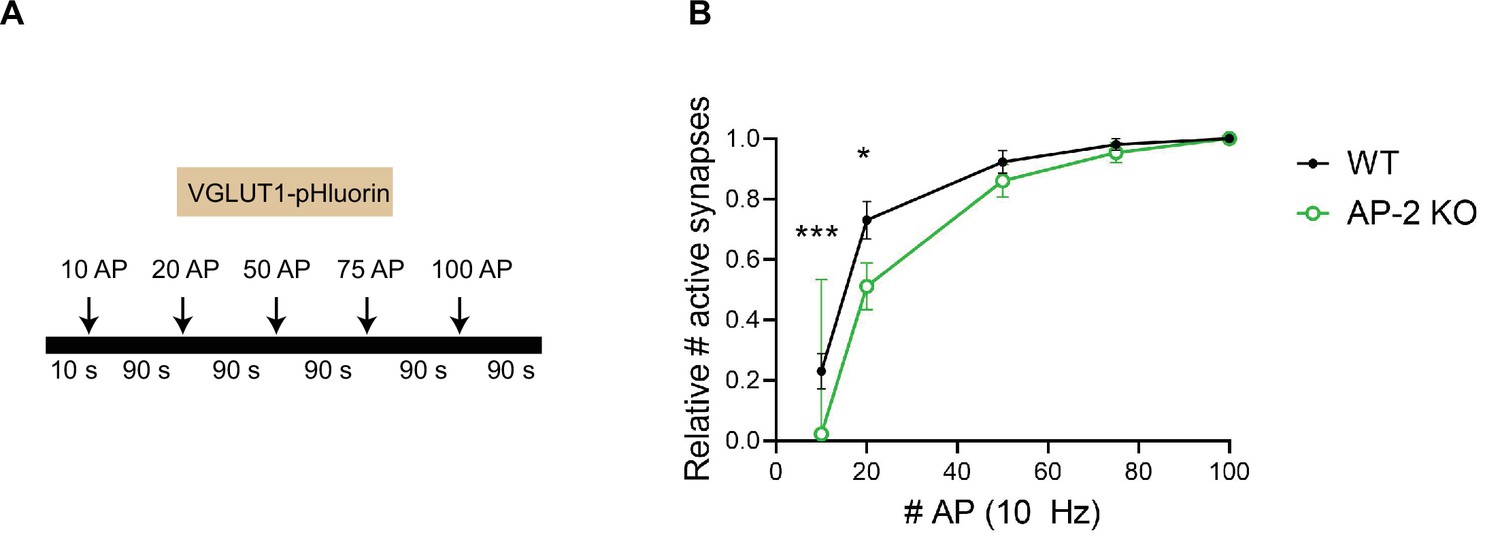
(A, B) Fraction of active synapses in AP-2-depleted neurons is reduced depending on the stimulation strength. (A) Schematic depicting the stimulation protocol of consecutive trains of APs with interstimulus intervals of 90 s by using VGLUT1-SEP. (B) Quantification of number of active synapses (signals >4 × SD of the noise) in WT and AP-2μ KO neurons upon each AP train. Values for 100 APs were set to 1. Data represent mean ± standard error of the mean (SEM) of n = 52 boutons for WT and n = 43 boutons for AP-2μ KO neurons. ***p10AP = 0.0005; *p20AP = 0.0276; p50AP = 0.3275; p75AP = 0.4545. Two-sided unpaired t-test. Raw data can be found in Figure 4—figure supplement 1—source data 1.
-
Figure 4—figure supplement 1—source data 1
Source data for Figure 4—figure supplement 1B.
- https://cdn.elifesciences.org/articles/71198/elife-71198-fig4-figsupp1-data1-v1.xlsx
Figure 5
Postexocytic sorting of endogenous VGAT depends on adaptor protein complex 2 (AP-2) but not clathrin at physiological temperature.
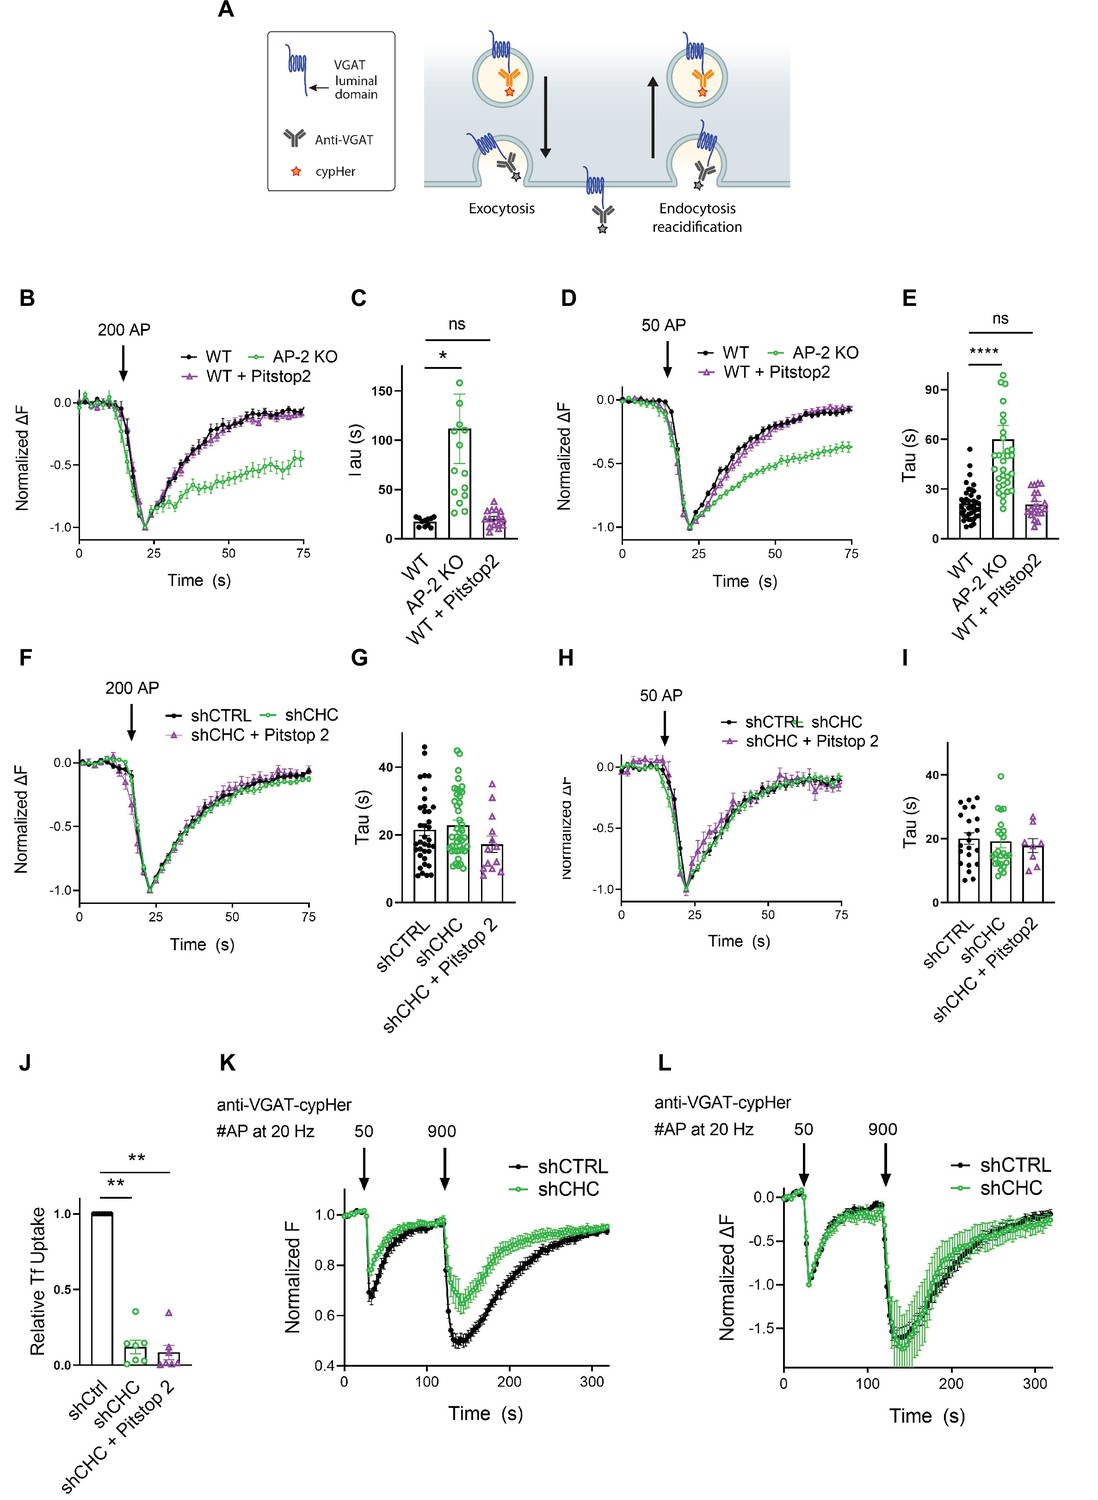
(A) Diagram depicting the use of CypHer5E-coupled antibodies targeting the luminal domain of VGAT to monitor fluorescence changes during exoendocytosis of endogenously labeled VGAT, as CypHer5E is a pH-sensitive fluorophore which is quenched at neutral extracellular pH. (B–I) Clathrin but not AP-2 is dispensable for endocytic retrieval of endogenous CypHer5E-labeled VGAT independent of the stimulation intensity at physiological temperature. Average normalized traces of neurons from WT treated or not with the clathrin inhibitor Pitstop2 and from AP-2μ KO mice incubated with anti-VGAT CypHer5E-coupled antibodies for live labeling of synapses in response to a high-frequency stimulus train (200 APs at 40 Hz) (B) or to mild-frequency stimulation (50 APs at 20 Hz) (D) at physiological temperature. (C) Quantification of the endocytic decay time constant (τ) of anti-VGAT CypHer5E-labeled neurons stimulated with 200 APs at 40 Hz (τWT = 17.38 ± 1.30 s, τAP-2μ KO = 111.7 ± 35.12 s, τWT+Pitstop2 = 20.39 ± 2.23 s). Data represent the mean ± standard error of the mean (SEM) for nWT = 11 images, nAP-2µ KO = 15 images, and nWT+Pitstop2 = 15 images. *pWT vs AP-2μ KO = 0.0179, pWT vs WT+Pitstop2 = 0.9954, one-way analysis of variance (ANOVA) with Tukey’s post-test. (E) Quantification of the endocytic decay constant (τ) of anti-VGAT CypHer5E-labeled neurons after delivery of 50 APs at 20 Hz (τWT = 21.13 ± 1.57 s, τAP-2μ KO = 60.04 ± 8.39 s, τWT+Pitstop2 = 20.73 ± 1.81 s). Data represent the mean ± SEM for nWT = 40 images, nAP-2μ KO = 32 images, and nWT+Pitstop2 = 20 images. ****pWT vs AP-2μ KO < 0.0001, pWT vs WT+Pitstop2 = 0.9986, one-way ANOVA with Tukey’s post-test. (F) Average normalized traces of neurons transduced with lentivirus expressing nonspecific shRNA (shCTRL) or shRNA-targeting CHC (shCHC) treated or not with the clathrin inhibitor Pitstop2 and incubated with anti-VGAT CypHer5E-coupled antibodies in response to a high-frequency stimulus train (200 APs at 40 Hz) (F) or to mild-frequency stimulation (50 APs at 20 Hz) (H) at physiological temperature. (G) Quantification of the endocytic decay time constant (τ) of anti-VGAT CypHer5E-labeled neurons stimulated with 200 APs at 40 Hz (τshCTRL = 21.50 ± 1.72 s, τshCHC = 22.86 ± 1.46 s, τshCHC+Pitstop2 = 17.23 ± 2.41 s). Data represent the mean ± SEM for nshCTRL = 36 images, nshCHC = 42 images, and nshCHC+Pitstop2 = 13 images. pshCTRL vs shCHC = 0.8119, pshCTRL vs shCHC+Pitstop2 = 0.3688, pshCHC vs shCHC+Pitstop2 = 0.1683, one-way ANOVA with Tukey’s post-test. (I) Quantification of the endocytic decay time constant (τ) of anti-VGAT CypHer5E-labeled neurons after delivery of 50 APs at 20 Hz (τshCTRL = 20.09 ± 1.78 s, τshCHC = 19.23 ± 2.01 s, τshCHC+Pitstop2 = 17.90 ± 2.15 s). Data represent the mean ± SEM for nshCTRL = 22 images, nshCHC = 26 images, and nshCHC+Pitstop2 = 8 images. pshCTRL vs shCHC = 0.9427, pshCTRL vs shCHC+Pitstop2 = 0.8286, pshCHC vs shCHC+Pitstop2 = 0.9301, one-way ANOVA with Tukey’s post-test. (J) Clathrin inactivation leads to reduced CME of transferrin. Quantification of primary neurons transduced with shCTRL or shCHC treated or not with the clathrin inhibitor Pitstop2 and allowed to internalize AlexaFluor647-labeled transferrin (Tf647) for 20 min at 37°C. Values for shCTRL were set to 1. The data represent mean ± SEM from n = 7 independent experiments. ****p < 0.0001, two-sided one-sample t-test. (K, L) Clathrin loss increases depression of neurotransmitter release without changing postexocytic retrieval kinetics of endogenous VGAT. (K) Average normalized traces of neurons transduced with lentivirus expressing either shCTRL or shCHC, incubated with anti-VGAT CypHer5E-coupled antibodies and subjected to consecutive stimulus trains of 50 and 900 APs applied both at 20 Hz with an interstimulus interval of 1.5 min to determine the size of the readily releasable synaptic vesicle (SV) pool and the recycling SV pool. n = 10 images for shCTRL and n = 8 images for shCHC. (L) Average normalized traces of neurons transduced with lentivirus expressing either shCTRL or shCHC, incubated with anti-VGAT CypHer5E-coupled antibodies and subjected to consecutive stimulus trains of 50 and 900 APs applied both at 20 Hz with an interstimulus interval of 1.5 min. The fluorescence was normalized to the first peak at the end of the first AP train with 50 APs. No differences in the kinetics of endocytic recovery were observed. n = 10 images for shCTRL and n = 8 images for shCHC. Raw data can be found in Figure 5—source data 1.
-
Figure 5—source data 1
Souce data for Figure 5B-L.
- https://cdn.elifesciences.org/articles/71198/elife-71198-fig5-data1-v1.xlsx
Figure 6 with 1 supplement

Adaptor protein complex 2 (AP-2) depletion results in surface stranding of endogenous vesicular neurotransmitter transporters but not of Synaptotagmin 1 and SV2A.
(A) Schematic diagram of the workflow for cell surface protein enrichment. (B–I) AP-2 participates in the surface retrieval of the endogenous synaptic vesicle (SV) proteins such as VGLUT1 and VGAT but not of SV2 and Syt1. Cell surface proteins from WT and AP-2μ KO cerebellar granule cells were biotinylated and affinity-purified using streptavidin beads. Total (Input) and biotinylated proteins (Surface) were analyzed by western blot using antibodies against Syt1 (B), SV2 (D), VGLUT1 (F), and VGAT (H). N-cadherin and GAPDH were used as control of cell surface membrane and cytosol fraction, respectively. The fold surface enrichment of select proteins (C, E, G, I) in the absence of AP-2 was quantified. Values for WT neurons were set to 1. Data represent the mean ± standard error of the mean (SEM). nSyt1 = 8, nSV2 = 5, nVGLUT1 = 8, nVGAT = 6 independent experiments. pSyt1 = 0.4456, pSV2 = 0.6736, **pVGLUT1 = 0.0049, *pVGAT = 0. 0279; two-sided one-sample t-test. Raw data can be found in Figure 6—source data 1, and Figure 6—source data 2.
-
Figure 6—source data 1
Source data for Figure 6C, E, G, I.
- https://cdn.elifesciences.org/articles/71198/elife-71198-fig6-data1-v1.xlsx
-
Figure 6—source data 2
Raw uncropped immunoblot images for Figure 6B, D, F, H.
- https://cdn.elifesciences.org/articles/71198/elife-71198-fig6-data2-v1.pdf
Figure 6—figure supplement 1
Adaptor protein complex 2 (AP-2) depletion does not change the total levels of synaptic vesicle (SV) proteins.
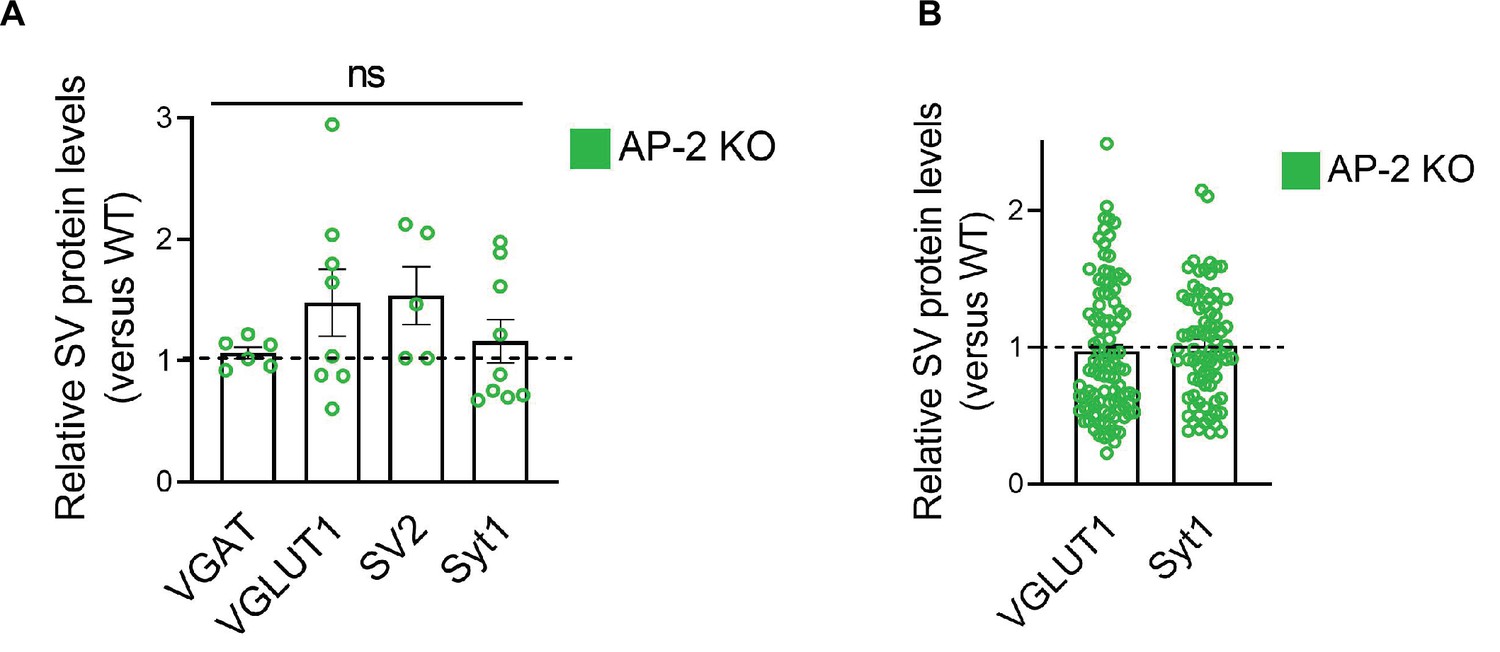
(A, B) Levels of presynaptic proteins are largely unaffected in the absence of AP-2. (A) Quantification of presynaptic proteins analyzed in lysates from WT and AP-2μ KO neurons. Protein expression was normalized to that of GAPDH. Values for WT neurons were set to 1. Data represent mean ± standard error of the mean (SEM) of n = 6 for VGLUT1 (p = 0.2383), n = 8 for VGAT (p = 0.1274), n = 5 for SV2 (p = 0.0883), and n = 9 independent experiments for Syt1 (p = 0.4001). Two-sided one-sample t-test. (B) Fluorescence intensity quantification of the presynaptic marker proteins (VGLUT1 and Syt1) analyzed from WT and AP-2μ KO hippocampal neuron cultures. Values to WT. Data represent mean ± SEM of n = 99 images for VGLUT1 (p = 0.5547) and n = 78 images for Syt1 (p = 0.7623). Two-sided one-sample t-test. Raw data can be found in Figure 6—figure supplement 1—source data 1.
-
Figure 6—figure supplement 1—source data 1
Source data for Figure 6—figure supplement 1A, B.
- https://cdn.elifesciences.org/articles/71198/elife-71198-fig6-figsupp1-data1-v1.xlsx
Figure 7 with 1 supplement
Surface stranding of adaptor protein complex 2 (AP-2)-dependent synaptic vesicle (SV) cargos in the absence of AP-2 is activity dependent.
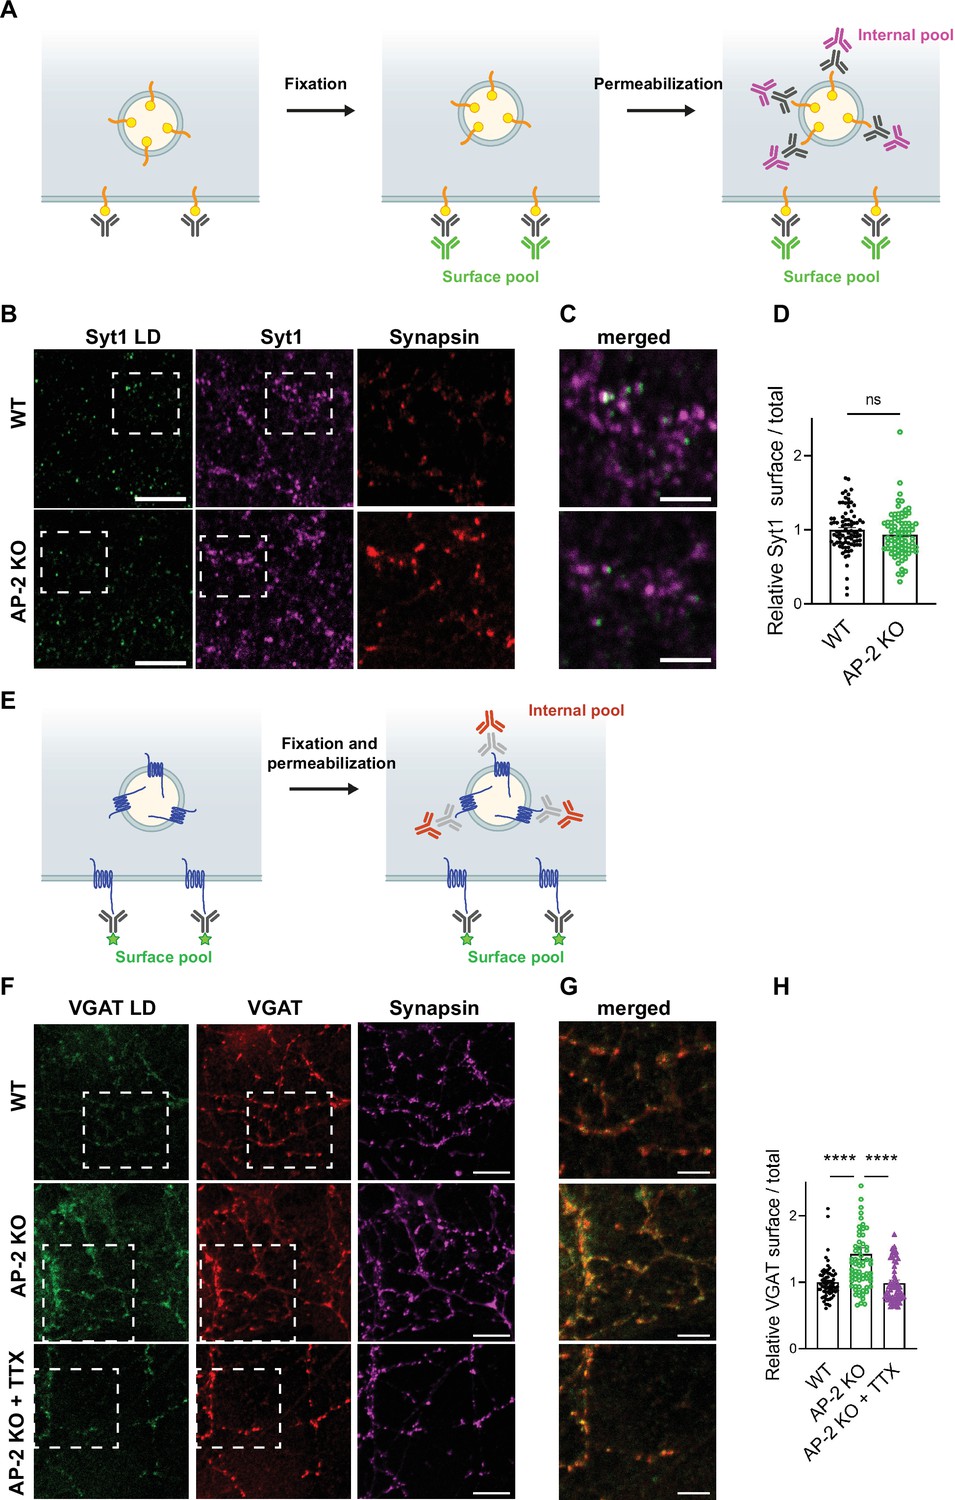
(A–D) Surface levels of Syt1 are unaffected by loss of AP-2. (A) Schematic drawing of the assay to monitor surface and total levels of Syt1. To label surface epitopes of Syt1, living hippocampal neurons are first incubated with anti-Syt1 antibodies against the luminal domain (black) at 4°C to limit its endocytosis prior to fixation. With no permeabilization conditions, neurons are incubated with 488-conjugated secondary antibodies (green) allowing to reveal the surface pool of Syt1. After washing off unbound antibodies, coverslips are subsequently immunostained using Syt1 antibodies against the cytosolic side (gray) after applying permeabilization conditions. Incubation with 647-conjugated secondary antibodies (magenta) will reveal the total amount of Syt1. Coverslips will be imaged to determine the amount of surface and total Syt1 labeling present in synapses by additional immunostaining of the presynaptic marker Synapsin (not depicted). (B) Representative confocal images of cultured hippocampal neurons from WT or AP-2μ KO mice coimmunostained for total Syt1 (magenta), surface Syt1 (Syt1 LD, green), and Synapsin (red). Scale bars, 5 µm. (C) A zoom of the marked area in (B). Scale bars, 2 µm. (D) Quantification of surface/total Syt1 levels. Values were normalized for WT. Data represent mean ± standard error of the mean (SEM) of nWT = 83 images and nAP-2μ KO = 79 images. p = 0.1519, two-sided unpaired t-test. (E–H) Elevated surface levels of VGAT in the absence of AP-2 are rescued by blocking neuronal network activity. (E) Schematic drawing of the assay to monitor surface and total levels of VGAT. To label the surface pool of VGAT, living hippocampal neurons are first incubated with fluorophore‐conjugated (green stars) antibodies (black) against the luminal domain of VGAT at 4°C prior to fixation. After permeabilization, coverslips are immunostained using VGAT antibodies against the cytosolic side (gray) and 568-conjugated secondary antibodies (orange) revealing the total VGAT. Coverslips are imaged for analyzing the surface and total VGAT labeling present in synapses by additional immunostaining of the presynaptic marker Synapsin (not depicted). (F) Representative confocal images of WT or AP-2μ KO hippocampal neurons treated or not with tetrodotoxin (TTX) since days in vitro (DIV)7 to block spontaneous action potentials and coimmunostained for total VGAT (red), surface VGAT (VGAT LD, green) and Synapsin (magenta). Scale bars, 10 µm. (G) A zoom of the marked area in (F). Scale bars, 5 µm. (H) Quantification shows that elevated ratio of surface/total VGAT in AP-2μ KO neurons is rescued when neurons were treated with TTX. Values were normalized to WT. Data represent mean ± SEM of nWT = 67 images, nAP-2μ KO = 69 images, and nAP-2μ KO+TTX = 58 images. ****pWT vs AP-2μ KO < 0.0001, pWT vs AP-2μ KO+TTX = 0.9904, ****pAP-2μ KO vs AP-2μ KO+TTX < 0.0001. One-way analysis of variance (ANOVA) with Tukey’s post-test. Raw data can be found in Figure 7—source data 1.
-
Figure 7—source data 1
Source data for Figure 7D, H.
- https://cdn.elifesciences.org/articles/71198/elife-71198-fig7-data1-v1.xlsx
Figure 7—figure supplement 1
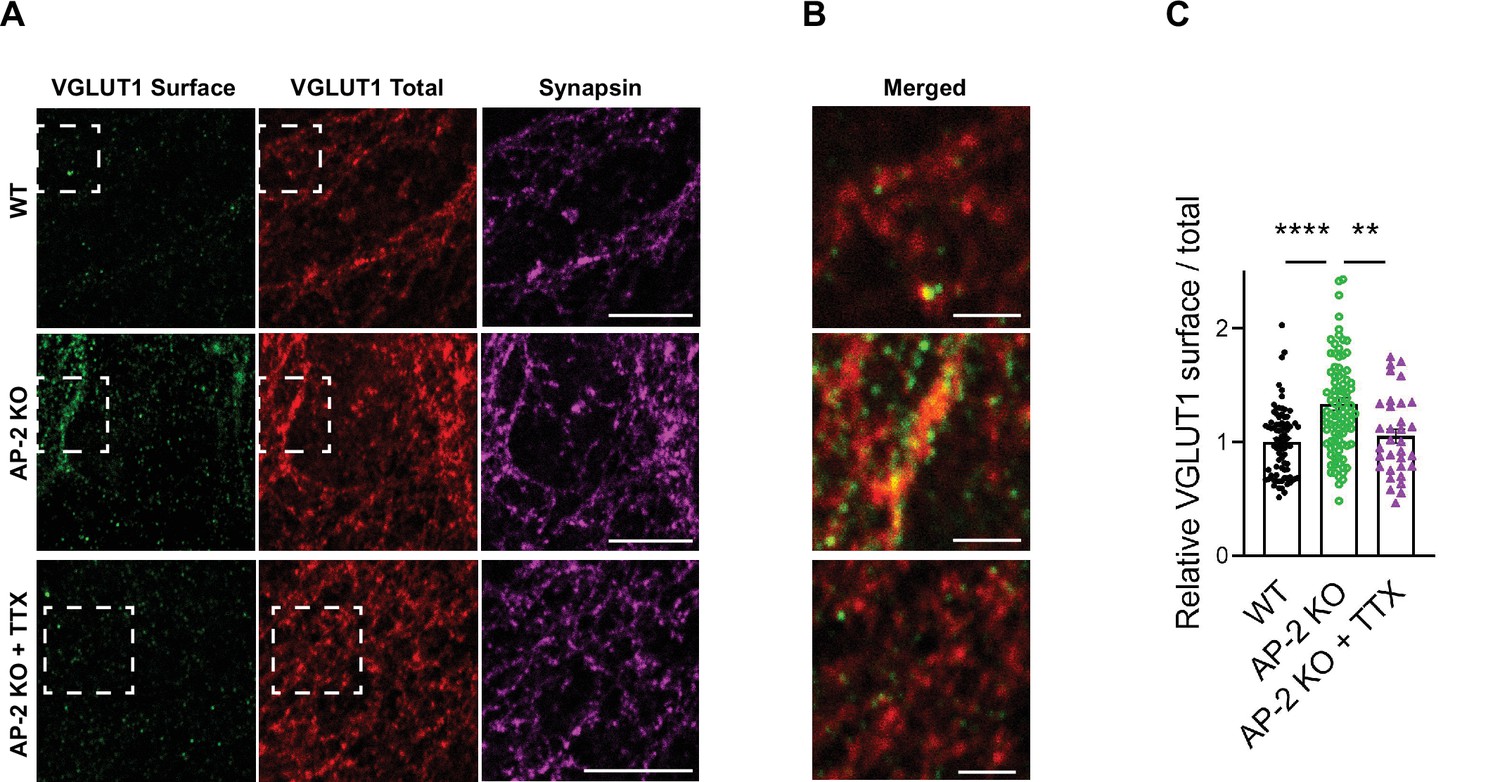
Adaptor protein complex 2 (AP-2) depletion alters the localization of VGLUT1 in an activity-dependent manner.
(A–C) Block of neuronal network activity rescues surface accumulation of VGLUT1 in neurons lacking AP-2. (A) Representative confocal images of WT and AP-2μ KO neurons treated or not with tetrodotoxin (TTX) since days in vitro (DIV)7 to block spontaneous action potentials and coimmunostained for total VGLUT1 (red), surface VGLUT1 (green), and the presynaptic marker Synapsin (magenta). Scale bars: 10 µm. (B) A zoom of the marked areas in (A). Scale bars, 2 µm. (C) Elevated ratio of surface/total VGLUT1 in AP-2μ KO neurons is rescued when neurons were treated with TTX. Values for WT neurons were set to 1. Data represent mean ± standard error of the mean (SEM) of nWT = 81 images, nAP-2μ KO = 92 images, and nAP-2μ KO+TTX = 33 images. ****pWT vs AP-2μ KO < 0.0001, p WT vs AP-2μ KO+TTX = 0.8004, **pAP-2μ KO vs AP-2μ KO+TTX = 0.0026. One-way analysis of variance (ANOVA) with Tukey’s post-test. Raw data can be found in Figure 7—figure supplement 1—source data 1.
-
Figure 7—figure supplement 1—source data 1
Source data for Figure 7—figure supplement 1C.
- https://cdn.elifesciences.org/articles/71198/elife-71198-fig7-figsupp1-data1-v1.xlsx
Figure 8 with 1 supplement
Adaptor protein complex 2 (AP-2)-binding deficient mutants of vesicular neurotransmitter transporters phenocopy loss of AP-2.
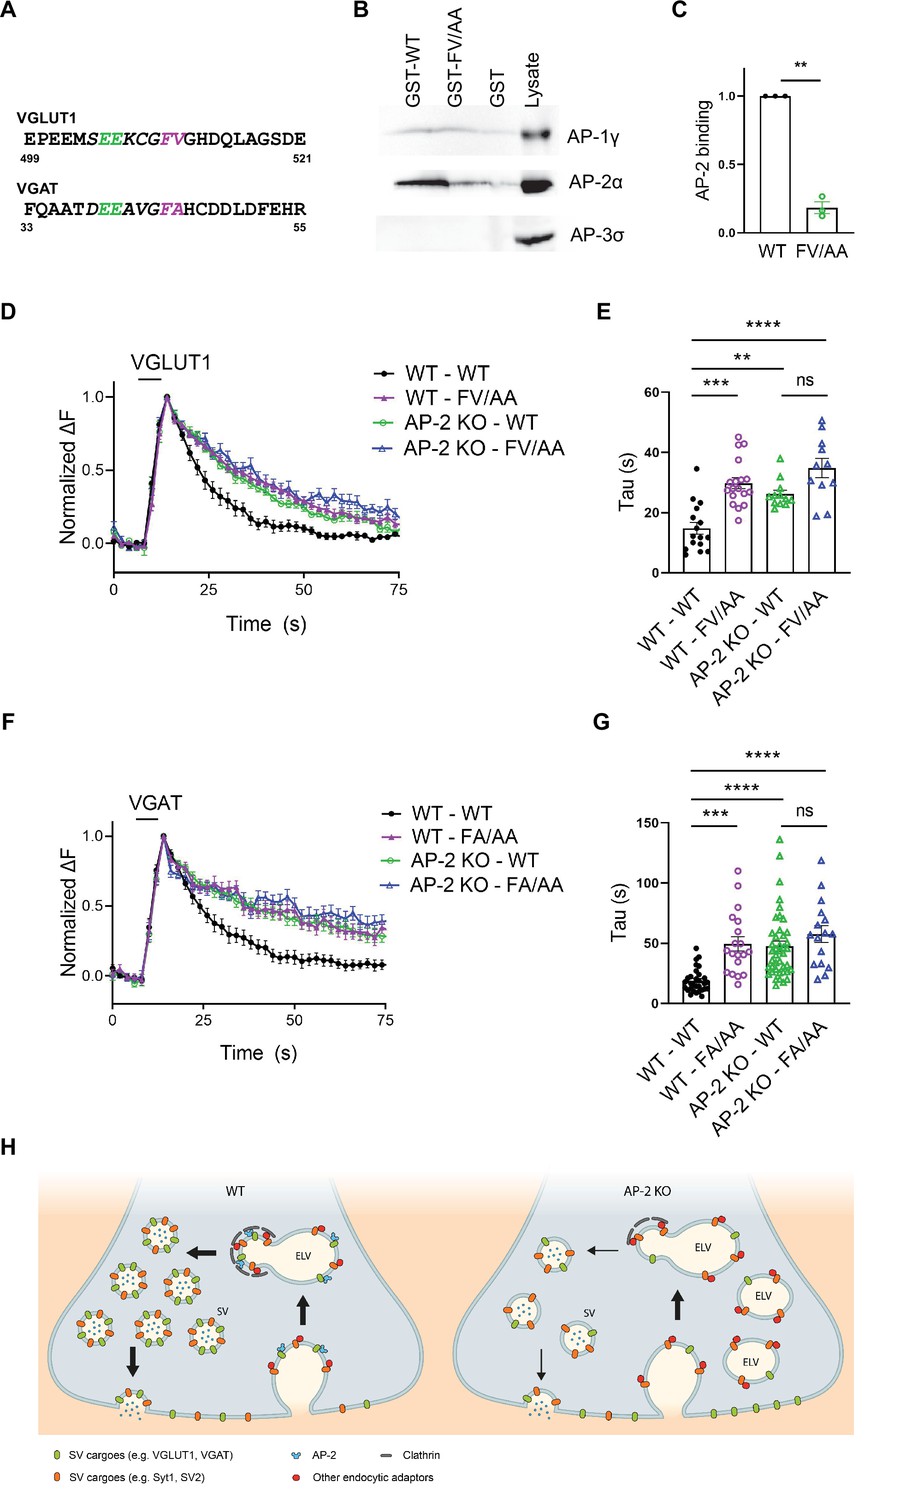
(A–C) Association of the cytoplasmic domain of VGLUT1 with the clathrin adaptor complex AP-2 is abolished upon mutational inactivation of the putative AP-2-binding dileucine motif, that is F510A/V511A (FV/AA). (A) Acidic cluster dileucine-like motifs identified in the C-terminal cytoplasmic tail of mouse VGLUT1 and in the N-terminal cytoplasmic tail of mouse VGAT. Numbers indicate amino acid numbers of the respective proteins. Green and magenta indicate two acidic amino acids and two hydrophobic amino acids conserved within the motifs, respectively. (B) Immunoblot analysis of material affinity-purified via GST-VGLUT1 C-terminus-WT, GST-VGLUT1 C-terminus-FV/AA or GST alone, and brain lysate using specific antibodies against AP-2, AP-1, and AP-3 shows that dileucine-like motif found in the C-terminus of VGLUT1 binds preferentially to AP-2. (C) Quantified data exhibit VGLUT1 C-terminus-FV/AA variant to significantly disrupt interaction with AP-2. Data represent the mean ± standard error of the mean (SEM) from n = 3 independent experiments. **p = 0.0027, two-sided one-sample t-test. (D–G) Mutant variants of VGLUT1 or VGAT defective in AP-2-binding display significantly slower endocytosis kinetics in response to stimulation in a similar manner to be observed in the absence of AP-2. (D) Average normalized traces of neurons from WT and AP-2μ KO mice transfected with either the WT or the mutant variant (FV/AA) of VGLUT1-SEP in response of a stimulus train of 200 APs applied at 40 Hz at physiological temperature. (E) Quantification of the endocytic decay time constant (τ) of VGLUT1-SEP-expressing neurons (τWT-WT = 14.82 ± 1.98 s, τWT-FV/AA = 29.82 ± 1.82 s, τAP-2μ KO-WT = 26.15 ± 1.34 s, τAP-2μ KO-FV/AA = 34.80 ± 3.18 s). Data represent the mean ± SEM of nWT-WT = 16 images, nWT-FV/AA = 18 images, nAP-2μ KO-WT = 12 images, and nAP-2μ KO-FV/AA = 11 images. ****pWT-WT vs WT-FV/AA < 0.0001, **pWT-WT vs AP-2μ KO-WT = 0.0023, ****pWT-WT vs AP-2μ KO-FV/AA < 0.0001, pAP-2μ KO-WT vs AP-2μ KO-FV/AA = 0.0530, one-way analysis of variance (ANOVA) with Tukey’s post-test. (F) Average normalized traces of WT and AP-2μ KO neurons transfected with either the WT or the mutant variant (FA/AA) of VGAT-SEP in response of 200 APs applied at 40 Hz at physiological temperature. (G) Quantification of the endocytic decay time constant (τ) of VGAT-SEP-expressing neurons (τWT-WT = 18.86 ± 1.79 s, τWT-FA/AA = 49.56 ± 5.95 s, τAP-2μ KO-WT = 47.43 ± 4.19 s, τAP-2μ KO-FA/AA = 57.60 ± 6.92 s). Data represent the mean ± SEM of nWT-WT = 30 images, nWT-FA/AA = 19 images, nAP-2μ KO-WT = 42 images, and nAP-2μ KO-FA/AA = 16 images. ***pWT-WT vs WT-FA/AA = 0.0001, ****pWT-WT vs AP-2μ KO-WT < 0.0001, ****pWT-WT vs AP-2μ KO-FA/AA < 0.0001, pAP-2μ KO-WT vs AP-2μ KO-FA/AA = 0.4561, one-way ANOVA with Tukey’s post-test. (H) Illustrated model proposing a clathrin-independent role for dedicated endocytic adaptors such as AP-2 which recognize select exocytosed synaptic vesicle (SV) proteins (e.g., VGLUT1 and VGAT) present on the neuronal surface to facilitate their clathrin-independent endocytic internalization while clathrin operates downstream facilitating the reformation of functional SVs by budding from internal endosome-like vacuoles (ELVs) in a process that also depends on AP-2 and other clathrin-associated endocytic proteins. Raw data can be found in Figure 8—source data 1 and Figure 8—source data 2.
-
Figure 8—source data 1
Source data for Figure 8C-G.
- https://cdn.elifesciences.org/articles/71198/elife-71198-fig8-data1-v1.xlsx
-
Figure 8—source data 2
Raw uncropped immunoblot images for Figure 8B.
- https://cdn.elifesciences.org/articles/71198/elife-71198-fig8-data2-v1.pdf
Figure 8—figure supplement 1

Defective retrieval of vesicular neurotransmitter transporters carrying mutations in the adaptor protein complex 2 (AP-2)-binding dileucine motif cannot be ascribed to defects in acidification.
(A) VGLUT1 – AP-1 interaction is insensitive to the F510A/ V511A mutation. Quantification of the band intensity corresponding to AP-1γ subunit bound either to GST-VGLUT1-WT or VGLUT1-FV/AA mutant (from the GST pulldown assay shown in Figure 8B). Values for VGLUT1-WT were set to 1. Data represent mean ± standard error of the mean (SEM) of n = 3 independent experiments. p = 0.9561. Two-sided one-sample t-test. (B–E) Endocytic defect caused by AP-2-binding deficient mutations in the vesicular transporters is aggravated under conditions that favor clathrin-mediated endocytosis (CME; e.g., at room temperature [RT] with low stimulation frequency). Average normalized traces of hippocampal neurons transduced with lentivirus expressing either VGLUT1-WT-SEP and VGLUT1-FV/AA-SEP (B) or VGAT-WT-SEP and VGAT-FA/AA-SEP (D) upon stimulation with 200 APs at 5 Hz at RT. Quantification of endocytic decay time constant (τ) of SEP signal in VGLUT1-SEP-expressing neurons (C) (τVGLUT1-WT = 26.28 ± 1.69 s, τVGLUT1-FV/AA = 87.86 ± 8.16 s) or VGAT-SEP-expressing neurons (E) (τVGAT-WT = 22.45 ± 1.17 s, τVGAT-FA/AA = 125.62 ± 8.71 s). Data represent the mean ± SEM: VGLUT1 (nVGLUT1-WT = 7 images, nVGLUT1-FV/AA = 6 images; ****p < 0.0001) and for VGAT (nVGAT-WT = 15 images, nVGAT-FA/AA = 19 images; ****p < 0.0001). Two-sided unpaired t-test. (F, G) Slower poststimulus retrieval of AP-2-deficient binding variant of VGLUT1 is not caused by defects in reacidification of endocytosed vesicles. (F) Average normalized traces showing poststimulus application (200 APs, 5 Hz) of an acid quench protocol to reveal the fraction of synaptic vesicle (SV) protein retrieved immediately after stimulation in hippocampal neurons transduced with lentivirus expressing either VGLUT1-WT-SEP or VGLUT1-FV/AA-SEP. Values are normalized to the corresponding maximal fluorescent peak obtained upon NH4Cl application. (G) Fluorescence signal ratio between minimum (acid load) and maximum (NH4Cl) was quantified. Data represent the mean ± SEM of nVGLUT1-WT = 8 images and nVGLUT1-FV/AA = 9 images. p = 0.7781, two-sided unpaired t-test. Raw data can be found in Figure 8—figure supplement 1—source data 1.
-
Figure 8—figure supplement 1—source data 1
Source data for Figure 8—figure supplement 1A-G.
- https://cdn.elifesciences.org/articles/71198/elife-71198-fig8-figsupp1-data1-v1.xlsx
Tables
Key resources table
| Reagent type (species) or resource | Designation | Source or reference | Identifiers | Additional information |
|---|---|---|---|---|
| Genetic reagent (M. musculus) | ICR wild type | SLC Japan | RRID:MGI:5462094 | |
| Genetic reagent (M. musculus) | C57BL/6N wild type | Leibniz Research Institute for Molecular Pharmacology | RRID:MGI:5651595 | |
| Genetic reagent (M. musculus) | Ap2m1lox/lox × inducible CAG-Cre | Haucke Lab Kononenko et al., 2014 | ||
| Recombinant DNA reagent | SEP-tagged VGLUT1 | Takamori Lab Mori et al., 2021 | ||
| Recombinant DNA reagent | SEP-tagged Syp | L. Lagnado Granseth et al., 2006 | ||
| Recombinant DNA reagent | SEP-tagged Syp | Takamori Lab Egashira et al., 2015 | ||
| Recombinant DNA reagent | SEP-tagged Syb2 | S. Kawaguchi | ||
| Recombinant DNA reagent | pLenti6PW-STB | Y. Fukazawa Hioki et al., 2009 | ||
| Recombinant DNA reagent | SEP-tagged Syt1 | J. Klingauf Wienisch and Klingauf, 2006 | ||
| Recombinant DNA reagent | SEP-tagged Syb2 | J. Klingauf Wienisch and Klingauf, 2006 | ||
| Recombinant DNA reagent | SEP-tagged SV2A | E.R. Chapman Kwon and Chapman, 2011 | ||
| Recombinant DNA reagent | SEP-tagged VGLUT1 | R. Edwards and S. Voglmaier Voglmaier et al., 2006 | ||
| Recombinant DNA reagent | SEP-tagged VGAT | S. Voglmaier Santos et al., 2013 | ||
| Recombinant DNA reagent | f(U6)sNLS-RFPw msClathrin scrambled | C. Rosenmund Watanabe et al., 2014 | ||
| Recombinant DNA reagent | f(U6)sNLS-RFPw msClathrin shRNA | C. Rosenmund Watanabe et al., 2014 | ||
| Recombinant DNA reagent | pLV-shmCHC-hPGK-mCherry | VectorBuilder | ||
| Recombinant DNA reagent | AP2mu-IRES-mRFP in-AAV-HBA-EWB | Haucke Lab López-Hernández et al., 2020 | ||
| Chemical compound, drug | Pitstop2 | Haucke Lab von Kleist et al., 2011 | 30μM | |
| Chemical compound, drug | Folimycin | Sigma | Cat# C9705 | 67nM |
| Chemical compound, drug | EZ-Link Sulfo-NHS-LC-Biotin | Thermo Fisher Scientific | Cat# 21,335 | 0.5mg/ml |
| Chemical compound, drug | Streptavidin agarose | Millipore | Cat# 69,203 | 100μl |
| Chemical compound, drug | GST-bind resin | Cytiva | Cat# 17075601 | 120μl |
| Chemical compound, drug | Transferrin 647 | Life Technologies | Cat# T23366 | 25μg/ml |
| Chemical compound, drug | Tamoxifen ((Z)-4-hydroxytamoxifen) | Sigma | Cat# H7904 | 0.1μM |
| Chemical compound, drug | AraC | Sigma | Cat# C6645 | 4μM |
| Chemical compound, drug | Uridine | Sigma | Cat# U3750 | 100μM |
| Chemical compound, drug | Uridine | Sigma | Cat# U3003 | 100μM |
| Chemical compound, drug | FUDR | Sigma | Cat# F0503 | 40μM |
| Commercial assay or kit | ProFection Mammalian Transfection System – Calcium Phosphate | Promega | Cat# E1200 | |
| Commercial assay or kit | CalPhos Mammalian Transfection Kit | Takara | Cat# 631,312 | |
| Antibody | AP-2 α-adaptin(mouse monoclonal) | Haucke Lab | AP6 | IF: 1:100 |
| Antibody | AP-2 α-adaptin(mouse monoclonal) | Santa Cruz | Cat# sc-55497RRID:AB_2056344 | WB: 1:100 |
| Antibody | γ-Adaptin 1(mouse monoclonal) | BD Biosciences | Cat# 610,386RRID:AB_397769 | WB: 1:500 |
| Antibody | σ-Adaptin 3(mouse monoclonal) | Haucke Lab | SA4 | WB: 1:250 |
| Antibody | β-Actin(mouse monoclonal) | Sigma-Aldrich | Cat# A-5441RRID:AB_476744 | WB: 1:5000 |
| Antibody | GAPDH(mouse monoclonal) | Sigma-Aldrich | Cat# G8795RRID:AB_1078991 | WB: 1:5000 |
| Antibody | N-cadherin(mouse monoclonal) | BD Biosciences | Cat# 610,920RRID:AB_610920 | WB: 1:1000 |
| Antibody | CHC(mouse monoclonal) | Haucke lab | TD1 | WB: 1:500 |
| Antibody | CHC(rabbit polyclonal) | Abcam | Cat# ab21679RRID:AB_ 2083165 | IF: 1:1000 |
| Antibody | Synaptophysin(mouse monoclonal) | R. Jahn | Cl 7.2 | IF: 1:1000 |
| Antibody | MAP-2(guinea pig polyclonal) | Synaptic Systems | Cat# 188 004RRID:AB_2138181 | IF: 1:400 |
| Antibody | Synapsin(mouse monoclonal) | Synaptic Systems | Cat# 106 001RRID:AB_887805 | IF: 1:400 |
| Antibody | Synapsin(guinea pig polyclonal) | Synaptic Systems | Cat# 106 004RRID:AB_1106784 | IF: 1:400 |
| Antibody | VGLUT1(guinea pig polyclonal) | Synaptic Systems | Cat# 135 304RRID:AB_887878 | IF: 1:300WB: 1:500 |
| Antibody | Synaptotagmin 1(rabbit polyclonal) | Synaptic Systems | Cat# 105 102RRID:AB_887835 | IF: 1:100 |
| Antibody | Synaptotagmin 1(mouse monoclonal) | Synaptic Systems | Cat# 105 011RRID:AB_887832 | IF: 1:250WB: 1:500 |
| Antibody | VGAT Oyster 488(rabbit polyclonal) | Synaptic Systems | Cat# 131 103C2RRID:AB_10640329 | IF: 1:100 |
| Antibody | VGAT Oyster 568(rabbit polyclonal) | Synaptic Systems | Cat# 131 103C3RRID:AB_887867 | IF: 1:100 |
| Antibody | VGAT(rabbit polyclonal) | Synaptic Systems | Cat# 131 013RRID:AB_2189938 | IF: 1:300 |
| Antibody | VGAT(guinea pig polyclonal) | Synaptic Systems | Cat# 131 004RRID:AB_887873 | WB: 1:500 |
| Antibody | VGAT(rabbit polyclonal) | Synaptic Systems | Cat# 131 103CpHRRID:AB_2189809 | Live imaging:1:120 |
| Antibody | SV2(rabbit polyclonal) | Abcam | Cat# ab32942RRID:AB_778192 | WB: 1:500 |
| Antibody | Peroxidase-AffiniPure Anti-Rabbit IgG (H + L)(goat polyclonal) | Jackson ImmunoResearch Labs | Cat# 111-035-003RRID:AB_2313567 | WB: 1:10,000 |
| Antibody | Peroxidase-AffiniPure Anti-Mouse IgG (H + L)(goat polyclonal) | Jackson ImmunoResearch Labs | Cat# 115-035-003RRID:AB_10015289 | WB: 1:10,000 |
| Antibody | Peroxidase-AffiniPure Anti-guineapig IgG (H + L)(goat polyclonal) | Jackson ImmunoResearch Labs | Cat# 106-035-003RRID:AB_2337402 | WB: 1:10,000 |
| Antibody | Mouse IgG HRP Linked F(ab′)2 Fragment(sheep monoclonal) | Cytiva | Cat# GENA9310RRID:AB_772193 | WB: 1:10,000 |
| Antibody | Anti-mouse IgG, IRDye 800CW Conjugated(goat polyclonal) | LI-COR Biosciences | Cat# 926-32210RRID:AB_621842 | WB: 1:10,000 |
| Antibody | IRDye 680RD anti-mouse IgG (H + L)(goat polyclonal) | LI-COR Biosciences | Cat# 925-68070RRID:AB_2651128 | WB: 1:10,000 |
| Antibody | IRDye 680RD anti-rabbit IgG (H + L)(goat polyclonal) | LI-COR Biosciences | Cat# 926-68071RRID:AB_10956166 | WB: 1:10,000 |
| Antibody | Anti-rabbit IgG, IRDye 800CW Conjugated(goat polyclonal) | LI-COR Biosciences | Cat# 926-32211RRID:AB_621843 | WB: 1:10,000 |
| Antibody | Anti-guinea pig IgG Alexa Fluor 647(goat polyclonal) | Thermo Fisher Scientific | Cat# A-21450RRID:AB_141882 | IF: 1:500 |
| Antibody | Anti-guinea pig IgG Alexa Fluor 488(donkey polyclonal) | Jackson ImmunoResearch Labs | Cat# 706-545-148RRID:AB_141954 | IF: 1:500 |
| Antibody | Anti-guinea pig IgG Alexa Fluor 568(goat polyclonal) | Thermo Fisher Scientific | Cat# A-11075RRID:AB_141954 | IF: 1:500 |
| Antibody | Anti-mouse IgG Alexa Fluor 568(goat polyclonal) | Thermo Fisher Scientific | Cat# A-11004RRID:AB_2534072 | IF: 1:500 |
| Antibody | Anti-rabbit IgG Alexa Fluor 647(goat polyclonal) | Thermo Fisher Scientific | Cat# A-21245RRID:AB_2535813 | IF: 1:500 and 1:1000 |
| Antibody | Anti-rabbit IgG Alexa Fluor 488 | Thermo Fisher Scientific | Cat# A-11008RRID:AB_143165 | IF: 1:500 |
| Antibody | Anti-mouse IgG Alexa Fluor 488(goat polyclonal) | Thermo Fisher Scientific | Cat# A-11029RRID:AB_2534088 | IF: 1:500 and 1:1000 |
| Software and algorithms | Image J | Open Source Software | https://imagej.net/Welcome | |
| Software and algorithms | Prism v.8 | GraphPad | RRID: SCR_002798 | |
| Software and algorithms | Python | Programming Language | RRID: SCR_008394 |
Additional files
Download links
A two-part list of links to download the article, or parts of the article, in various formats.
Downloads (link to download the article as PDF)
Open citations (links to open the citations from this article in various online reference manager services)
Cite this article (links to download the citations from this article in formats compatible with various reference manager tools)
Clathrin-independent endocytic retrieval of SV proteins mediated by the clathrin adaptor AP-2 at mammalian central synapses
eLife 11:e71198.
https://doi.org/10.7554/eLife.71198


