Urinary metabolic biomarkers of diet quality in European children are associated with metabolic health
- Department of Preventive Medicine, Keck School of Medicine, University of Southern California, United States
- Cancer Metabolism & Systems Toxicology Group, Division of Cancer, Department of Surgery & Cancer and Division of Systems Medicine, Department of Metabolism, Digestion & Reproduction, Imperial College London, Hammersmith Hospital Campus, United Kingdom
- Norwegian Institute of Public Health, Norway
- Department of Epidemiology, Erasmus University Medical Center, Netherlands
- MRC Centre for Environment and Health, School of Public Health, Imperial College London, United Kingdom
- Oncology Safety, Clinical Pharmacology and Safety Sciences, R&D, AstraZeneca, United Kingdom
- ISGlobal, Spain
- Universitat Pompeu Fabra, Spain
- CIBER Epidemiologia y Salud Pública, Spain
- Inserm, CNRS, University Grenoble Alpes, Team of environmental epidemiology applied to reproduction and respiratory health, IAB, France
- Department of Environmental Sciences, Vytautas Magnus University, Lithuania
- Centre for Research in Epidemiology and Statistics, Université de Paris, Inserm, Inra, France
- Bradford Institute for Health Research, Bradford Teaching Hospitals NHS Foundation Trust, United Kingdom
- Public Health Policy Evaluation Unit, School of Public Health, Imperial College, United Kingdom
- Department of Preventive Medicine, School of Medicine, University of São Paulo, Brazil
- Center for Epidemiological Research in Nutrition and Health, University of São Paulo, Brazil
- Department of Social Medicine, Faculty of Medicine, University of Crete, Greece
- Centre for Genomic Regulation, The Barcelona Institute of Science and Technology, Spain
Figures
Figure 1
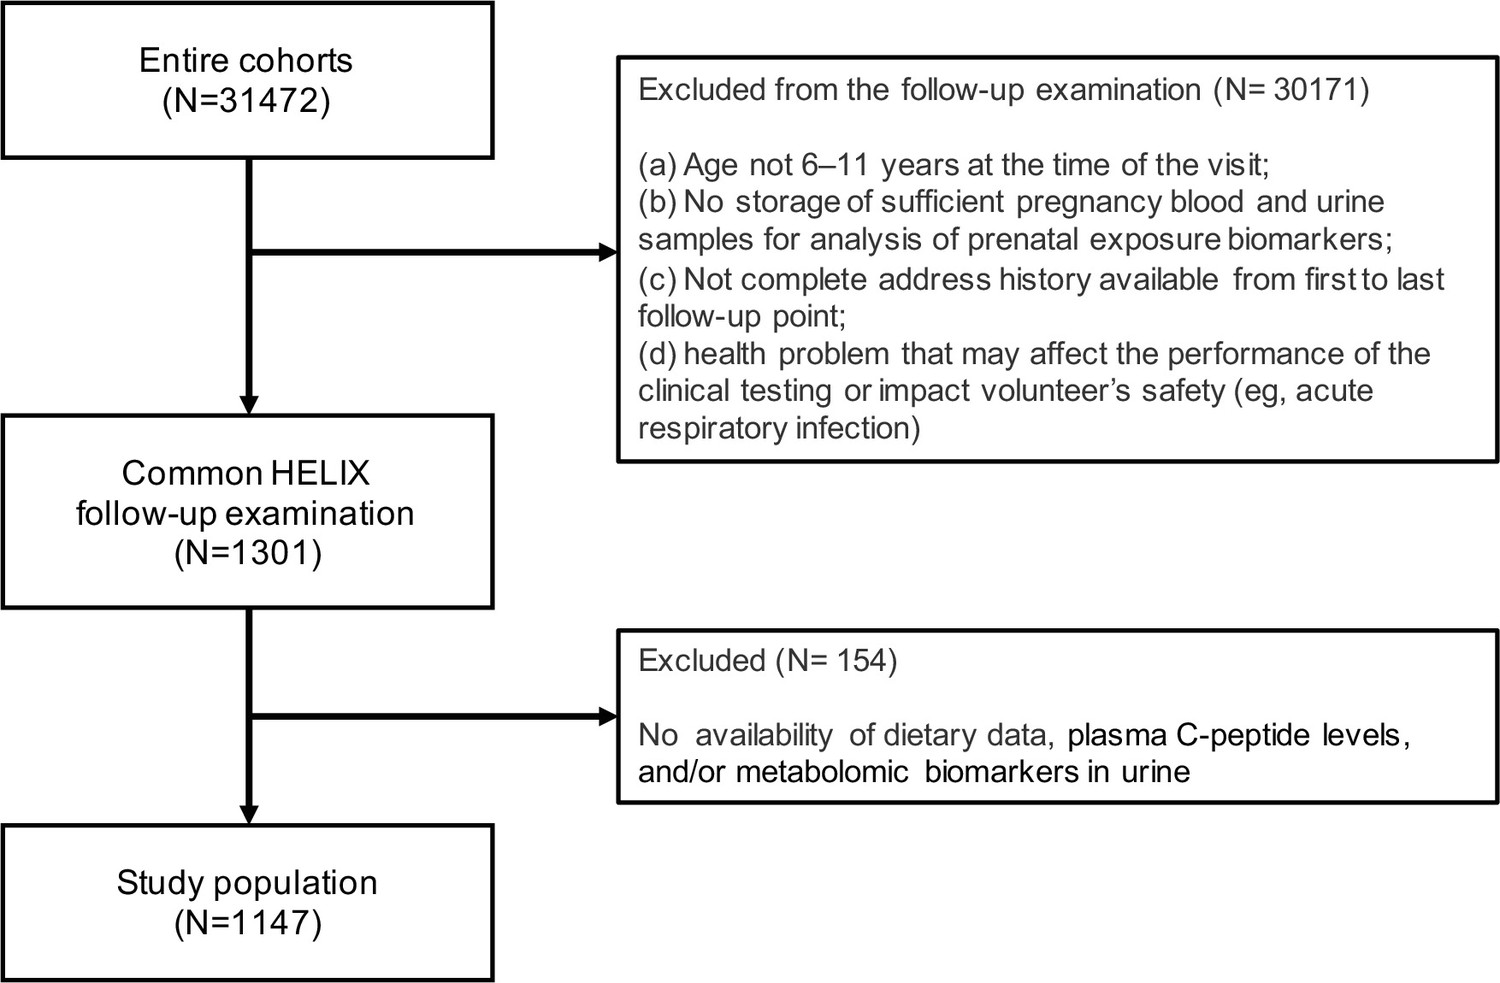
Participant flowchart.
Figure 2
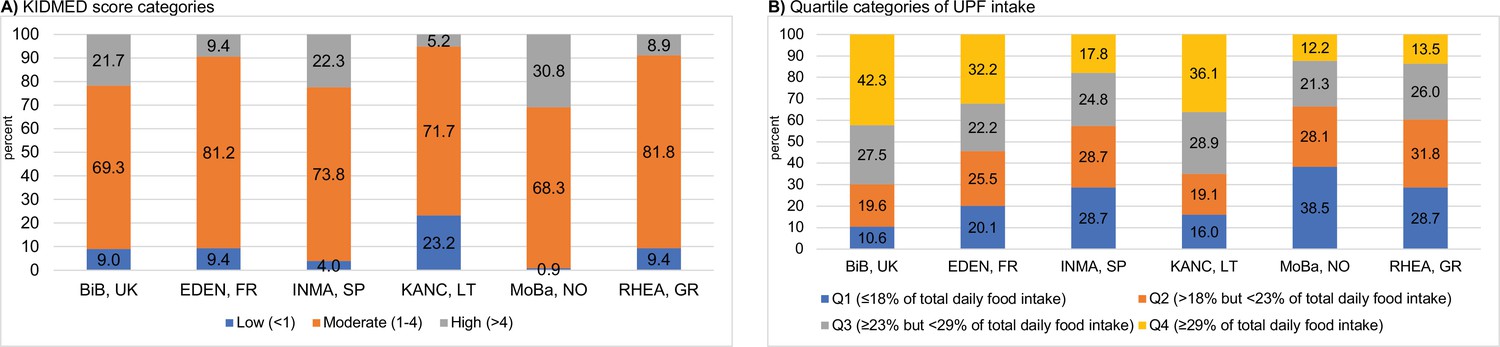
Levels of childhood adherence to the diet quality indicators of interest in each Human Early-Life Exposome (HELIX) subcohort.
Panel (A) illustrates the levels of adherence to the Mediterranean diet which were defined as follows: low, KIDMED score, <1; moderate, KIDMED score, 1–4; and high, >4. Panel (B) illustrates the levels of ultra-processed food consumption (expressed as % of total daily food intake) which are based on quartile (Q) cutoffs according to the intake distribution of the overall HELIX study population. BiB, Born in Bradford cohort; EDEN, the Étude des Déterminants pré et postnatals du développement et de la santé de l’Enfant study; INMA, INfancia y Medio Ambiente cohort; KANC, Kaunas Cohort; KIDMED, Mediterranean Diet Quality Index for children and adolescents; MoBa, Norwegian Mother, Father and Child Cohort Study; RHEA, Rhea Mother Child Cohort study.
Figure 3
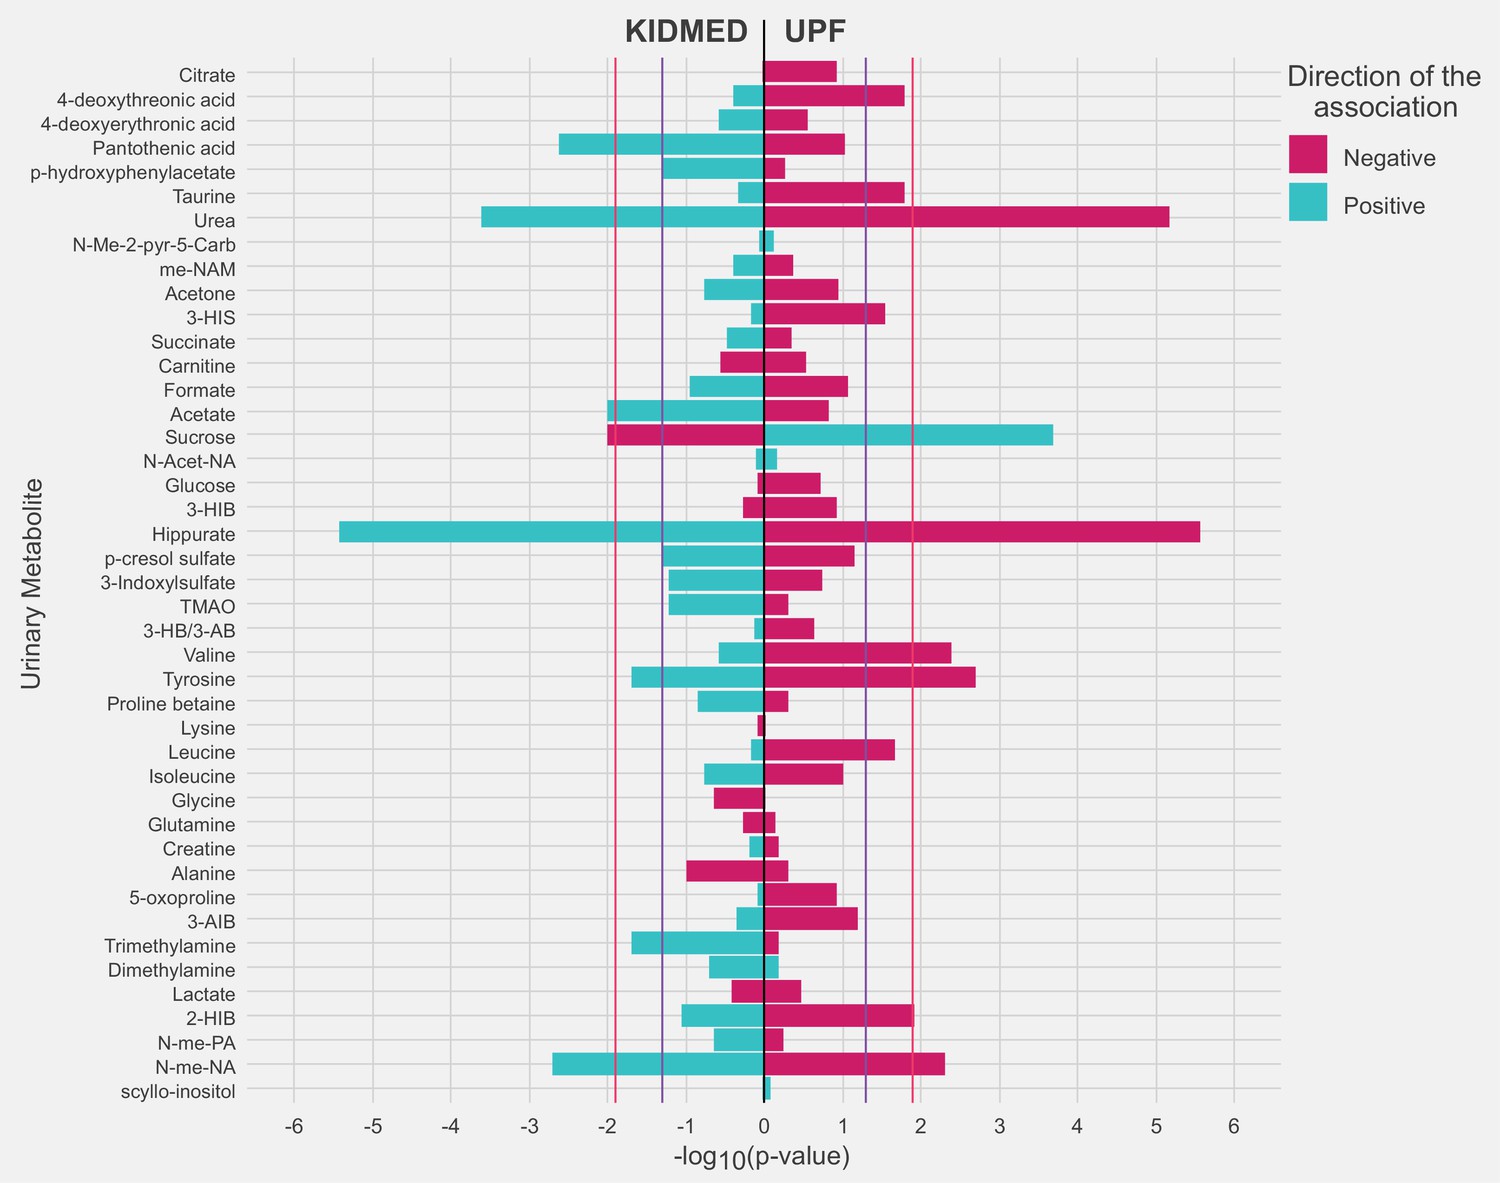
Adjusted associations of the diet quality indicators of interest with urinary metabolites in childhood.
Linear regression models were adjusted for maternal age, maternal education level, maternal prepregnancy body mass index (BMI), family affluence status, child sex, child age, child BMI, child sedentary behavior, child ethnicity, and a cohort indicator. The purple line represents a p value of 0.05. The red line represents an false discovery rate (FDR)-adjusted p value of 0.05. 2-HIB, 2-hydroxyisobutyrate; 3-AIB, 3-aminoisobutyrate; 3-HB/3-AB, 3-hydroxybutyrate/3-aminoisobutyrate; 3-HIB, 3-hydroxyisobutyrate; 3-HIS, 3-hydroxyisovalerate; me-NAM, N1-methyl-nicotinamide; N-Acet-NA, N-acetyl neuraminic acid; N-Me-2-pyr-5-Carb, N-methyl-2-pyridone-5-carboxamide; N-me-NA, N-methylnicotinic acid; N-me-PA, N-methylpicolinic acid; TMAO, trimethylamine N-oxide.
Figure 4

Receiver operating characteristic (ROC) curves reflecting the ability of urinary metabolites of interest in discriminating adherence to diet quality in childhood.
Panel (A) illustrates the ability of urinary metabolites of interest in discriminating high adherence to the Mediterranean diet (KIDMED >4) from low adherence (KIDMED <1). Panel (B) illustrates the ability of urinary metabolites of interest in discriminating high ultra-processed food consumption (UPF ≥29% of total intake) from low consumption (UPF <18% of total daily food intake). ROC curves are based on models across the full study sample, and discriminative power is evaluated based on tenfold cross-validation. The mean area under the receiver operating characteristic curve (AUC) value (SD) across the ten cross-validations of each model is presented in the box. The common panel of four metabolites includes the metabolites associated with both diet quality indicators (hippurate, sucrose, urea, and N-methylnicotinid acid). The panel of six metabolites includes the metabolites associated with each diet quality indicator (common panel of four plus acetate and pantothenic acid for KIDMED, and plus valine and tyrosine for UPF). The panel of sociodemographic factors includes maternal education level, maternal prepregnancy BMI, family affluence score, child sedentary behavior, ethnicity, age, and sex.
Figure 5
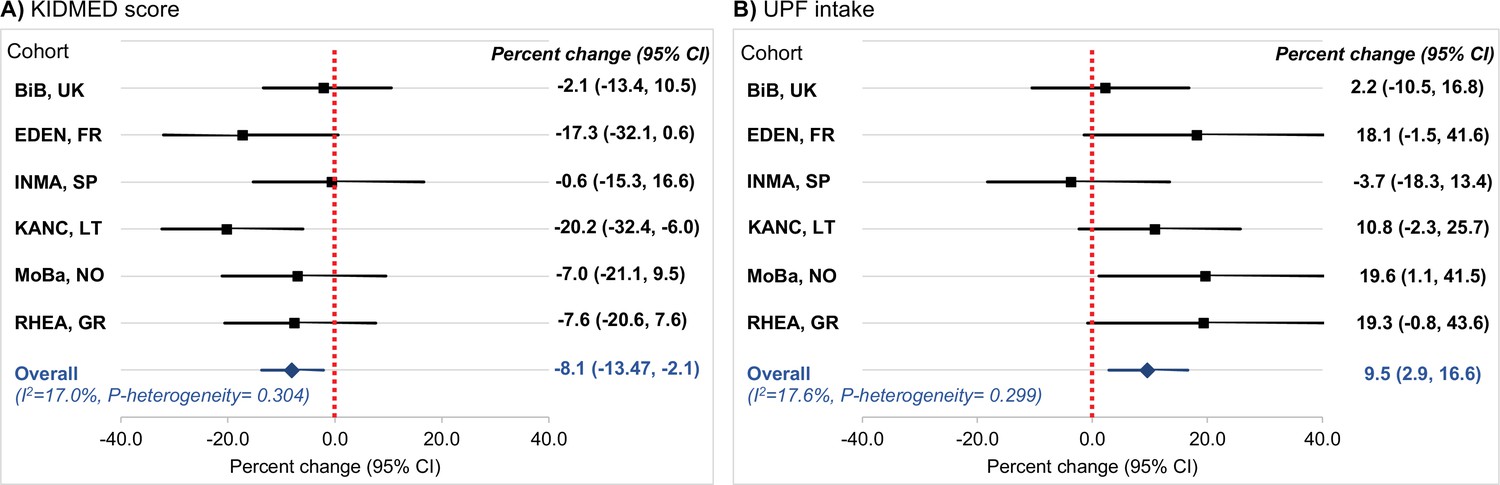
Cohort-specific associations of the diet quality indicators of interest with C-peptide in childhood.
Panel (A) illustrates the associations for adherence to the Mediterranean diet, which was assessed via the KIDMED score (expressed per unit increase). Panel (B) illustrates the associations for ultra-processed food (UPF) intake (expressed per 5% increase of total daily food intake). Beta coefficients (95% confidence intervals, CIs) by cohort were obtained using linear regression models adjusted for maternal age, maternal education level, maternal prepregnancy body mass index (BMI), family affluence status, child sex, child age, child BMI, child sedentary behavior, child ethnicity, and postprandial interval. Combined estimates were obtained by using a fixed-effects meta-analysis. Squares represent the cohort-specific effect estimates; diamond represents the combined estimate; and horizontal lines denote 95% CIs. BiB, Born in Bradford cohort; EDEN, the Étude des Déterminants pré et postnatals du développement et de la santé de l’Enfant study; INMA, INfancia y Medio Ambiente cohort; KANC, Kaunas Cohort; MoBa, Norwegian Mother, Father and Child Cohort Study; RHEA, Rhea Mother Child Cohort study.
Tables
Table 1
Characteristics of the study population.
| Cohort of inclusion, n (%) | |
|---|---|
| BiB, UK | 189 (16.5) |
| EDEN, France | 149 (13) |
| INMA, Spain | 202 (17.6) |
| KANC, Lithuania | 194 (16.9) |
| MoBa, Norway | 221 (19.3) |
| RHEA, Greece | 192 (16.7) |
| Maternal characteristics | |
| Maternal age, mean (SD), years | 30.7 (4.9) |
| Missing, n (%) | 13 (1.1) |
| Prepregnancy BMI, mean (SD), kg/m2 | 25 (5) |
| Missing, n (%) | 21 (1.8) |
| Maternal educational level, n (%) | |
| Low | 157 (13.7) |
| Medium | 391 (34.1) |
| High | 562 (49) |
| Missing, n (%) | 37 (3.2) |
| Child characteristics | |
| Age at assessment, mean (SD), years | 7.9 (1.6) |
| Sex, n (%) | |
| Male | 626 (54.6) |
| Female | 521 (45.4) |
| Ethnicity, n (%) | |
| White European | 1,028 (89.6) |
| Asian | 92 (8) |
| Other | 27 (2.4) |
| Family affluence score, n (%) | |
| Low | 126 (11) |
| Medium | 448 (39.1) |
| High | 569 (49.6) |
| Missing, n (%) | 4 (0.4) |
| BMI, mean (SD), kg/m2 | 16.9 (2.6) |
| Normal weight, n (%)* | 906 (79) |
| Overweight/obese, n (%)* | 237 (20.7) |
| Missing, n (%) | 4 (0.4) |
| KIDMED score, mean (SD) | 2.8 (1.7) |
| Low (<1), n (%) | 104 (9.1) |
| Medium (1–4), n (%) | 848 (73.9) |
| High (>4), n (%) | 195 (17) |
| Ultra-processed food intake, mean (SD), % of daily food intake | 24.2 (8.7) |
-
*
Categories of normal weight and overweight/obese were derived using the International Obesity Taskforce criteria (Cole and Lobstein, 2012).
-
BiB, Born in Bradford cohort; EDEN, the Étude des Déterminants pré et postnatals du développement et de la santé de l’Enfant study; INMA, INfancia y Medio Ambiente cohort; KANC, Kaunas Cohort; KIDMED, Mediterranean Diet Quality Index for children and adolescents; MoBa, Norwegian Mother, Father and Child Cohort Study; RHEA, Rhea Mother Child Cohort study.
Table 2
Adjusted associations of diet quality with C-peptide levels in childhood*.
| C-peptide | |
|---|---|
| Percent change (95% CI) | |
| KIDMED score (per unit increase) | −8.1 (−13.7, −2.2) |
| Low (<1) | Ref. |
| Moderate (1–4) | −27.7 (−49.6, 3.9) |
| High (>4) | −39.0 (−60.6, −5.7) |
| p-Trend | 0.03 |
| UPF intake (per 5% increase of total intake) | 9.3 (2.8, 16.2) |
| Q1 (<18% of total intake) | Ref. |
| Q2 (18% to <23% of total intake) | 24.3 (−6.4, 65.2) |
| Q3 (23% to <29% of total intake) | 38.5 (3.8, 84.9) |
| Q4 (≥29% of total intake) | 46.0 (8.1, 97.3) |
| p-Trend | 0.01 |
-
*
Effect estimates represent percent changes in log-2 transformed C-peptide levels and their 95% CIs derived from linear regression models adjusted for maternal age, maternal education level, maternal prepregnancy BMI, family affluence status, child sex, child age, child BMI, child sedentary behavior, child ethnicity, postprandial interval, and a cohort indicator.
-
KIDMED, Mediterranean Diet Quality Index for children and adolescents; UPF, ultra-processed food.
Additional files
-
Supplementary file 1
Additional results.
(a) KIDMED items, and their scoring, used to assess adherence to the Mediterranean diet in HELIX children. (b) Items included in the FFQ by ultra-processed food (UPF) inclusion and information regarding the extent and purpose of food processing. (c) Intakes of food groups (in servings/week) by categories of the KIDMED score. (d) Intakes of food groups (in servings/week) by quartiles of ultra-processed food intake. (e) Associations of KIDMED score with urinary metabolites in childhood. (f) Associations of ultra-processed food consumption with urinary metabolites in childhood. (g) Regression formulas (scores) for predicting diet quality in childhood based on panels of urinary metabolites. (h) Interaction of diet quality indicators in association to C-peptide concentration in childhood. (i) Associations of diet quality with C-peptide concentration in childhood after stratifying by sex and by weight status, respectively. (j) Associations between urinary metabolites linked to diet quality and C-peptide in childhood.
- https://cdn.elifesciences.org/articles/71332/elife-71332-supp1-v1.docx
-
Transparent reporting form
- https://cdn.elifesciences.org/articles/71332/elife-71332-transrepform1-v1.docx
Download links
A two-part list of links to download the article, or parts of the article, in various formats.
Downloads (link to download the article as PDF)
Open citations (links to open the citations from this article in various online reference manager services)
Cite this article (links to download the citations from this article in formats compatible with various reference manager tools)
Urinary metabolic biomarkers of diet quality in European children are associated with metabolic health
eLife 11:e71332.
https://doi.org/10.7554/eLife.71332


