End-of-life targeted degradation of DAF-2 insulin/IGF-1 receptor promotes longevity free from growth-related pathologies
- Eidgenössische Technische Hochschule Zürich, Department of Health Sciences and Technology, Institute of Translational Medicine, Switzerland
- University of Basel, Faculty of Natural Sciences, Switzerland
- Friedrich Miescher Institute for Biomedical Research, Switzerland
- Institute of Bioorganic Chemistry, Polish Academy of Sciences, Poland
- University of Oslo, Department of Biosciences, Norway
Figures
Figure 1 with 1 supplement
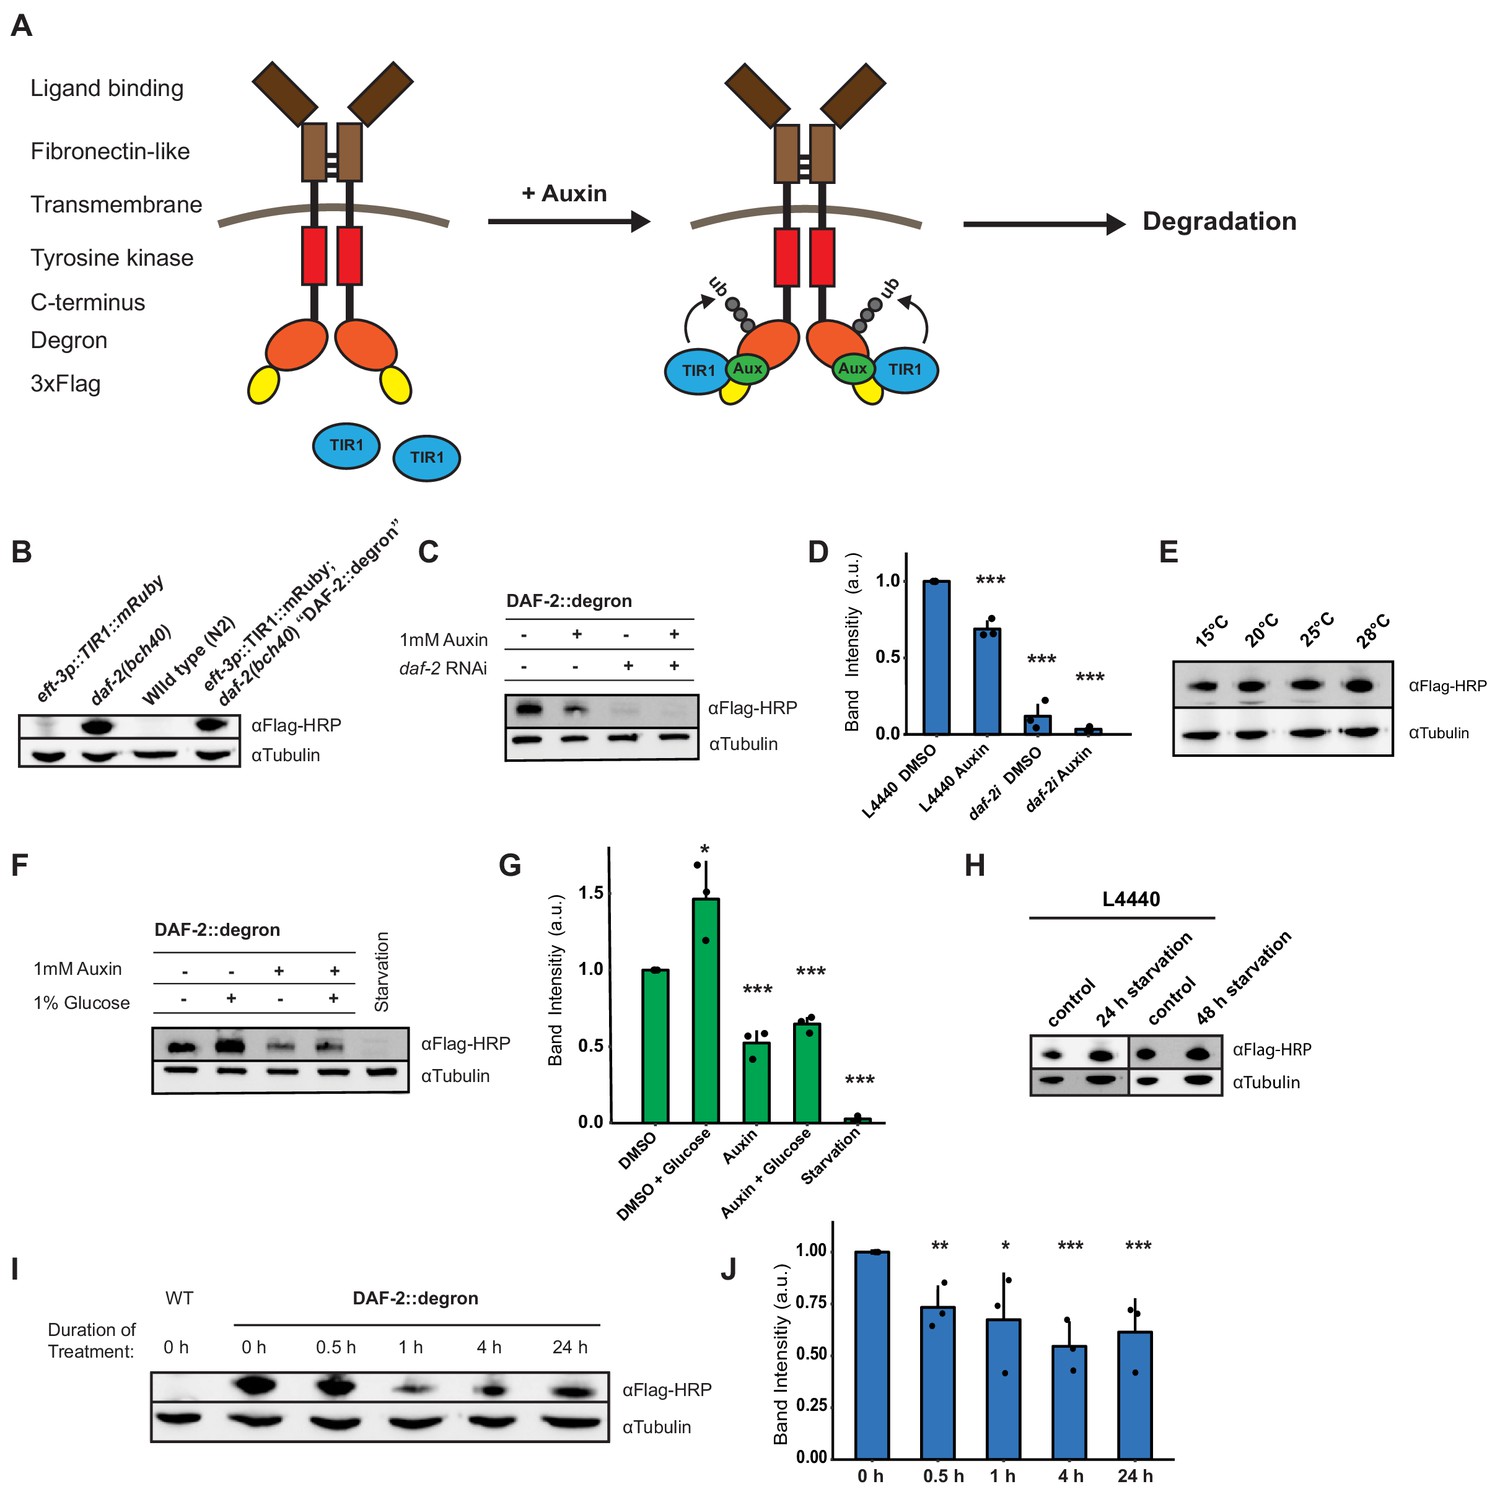
Degron-tagged transmembrane insulin/insulin-like growth factor-1 (IGF-1) receptor DAF-2 is susceptible to auxin-mediated degradation.
(A) Schematic illustration of auxin-inducible degradation (AID)-mediated DAF-2 receptor depletion in daf-2(bch40) Caenorhabditis elegans. (B) Immunoblot of eft-3p::TIR1::mRuby::unc-54 3’UTR, daf-2(bch40), wild type (N2), and DAF-2::degron (eft-3p::TIR1::mRuby::unc-54 3’UTR; daf-2(bch40)). (C) Immunoblot of ‘DAF-2::degron’ animals that were grown on OP50 NGM and at L4 stage shifted to either empty vector control RNAi (L4440) or daf-2(RNAi) plates containing either DMSO or 1 mM auxin. After 48 hr on the second day of adulthood, animals were harvested for western blotting. (D) Densitometric quantification of (C) from n = 3 independent experiments. Error bars represent s.d. Two-sided t-test was used for statistical analysis. *: p < 0.05, **: p < 0.01, ***: p < 0.001. (E) Immunoblot of DAF-2::degron animals showed no decrease of DAF-2 levels at high temperatures. Animals were raised at 15°C and put as L4 for 24 hr at the indicated temperatures. (F) A representative immunoblot of ‘DAF-2::degron’ animals after 1% glucose and 36–48 hr starvation on the second day of adulthood. L4 DAF-2::degron animals were either placed on OP50 NGM plates with or without 1 mM auxin, or containing 1% glucose, or on empty (no bacteria) NGM plates. Animals were harvested 36–48 hr later. (G) Densitometric quantification of (F) from n = 3 independent experiments. Error bars represent s.d. Two-sided t-test was used for statistical analysis. *: p < 0.05, **: p < 0.01, ***: p < 0.001. (H) Immunoblot analysis of starved DAF-2::degron animals. Animals were raised on OP50 NGM at 20°C and shifted from L4 to L4440 containing FUdR. After 2 days, they were washed off, and either frozen as control or put on empty plates and harvested after 24 or 48 hr, respectively. (I) Immunoblot analysis of 1-day-old adult DAF-2::degron animals treated with 1 mM auxin for the indicated time periods. (J) Quantification of (I) from n = 3 independent experiments. Error bars represent s.d. One-sided t-test was used for statistical analysis. *: p < 0.05, **: p < 0.01, ***: p < 0.001. For (B–J), see Source data 1 and Source data 2 for raw data, full blots, and statistics.
Figure 1—figure supplement 1

Degron-tagged DAF-2 is functional and susceptible to auxin-mediated degradation.
(A) Schematic illustration of the daf-2 locus of daf-2(bch40 [daf-2::degron::3xFLAG::STOP::SL2::SV40::degron::wrmScarlet::egl-13NLS]) animals. Expression of the operon was not observed. Either it is not functional, or the levels are too low to be detected by confocal microscopy. (B) PCR of wild type (N2) and daf-2(bch40). Primer pair RV96 and RV97 span the 3’ of the insert, RV94 and RV99 span the 5’ of the insert, and RV94 and RV95 span the end of the gene of the wild type. The PCR product of RV96 and RV97 and RV94 and RV99 have been sequenced to verify the construct’s correct insertion. (C) Comparison of progeny number of wild type (N2) and DAF-2::degron from n = 3 independent experiments. Error bar represents s.d. (D) Comparison of the developmental speed of wild type (N2) and DAF-2::degron from n = 3 independent experiments. A timed egg lay for 2 hr was used for synchronization. After 4 days at 20°C, the developmental stages were scored. Error bar represents s.d. (E) Immunoblot analysis of DAF-2::degron and DAF-2::degron; germline TIR1 (eft-3p::TIR1::mRuby::unc-54 3’UTR; daf-2(bch40); sun-1p::TIR1::mRuby::sun-1 3'UTR) on DMSO and 1 mM auxin. The numbers below indicate values normalized to the respective control on DMSO. For (C–E), see Source data 1 and Source data 2 for raw data and statistics.
Figure 2 with 2 supplements
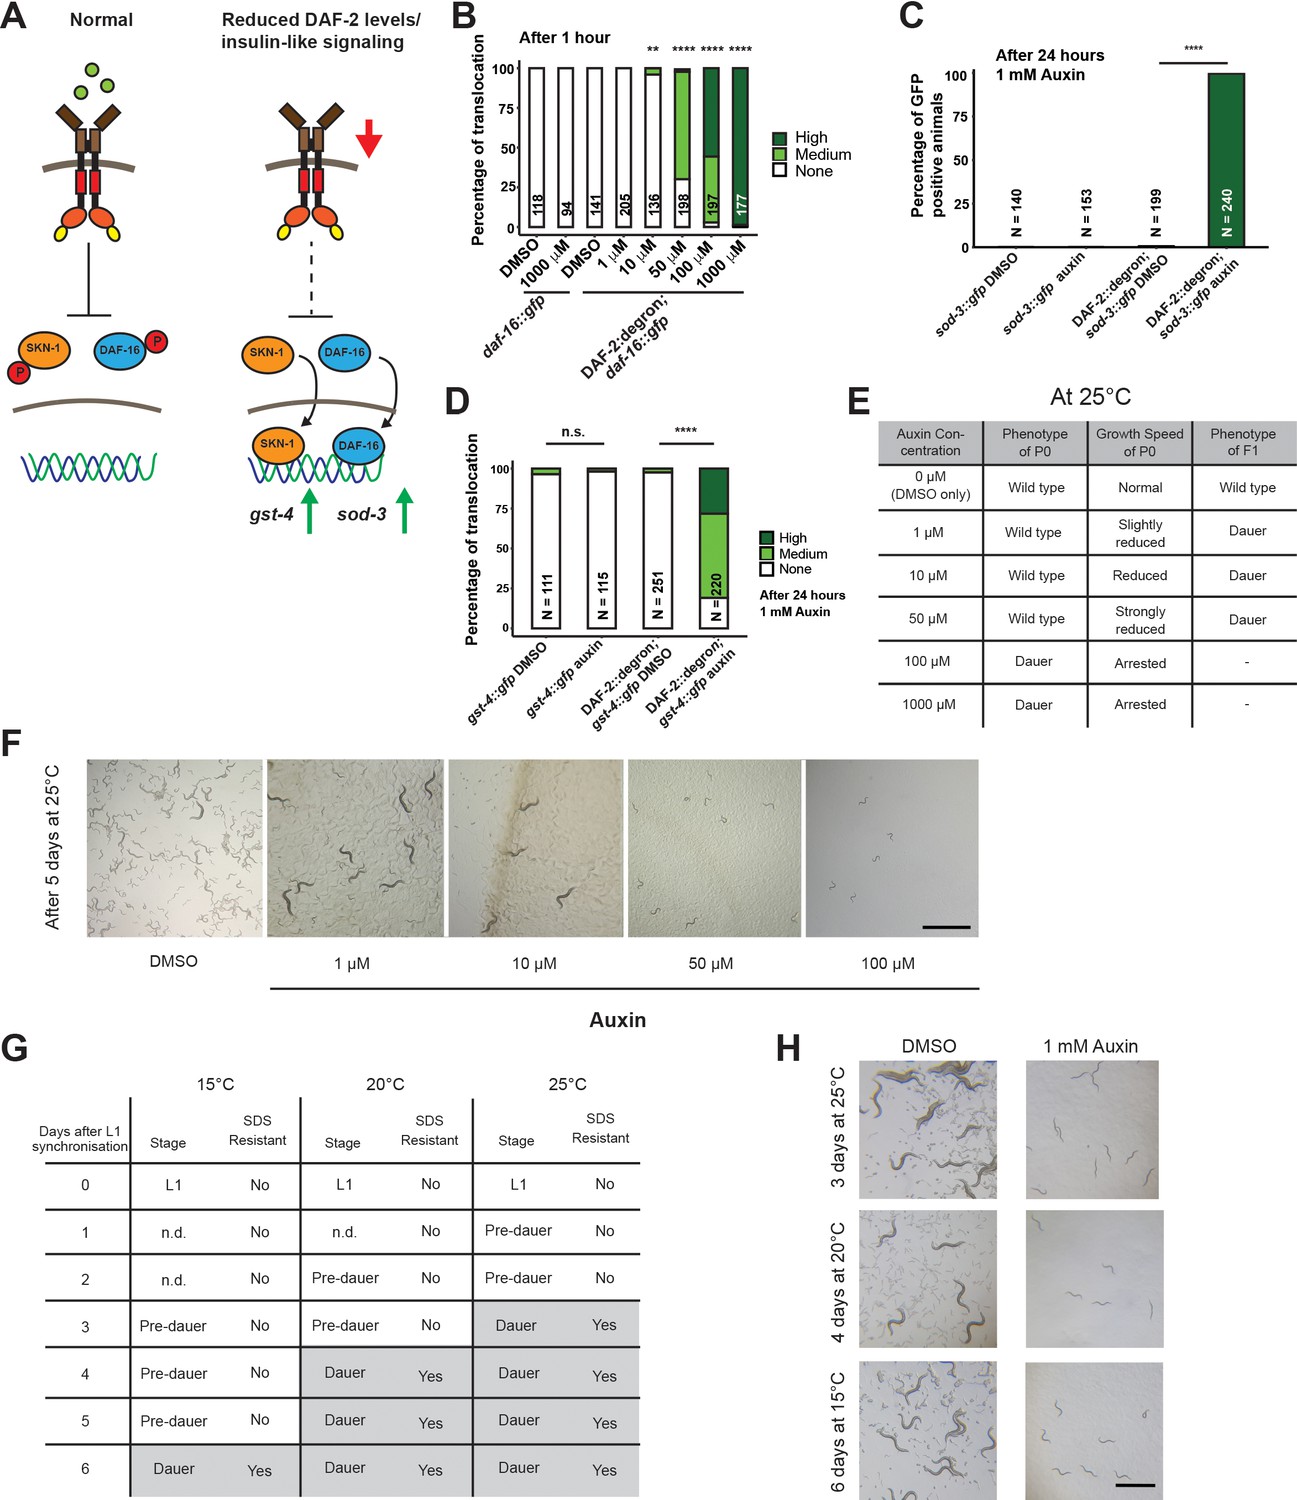
Inactivation of DAF-2::degron by the auxin-inducible degradation (AID) upregulated downstream reporters and caused dauer entry at any temperature.
(A) A schematic illustration of the DAF-2 signaling pathway. DAF-2 phosphorylates the transcription factors DAF-16 and SKN-1 through a cascade of kinases and sequesters them to the cytosol. Lower DAF-2 levels or activity leads to de-phosphorylation and translocation of DAF-16 and SKN-1 to the nucleus and expression of target genes like sod-3 and gst-4, respectively. (B) One hour exposure to auxin led to nuclear translocation of DAF-16::GFP in a concentration-dependent manner in DAF-2::degron; daf-16::gfp animals, but not in daf-16::gfp at the L4 stage. n > 94 from two (for daf-16::gfp) or three (for DAF-2::degron; daf-16::gfp) independent experiments. **: p < 0.01, ****: p < 0.0001. (C) Exposure to 1 mM auxin activates the reporter sod-3::GFP in DAF-2::degron; sod-3::gfp but not in animals that carry sod-3::gfp alone. L4 animals were exposed to 1 mM auxin or DMSO for 24 hr and GFP levels were scored (i.e., at day 1 of adulthood). n > 140 from two (for sod-3::gfp) or four (for DAF-2::degron; sod-3::gfp) independent experiments. ****: p < 0.0001. (D) Exposure to 1 mM auxin activates the reporter gst-4::GFP in DAF-2::degron; gst-4::gfp but not in animals that carry gst-4::gfp alone. L4 animals were exposed to 1 mM auxin or DMSO for 24 hr and GFP levels were scored (i.e., at day 1 of adulthood). n > 111 from two (for gst-4::gfp) or four (for DAF-2::degron; gst-4::gfp) independent experiments. ****: p < 0.0001. (E) Auxin treatment of DAF-2::degron affected development. Synchronized L1 put at low concentrations (1–50 μM auxin) shows reduced growth speed, and their offspring enters dauer. At high concentrations (100 and 1000 μM), the L1 animals arrest and enter the dauer stage after a few days. (F) Representative pictures of growth impairment caused by auxin-mediated degradation of DAF-2 in DAF-2::degron animals at different concentrations. Bar = 1 mm. (G) Dauer entry of DAF-2::degron animals at 1 mM auxin was temperature-independent, but the time needed for dauer entry is temporally scaled. To distinguish dauer animals from pre-dauer animals, they were treated for 15 min with 1% SDS. Only dauer animals survived SDS treatment. (H) Microscope pictures of DAF-2::degron animals after dauer entry (right column) and control animals (left column) kept for the same time at 15°C, 20°C, and 25°C. Control animals were on their second day of adulthood when the auxin-treated counterparts entered the dauer stage. Bar = 1 mm. For (B–D), see Source data 1 for raw data and statistics.
Figure 2—figure supplement 1
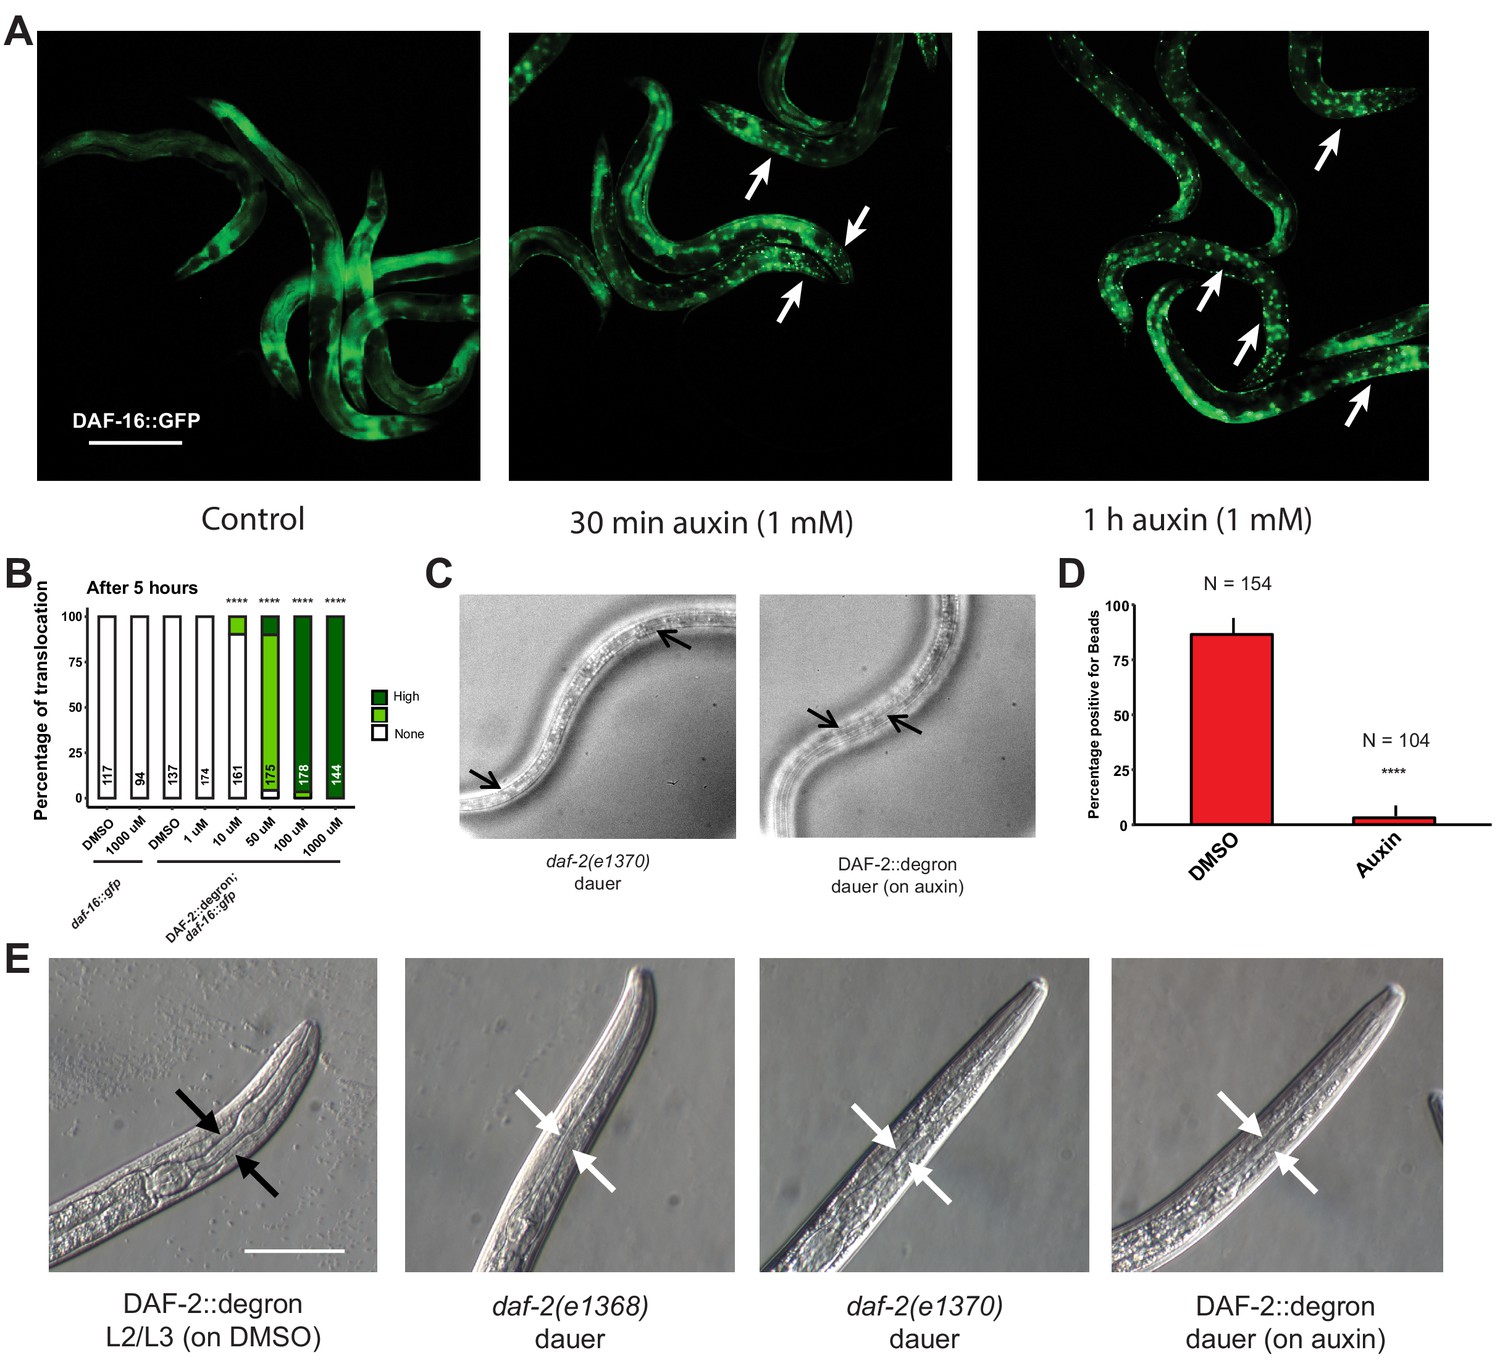
Inactivation of DAF-2::degron by the auxin-inducible degradation (AID) upregulated downstream reporters and caused dauer entry at any temperature.
(A) The nuclear translocation of DAF-16::GFP in DAF-2::degron; daf-16::gfp animals shown after 30 min or 1 hr of 1 mM auxin treatment. Bar = 100 µm. (B) Five-hour exposure to auxin led to further nuclear translocation of DAF-16::GFP in a concentration-dependent manner in DAF-2::degron; daf-16::gfp, but not in daf-16::gfp. n > 94 from two (for daf-16::gfp) or three (for DAF-2::degron; daf-16::gfp) independent experiments. ****: p < 0.0001. (C) Dauer alae of daf-2(e1370) and DAF-2::degron animals. Arrows indicate dauer alae-specific prongs. Bar = 100 μm. (D) Percentages of animals carrying red fluorescent beads in the intestine. n > 100 animals from three independent experiments. Error bar represents s.d. ****: p < 0.0001. (E) Images of control and dauer pharynxes. The pharynxes of DAF-2::degron animals on auxin were indistinguishable from other daf-2 mutant dauers. Black arrows indicate wild-type pharynx, and white arrows indicate dauer-typical pharynx constriction. Bar = 50 μm. For (A, D), see Source data 1 for raw data and statistics.
Figure 2—figure supplement 2
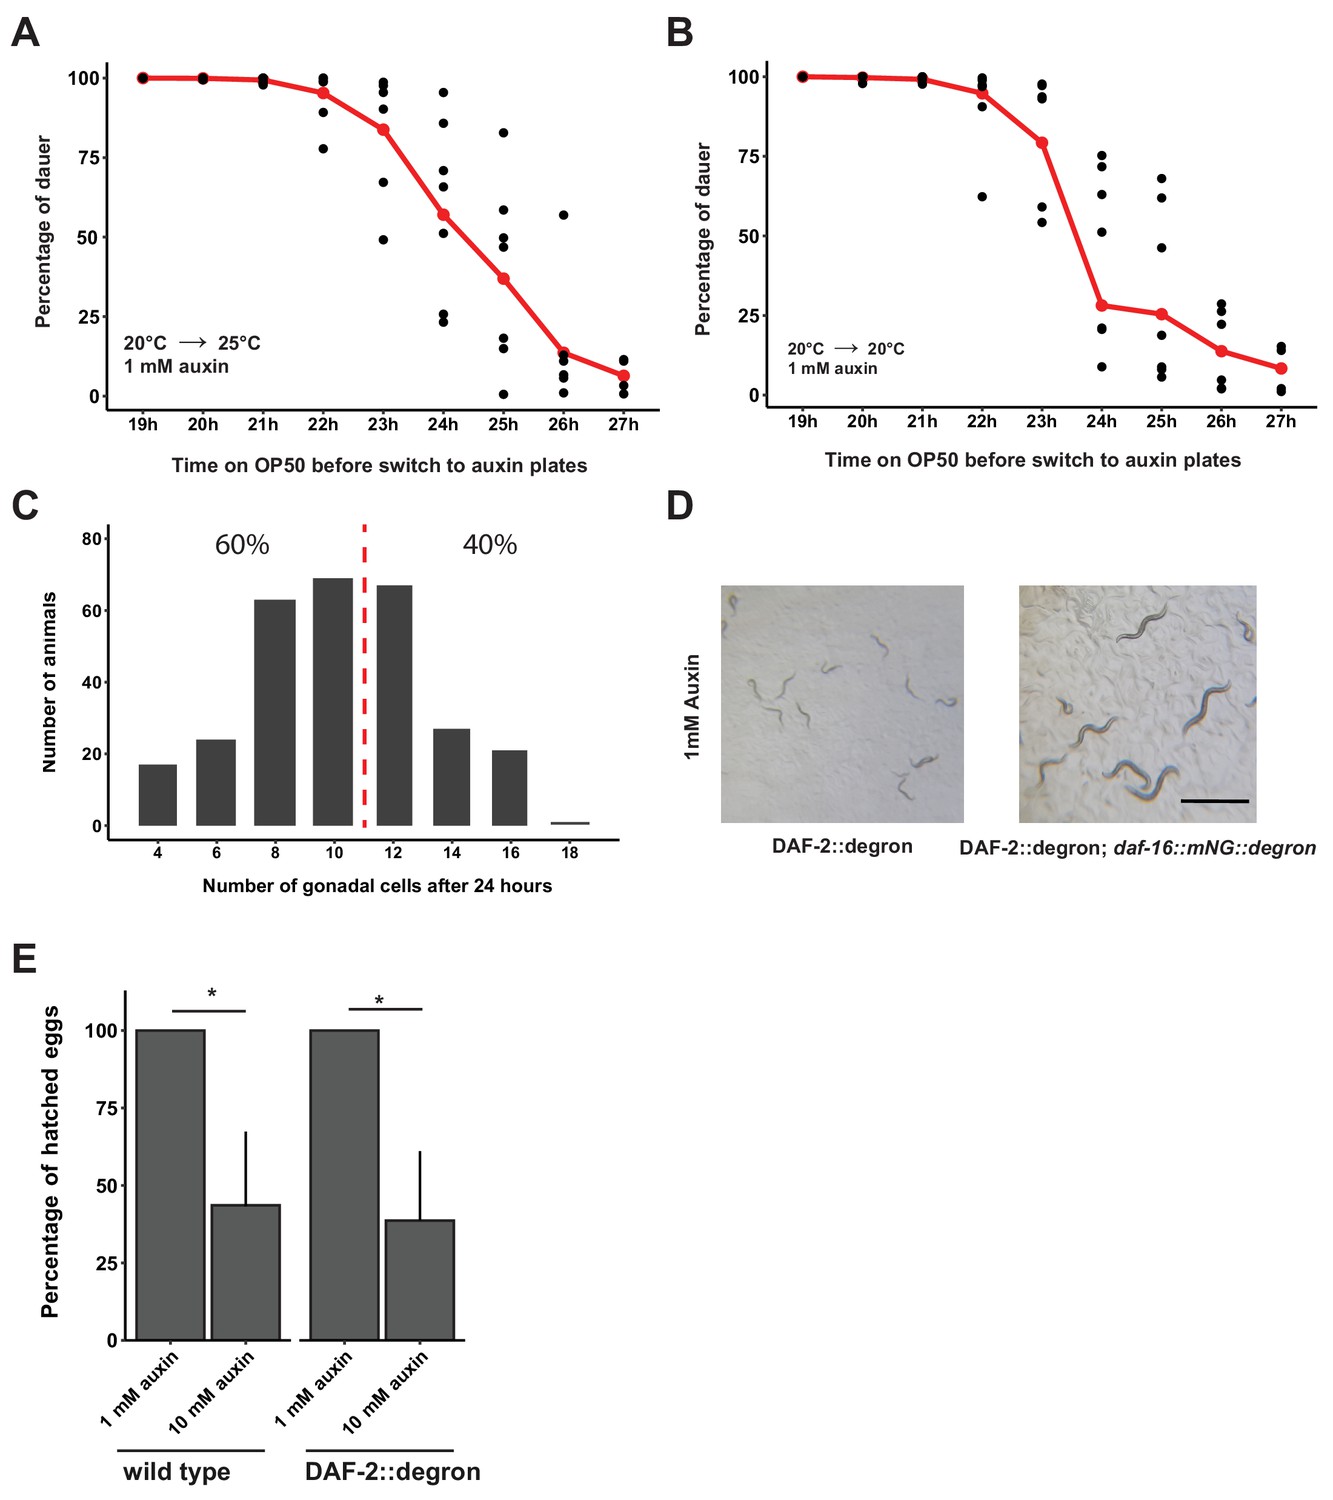
Depletion of DAF-2::degron at mid-L1 promoted daf-16-dependent dauer entry.
(A) Determination of the decision time point between dauer entry or continuation of normal development of DAF-2::degron animals at 25°C. The animals were synchronized for 2 days in M9 at 20°C, then put onto NGM OP50 plates at 20°C. Next, DAF-2::degron animals were put on plates supplemented with auxin after the indicated time on the x-axis and shifted to 25°C. The ratio of dauers and adult animals was determined 2 days later. Each time point was repeated four to seven times with n = 976–2022. The red line shows the average, black dots indicate single measurements. (B) Determination of the decision time point between dauer entry or continuation of normal development of DAF-2::degron animals at 25°C. The animals were synchronized for 2 days in M9 at 20°C, then put onto NGM OP50 plates at 20°C. Next, DAF-2::degron animals were put on plates supplemented with auxin after the indicated time on the x-axis and shifted to 20°C. The ratio of dauers and adult animals was determined 3 days later. Each time point was repeated four to seven times with n = 735–1791. The red line shows the average, black dots indicate single measurements. Note that dauers at 20°C tend to crawl off the plate, the graph is only an approximation, and there are likely more dauers on the plate. (C) Gonadal cell count of L1 animals after 24–25 hr on OP50. The dotted red line divides a younger population that enters dauer and an older population that continues development. The percentages indicate two arbitrarily divided groups with few and many gonadal cells to match the observation in panel A that approximately 50% of the animals continue development at 24–25 hr. The experiment was repeated five times with n = 289. (D) Simultaneous knockdown of degron-tagged DAF-16 in DAF-2::degron; daf-16::mNG::degron led to fertile adults. Bar = 2 μm. (E) 10 mM auxin causes embryonic lethality. The same amount of egg suspension was put on plates, and the number of offspring was counted several days later. This experiment was repeated four times for DAF-2::degron and two times for wild type. Error bar represents s.d. *: p < 0.05. For (A–C, E), see Source data 1 for raw data and statistics.
Figure 3 with 2 supplements
Depletion of DAF-2::degron resulted in daf-2 class II mutant phenotypes at 15°C.
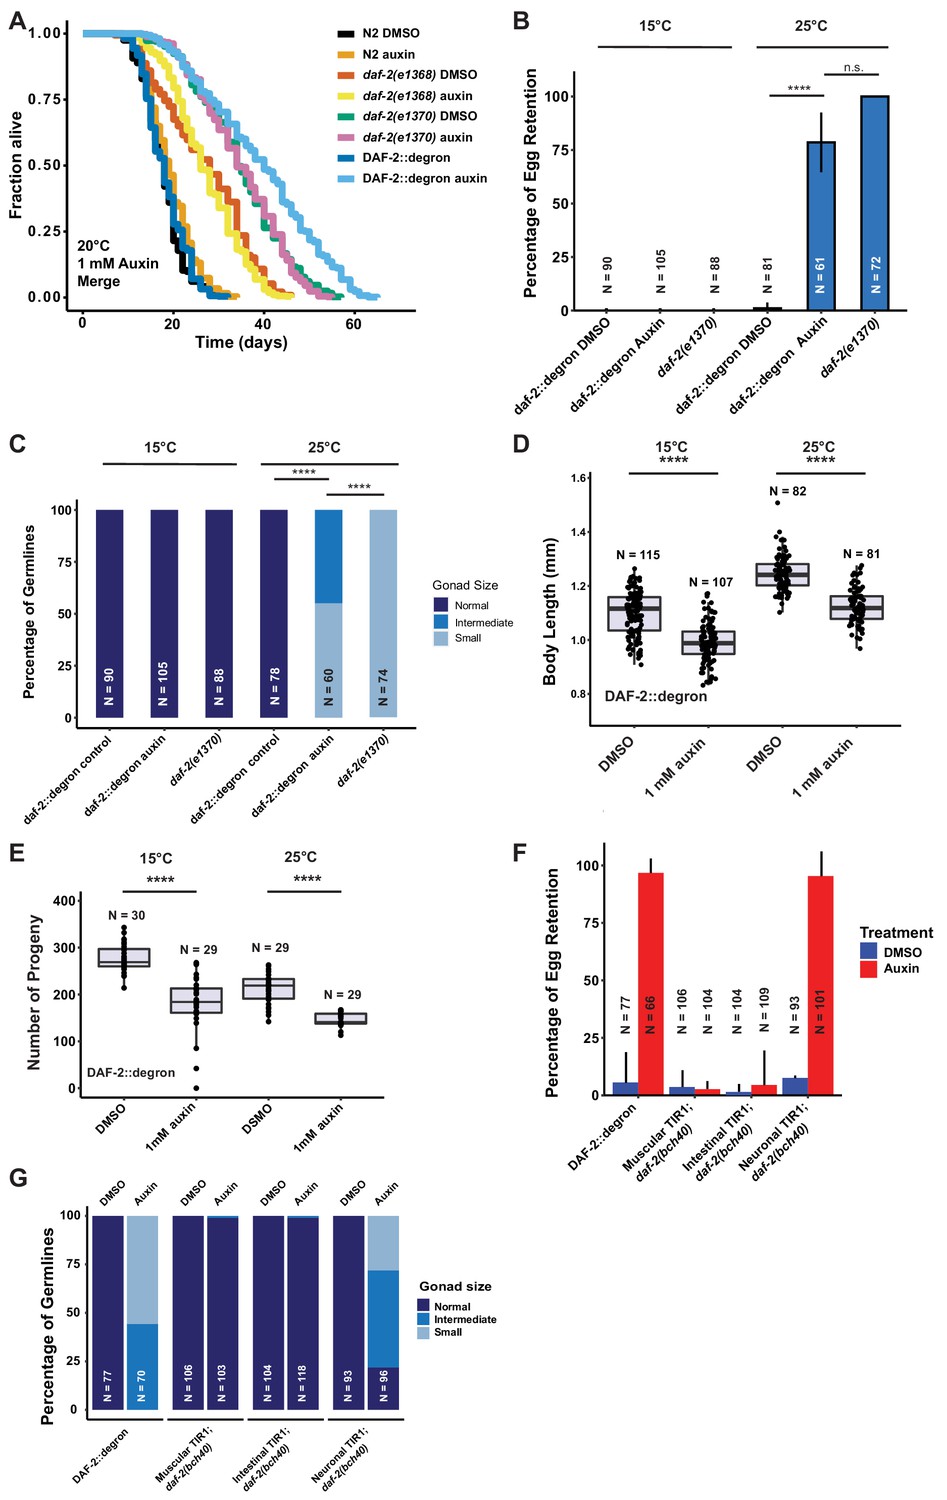
(A) Auxin treatment extended the lifespan of DAF-2::degron animals. Animals were shifted as L4 to plates containing DMSO or 1 mM auxin at 20°C. (B) 1 mM auxin treatment leads to the ‘dauer-like’ egg retention phenotype in DAF-2::degron animals. The animals were raised at 15°C, then shifted as L4 to 25°C or kept at 15°C. Two days later at 25°C and 3 days later at 15°C, they were examined for egg retention. The experiment was performed three independent times. Error bar represents s.d. ****: p < 0.0001. (C) Gonads were shrunk after 1 mM auxin treatment in DAF-2::degron animals. Animals were raised at 15°C and shifted as L4 to 25°C or kept at 15°C. Two days later at 25°C and 3 days later at 15°C, the animals were checked for gonad size. The experiment was performed three independent times. ****: p < 0.0001. (D) 1 mM auxin treatment decreased the body size of DAF-2::degron animals at 15°C and 25°C. Animals were raised at 15°C and shifted to 1 mM auxin or DMSO plates at the L4 stage. The experiment was performed three independent times. ****: p < 0.0001. (E) 1 mM auxin treatment of DAF-2::degron resulted in a smaller brood size at 15°C and 25°C. Animals were shifted to 1 mM auxin or DMSO plates at the L4 stage and either kept at 15°C or moved to 25°C. The experiment was performed three independent times. ****: p < 0.0001. (F) Tissue-specific depletion of DAF-2 in neurons caused egg retention phenotype. Animals were raised at 15°C and shifted from L4 to 25°C. Two days later, the animals were checked for egg retention. The experiment was performed three independent times. Error bar represents s.d. ****: p < 0.0001. (G) Gonads were shrunk after neuronal depletion of DAF-2. Animals were raised at 15°C and shifted from L4 to 25°C. Two days later, the animals were checked for gonad size. The experiment was performed three independent times. ****: p < 0.0001. For (A–G), see Source data 1 for raw data and Supplementary file 1 for statistics and additional trials.
Figure 3—figure supplement 1

Depletion of DAF-2::degron resulted in daf-2 class II mutant phenotypes at 15°C.
(A) Representative images of the egg retention phenotype. The left image is DAF-2::degron treated with DMSO. Right image is daf-2(e1370). The asterisk indicates eggs that were retained in the germline. Bar = 100 μm. (B) Representative image of the different levels of germline sizes. Top image DAF-2::degron with DMSO. Middle image DAF-2::degron treated with 1 mM auxin. Bottom image is daf-2(e1370). Bar = 100 μm. (C) daf-2(e1370) mutants have reduced body size at 25°C. The experiment was performed three independent times. ****: p < 0.0001. (D) Auxin did not affect body size in wild type (N2). The experiment was performed three independent times. (E) Depletion of intestinal or neuronal DAF-2::degron did not reduce body size. The experiment was performed independently twice. ****: p < 0.0001. For (C–E), see Source data 1 for raw data and statistics.
Figure 3—figure supplement 2
Oxidative resistance and tissue-specific effects after DAF-2 depletion.
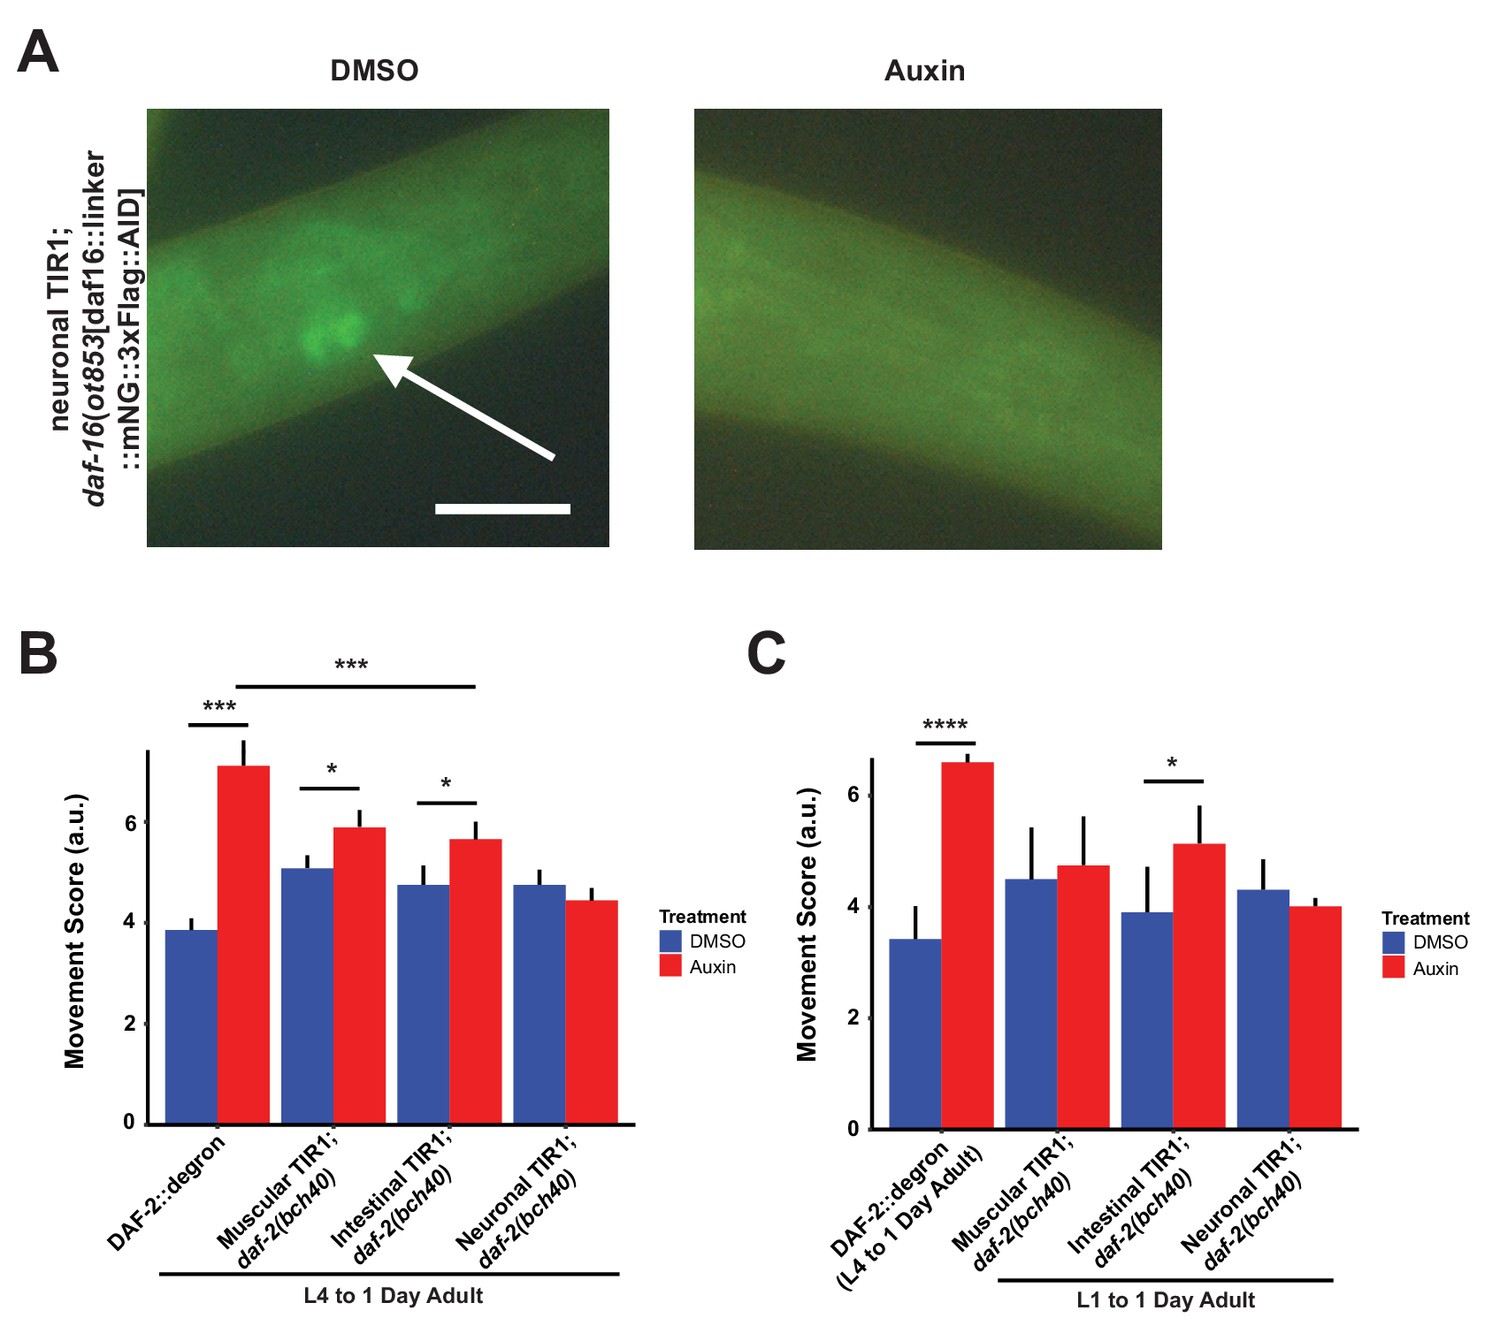
(A) daf-16(ot853 [daf16::mNeonGreen::3xFLAG::AID]) was degraded by neuronally expressed TIR1 upon auxin supplementation. Arrow indicates neuronally expressed mNeonGreen- and degron-tagged DAF-16. Animals were put for 24 hr on plates with DMSO or 1 mM auxin, respectively. Bar = 20 μm. (B) Quantification of 1 mM auxin treatment from L4 to first day of adulthood enhanced the arsenite-induced oxidative stress resistance in DAF-2::degron, muscular TIR1; daf-2(bch40), and intestinal TIR1;daf-2(bch40). The experiment was performed four independent times (except three times for DAF-2::degron). Error bar represents s.d. *: p < 0.05, ***: p < 0.001. (C) Quantification of 1 mM auxin treatment from L1 to the first day of adulthood enhanced the arsenite-induced oxidative stress resistance in muscular TIR1; daf-2(bch40) and intestinal TIR1; daf-2(bch40). DAF-2::degron was treated from L4 to the first day of adulthood to bypass dauer entry. The experiment was performed three independent times. Error bar represents s.d. *: p < 0.05, ****: p < 0.0001. For (B–C), see Source data 1 and Source data 3 for raw data, statistics, and additional trials.
Figure 4
Tissue-specific effects after DAF-2 depletion on lifespan extension and reactive oxygen species resistance.
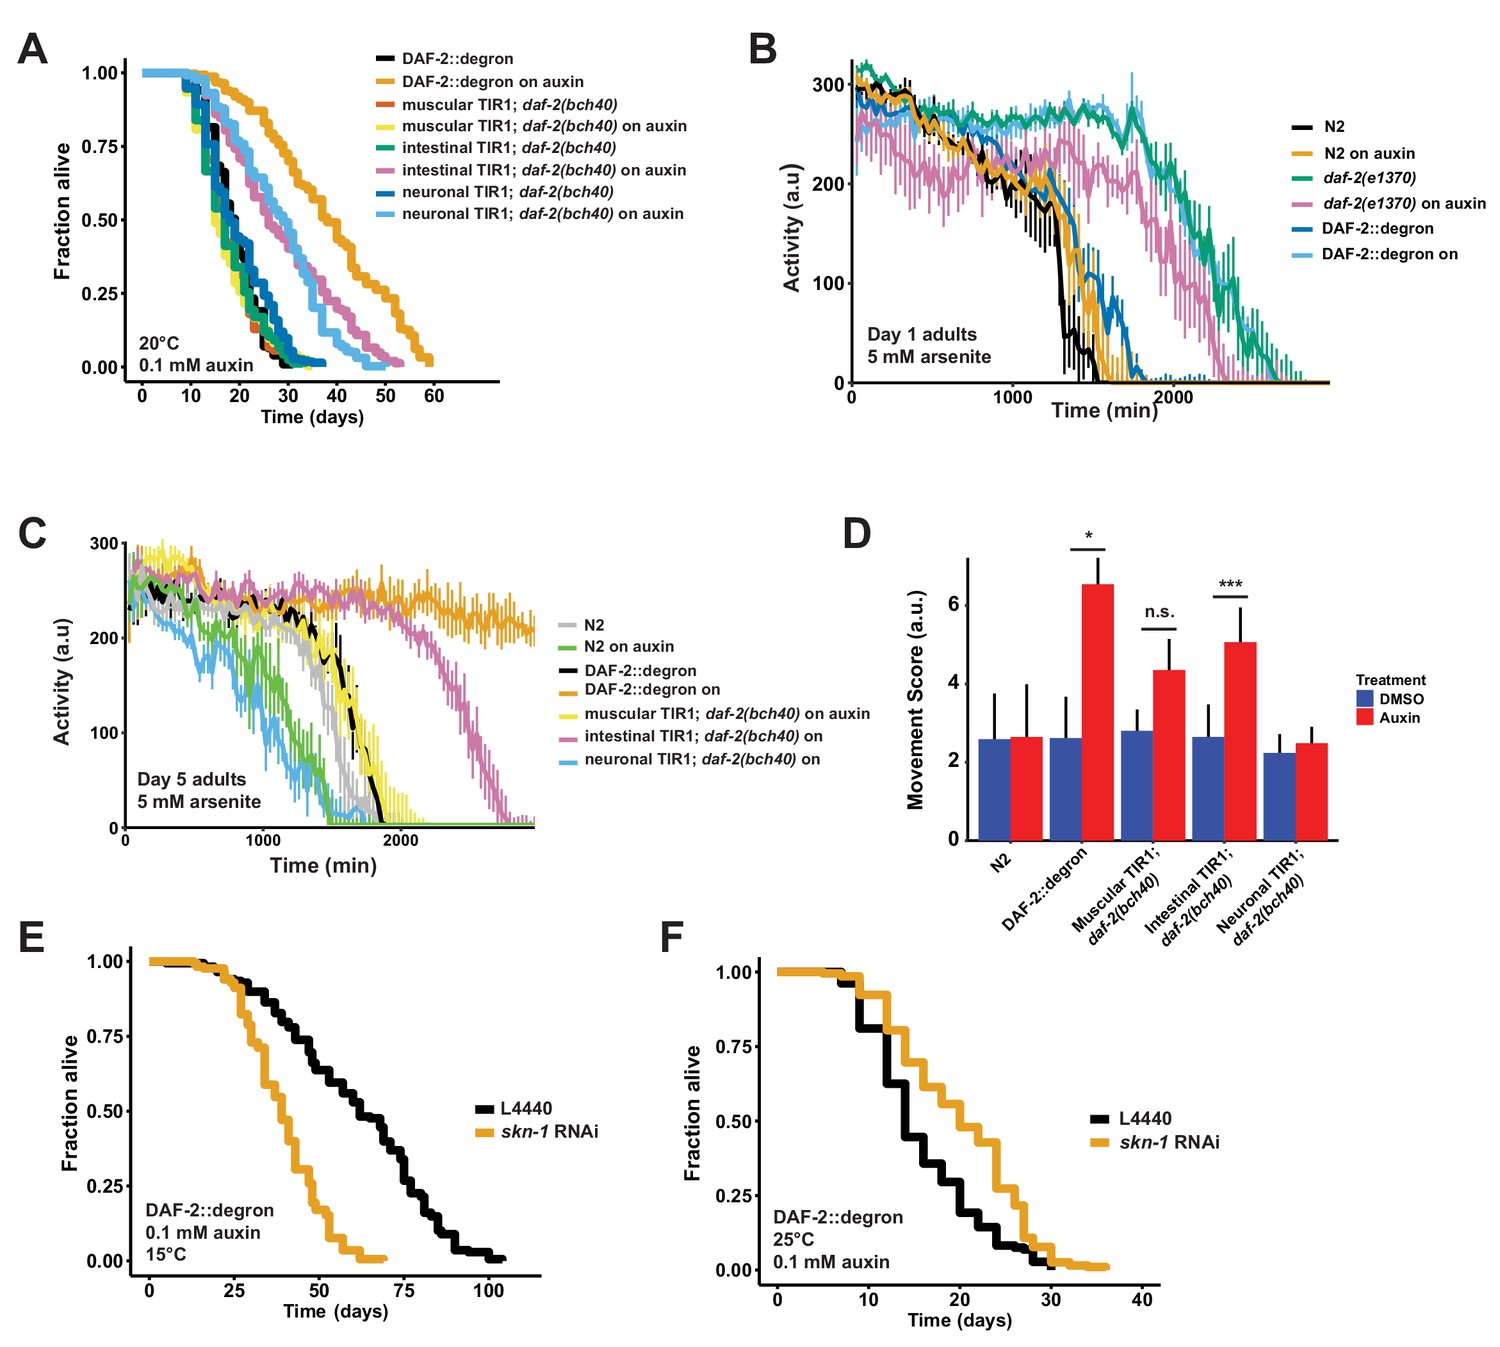
(A) Auxin treatment extended lifespan in aged DAF-2::degron animals. Animals were shifted from DMSO plates to plates containing 1 mM auxin on the indicated day. (B) Auxin-mediated depletion of DAF-2 enhanced oxidative stress resistance to a similar extent as daf-2(e1370) animals. Animals were shifted as L4 for 24 hr on plates containing DMSO or 1 mM auxin at 20°C. (C) Intestinal knockdown of DAF-2 enhanced oxidative stress resistance. Animals were shifted to DMSO or 1 mM auxin plates at the L4 stage and kept until day 5 of adulthood at 20°C. (D) Quantification of (C) from three independently performed experiments. Error bar represents s.d. *: p < 0.05, ***: p < 0.001. (E) skn-1 was necessary for full lifespan extension in DAF-2 depleted animals at 15°C. Animals were kept on 1 mM auxin. p < 0.0001. (F) Knockdown of skn-1 extended the mean lifespan of DAF-2 depleted animals at 25°C. Animals were raised at 15°C and shifted to 1 mM auxin at 25°C. p < 0.0001. For (A–F), see Source data 1 and Source data 3 for raw data and Supplementary file 1 for statistics and additional trials.
Figure 5
Late-life DAF-2 depletion extended lifespan.
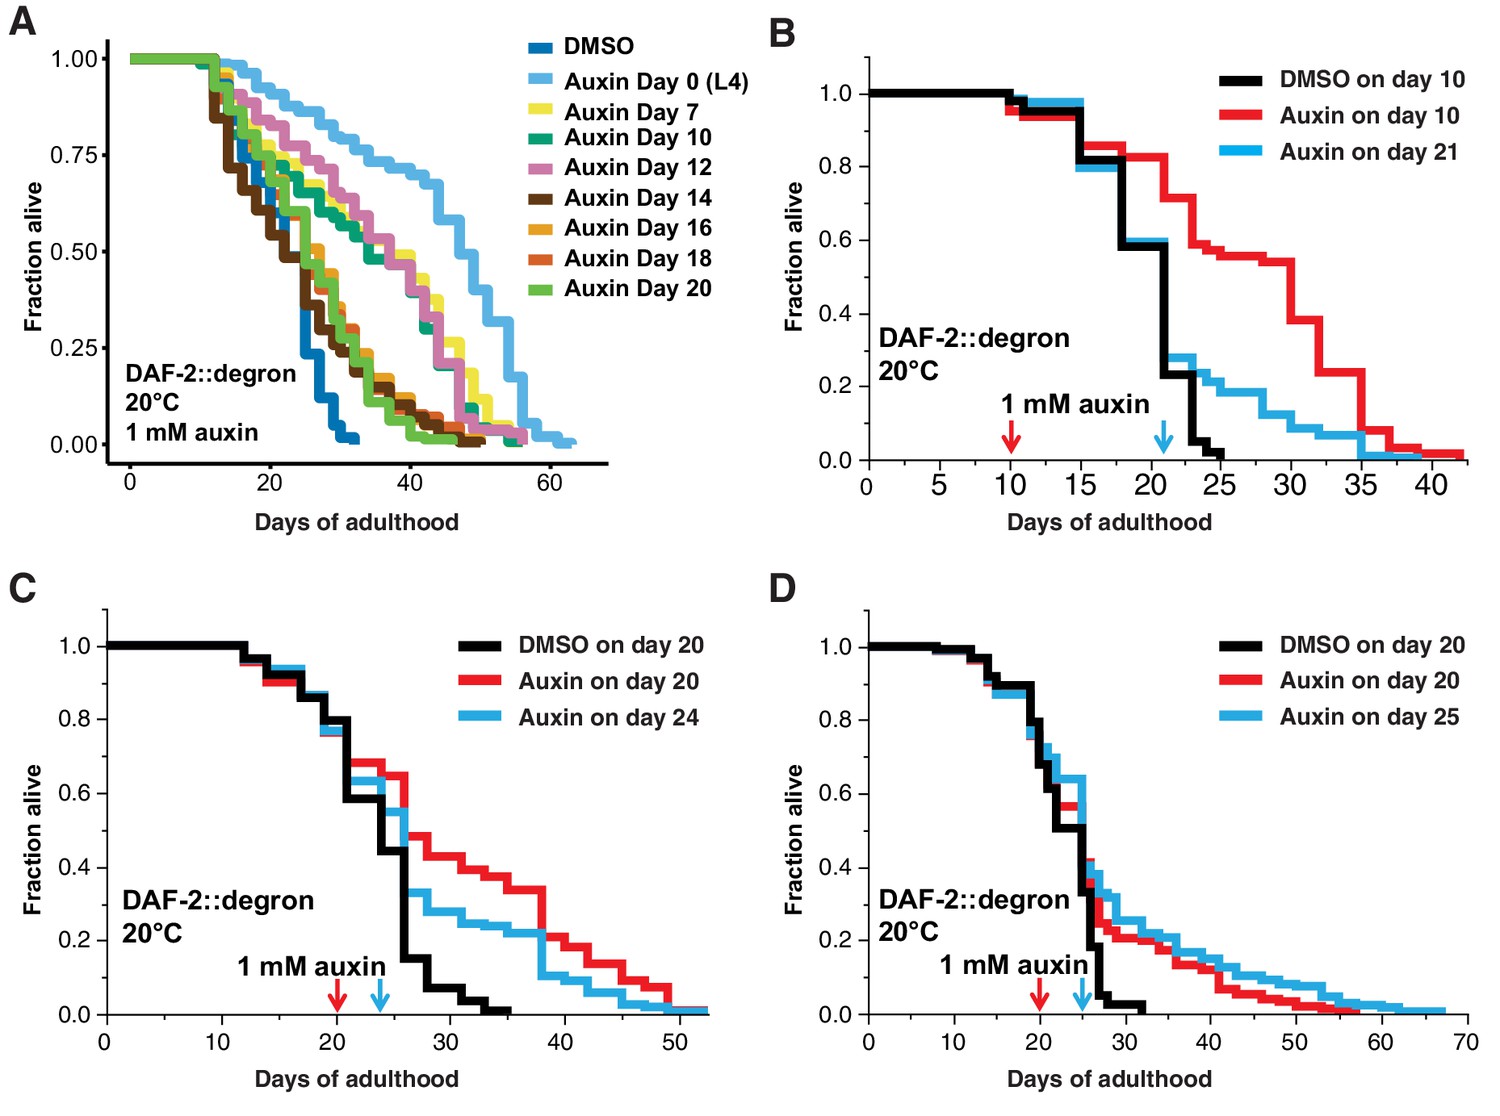
(A) Auxin treatment extended lifespan in aged DAF-2::degron animals. Animals were shifted from DMSO plates to plates containing 1 mM auxin on the indicated day. (B–D) Top-coating of plates with auxin to a final concentration of 1 mM, at the indicated days, extended the lifespan of DAF-2::degron animals during aging. For (A–D), see Supplementary file 1 and Source data 1 for raw data, statistics, and additional independent trials.
Videos
Video 1
Video of DAF-2::degron animals treated with 1 mM auxin at day 7 of adulthood at 25°C.
The number corresponds to the different culturing lifespan plates.
Additional files
-
Supplementary file 1
Lifespans of degron-tagged DAF-2.
Trials that were performed in parallel are grouped together. (N) = number of animals observed; lifespan was measured from the L4 stage (see Materials and methods for details). Animals that left the plates, buried into the agar, bagged, or exploded were censored. L4440 empty vector was otherwise used as the control. The trial number is usually the starting date of the lifespan. All treatments were performed either starting from L4 or during adulthood, with DMSO and pL4440 empty vector plates used for rapamycin and RNAi controls, respectively. p-Values were obtained by the log-rank.
- https://cdn.elifesciences.org/articles/71335/elife-71335-supp1-v2.docx
-
Supplementary file 2
Auxin-inducible degradation (AID) DAF-2 phenotypes in comparison to daf-2 mutant phenotypes.
Our observed phenotypes loss or reduction of function with AID DAF-2::degron compared to literature reported phenotypes using daf-2 mutants or daf-2(RNAi). Studies are cited by using PMIDs.
- https://cdn.elifesciences.org/articles/71335/elife-71335-supp2-v2.xlsx
-
Supplementary file 3
Detailed strain list, primer, RNAi clone, and genomic sequences.
Detailed Caenorhabditis elegans strain list with detailed genotype information. Sequencing results of RNAi clones used in this study. Primer sequences and sequencing results verifying genotypes or proper CRISPR editing.
- https://cdn.elifesciences.org/articles/71335/elife-71335-supp3-v2.xlsx
-
Transparent reporting form
- https://cdn.elifesciences.org/articles/71335/elife-71335-transrepform1-v2.pdf
-
Source data 1
All raw numbers, quantifications, and statistics.
Each tab corresponds to a figure or multiple figure panels as indicated. Provided are the raw values for making the graphs, the quantifications, and statistics.
- https://cdn.elifesciences.org/articles/71335/elife-71335-supp4-v2.xlsx
-
Source data 2
Original uncropped western blots.
(A-I) Original uncropped western blots. The numbers next to the blot correspond to the trial date. (A–I)* Fully labeled original uncropped western blots. The numbers next to the blot correspond to the trial date. Each relevant band is labeled with the Caenorhabditis elegans strains and treatment conditions. The light blue dotted line corresponds to the cropped area. Additional information about the experimental conditions or to which figure or quantification the blot corresponds is indicated below the blot.
- https://cdn.elifesciences.org/articles/71335/elife-71335-supp5-v2.pdf
-
Source data 3
Oxidative stress assays.
Additional repeats and different experimental settings (indicated on the left of each row) for the oxidative stress assays using 5 mM sodium arsenite. Raw data and statistics are in Source data 1.
- https://cdn.elifesciences.org/articles/71335/elife-71335-supp6-v2.pdf
Download links
A two-part list of links to download the article, or parts of the article, in various formats.
Downloads (link to download the article as PDF)
Open citations (links to open the citations from this article in various online reference manager services)
Cite this article (links to download the citations from this article in formats compatible with various reference manager tools)
End-of-life targeted degradation of DAF-2 insulin/IGF-1 receptor promotes longevity free from growth-related pathologies
eLife 10:e71335.
https://doi.org/10.7554/eLife.71335


