Human embryoid bodies as a novel system for genomic studies of functionally diverse cell types
- Department of Medicine, University of Chicago, United States
- Department of Biomedical Engineering, Johns Hopkins University, United States
- Department of Computer Science, Johns Hopkins University, United States
- Department of Genetic Medicine, Johns Hopkins University, United States
Figures
Figure 1 with 4 supplements

Characterization of EB cell type composition using marker gene expression and clustering.
(A–F) Visualization of EB cells with UMAP. (A) Cells from lines 18511, 18858, and 19160 colored by expression of pluripotent marker gene POU5F1, (B) Cells from lines 18511, 18858, and 19160 colored by expression of endoderm marker gene SOX17, (C) Cells from lines 18511, 18858, and 19160 colored by expression of mesoderm marker gene HAND1, (D) Cells from lines 18511, 18858, and 19160 colored by expression of early ectoderm marker gene PAX6. In A-D cells are colored by normalized counts. (E) Cells from lines 18511, 18858, and 19160 colored by Seurat cluster assignment at clustering resolution 0.1. (F) Cells from lines 18511, 18858, and 19160 colored by Seurat cluster assignment at clustering resolution 1. (G) Proportions of cells from replicates of lines 18511, 18858, and 19160 assigned to Seurat clusters at clustering resolution 0.1. (H) Proportions of cells from additional lines assigned to broad cell types present in EBs.
Figure 1—figure supplement 1
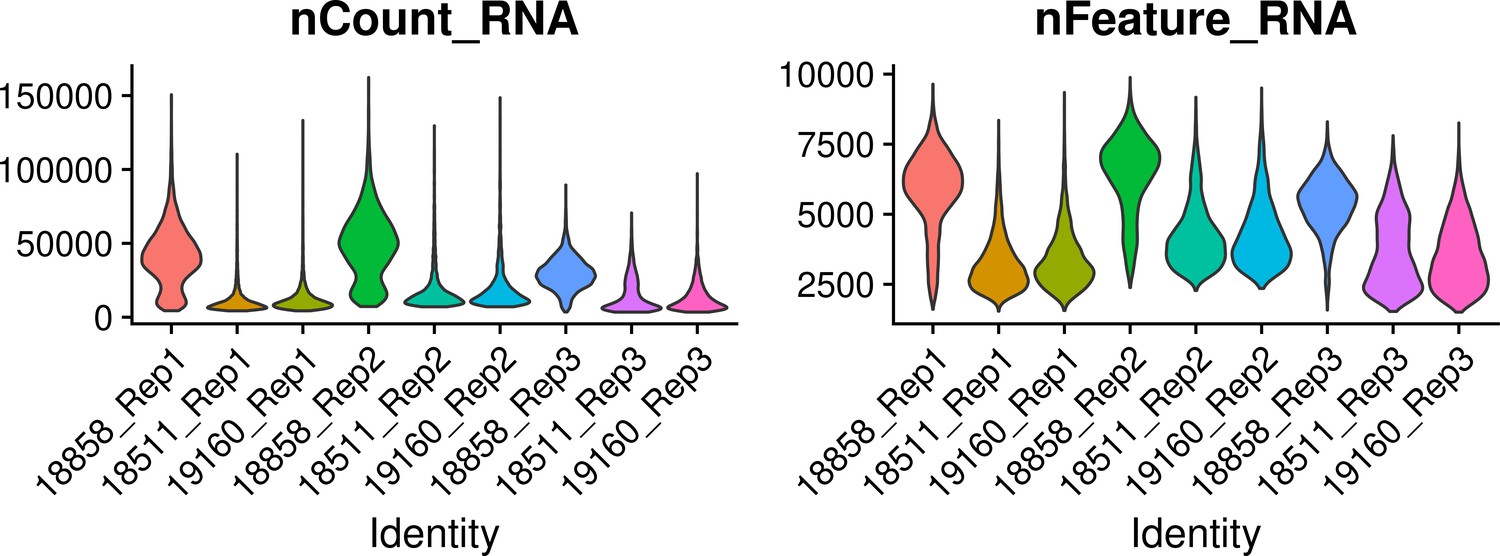
Quality metrics after filtering.
(Left) Violin plot showing the total UMI counts in cells from each individual in each replicate after filtering. (Right) Violin plot showing the number of genes (features) expressed in cells of each individual and each replicate after filtering.
Figure 1—figure supplement 2
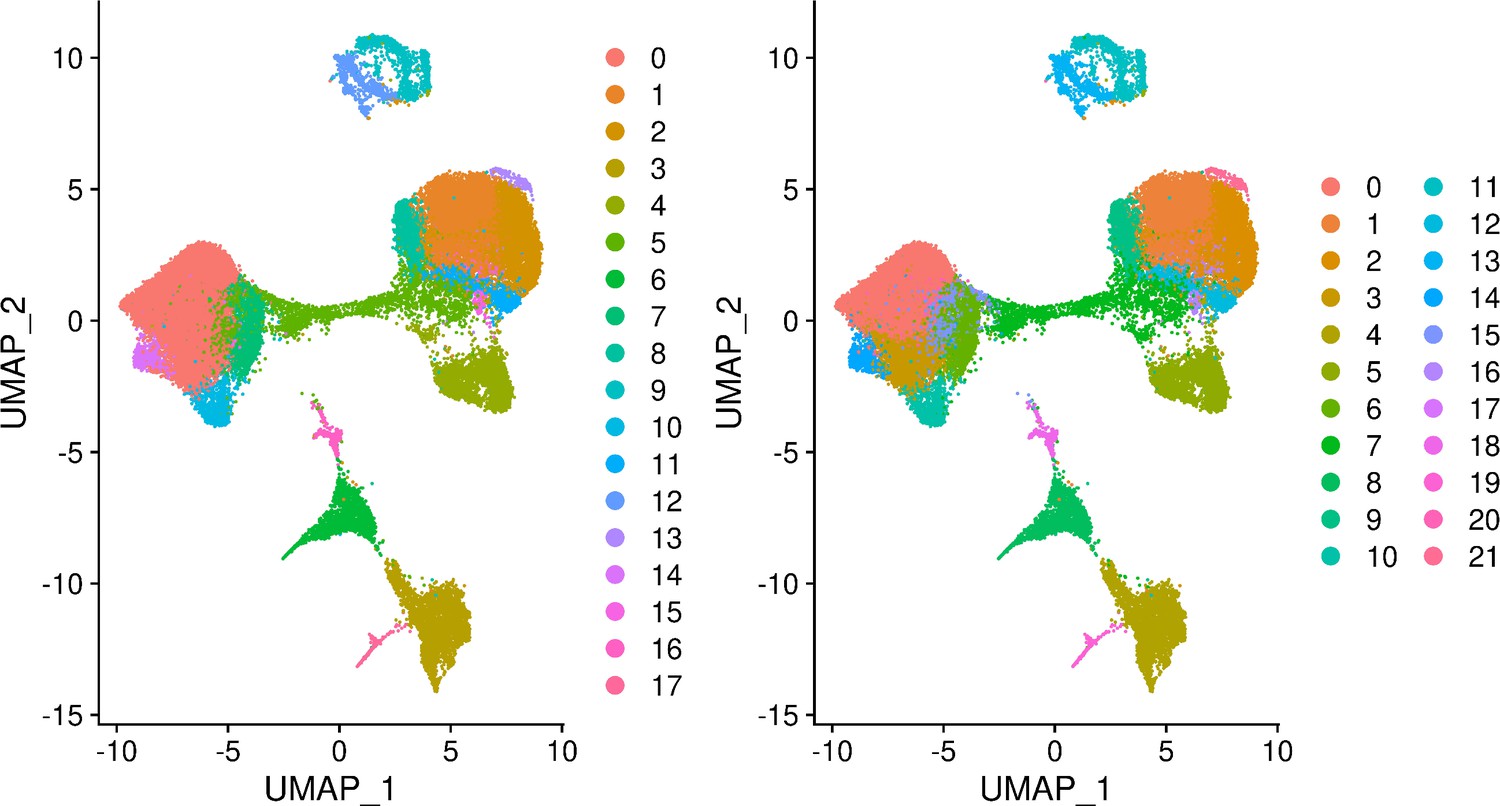
Seurat clusters identified at clustering resolution 0.5 (Left) and 0.8 (Right).
Figure 1—figure supplement 3

UMAP visualization of cells from individual 18858 only.
Cells are colored by cluster assignment at resolution 0.1. Cluster 0 corresponds to pluripotent cells, cluster 1 to early ectoderm, cluster 2 to mesoderm, cluster 3 to neural crest, cluster 4 to endoderm, cluster 5 to neurons, and cluster 6 to endothelial cells.
Figure 1—figure supplement 4
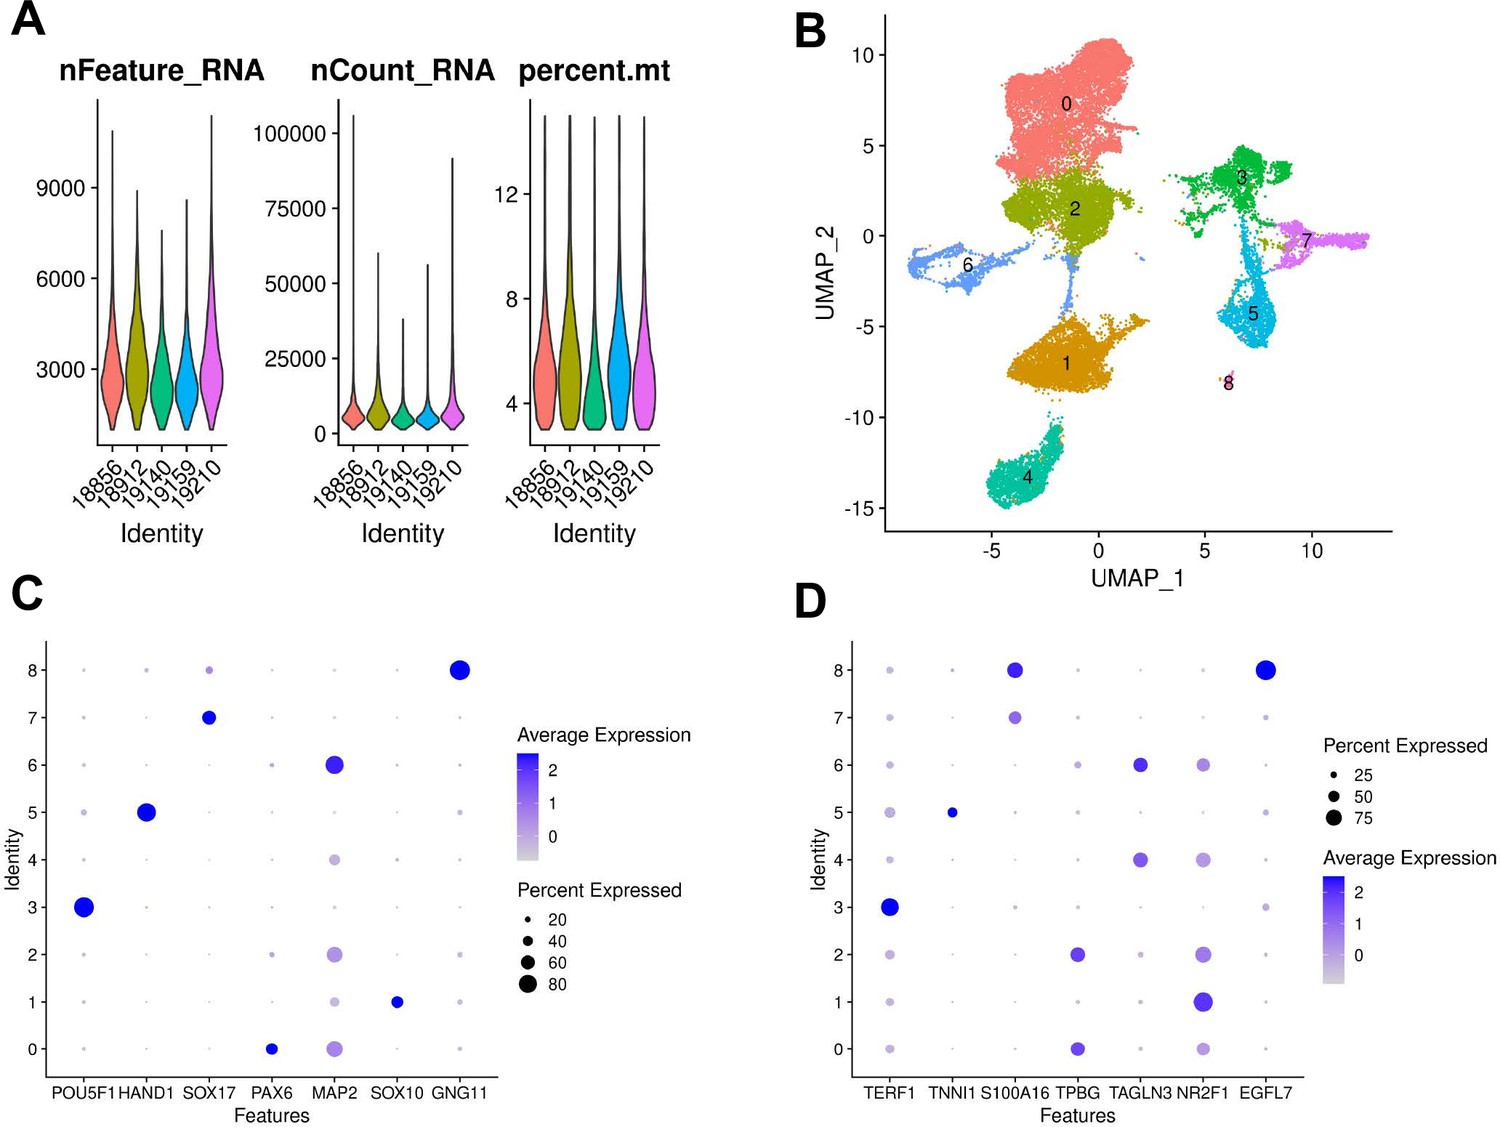
Cell type composition of additional YRI lines.
(A) Quality control metrics for each of the five new lines after filtering (B) UMAP visualization of cells from additional lines colored by Seurat cluster assignment at resolution 0.15. (C) Dot plot showing expression of canonical marker genes in each Seurat cluster at resolution 0.15 (POU5F1 marks pluripotent cells, HAND1 marks mesoderm, SOX17 marks endoderm, PAX6 marks early ectoderm, SOX10 marks neural crest, GNG11 marks endothelial cells). (D) Dot plot showing expression of cluster markers learned from prior differential expression analysis in EB clusters from lines 18858, 18511, and 19160 (see Table 1).
Figure 2 with 3 supplements
Reference Integration and cell type annotation with lines 18511, 18858, and 19160.
(A) UMAP visualization of EB cells from this study and cells from reference data sets of fetal cell types, Day 20 EBs, and hESCs after integration. Cells are colored by data set. (B) UMAP visualization of EB cells from this study and cells from the fetal reference after integration. Cells are colored by Seurat cluster identity at clustering resolution 0.1, with gray points representing cells from the fetal reference set. (C) UMAP visualization of EB cells from this study and data from the fetal reference after integration. Cells are colored by cell types present in the fetal reference data set, with gray points representing EB cells. (D) UMAP visualization of EB cells from this data set with annotations transferred from the fetal and hESC reference sets.
Figure 2—figure supplement 1
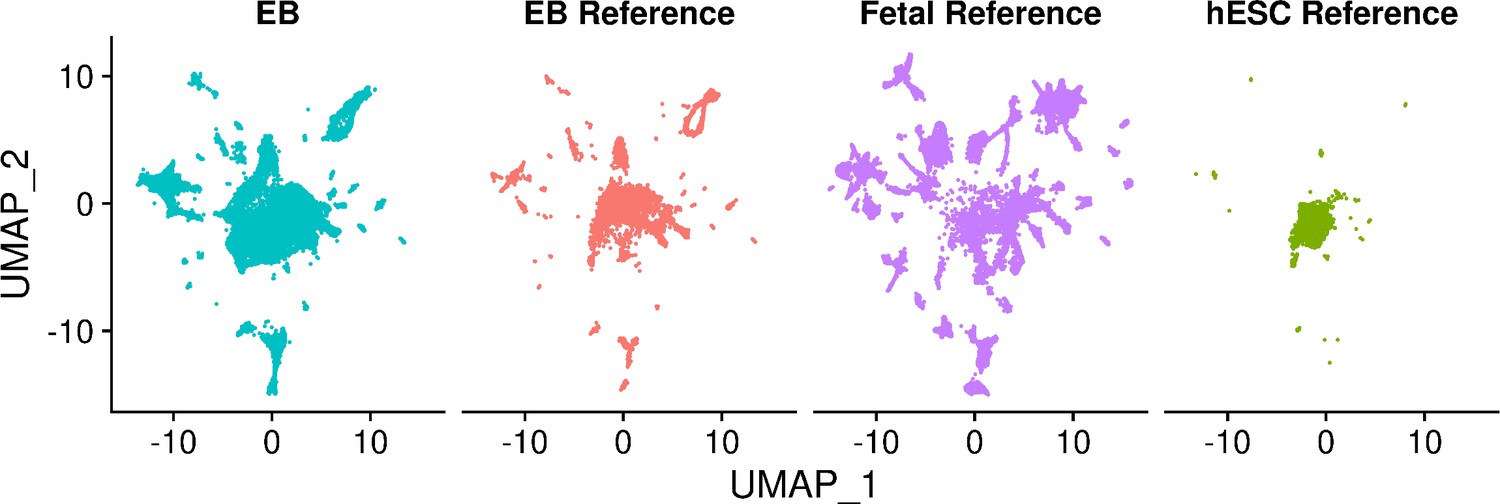
UMAP visualization of EB cells from lines 18511, 18858, and 19160 and cells from each reference set after integration of separated data set.
Figure 2—figure supplement 2
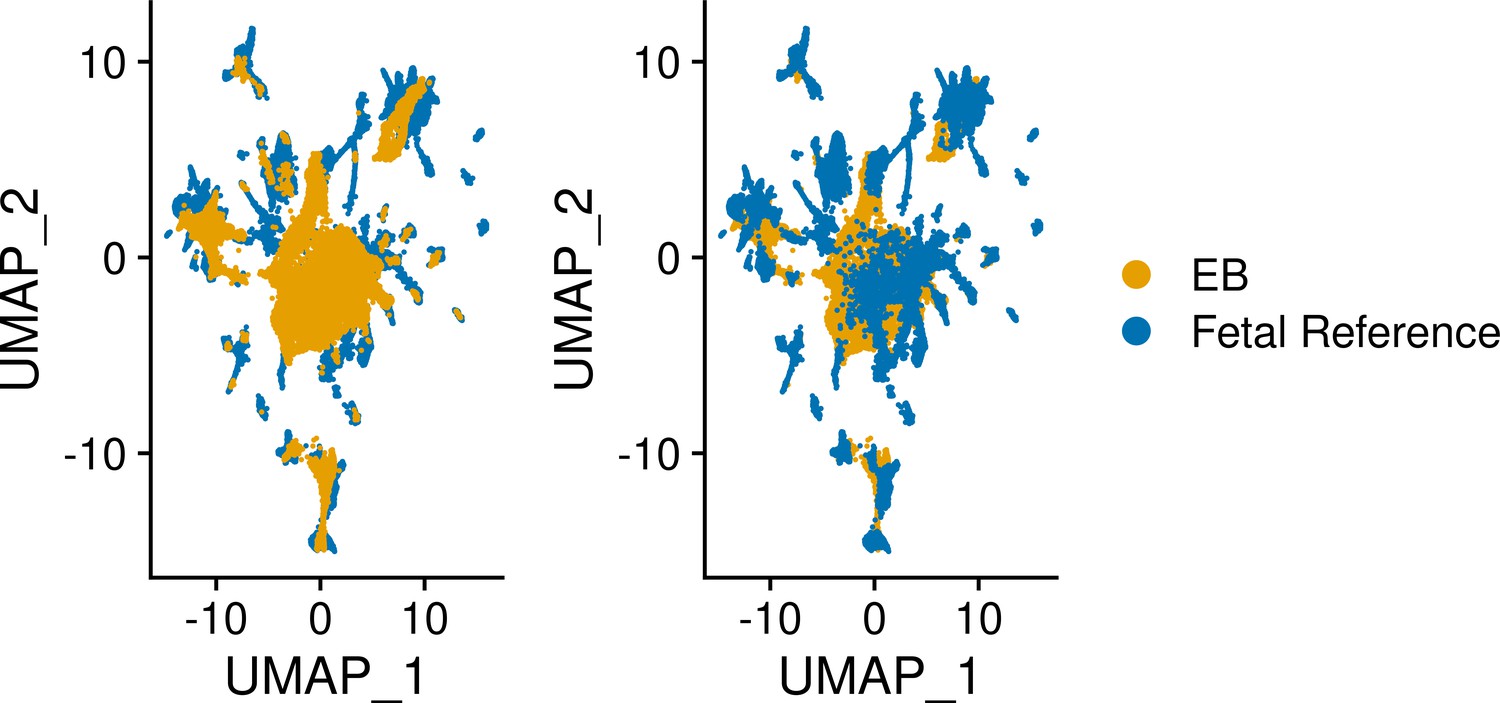
UMAP visualization of EB cells from lines 18511, 18858, and 19160 and fetal reference cells after integration.
Cells are colored by data set.
Figure 2—figure supplement 3
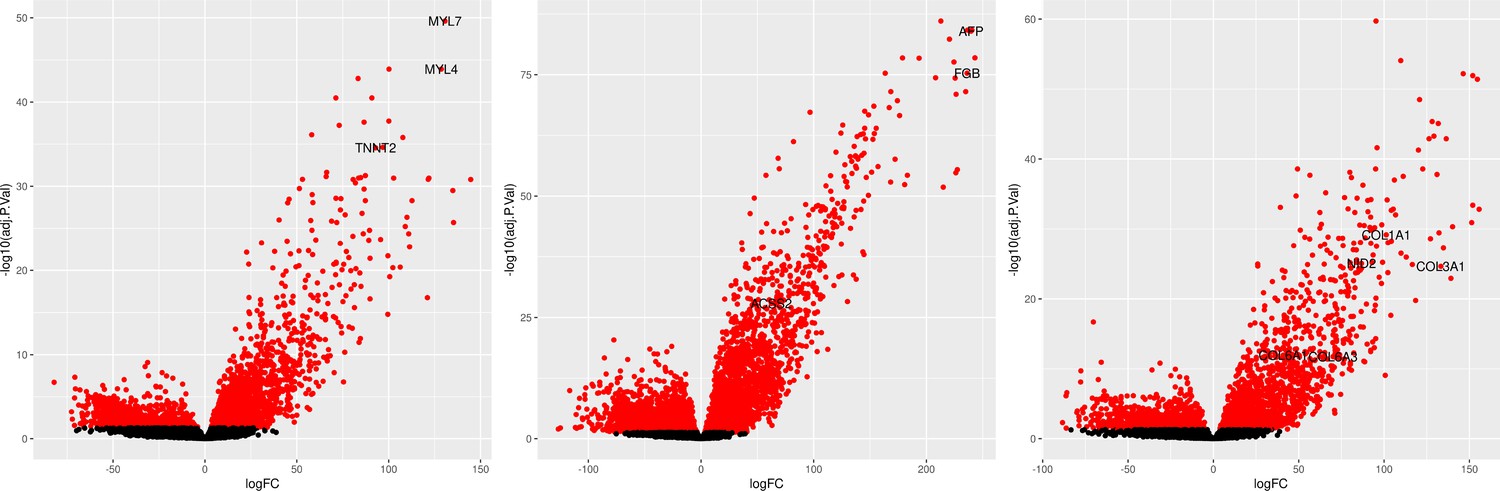
Differential expression of known marker genes in reference annotated EB cell types in cells from lines 18511, 18858, and 19160.
(Left) Volcano plot of DE genes in annotated cardiomyocytes compared to all other cell types with known cardiomyocyte marker genes labeled (MYL7, MYL4, TNNT2). (Middle) Volcano plot of DE genes in annotated hepatoblasts compared to all other cell types with known hepatoblast marker genes labeled (AFP, FGB, ACSS2). (Right) Volcano plot of DE genes in annotated mesothelial cells compared to all other cell types with known mesothelial marker genes labeled (NID2, COL1A1, COL6A3, COL3A1, COL6A1).
Figure 3 with 2 supplements

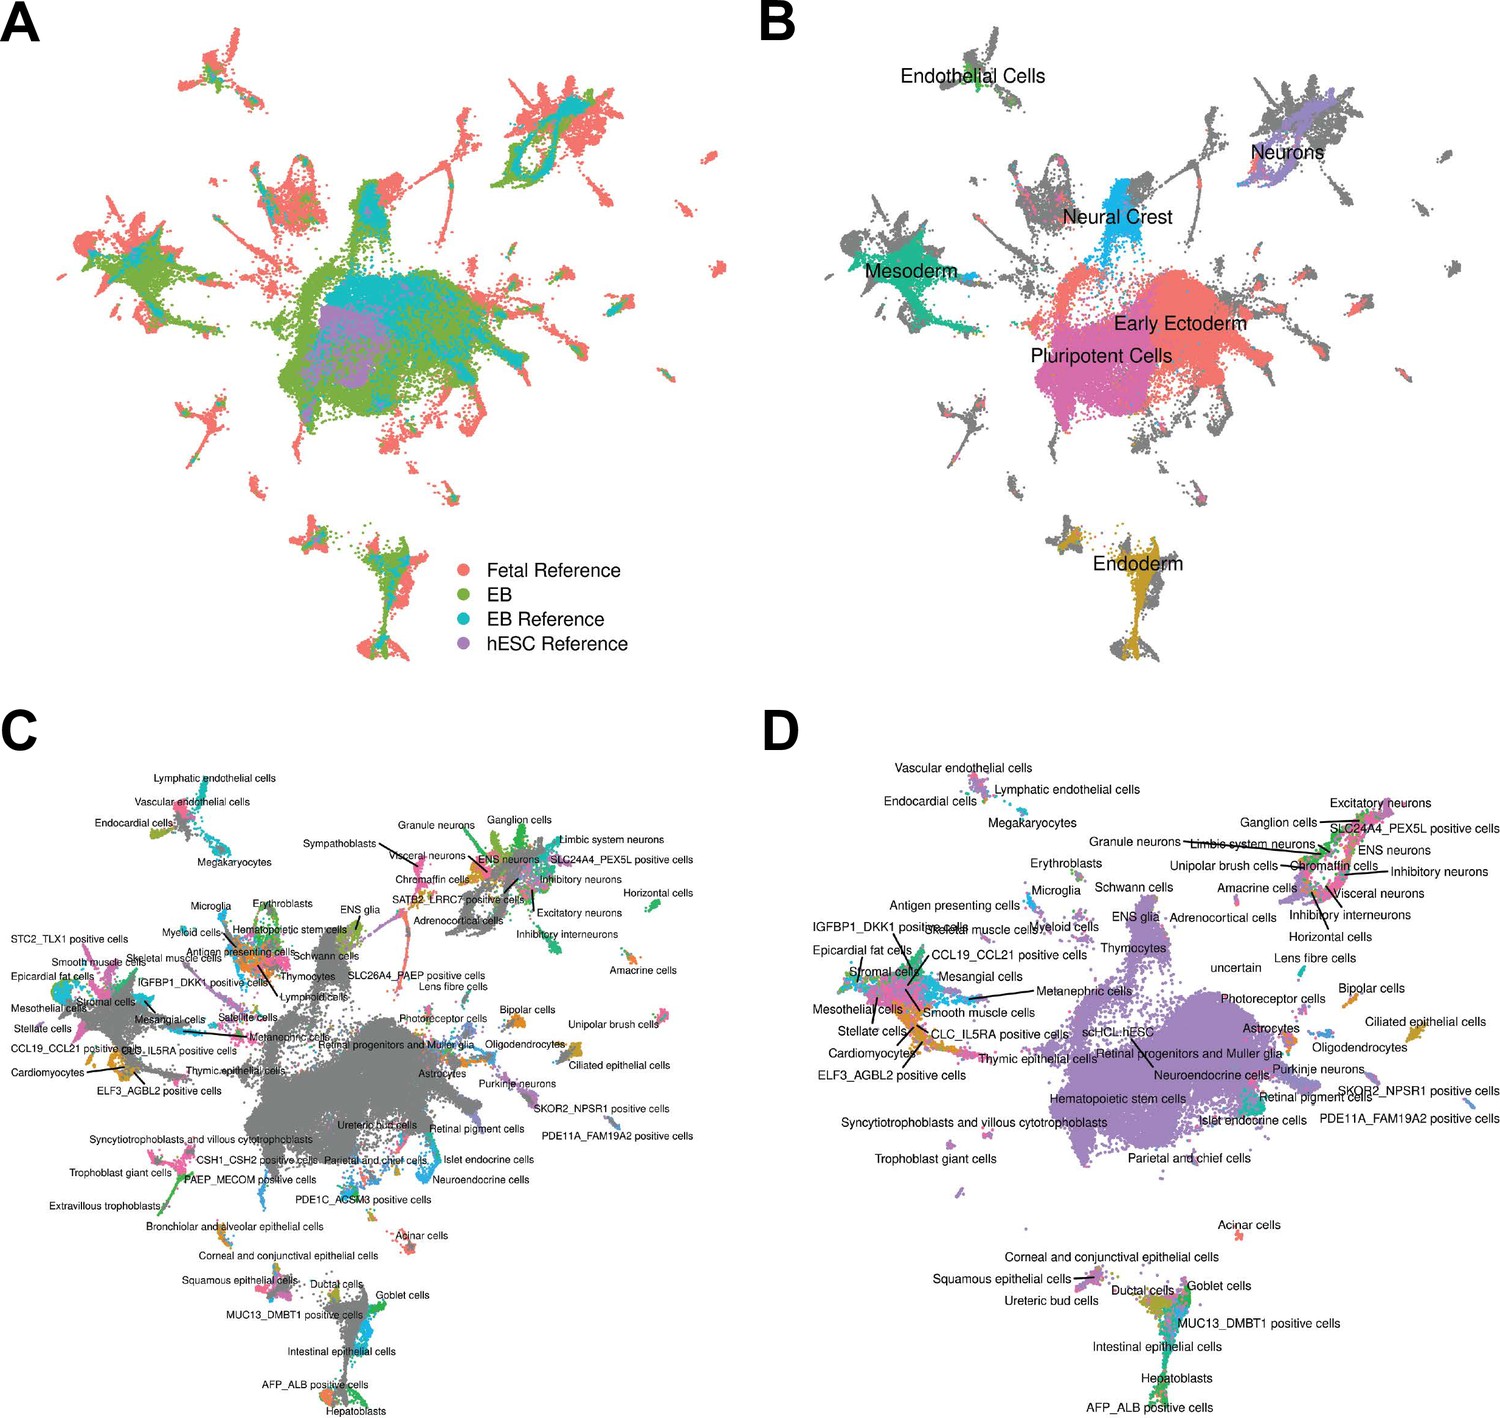
Reference Integration and cell type annotation with additional lines.
(A) UMAP visualization of EB cells from this study and cells from reference data sets of fetal cell types, Day 20 EBs, and hESCs after integration. Cells are colored by data set. (B) UMAP visualization of EB cells from this study and cells from the fetal reference after integration. Cells are colored by broad cell type category assigned using clustering and marker gene expression, with gray points representing cells from the fetal reference set. (C) UMAP visualization of EB cells from this study and data from the fetal reference after integration. Cells are colored by cell types present in the fetal reference data set, with gray points representing EB cells. (D) UMAP visualization of EB cells from this data set with annotations transferred from the fetal and hESC reference sets.
Figure 3—figure supplement 1

UMAP visualization of EB cells from lines five additional YRI lines and cells from each reference set after integration of separated data set.
Figure 3—figure supplement 2

UMAP visualization of EB cells from five additional YRI lines and fetal reference cells after integration.
Cells are colored by data set.
Figure 4 with 3 supplements
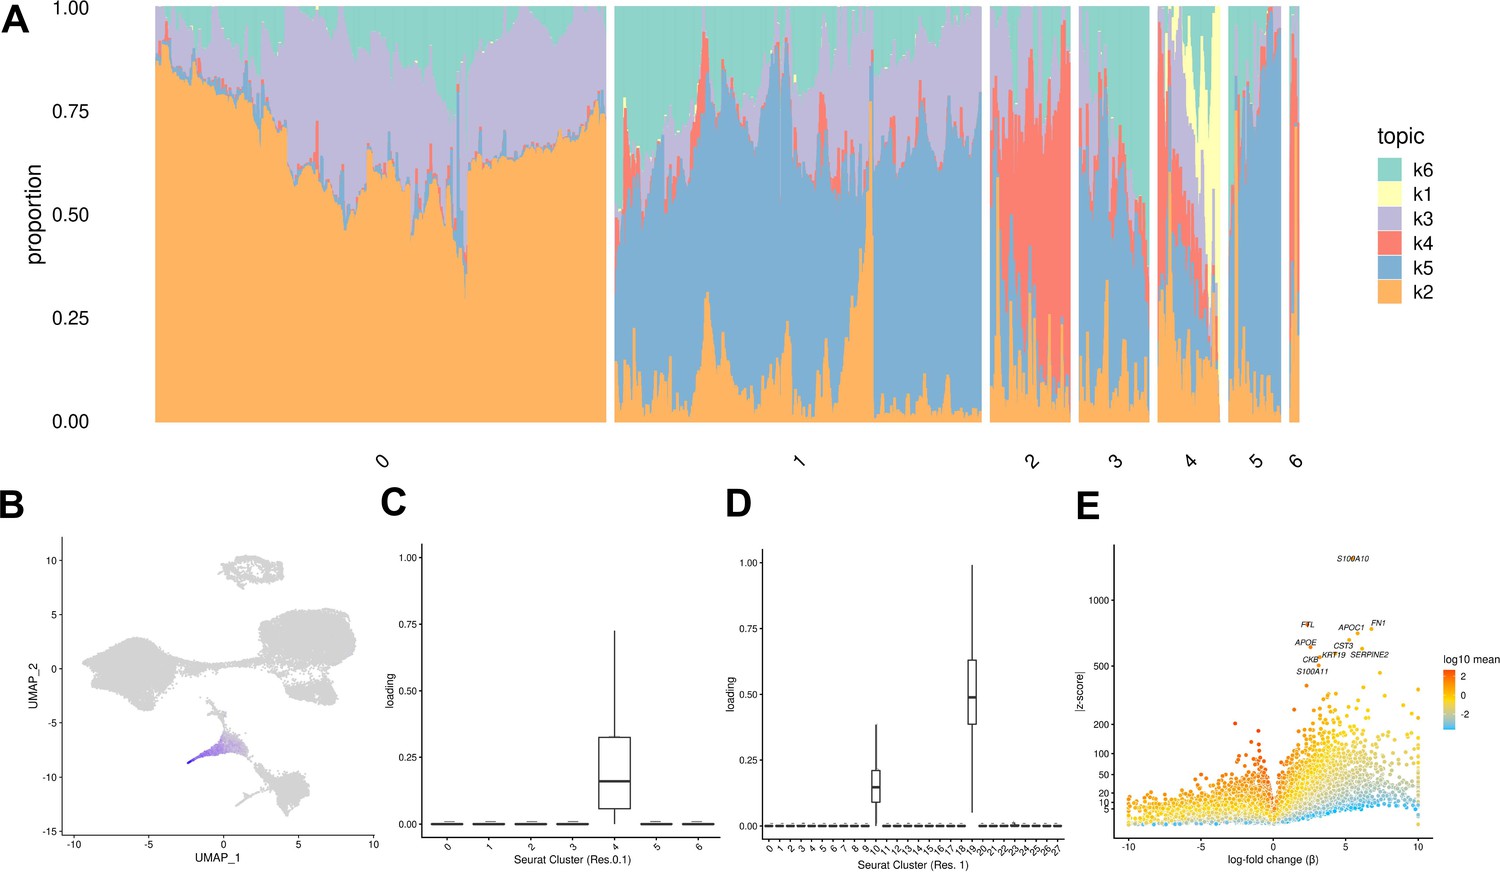
Topic modeling of EB cells.
(A) Structure plot showing the results of topic modeling at k = 6. Plot includes a random subset of 5,000 EB cells divided by Seurat cluster at resolution 0.1. (B) UMAP projection of cells colored by loading of topic 1. (C) Box plot showing the loading of topic 1 from the k = 6 topic analysis on each Seurat cluster at clustering resolution 0.1. (D) Box plot showing the loading of topic 1 from the k = 6 topic analysis on each Seurat cluster at clustering resolution 1. (E) Volcano plot showing genes differentially expressed between topic 1 and all other topics from the k = 6 topic analysis. Points are colored by the average count on the logarithmic scale.
Figure 4—figure supplement 1
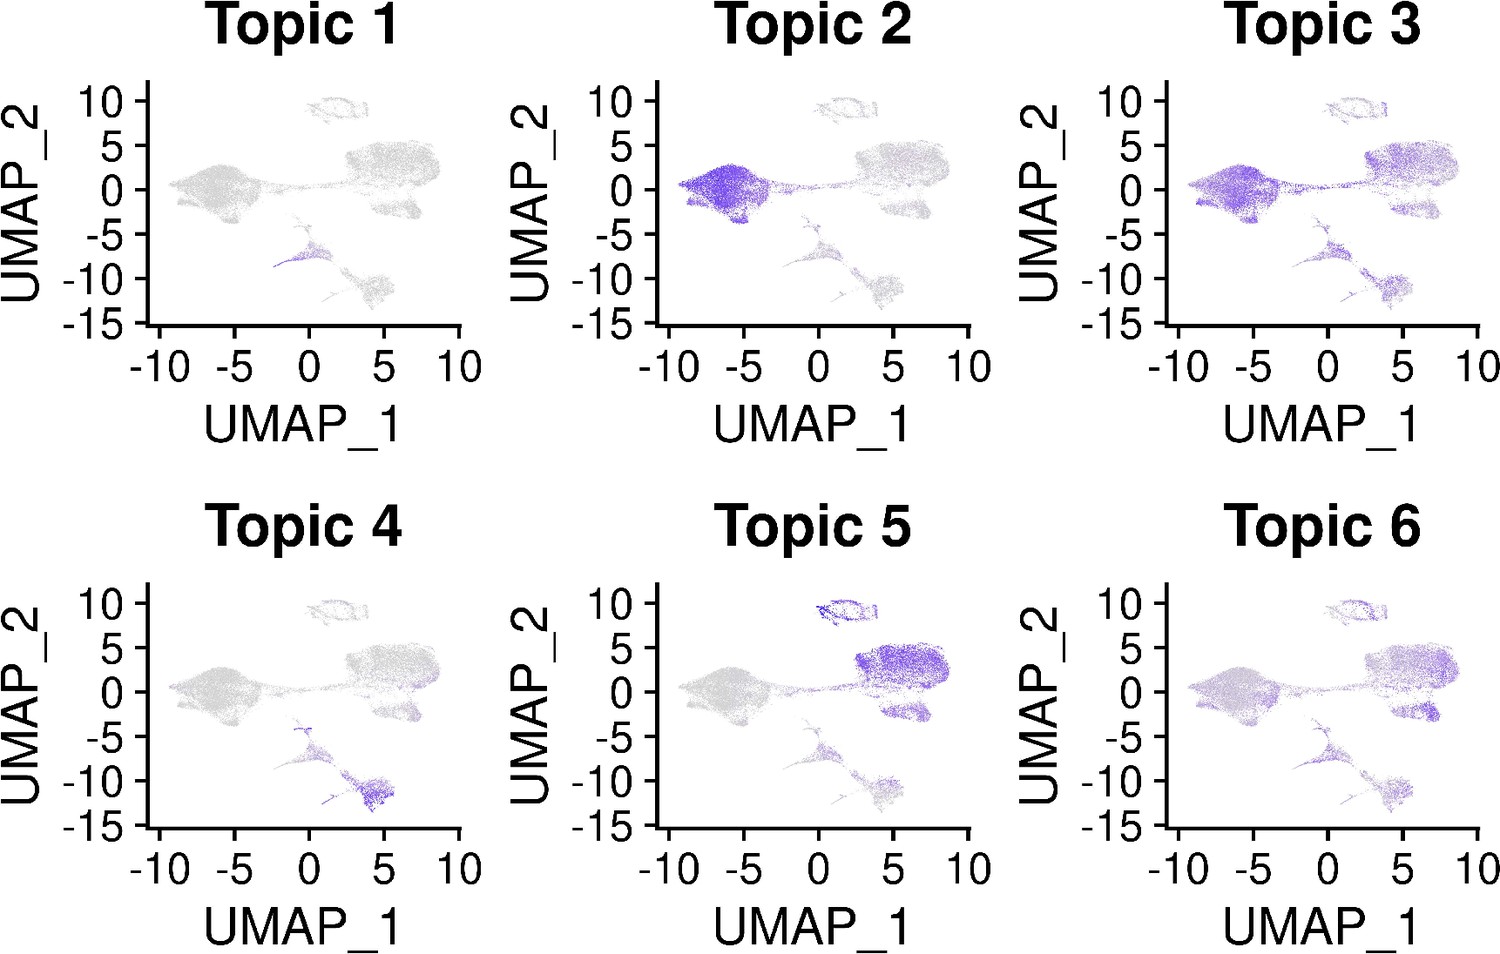
UMAP visualization of k = 6 topic loadings.
Figure 4—figure supplement 2
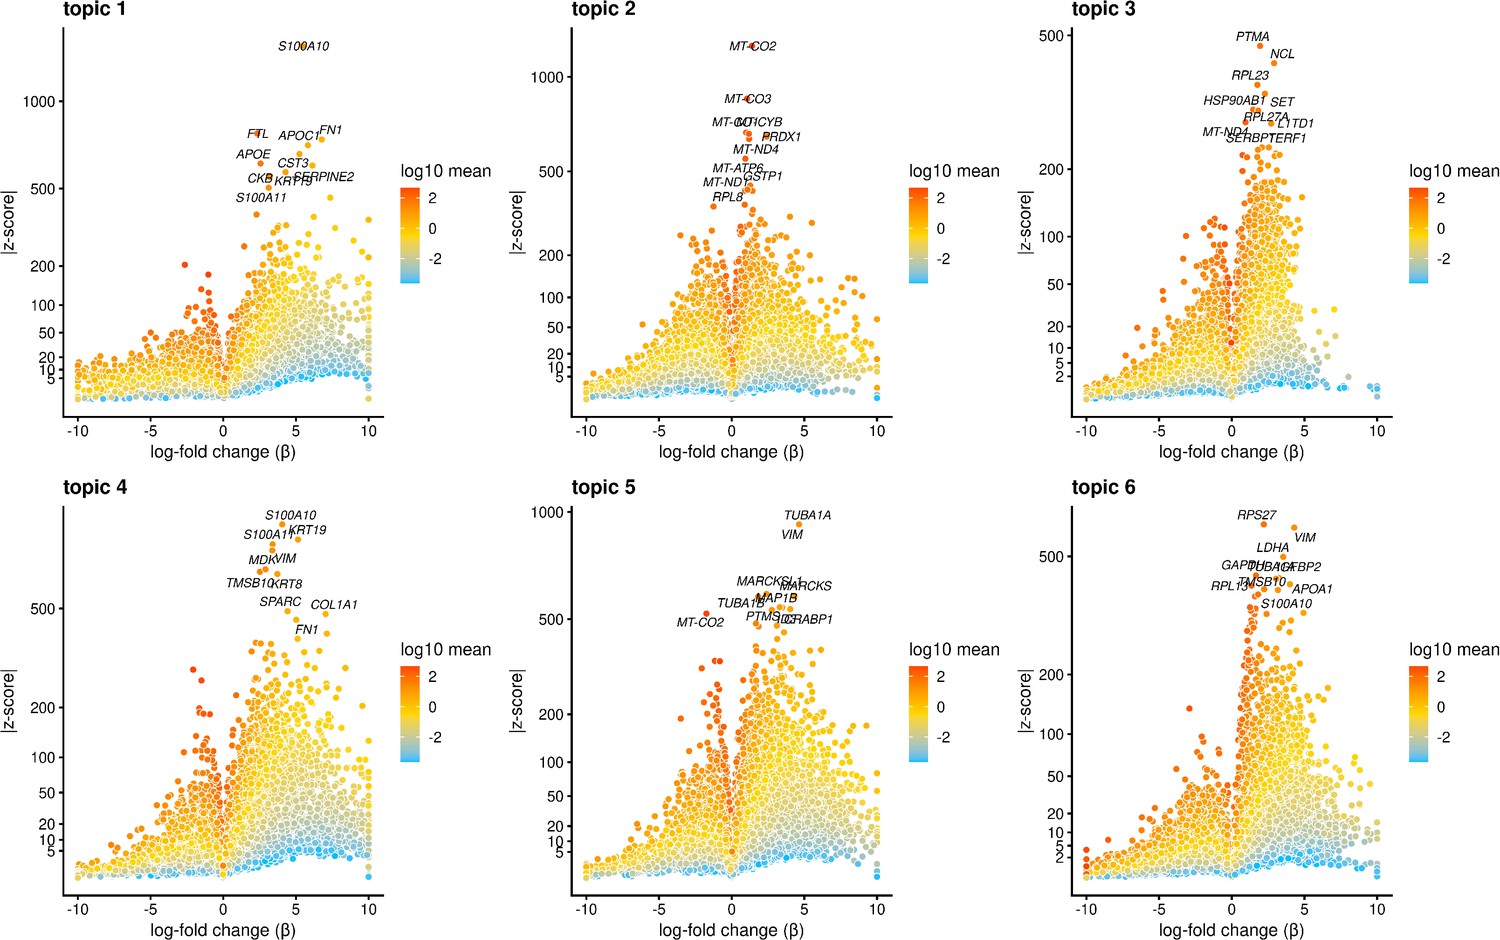
Volcano plot showing genes differentially expressed in each topic from the k = 6 topic analysis.
Points are colored by the average count on the logarithmic scale. The top 10 driver genes of each topic are labeled.
Figure 4—figure supplement 3
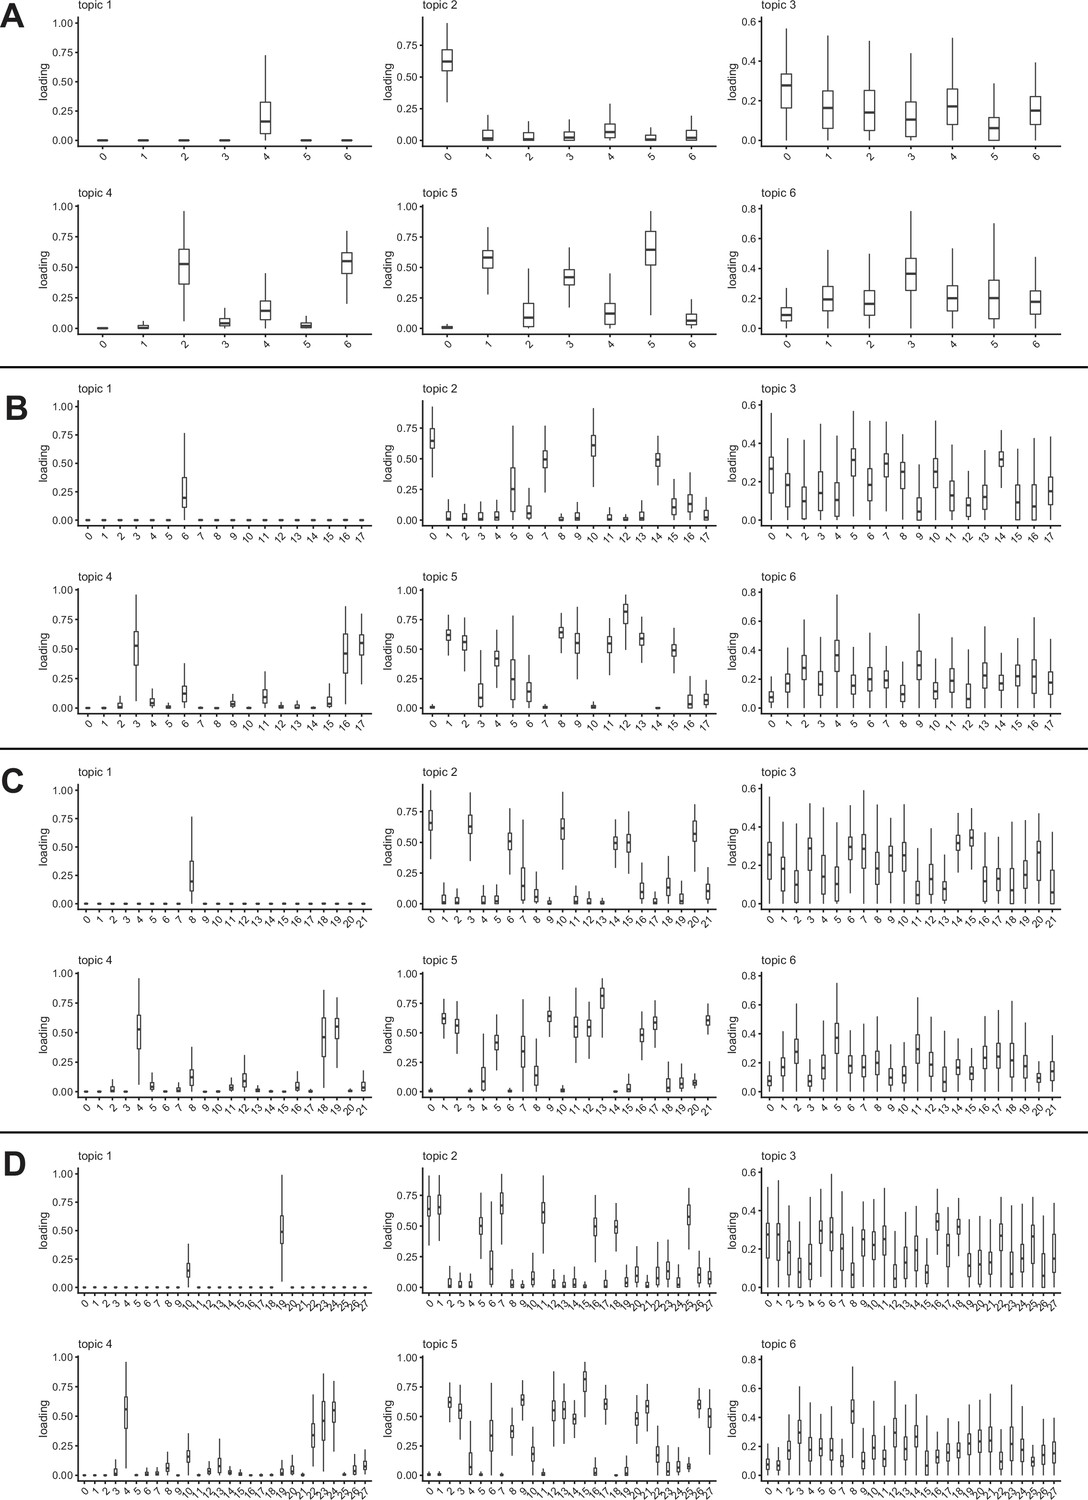
Topic loadings on Seurat clusters across clustering resolutions.
Bar plots show the loading of each topic (from the k = 6 analysis) on each Seurat cluster at resolution 0.1 (A), resolution 0.5 (B), resolution 0.8 (C), and resolution 1 (D).
Figure 5 with 5 supplements
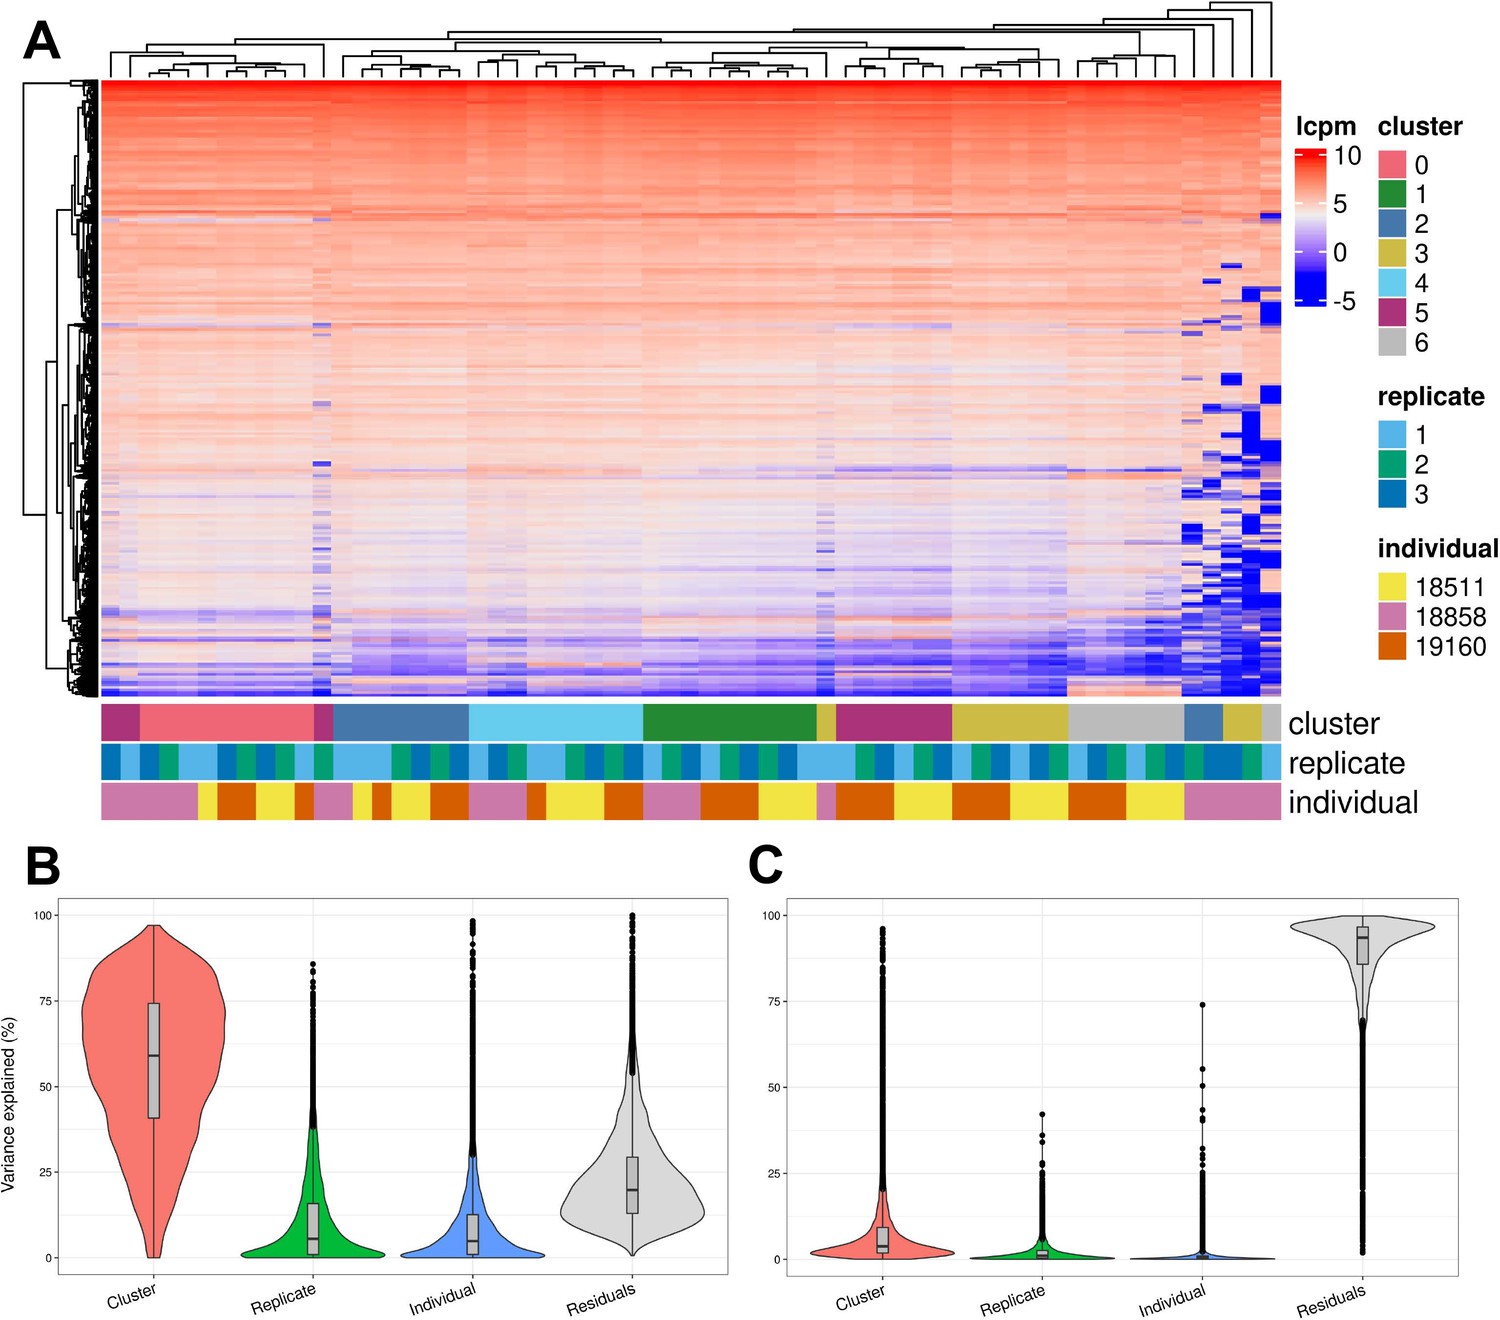
Exploration of the biological and technical variation in gene expression across EB cells.
(A) Heatmap showing hierarchical clustering of cells based on normalized gene expression. This analysis uses only genes expressed in at least 20% of cells in at least one cluster (at clustering resolution 0.1) and does not include ribosomal genes. (B) Violin plot showing the percent of variance in gene expression explained by cluster (resolution 0.1), replicate, and individual in this data set after partitioning variance in pseudobulk samples. (C) Violin plot showing the percent of variance in gene expression explained by cluster (resolution 0.1), replicate, and individual in this data set after partitioning variance at single-cell resolution.
Figure 5—figure supplement 1
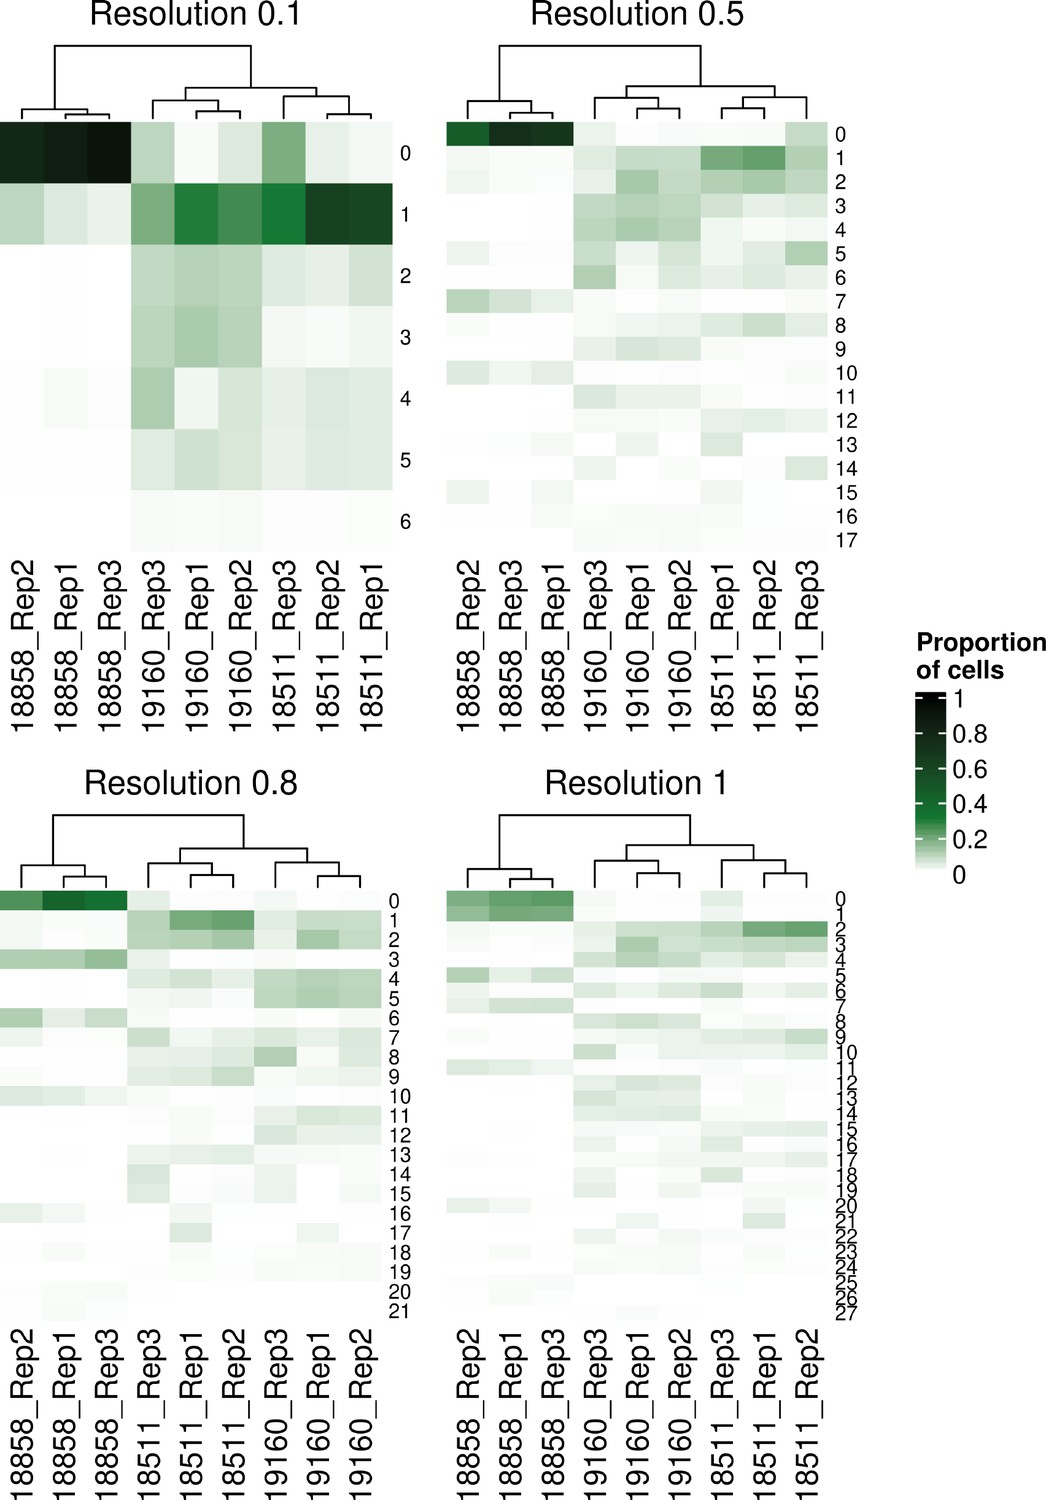
Hierarchical clustering of samples’ individual-replicate groups by the proportions of cells from each group assigned to each Seurat cluster across clustering resolutions.
Figure 5—figure supplement 2
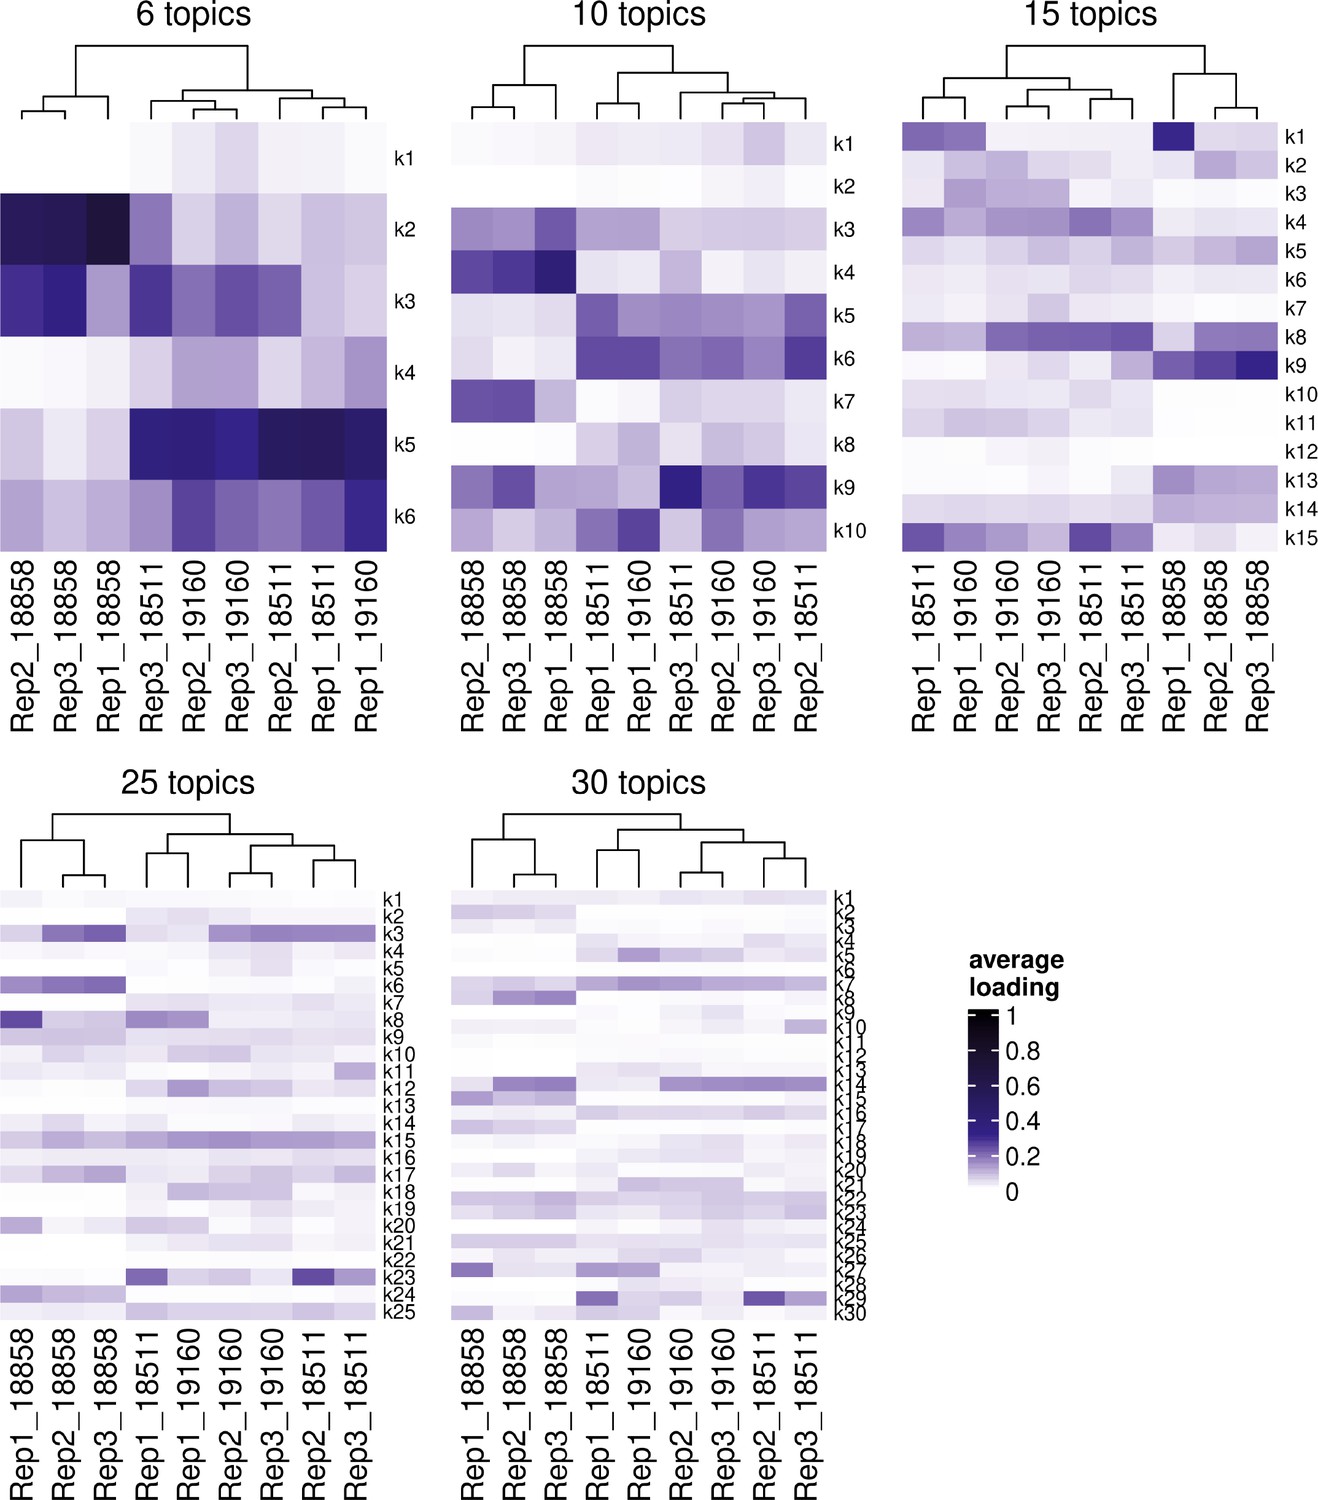
Hierarchical clustering of samples’ individual-replicate groups by the loading of each topic with k = 6, k = 10, k = 15, k = 25, and k = 30 topics.
Figure 5—figure supplement 3
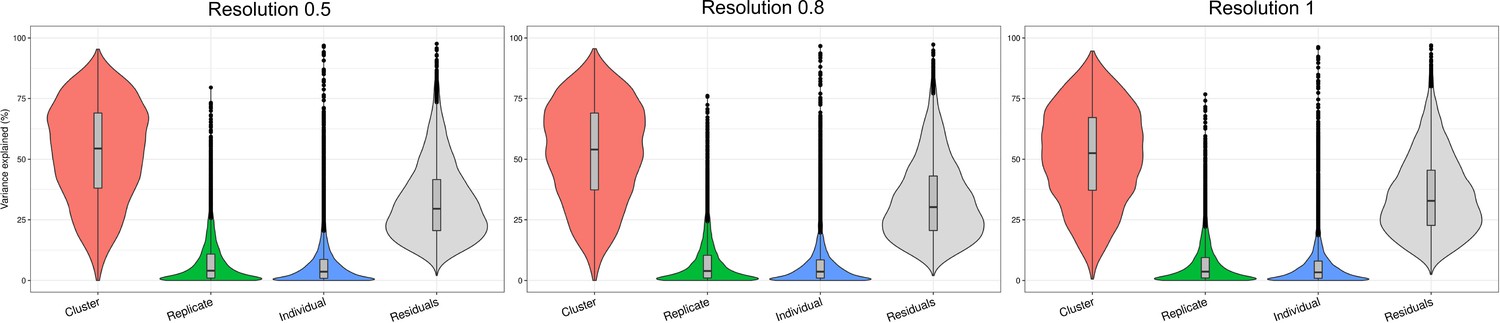
Variance explained by biological and technical factors at higher clustering resolutions.
Violin plots showing the percent of variance in gene expression explained by cluster, replicate, and individual in this data set after partitioning variance in pseudobulk samples.
Figure 5—figure supplement 4
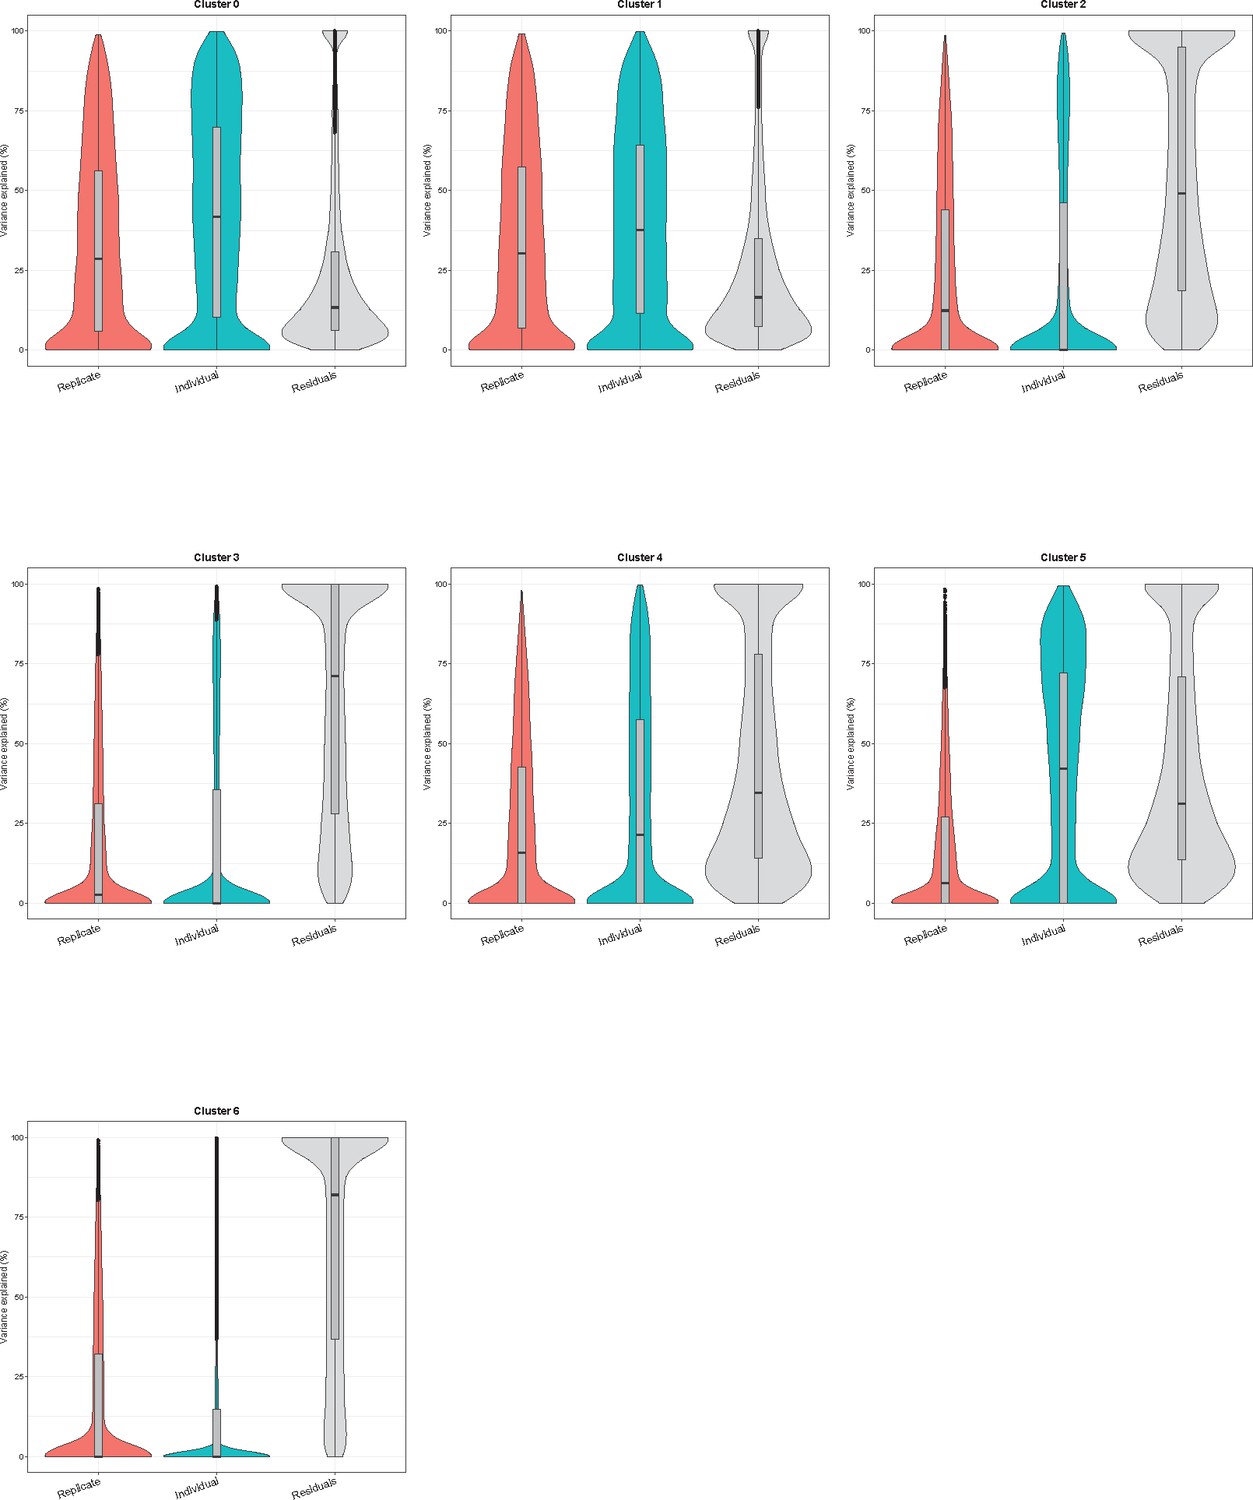
Variance partitioning by Seurat cluster using pseudobulk samples.
Violin plots showing the percent of variance in gene expression explained by replicate and individual in each Seurat cluster (clustering resolution 0.1).
Figure 5—figure supplement 5
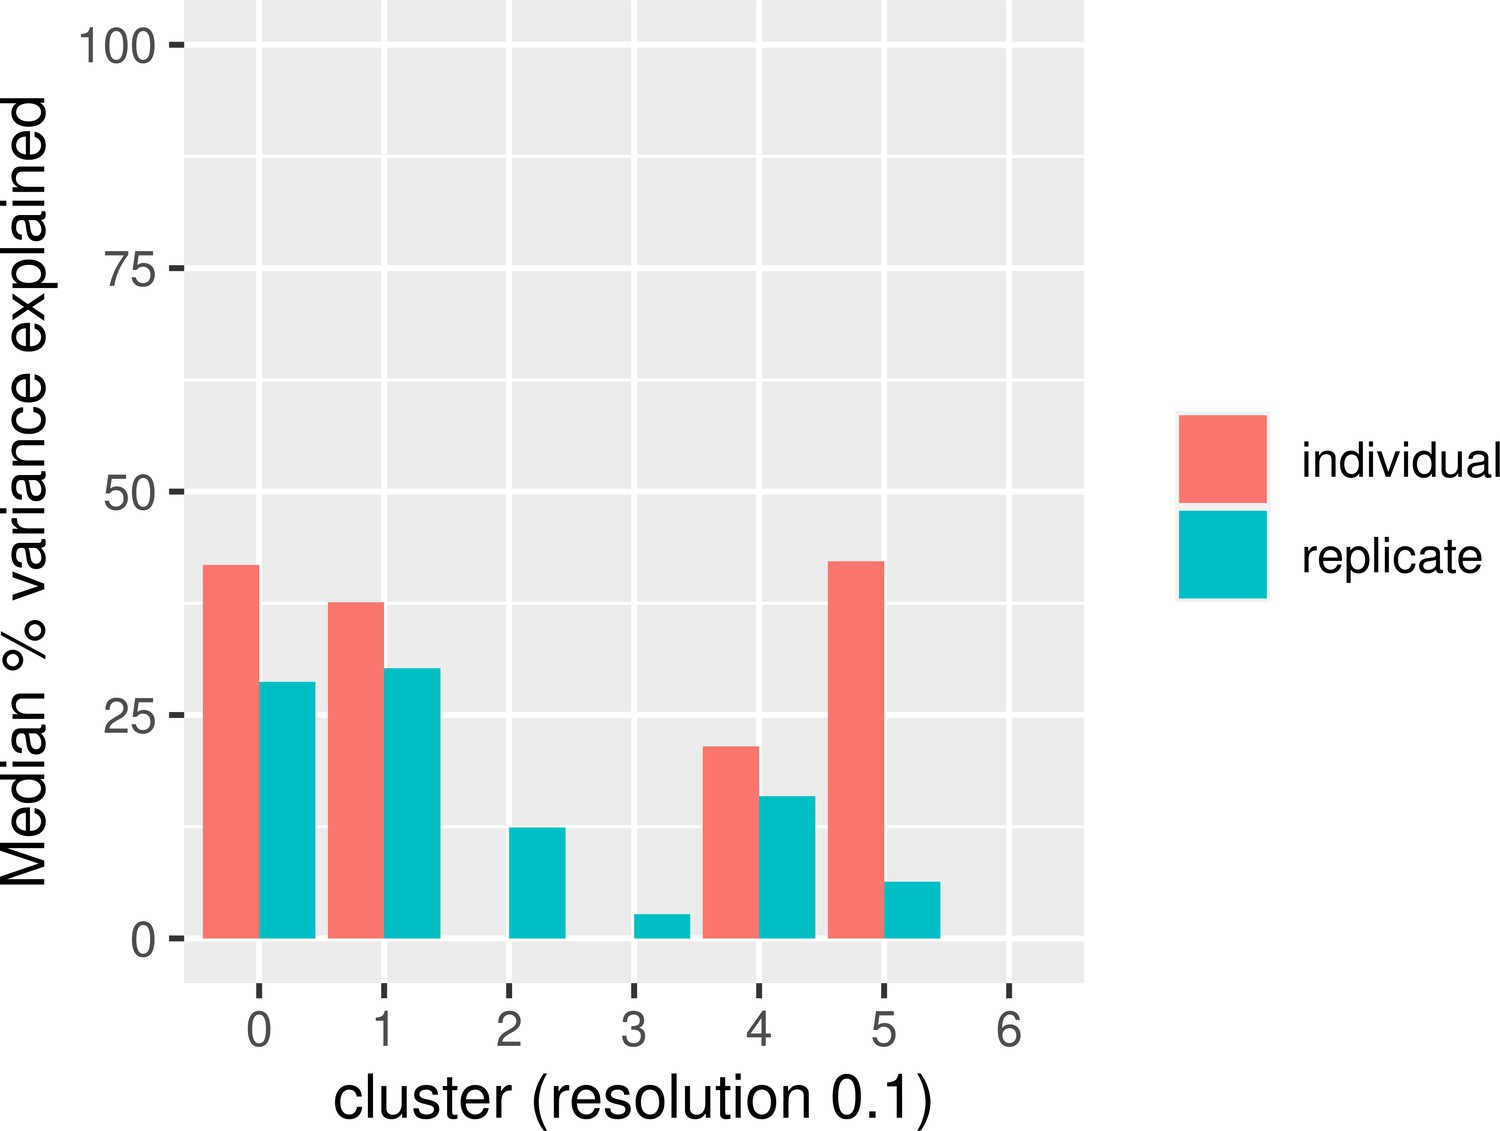
Median percent of variance explained by replicate and individual in each cluster using pseudobulk samples.
Figure 6
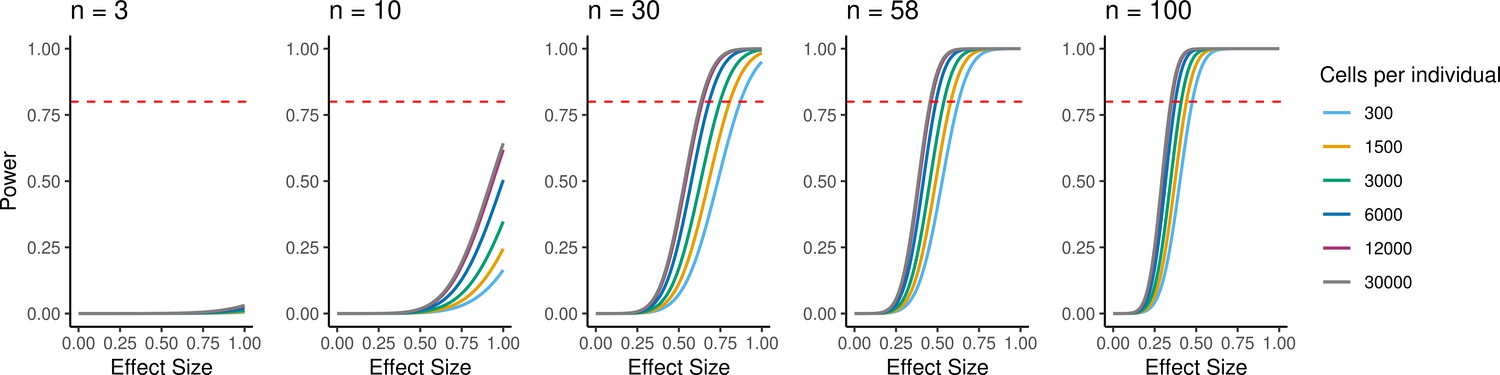
Power to detect eQTLs.
Power is a function of effect size, sample size, experiment size, and significance level. Power curves are computed for a range of sample sizes and experiment sizes (cells per individual). The horizontal red line represents a power to detect eQTLs of 0.80.
Figure 7 with 5 supplements
Trajectory inference and identification of dynamic gene modules.
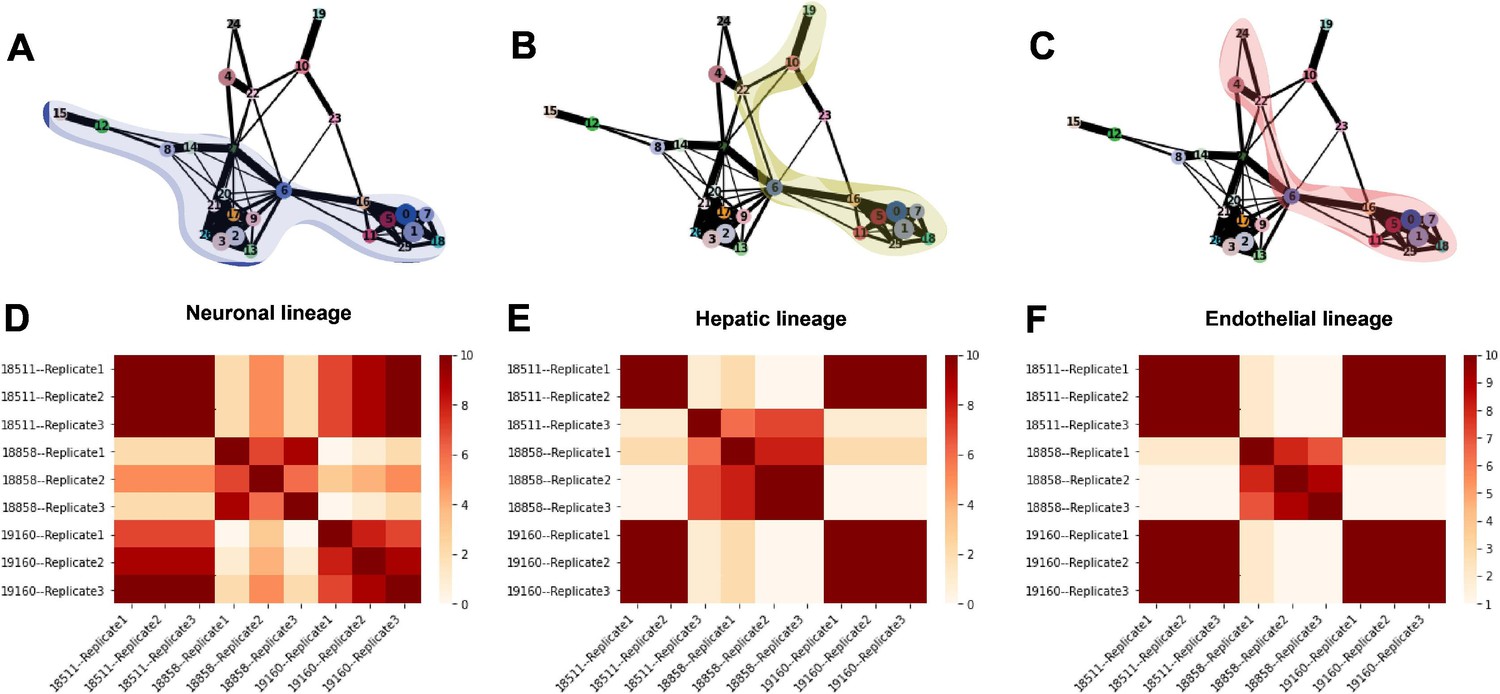
(A–C) PAGA graphs highlighting the neuronal lineage (A), the hepatic lineage (B), and the endothelial lineage (C). Nodes are defined by Seurat clusters at resolution 1. (D–F) Heatmaps showing the frequency with which individual-replicate groups were assigned to the same cluster after running split-GPM 10 times in the neuronal, hepatic, and endothelial lineages.
Figure 7—figure supplement 1
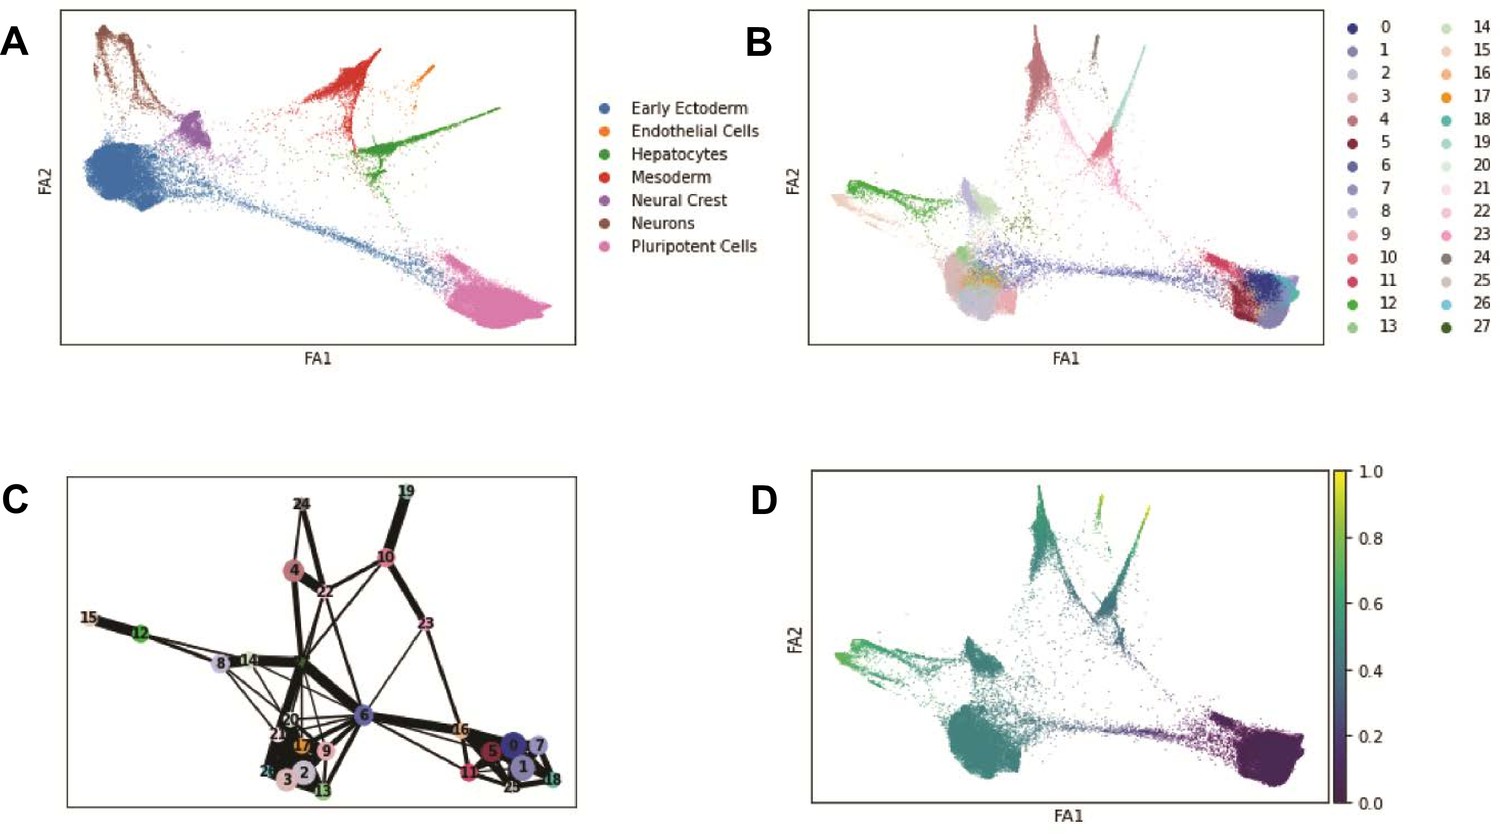
Trajectory inference with PAGA.
(A) Force atlas plot of EB cells colored by broad cell type categories corresponding to Seurat clusters identified at clustering resolution 0.1 (see Table 1). (B) Force atlas plot of EB cells colored by Seurat cluster at clustering resolution 1. (C) PAGA graph showing inferred edges between Seurat clusters defined at clustering resolution 1. (D) Diffusion pseudotime values across EB cells visualized with force atlas.
Figure 7—figure supplement 2
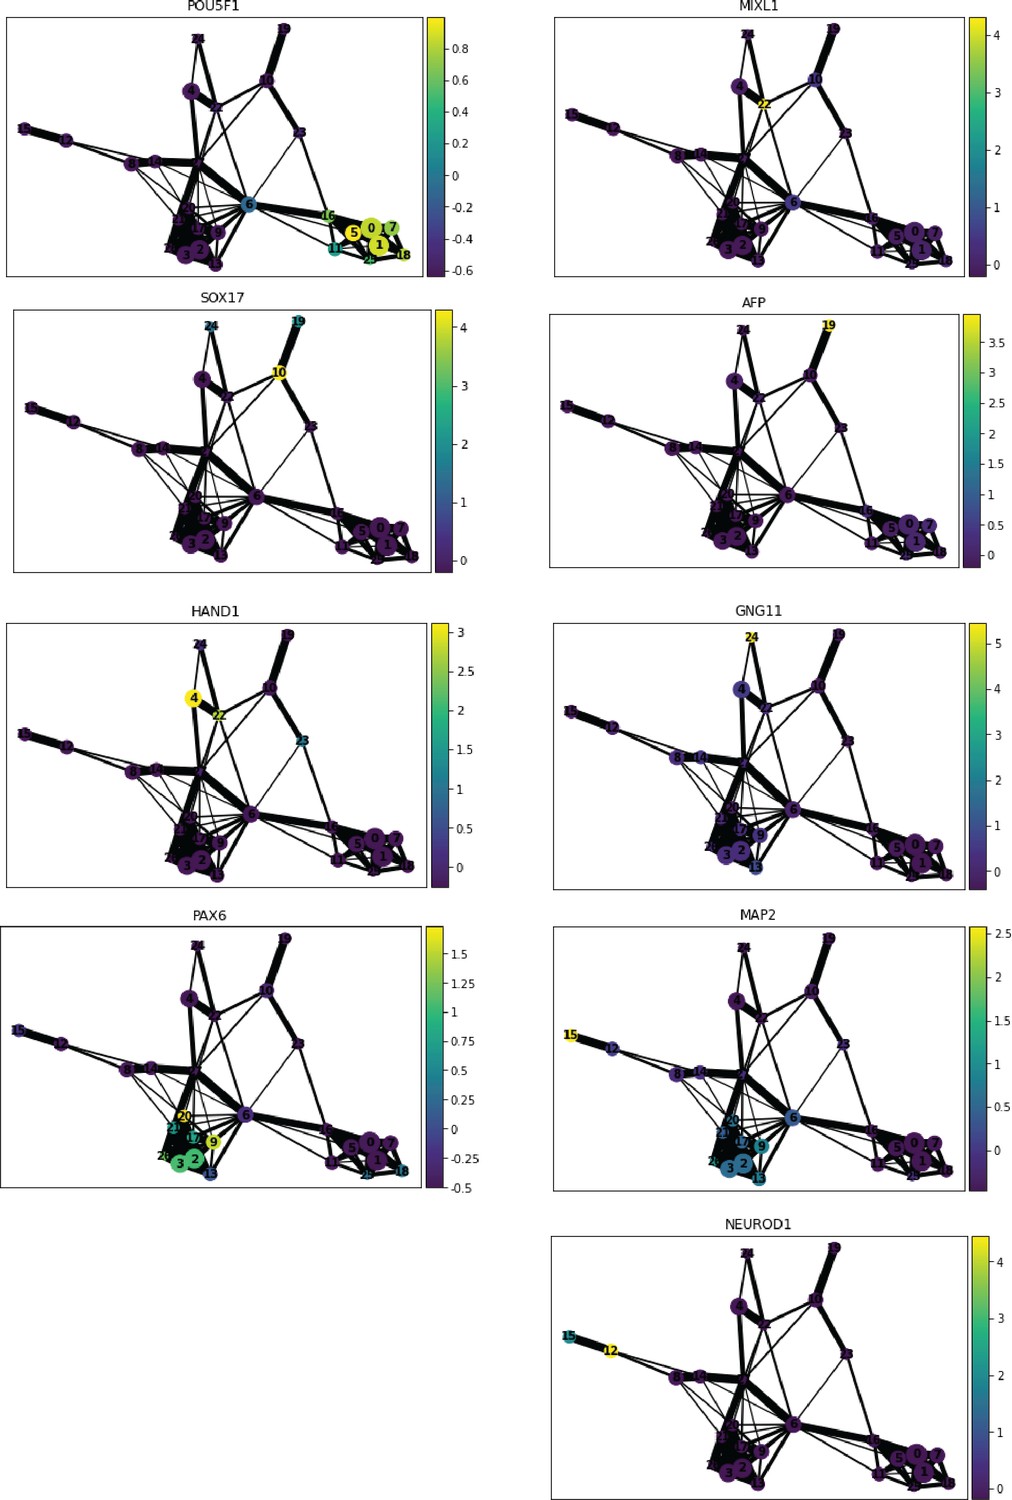
Marker gene expression in Seurat clusters aids tracing of developmental lineages.
PAGA graphs where nodes are colored by normalized expression of marker genes for pluripotency (POU5F1), primitive streak (MIXL1), endoderm (SOX17), hepatocytes (AFP), mesoderm (HAND1), endothelial cells (GNG11), early ectoderm (PAX6), neurons (MAP2 and NEUROD1).
Figure 7—figure supplement 3
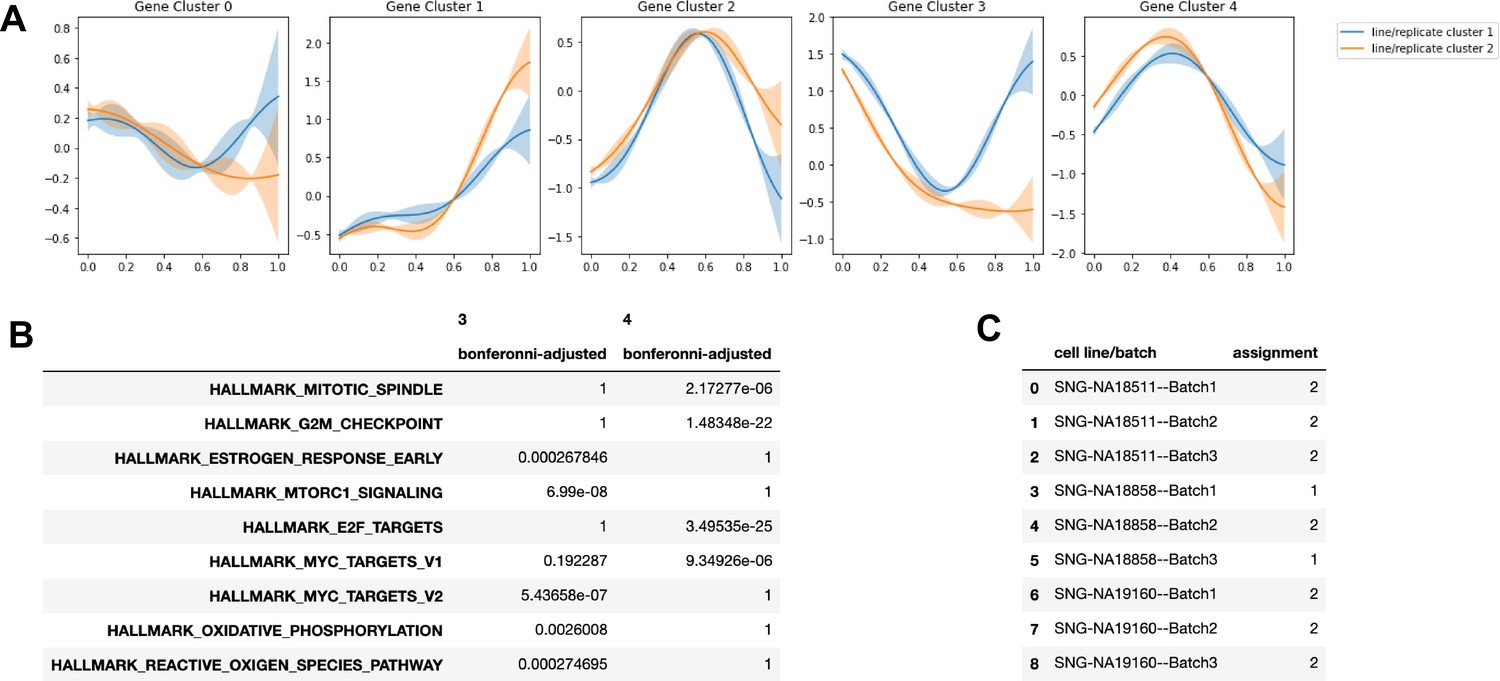
Cluster assignment by Split-GPM and gene set enrichment in the neuronal lineage.
(A) Dynamic expression patterns of identified gene modules in each cluster of replicate-individual samples. (B) Table showing Bonferonni-adjusted p-values from gene set enrichment analysis of gene modules. (C) splitGPM cluster assignments of each individual-batch sample based on shared patterns of dynamic gene expression.
Figure 7—figure supplement 4
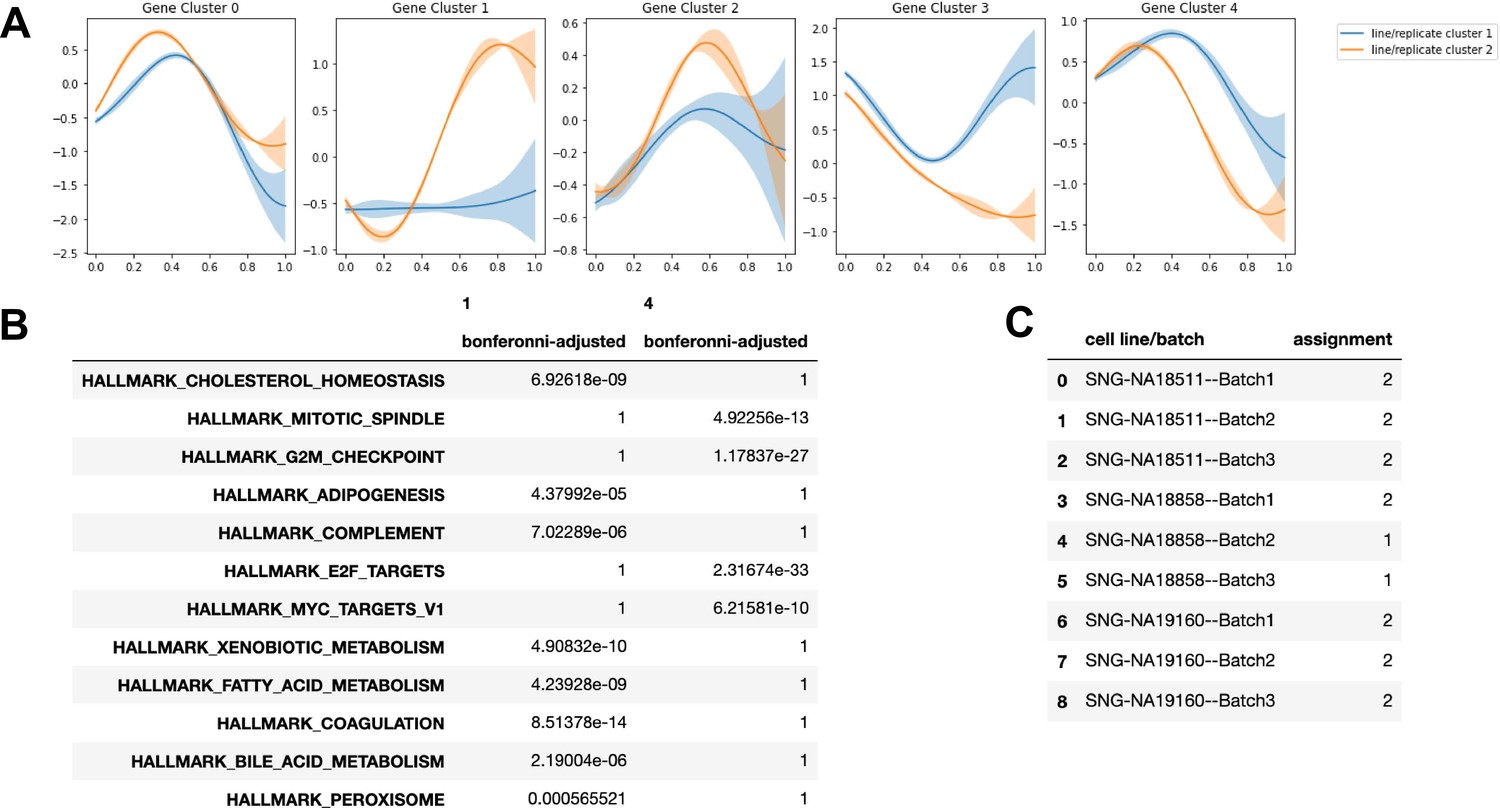
Cluster assignment by Split-GPM and gene set enrichment in the hepatic lineage.
(A) Dynamic expression patterns of identified gene modules in each cluster of replicate-individual samples. (B) Table showing Bonferonni-adjusted p-values from gene set enrichment analysis of gene modules. (C) SplitGPM cluster assignments of each individual-batch sample based on shared patterns of dynamic gene expression.
Figure 7—figure supplement 5
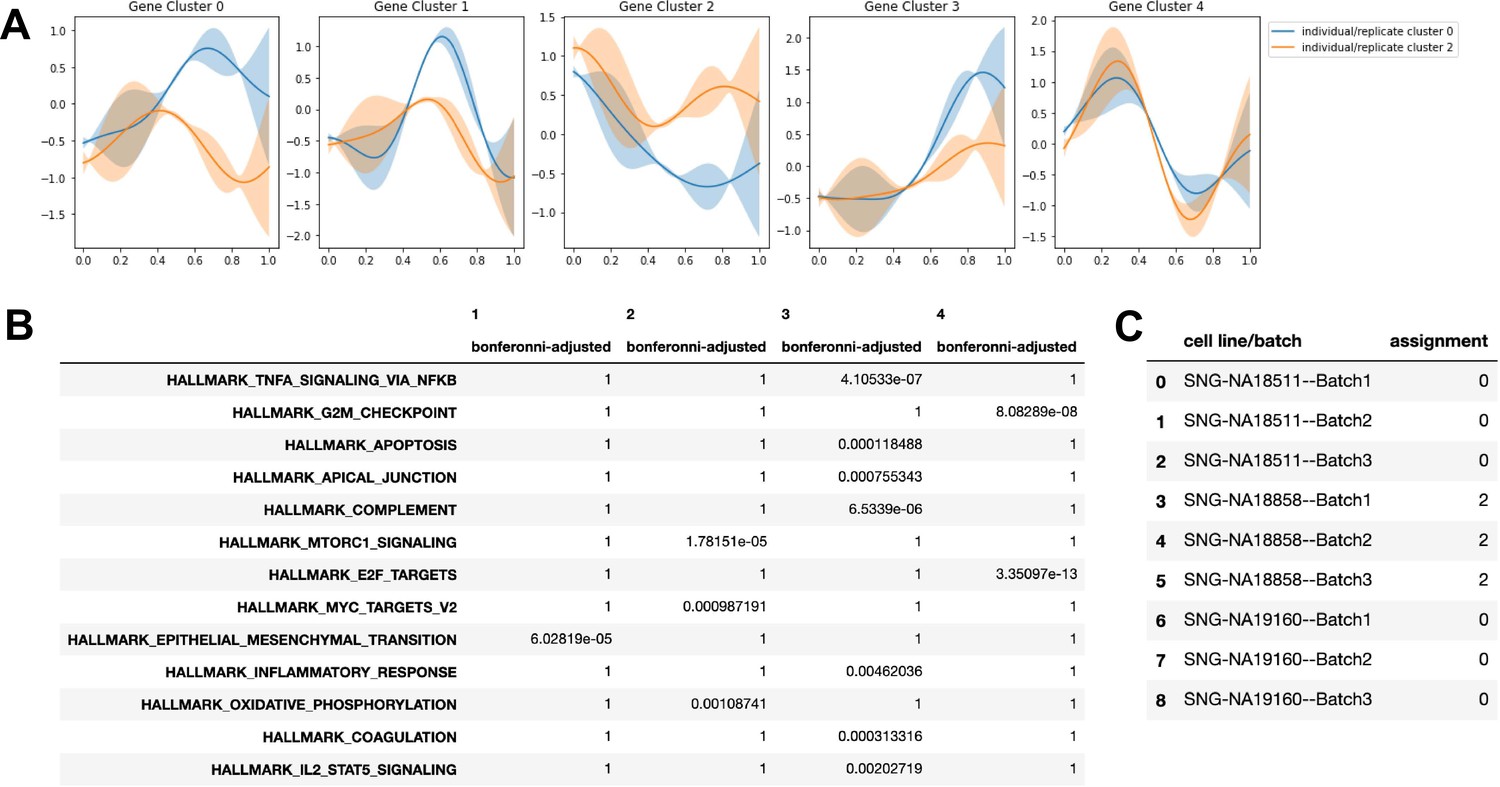
Cluster assignment by Split-GPM and gene set enrichment in the endothelial lineage.
(A) Dynamic expression patterns of identified gene modules in each cluster of replicate-individual samples. (B) Table showing Bonferonni-adjusted p-values from gene set enrichment analysis of gene modules. (C) SplitGPM cluster assignments of each individual-batch sample based on shared patterns of dynamic gene expression.
Author response image 1
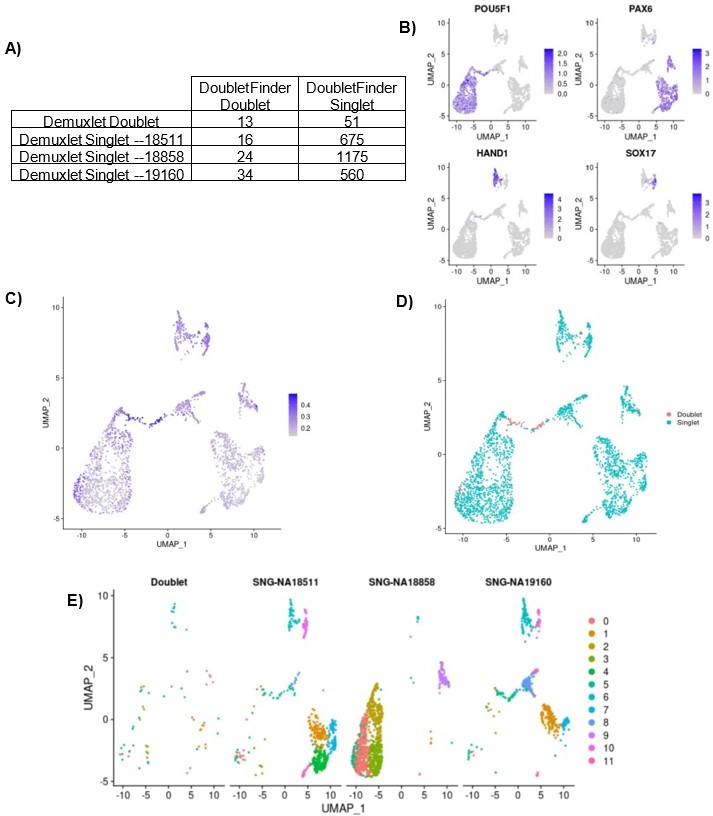
Same-Sample doublet detection test.
(A) Table comparing the demuxlet cell assignments to the DoubletFinder assignments. (B) UMAP plot showing cells colored by normalized expression of marker genes for pluripotency (POU5F1), early ectoderm (PAX6), mesoderm (HAND1), and endoderm (SOX17). (C) UMAP plot showing cells colored by DoubletFinder’s pANN (proportion of artificial k nearest neighbors) metric, where cells with the highest pANN are assigned as doublets based on a given threshold. (D) UMAP plot showing cells colored by DoubletFinder assignment (D) UMAP plots split by cells of each demuxlet assignment and colored by cluster assignment as resolution 0.8.
Tables
Table 1
Classification of Seurat cluster identity (clustering resolution 0.1) based on differential expression of marker genes.
| Cluster (Res. 0.1) | # cells in cluster | Top 10 marker genes by adj. P | Top 10 marker genes by logFC | Annotation |
|---|---|---|---|---|
| 0 | 17,693 | TERF1, PHC1, SEPHS1, UGP2, DPPA4, TBC1D23, JARID2, USO1, ZNF398, LRRC47 | DPPA5, DPPA3, GDF3, NANOG, FGF4, POU5F1, CBR3, PRDM14, DPPA2, TRIML2 | Pluripotent Cells |
| 1 | 14,383 | TPBG, FGFBP3, FZD3, LIX1, SDK2, BTBD17, DACH1, PLAGL1, DEK, ZNF219 | FEZF2, EMX2, LHX2, SOX3, PAX6, WNT7, BARX, SOX1, ZIC1, SIX3 | Early Ectoderm |
| 2 | 3086 | TNNI1, COL6A3, COL5A1, RGS4, ACTA2, TMEM88, DOK4, SLC40A1, HAND2, COL3A1 | RGS13, LUM, TECRL, DCN, HAND1, PITX1, COL3A1, SLN, IGF2, FIBIN | Mesoderm |
| 3 | 2673 | NR2F1, CNP, S100B, EDNRA, FGFBP3, ATP1A2, DNAJC1, ZEB2, PHACTR3, METRN | MPZ, PRSS56, ROPN1, SOX10, S100B, SCRG1, NPR3, MOXD1, TFAP2B, PHACTR3 | Neural Crest |
| 4 | 2368 | S100A16, LGALS3, GATA3, CST3, KRT19, FN1, EPSTI1, DYNLT3, HDHD3, PKP2 | APOA2, CST1, APOA1, APOC3, FGB, RBP4, S100A14, TTR, FGA, APOB | Endoderm |
| 5 | 1990 | TAGLN3, RTN1, NHLH1, STMN2, ELAVL2, FNDC5, PCBP4, ELAVL4, DCX, MLLT11 | NEUROD1, NHLH1, STMN2, NEUROD4, TBR1, STMN4, NEUROG1, SST, ELAVL3, SLC17A6 | Neurons |
| 6 | 295 | EGFL7, GNG11, RAMP2, IGFBP4, PPM1F, RASGRP3, RCSD1, MAP4K2, PLVAP, DOCK6 | PLVAP, CD34, CD93, CDH5, DIPK2B, PECAM1, EMCN, CRHBP, ESAM, ECSCR | Endothelial Cells |
Table 2
Top 15 driver genes of each topic from the k = 6 topic model based on Z-score.
| Topic | Top 15 driver genes |
|---|---|
| k1 | S100A10, FTL, FN1, APOC1, CST3, APOE, SERPINE2, KRT19, CKB, S100A11, LGALS3, TMSB10, S100A16, AFP, PTGR1 |
| k2 | MT-CO2, MT-CO3, MT-CO1, MT-CYB, PRDX1, MT-ND4, MT-ATP6, GSTP1, MT-ND1, RPL8, APOE, RPSA, RPL12, PFN1, HMGA1 |
| k3 | PTMA, NCL, RPL23, SET, HSP90AB1, TPL27A, MT-ND4, L1TD1, SERBP1, TERF1, HSPD1, CENPF, DPPA4, MT-ATP6, UGP2 |
| k4 | S100A10, KRT19, S100A11, VIM, MDK, TMSB10, KRT8, SPARC, COL1A1, FN1, COL1A2, COL6A2, KRT18, TPM1, ANXA2 |
| k5 | TUBA1A, VIM, MARCKSL1, MARCKS, TUBA1B, MAP1B, ID3, CRABP1, PTMS, TMSB10, H1FX, STMN1, CENPV, CRABP2, NUCKS1 |
| k6 | RPS27, VIM, LDHA, GAPDH, IGFBP2, TUBA1A, APOA1, RPL13, TMSB10, S100A10, RPL6, RPL30, RPL9, RPS19, RPL37 |
Key resources table
| Reagent type (species) or resource | Designation | Source or reference | Identifiers | Additional information |
|---|---|---|---|---|
| Cell line (Homo-sapiens) | 18511 | PMID:29208628 | ||
| Cell line (Homo-sapiens) | 19160 | PMID:29208629 | ||
| Cell line (Homo-sapiens) | 18858 | PMID:29208630 | ||
| Cell line (Homo-sapiens) | 18856 | PMID:29208631 | ||
| Cell line (Homo-sapiens) | 18912 | PMID:29208632 | ||
| Cell line (Homo-sapiens) | 19140 | PMID:29208633 | ||
| Cell line (Homo-sapiens) | 19159 | PMID:29208634 | ||
| Cell line (Homo-sapiens) | 19210 | PMID:29208635 |
Additional files
-
Supplementary file 1
Frequency of each cell type present in EB data from lines 18511, 18858, and 19,160 after transferring annotations from the fetal and hESC reference sets.
- https://cdn.elifesciences.org/articles/71361/elife-71361-supp1-v1.xlsx
-
Supplementary file 2
Frequency of each cell type present in EB data from additional lines after transferring annotations from the fetal and hESC reference sets.
- https://cdn.elifesciences.org/articles/71361/elife-71361-supp2-v1.csv
-
Supplementary file 3
Number of cells per cluster (resolution 0.1) from each individual-replicate sample.
- https://cdn.elifesciences.org/articles/71361/elife-71361-supp3-v1.xlsx
-
Supplementary file 4
Limma differential expression results (logFC, AveExpr, t, P.Value, adj.P.Val, B) for all tested genes in each Seurat cluster when clusters were defined at resolution 0.1.
- https://cdn.elifesciences.org/articles/71361/elife-71361-supp4-v1.csv
-
Supplementary file 5
Limma differential expression results (logFC, AveExpr, t, P.Value, adj.P.Val, B) for all tested genes in each Seurat cluster when clusters were defined at resolution 0.5.
- https://cdn.elifesciences.org/articles/71361/elife-71361-supp5-v1.csv
-
Supplementary file 6
Limma differential expression results (logFC, AveExpr, t, P.Value, adj.P.Val, B) for all tested genes in each Seurat cluster when clusters were defined at resolution 0.8.
- https://cdn.elifesciences.org/articles/71361/elife-71361-supp6-v1.csv
-
Supplementary file 7
Limma differential expression results (logFC, AveExpr, t, P.Value, adj.P.Val, B) for all tested genes in each Seurat cluster when clusters were defined at resolution 1.
- https://cdn.elifesciences.org/articles/71361/elife-71361-supp7-v1.csv
-
Transparent reporting form
- https://cdn.elifesciences.org/articles/71361/elife-71361-transrepform1-v1.docx
Download links
A two-part list of links to download the article, or parts of the article, in various formats.
Downloads (link to download the article as PDF)
Open citations (links to open the citations from this article in various online reference manager services)
Cite this article (links to download the citations from this article in formats compatible with various reference manager tools)
Human embryoid bodies as a novel system for genomic studies of functionally diverse cell types
eLife 11:e71361.
https://doi.org/10.7554/eLife.71361


