Megalencephalic leukoencephalopathy with subcortical cysts is a developmental disorder of the gliovascular unit
- Physiology and Physiopathology of the Gliovascular Unit Research Group, Center for Interdisciplinary Research in Biology (CIRB), College de France, CNRS Research in Biology (CIRB), College de France, CNRS, France
- École doctorale Cerveau Cognition Comportement “ED3C” N°158, Pierre and Marie Curie University, France
- Neuroglial Interactions in Cerebral Physiopathology Research Group, Center for Interdisciplinary Research in Biology (CIRB), College de France, Labex Memolife, Université PSL, France
- Normandie University, UNICAEN, INSERM, GIP Cyceron, Institut Blood and Brain, Physiopathology and Imaging of Neurological Disorders, France
- Physics for Medicine Paris, ESPCI Paris, PSL University, France
- Université de Paris, Faculté de Santé, France
- Molecular Control of the Neurovascular Development Research Group, Center for Interdisciplinary Research in Biology (CIRB), College de France, Labex Memolife, Université PSL, France
- Service d’anatomie et cytologie pathologie de l’hôpital Armand Trousseau, France
- Cellular and Molecular Imaging Facility, US25 INSERM, UMS3612 CNRS, Faculty of Pharmacy, University of Paris, France
- Plateforme HistIM Institut Cochin, France
- Biologie du médicament et toxicologie, Assistance Publique – hôpitaux de Paris, APHP, Hôpital Cochin, France
- Unitat de Fisiología, Departament de Ciències Fisiològiques, IDIBELL-Institute of Neurosciences, Universitat de Barcelona, L'Hospitalet de Llobregat, Spain
- Centro de Investigación en Red de Enfermedades Raras (CIBERER), Spain
Figures
Figure 1 with 1 supplement
The absence of MLC1 has no effect on blood–brain barrier integrity or the organization of the endothelial network.
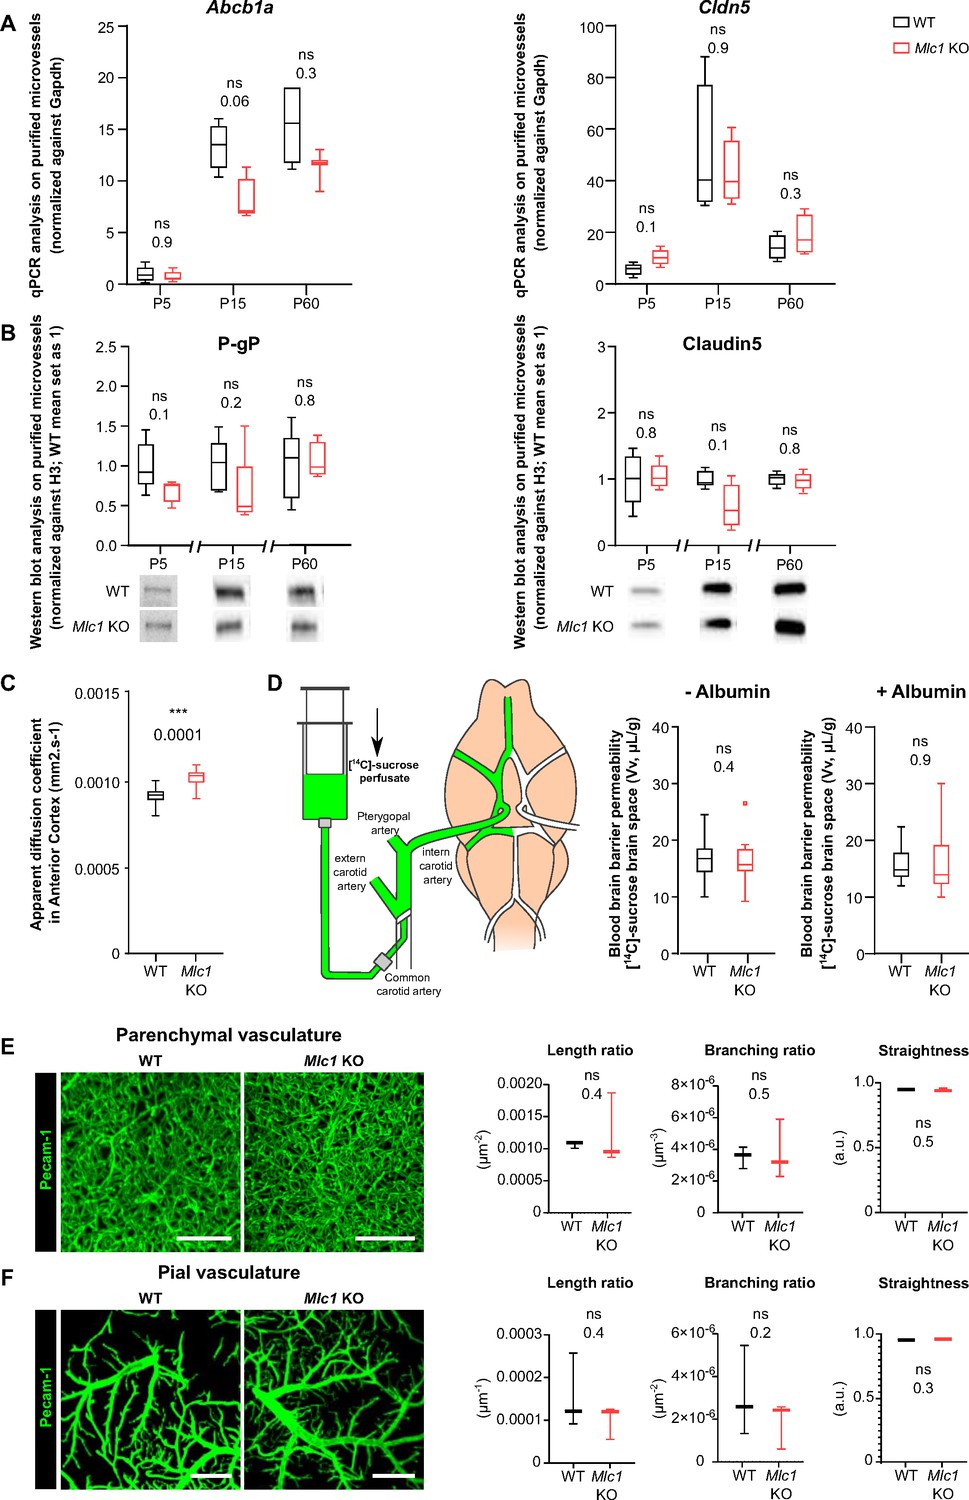
(A) qPCR determination of mRNA expression of Abcb1 (encoding P-gP) and Cldn5 (encoding claudin5) in microvessels purified from WT and Mlc1 KO whole brains on postnatal day (P)5, P15, and P60. Signals were normalized against Gapdh. Groups were compared using a two-tailed Mann–Whitney test. The data are presented as a Tukey box plot (n = 3 or 4 samples per genotype; number of brains pooled per sample: five for P5; three for P15; two for P60). (B) Western blot detection and analysis of P-gP and claudin5 in protein extracts from microvessels purified from WT and Mlc1 KO whole brains on P5, P15, and P60. Signals were normalized against histone H3. Two-tailed Mann–Whitney test. The data are represented in a Tukey box plot (n = 4 or 5 samples per genotype; number of brains pooled per sample: five for P5; three for P15; two for P60). (C) Apparent diffusion coefficient values in the cortex of 2-month-old WT and Mlc1 KO mice. Two-tailed Student’s t-test. The data are represented in a Tukey box plot (n = 7 mice per genotype). (D) Blood–brain barrier integrity, assessed by measuring the brain vascular volume (Vv, in µL/g), after in situ brain perfusion with [14C]-sucrose and a normal hydrostatic vascular pressure (without albumin [Albumin-]; 120 mmHg) or an elevated hydrostatic vascular pressure (with albumin [Albumin+]; 180 mmHg) in 2-month-old WT (in black) and Mlc1 KO mice (in red). Two-tailed Mann–Whitney test. The data are represented in a Tukey box plot (n = 8 WT and 9 Mlc1 KO mice for Albumin -; n = 11 WT and 12 Mlc1 KO mice for Albumin+).(E) Representative 3D images of the endothelial architecture in cleared somatosensory cortex. Parenchymal (Z-stack 320 µm; scale bar: 100 µm) (top) and pial (bottom) vessels (Z-stack 50 µm; scale bar: 500 µm) samples from 2-month-old WT and Mlc1 KO mice, after immunolabeling for Pecam1. (F) A comparative analysis of vessel length, branching, and tortuosity in WT mice (in black) and Mlc1 KO mice (in red) in the parenchymal cortex (top), normalized on sample volume, and cortical surface (bottom), normalized on sample surface. One-tailed Mann–Whitney test. The data are represented in a Tukey box plot (n = 3 mice per genotype). The data are given in Figure 1—source data 1. *p≤0.05, **p≤0.01, ***p≤0.001, and ns: not significant.
-
Figure 1—source data 1
The absence of MLC1 has no effect on blood–brain barrier integrity or the organization of the endothelial network.
- https://cdn.elifesciences.org/articles/71379/elife-71379-fig1-data1-v2.xlsx
Figure 1—figure supplement 1
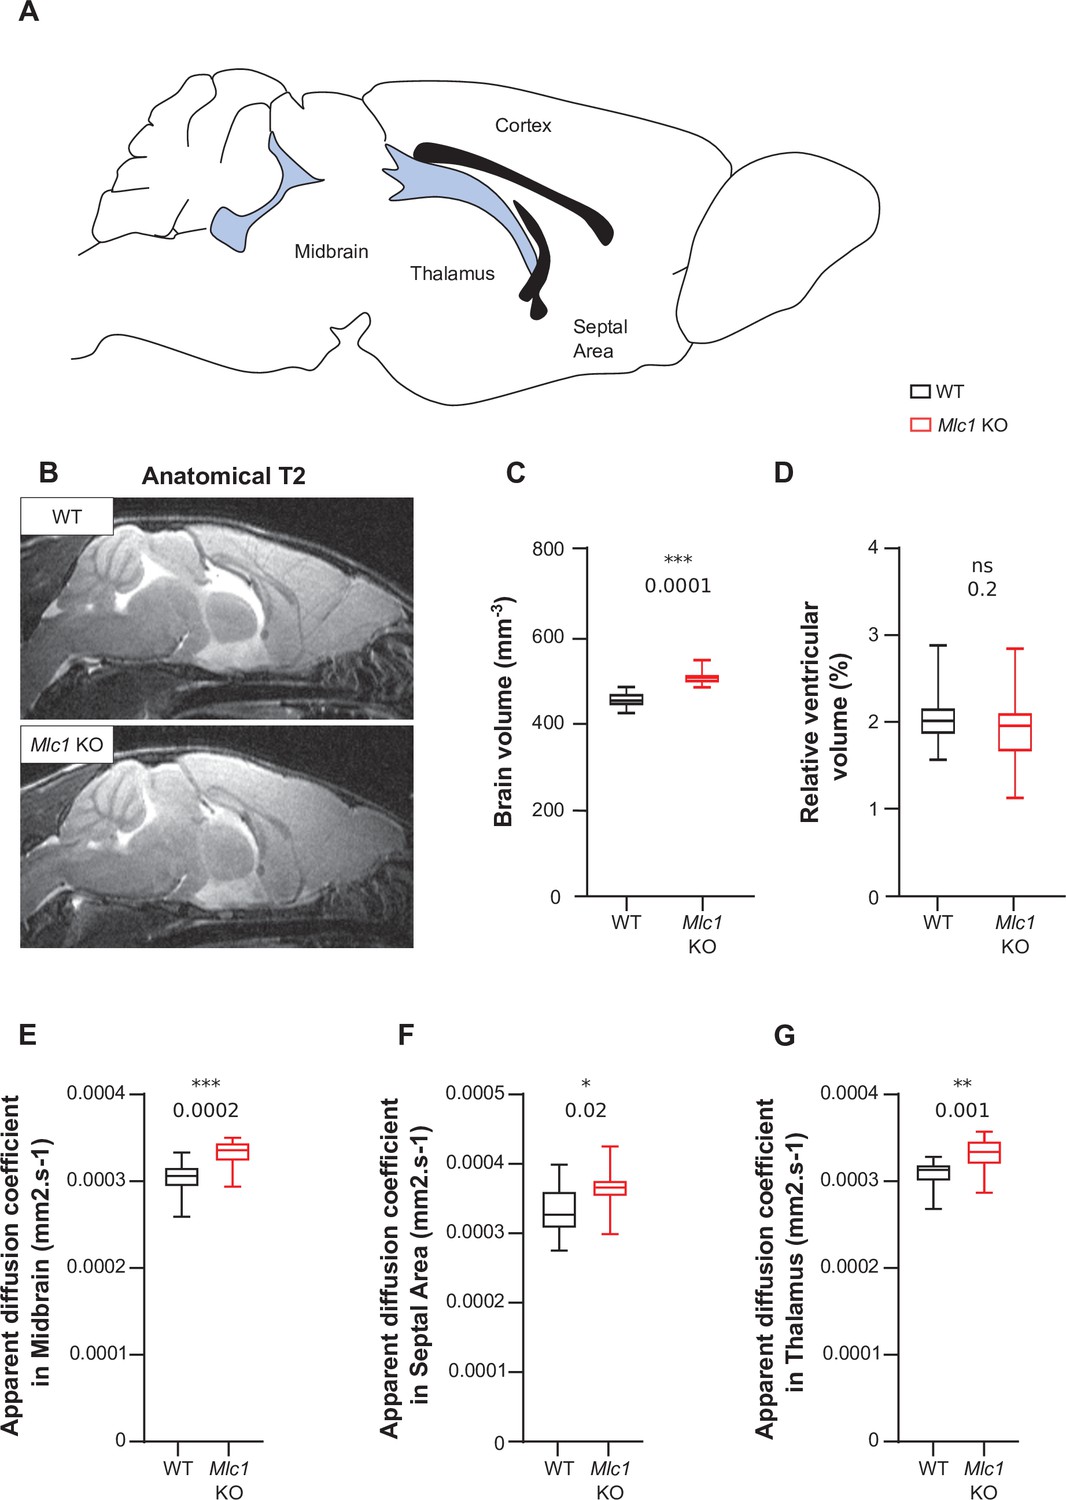
The absence of MLC1 causes overall swelling of the brain.
(A) Schematic representation of a mouse brain. Blue areas indicate the ventricles, and black areas indicate neuronal fiber tracts. (B) Anatomical T2-weighted magnetic resonance images of WT and KO mice. (C, D) Quantification of the brain volume (C) and the ventricles’ relative volume (D), based on magnetic resonance images. (E–G) The apparent diffusion coefficient was calculated for the midbrain (E), septal area (F), and thalamus (G). Two-tailed Student’s t test. The data are represented in a Tukey box plot (n = 7 mice per genotype) and are given in Figure 1—figure supplement 1—source data 1. *p≤0.05, **p≤0.01, ***p≤0.001, and ns: not significant.
-
Figure 1—figure supplement 1—source data 1
The absence of MLC1 causes overall swelling of the brain.
- https://cdn.elifesciences.org/articles/71379/elife-71379-fig1-figsupp1-data1-v2.xlsx
Figure 2
MLC1 is crucial for the molecular maturation of vascular smooth muscle cell contractility.
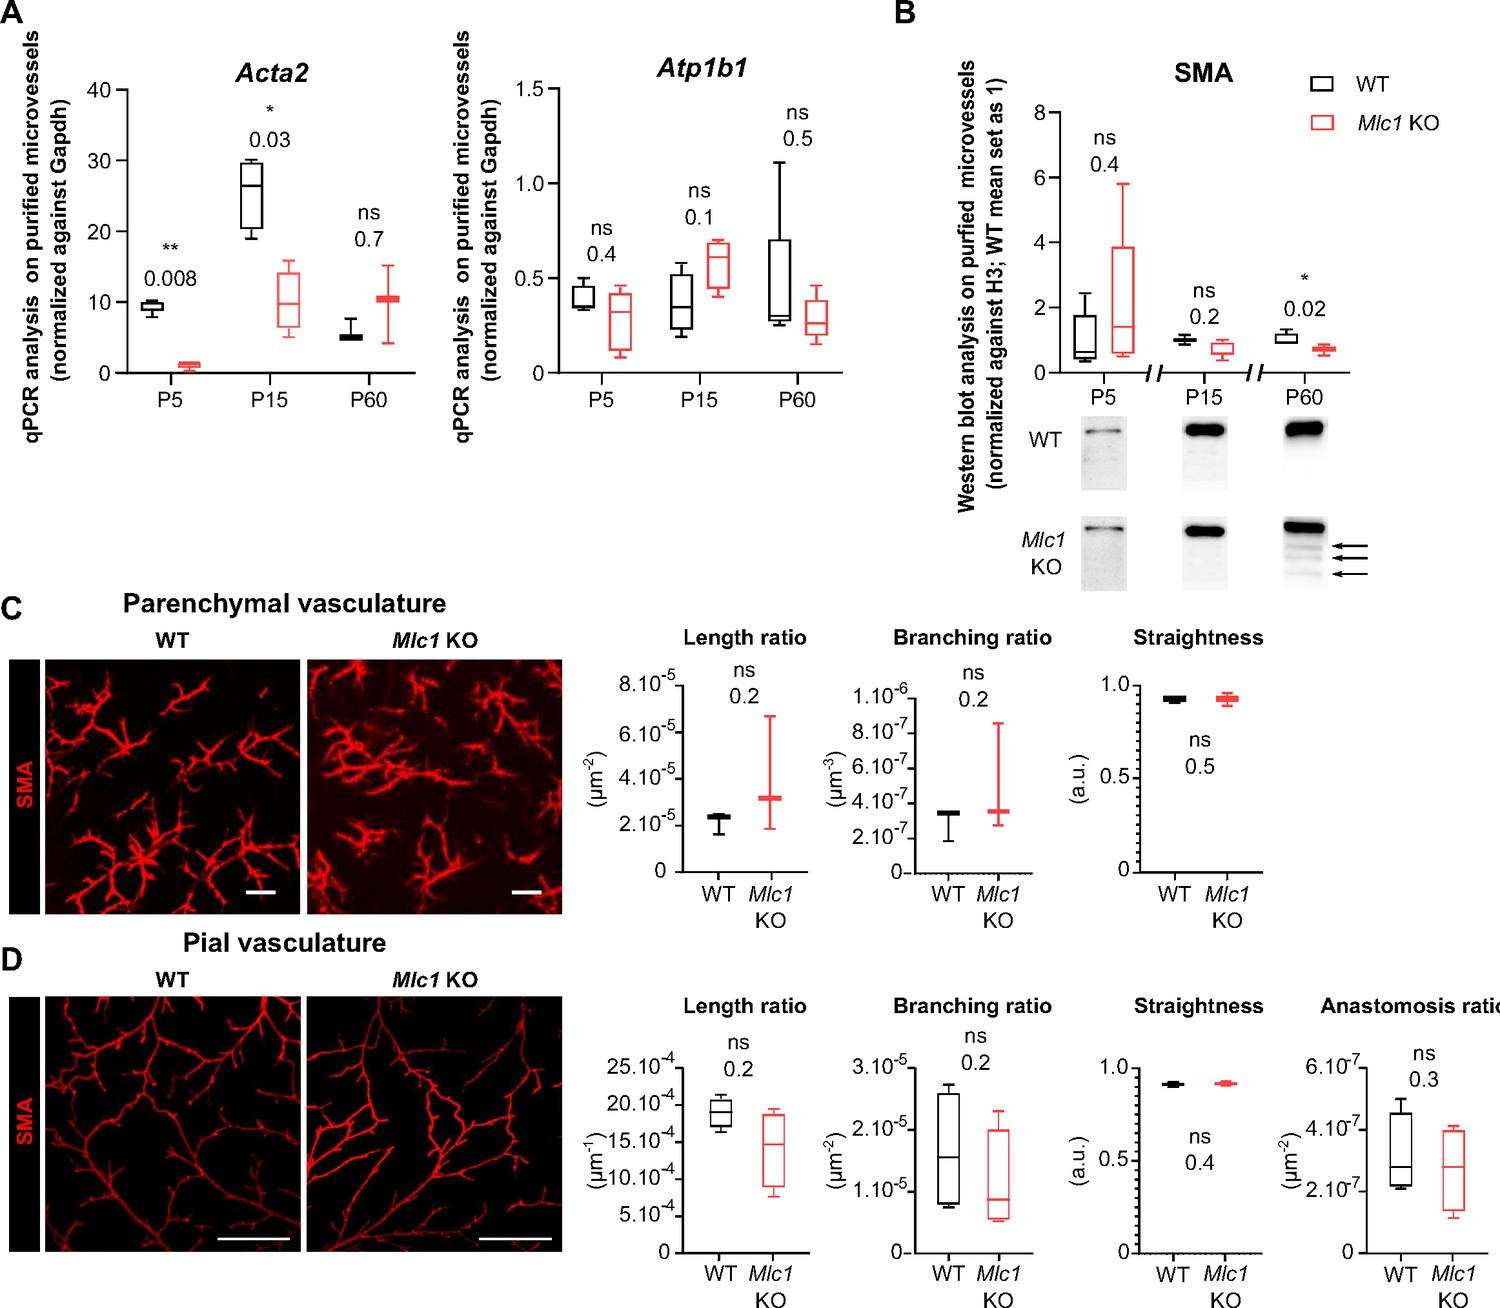
(A) qPCR results for Acta2 (encoding SMA) and Atp1b1 in microvessels purified from WT and Mlc1 KO whole brains on P5, P15, and p60. Signals are normalized against Gapdh. Two-tailed Mann-Whitney test. The data are represented in a Tukey box plot (n = 3 to 5 samples per genotype; number of brains pooled per sample: 5 for P5; 3 for P15; 2 for P60). (B) Western blot detection and analysis of SMA in protein extracts from microvessels purified from WT and Mlc1 KO whole brains on P5, P15, and P60. Arrows indicate abnormally low molecular weight SMA-positive bands. Signals were normalized against histone H3. Two-tailed Mann-Whitney test. The data are represented in a Tukey box plot (n = 4 or 5 samples per genotype; number of brains pooled per sample: 5 for P5; 3 for P15; 2 for P60). (C.D) Representative 3D images of the vascular smooth muscle cell arterial network in cleared somatosensory cortex. Parenchymal (Z stack 600 µm; scale bar: 100 µm) (C) and pial vessels (Z stack 50 µm; scale bar: 500 µm) (D) samples in 2-month-old WT and Mlc1 KO mice after immunolabeling for SMA. Comparative analysis of arterial length, branching, tortuosity, and anastomosis in WT mice (black boxes) and Mlc1 KO mice (red boxes) in the cortical parenchyma (C), normalized on sample volume, and at the cortical surface (D), normalized on sample surface. One-tailed Mann-Whitney test. The data are represented in a Tukey box plot (n = 3 mice per genotype). The data are given in Figure 2—source data 1 *, p ≤ 0.05, **, p ≤ 0.01, ***, p ≤ 0.001, and ns: not significant.
-
Figure 2—source data 1
MLC1 is crucial for the molecular maturation of vascular smooth muscle cell contractility.
- https://cdn.elifesciences.org/articles/71379/elife-71379-fig2-data1-v2.xlsx
Figure 3

MLC1 is crucial for the postnatal acquisition of vascular smooth muscle cell contractility, arterial diameter, and neurovascular coupling.
(A–C) Ex vivo analysis of mean vascular constriction and dilation upon application of U46619 (50 nM) to somatosensory cortical slices from postnatal day (P)5, P15, and P60 WT mice (black traces) and Mlc1 KO mice (red traces). (A) Representative infrared images of a cortical penetrating arteriole constriction in response to bath application of U46619 and dilation upon washing at P60. The vessel lumen is indicated by dotted lines. Scale bar: 10 µm. (B) Contraction and dilation slopes on P5, P15, and P60. 0 min corresponds to the addition of U46619 to the recording chamber medium. The data are presented as the mean ± SEM. (C) Analysis of the amplitude and slope of the contraction. Two-tailed Mann–Whitney test. The data are represented in a Tukey box plot (n = 13 vessels from WT and 13 Mlc1 KO mice on P5; n = 9 vessels from WT and 12 Mlc1 KO mice at P15; n = 8 vessels from WT and 11 Mlc1 KO mice at P60; 3 mice per group). (D) In vivo ultrasound localization microscopy measurement of cortical arterial vessel diameter after intravenous microbubble injection in 2-month-old WT and Mlc1 KO mice. Left: schematic representation of the experiment; middle: cerebrovascular maps of WT and Mlc1 KO mice, showing the arterial (in red) and venous (in blue) velocities in mm/s (scale bar: 0.15 cm); right: measurement of the penetrating arteries’ diameter using ultrasound localization microscopy imaging of an injected microbubbles. The data are represented in a Tukey box plot. Two-tailed Mann–Whitney test (n = 6 WT mice and Mlc1 KO mice each). (E) In vivo functional ultrasound analysis of cerebral blood flow in the somatosensory cortex after whisker stimulation. Left: schematic representation of the experiment (S1bf: bregma –1.5 mm, somatosensory barrel field cortex); middle: functional ultrasound power Doppler signal traces during whisker stimulation of 2-month-old WT mice (in black) and Mlc1 KO mice (in red) mice. Baselines before stimulation are aligned; Right: quantification of the normalized percentage of cerebral blood flow variation following whisker stimulation. Two-tailed Mann–Whitney test. The gray areas around the curves correspond to the SEM (n = 11 WT mice and 12 Mlc1 KO mice). The data are given in Figure 3—source data 1. *p≤0.05, **p≤0.01, ***p≤0.001, and ns: not significant. Data presented in (A–C) are also included in Slaoui et al., 2021. These panels are not available under the terms of a Creative Commons Attribution License, and further reproduction of these images requires permission from the copyright holder.
© 2021, Slaoui et al. Data presented in A-C are also included in Slaoui et al., 2021. These panels are not available under the terms of a Creative Commons Attribution License, and further reproduction of these images requires permission from the copyright holder.
-
Figure 3—source data 1
MLC1 is crucial for the postnatal acquisition of vascular smooth muscle cell contractility, arterial diameter, and neurovascular coupling.
- https://cdn.elifesciences.org/articles/71379/elife-71379-fig3-data1-v2.xlsx
Figure 4
The absence of MLC1 alters the molecular maturation of the perivascular astrocytic processes.
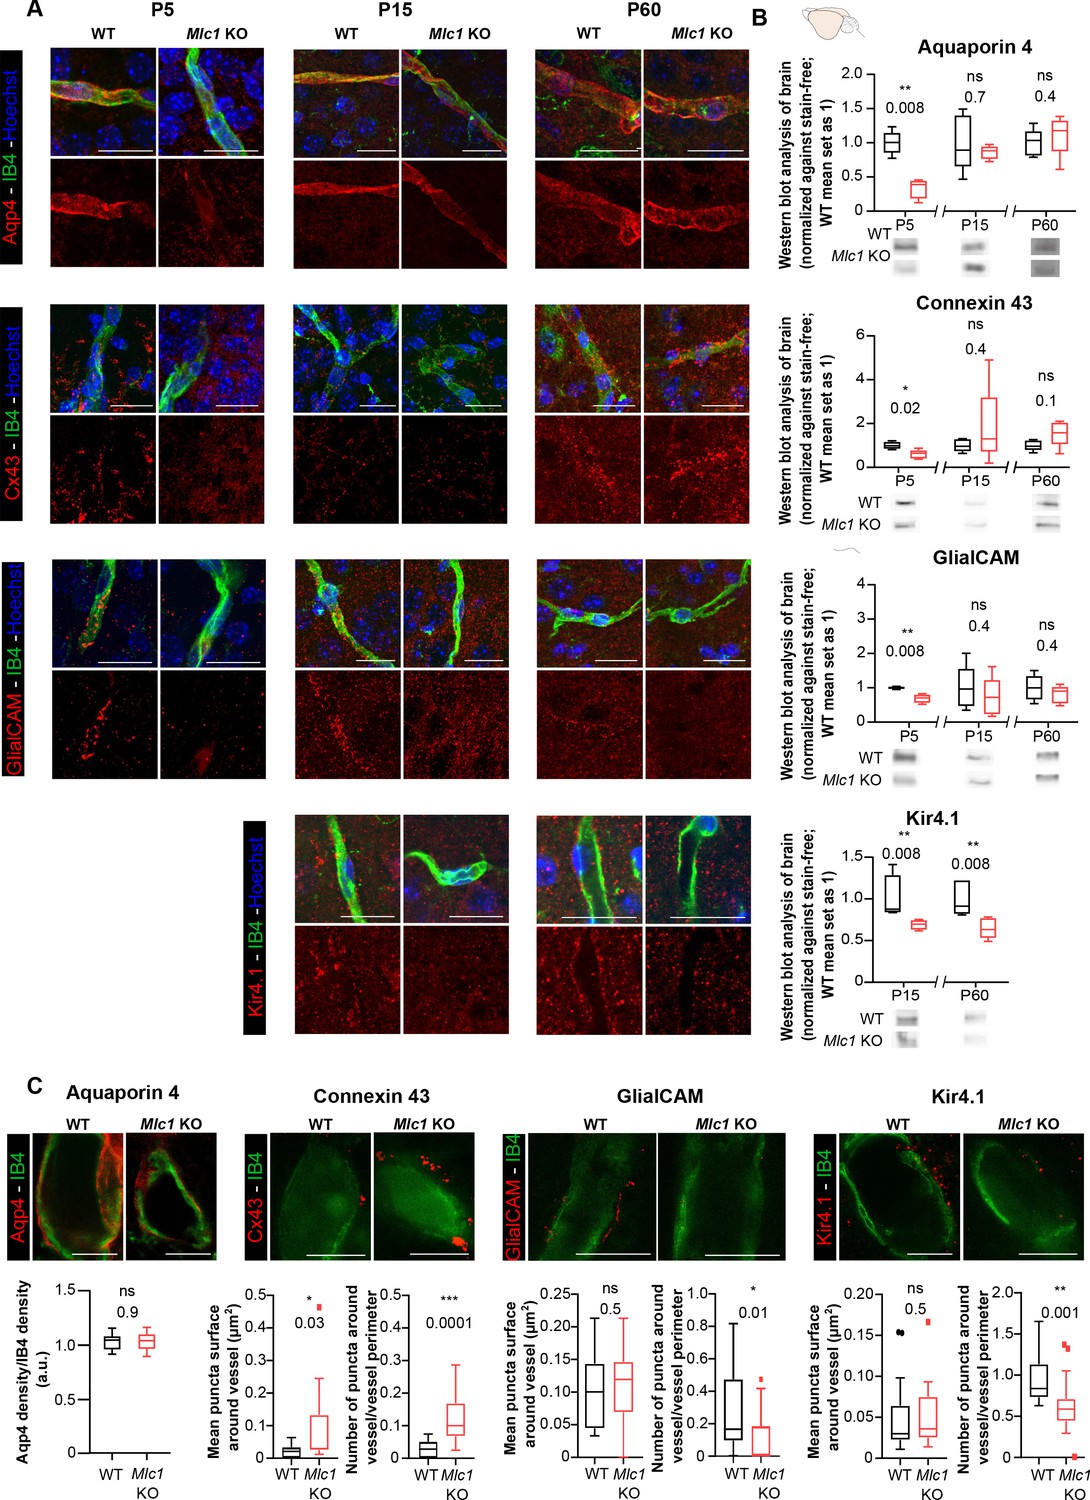
(A) Representative confocal projection images of the immunofluorescent detection of Aqp4, Cx43, GlialCAM, and Kir4.1 (in red) on brain cortex sections from WT and Mlc1 KO mice on postnatal day (P)5 (except for Kir4.1), P15, and P60. Vessels were stained with isolectin B4 (IB4) (in green), and nuclei were stained with Hoechst dye (in blue). Scale bar: 20 µm. (B) Western blot detection and analysis of Aqp4, Cx43, GlialCAM, and Kir4.1 in whole-brain protein extracts from WT and Mlc1 KO mice on P5 (except for Kir4.1), P15, and P60. Two-tailed Mann–Whitney test. The data are represented in a Tukey box plot (for whole brain: n = 5 samples per genotype [one mouse per sample]). (C) Representative stimulated emission depletion (STED) images and quantification of the immunofluorescent detection of Aqp4, Cx43, GlialCAM, and Kir4.1 (in red) on brain cortex sections from WT and Mlc1 KO mice on P60. Vessels were stained with IB4 (in green). Intravascular diffusion of the IB4 fluorescence is an artifact of STED. Scale bar: 5 µm. Two-tailed Mann–Whitney test. The data are represented in a Tukey box plot (aquaporin 4: n = 18 Mlc1 KO vessels; n = 18 WT vessels; n = 3 mice per genotype; connexin 43: n = 15 Mlc1 KO vessels; n = 15 WT vessels; n = 3 mice per genotype; GlialCAM: n = 14 Mlc1 KO vessels; n = 14 WT vessels; n = 3 mice per genotype; Kir4.1: n = 18 Mlc1 KO vessels; n = 17 WT vessels; n = 3 mice per genotype). The data are given in Figure 4—source data 1. *p≤0.05, **p≤0.01, ***p≤0.001, and ns: not significant.
-
Figure 4—source data 1
The absence of MLC1 alters the molecular maturation of the perivascular astrocytic processes.
- https://cdn.elifesciences.org/articles/71379/elife-71379-fig4-data1-v2.xlsx
Figure 5

The absence of MLC1 alters the perivascular cohesiveness of astrocytic processes.
(A, B) Western blot detection and analysis of Aqp4 (A) and NF-M (B) in protein extracts from microvessels purified from WT and Mlc1 KO whole brains on postnatal day (P)60 (see Figure 4C for Aqp4 detection in whole brain on P60). The signals were normalized against stain-free membranes. Two-tailed Mann–Whitney test. The data are represented in a Tukey box plot (n = 5 samples per genotype [two mice per microvessels sample]). (C, D) Representative confocal projection images of the immunofluorescent detection and quantification of Aqp4 (C) and NF-M (D) (in red) on microvessels purified from WT and Mlc1 KO whole brain on P60. Vessels were stained with isolectin B4 (IB4) (in green). Scale bar: 20 µm. Two-tailed Mann–Whitney test. The data are represented in a Tukey box plot (aquaporin 4: n = 17 Mlc1 KO images; n = 22 WT images; n = 3 mice per genotype; NF-M: n = 15 Mlc1 KO images; n = 16 WT images; n = 3 mice per genotype; each image shows between 1 and 4 vessels). The data are given in Figure 5—source data 1. *p≤0.05, **p≤0.01, ***p≤0.001, and ns: not significant. (E) Schematic interpretation of the data. In Mlc1 KO mice, the perivascular astrocytic processes (in green) and neuronal associated fibers (in red) are lost during the microvessel purification process (basal lamina in yellow, mural cells in brown, EC in blue). MLC1 is represented by pink dots in the WT.
-
Figure 5—source data 1
The absence of MLC1 alters the perivascular cohesiveness of astrocytic processes.
- https://cdn.elifesciences.org/articles/71379/elife-71379-fig5-data1-v2.xlsx
Figure 6 with 1 supplement

The absence of MLC1 alters the postnatal development and maintenance of astrocyte morphology and polarity.
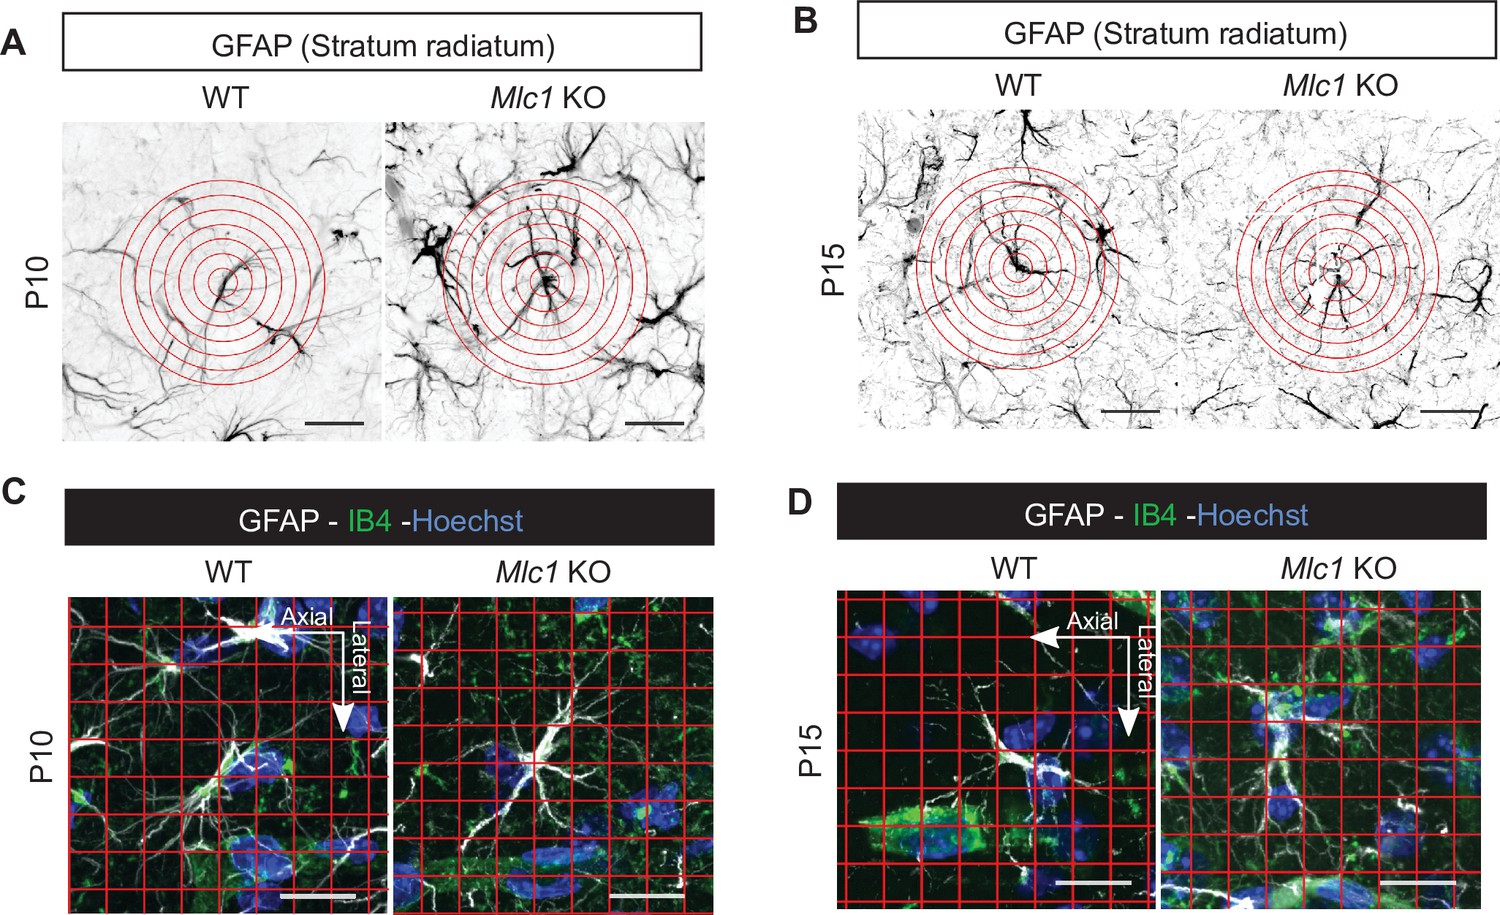
(A) A Sholl analysis of the ramification of hippocampal CA1 astrocytes immunolabeled for GFAP (in black) in WT and Mlc1 KO postnatal day (P)60 mice. The concentric circles start from the astrocyte’s soma. Scale bar: 20 µm. A two-way analysis of variance, followed by a Bonferroni post hoc test. The data are presented as the median± quartiles. (n = 48 Mlc1 KO cells; n = 44 WT cells; n = 3 mice per genotype). (B) Grid baseline analysis of the orientation of the GFAP-immunolabeled astrocytic processes (in white) toward vessels labeled with isolectin B4 (in green) in WT and Mlc1 KO P60 mice. The nuclei were labeled with Hoechst dye (in blue). Scale bar: 20 µm. The polarity index is the ratio between axial GFAP contacts and lateral GFAP contacts. A polarity index of 1 means that there is no polarity. Two-tailed Mann–Whitney test. The data are represented in a Tukey box plot (n = 41 Mlc1 KO cells; n = 41 WT cells; 3 mice per genotype). (C) Grid baseline analysis of the orientation of the GFAP-immunolabeled astrocytic processes (in white) toward the hippocampal pyramidal cell layer in WT and Mlc1 KO P60 mice. The nuclei were labeled with Hoechst dye (in blue). Scale bar: 20 µm. The polarity index is the ratio between axial GFAP contacts and lateral GFAP contacts. A polarity index of 1 means that there is no polarity. Two-tailed Mann–Whitney test. The data are represented in a Tukey box plot (n = 52 Mlc1 KO cells; n = 47 WT cells; 3 mice per genotype). (D–F) Quantitative analyses of astrocyte ramification on P10 (D) and P15 (F). A two-way analysis of variance, followed by a Bonferroni post hoc test (P10: n = 53 Mlc1 KO cells; n = 49 WT cells; n = 3 mice per genotype; P15: n = 51 Mlc1 KO cells; n = 50 WT cells; n = 3 mice per genotype). See Figure 6—figure supplement 1 for representative images. (E–G) Quantitative analysis of astrocyte process orientation toward vessels on P10 (E) and P15 (G). See Figure 6—figure supplement 1 for representative images. The polarity index is the ratio between axial GFAP contacts and lateral GFAP contacts. A polarity index of 1 means that there is no polarity. Two-tailed Mann–Whitney test. The data are represented in a Tukey box plot (P10: n = 35 Mlc1 KO cells; n = 26 WT cells; n = 3 mice per genotype; P15: n = 48 Mlc1 KO cells; n = 46 WT cells; n = 3 mice per genotype). The data are given in Figure 6—source data 1. *p≤0.05, **p≤0.01, ***p≤0.001, and ns: not significant.
-
Figure 6—source data 1
The absence of MLC1 alters the postnatal development and maintenance of astrocyte morphology and polarity.
- https://cdn.elifesciences.org/articles/71379/elife-71379-fig6-data1-v2.xlsx
Figure 6—figure supplement 1
The absence of MLC1 alters the postnatal development of astrocyte morphology and polarity.
(A, B) Representative images from the Sholl analysis of astrocyte ramification in WT and Mlc1 KO mice on postnatal day (P)10 (A) and P15 (B). The concentric circles start from the astrocyte’s soma. Scale bar: 20 µm. (C–, D) Representative images from the grid analysis of astrocyte polarity toward vessels in WT and Mlc1 KO on P10 (C) and P15 (D). Scale bar: 20 µm.
Figure 7 with 2 supplements
The absence of MLC1 impacts the organization and development of the gliovascular unit.
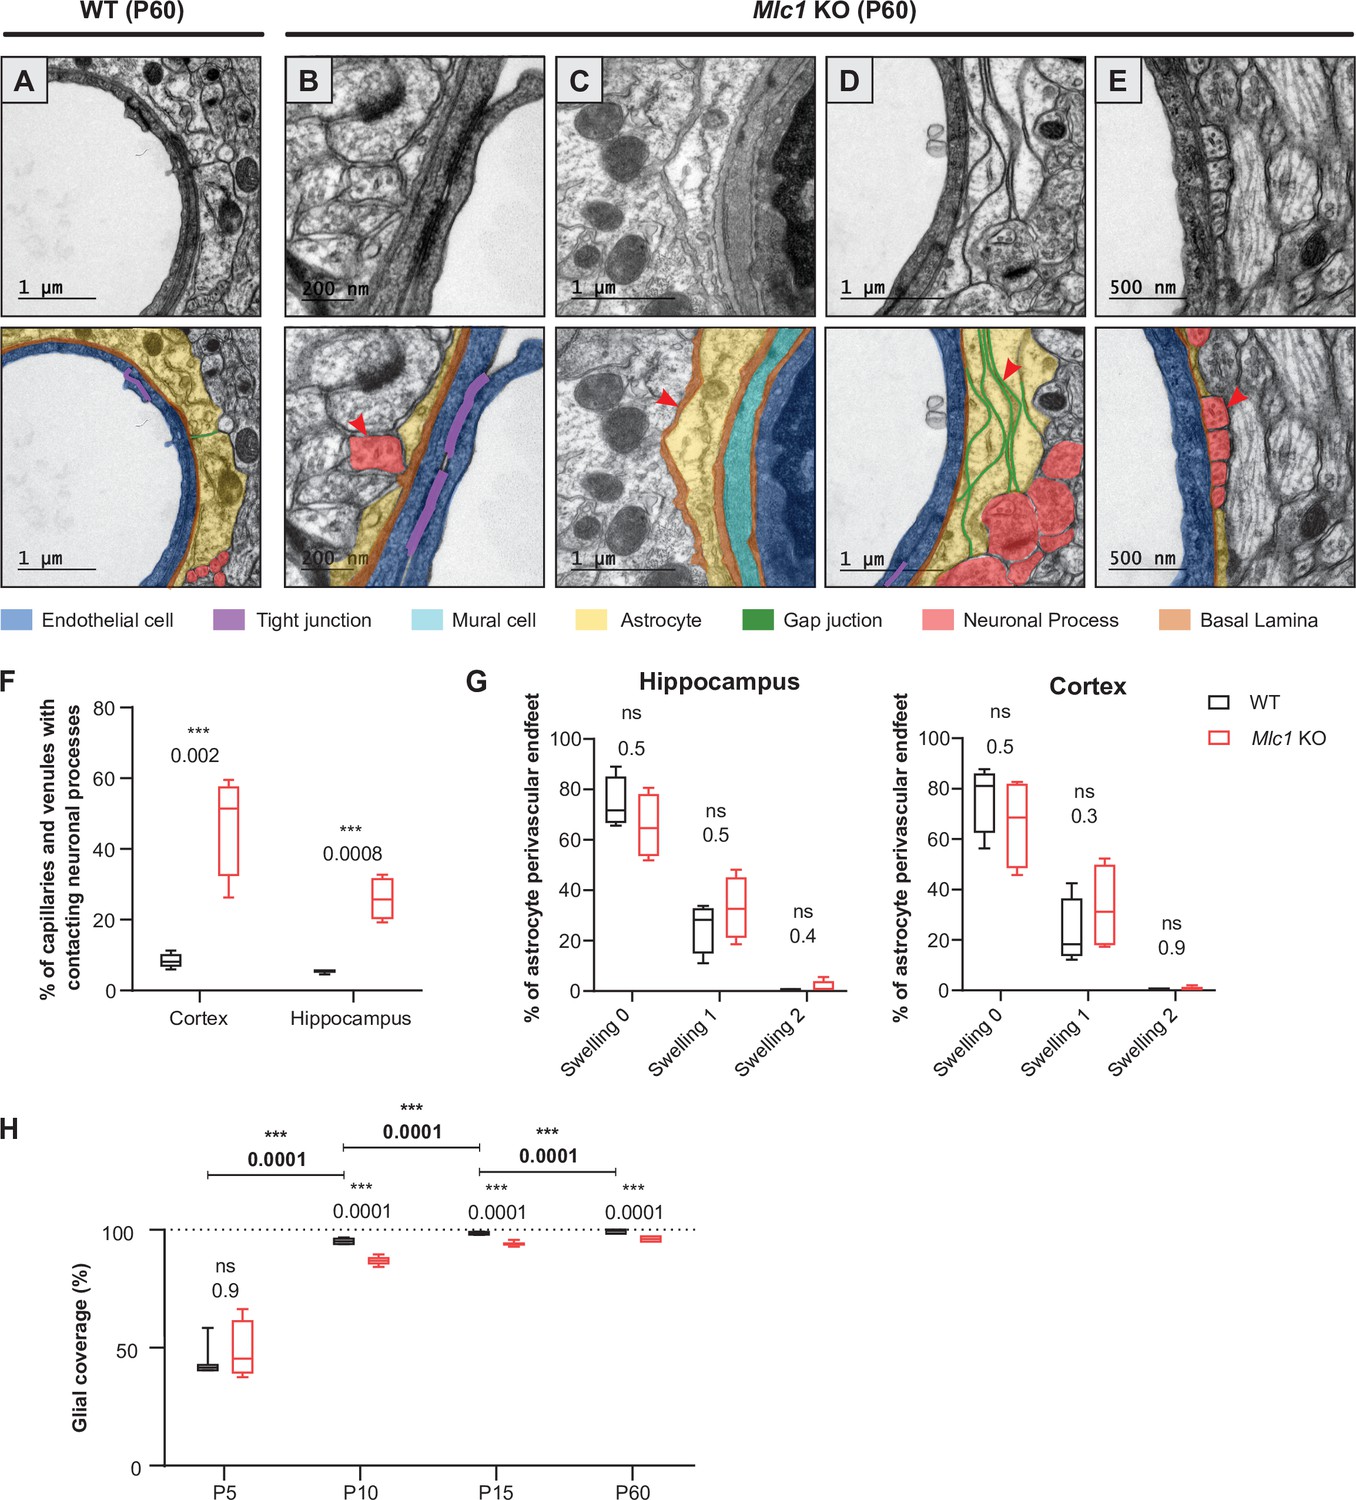
(A–E) Representative transmission electron microscopy images of the gliovascular unit in the hippocampus of postnatal day (P)60 WT and Mlc1 KO mice (n = 3 mice per genotype). Images are presented in pairs, with artificial colors in the lower panel: perivascular astrocytic processes in yellow, gap junctions in green, axons or synapses in red, mural cells in light blue, endothelial cells in dark blue, the basal lamina in brown, and tight junctions in purple. (A) In WT mice, perivascular astrocytic processes fully cover endothelial cells linked by a tight junction and surrounded by a continuous basal lamina. (B–E) Data from Mlc1 KO mice. (B) Perivascular astrocytic processes are separated by an axon, which contacts the endothelial basal lamina (red arrowhead). (C) A perivascular astrocytic process is surrounded by the basal lamina (red arrowhead). (D) Several perivascular astrocytic processes are stacked on top of each other and are linked by extended gap junctions (red arrowhead). (E) Perivascular astrocytic processes are separated by four axons (red arrowhead), which are in direct contact with the vascular basal lamina. (F) Quantification of capillaries and venules contacted by neural processes (axons or synapses) in P60 mice. Two-tailed Student’s t-test. The data are represented in a Tukey box plot (n = 399 Mlc1 KO cortical vessels; n = 301 Mlc1 KO hippocampal vessels; n = 286 WT cortical vessels; n = 287 WT hippocampal vessels; n = 3 mice per genotype). (G) Percentage of vessels contacted by a normal perivascular astrocytic process (swelling = 0), a moderately swollen perivascular astrocytic process (swelling = 1), or an edematous perivascular astrocytic process (swelling = 2) in the hippocampus and cortex of P60 mice. Two-tailed Mann–Whitney test. The data are represented in a Tukey box plot (n = 399 Mlc1 KO cortical vessels; n = 301 Mlc1 KO hippocampal vessels; n = 286 WT cortical vessels; n = 287 WT hippocampal vessels; n = 3 mice per genotype). (H) Percentage of the vessel diameter covered by perivascular astrocytic processes in the cortex of WT and Mlc1 KO mice on P5, P10, P15, and P60. Two-tailed Mann–Whitney test. The data are represented in a Tukey box plot (n = 46 vessels from WT mice and 68 Mlc1 KO mice on P5, n = 3 mice per genotype; n = 121 vessels from WT mice and 81 Mlc1 KO mice on P10, n = 3 mice per genotype; n = 207 vessels from WT mice and 144 Mlc1 KO mice at P15, n = 4 mice per genotype; n = 143 vessels from WT mice and 134 Mlc1 KO mice at P60, n = 3 mice per genotype). Representative transmission electron microscopy images of the gliovascular interface in the cortex of WT and Mlc1 KO mice on P10 and P15 are presented in Figure 7—figure supplement 1. The data are given in Figure 7—source data 1. *p≤0.05, **p≤0.01, ***p≤0.001, and ns: not significant.
-
Figure 7—source data 1
The absence of MLC1 impacts the organization and development of the gliovascular unit.
- https://cdn.elifesciences.org/articles/71379/elife-71379-fig7-data1-v2.xlsx
Figure 7—figure supplement 1
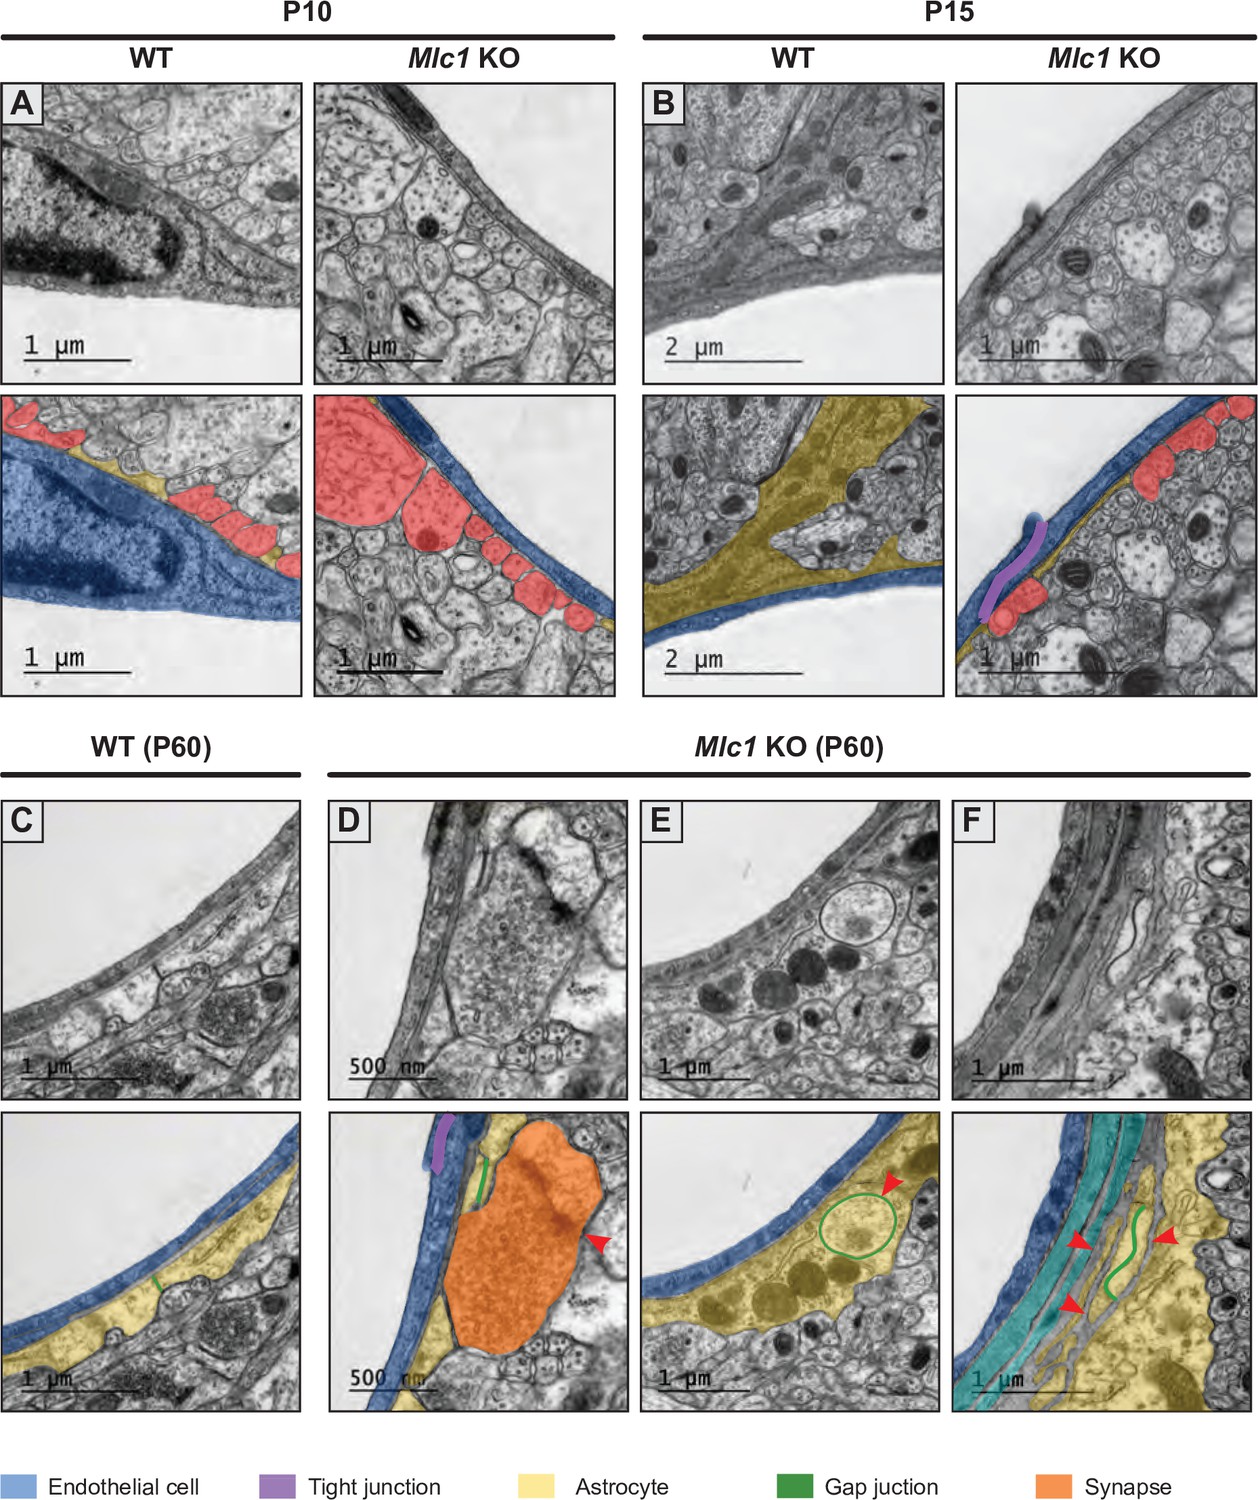
Examples of changes in the architecture of the gliovascular unit in Mlc1 KO mice.
(A, B) Representative transmission electron microscopy images of the gliovascular unit in the cortex of postnatal day (P)10 (A) and P15 (B) WT mice and Mlc1 KO mice. On P10, the astrocytic perivascular coverage is incomplete in WT and Mlc1 KO mice. On P15, more neuronal fibers contact endothelial cells in Mlc1 KO mice (see quantifications in Figure 7 and Figure 7—source data 1). (C–F) Representative transmission electron microscopy images of the gliovascular unit in the cortex of 2-month-old P60 WT mice (C) and Mlc1 KO mice (D–F). A WT sample showing continuous coverage by perivascular astrocytic processes around an endothelial cell (C). The perivascular astrocytic processes are linked by gap junctions. In Mlc1 KO mice, a synapse contacts the endothelial basal lamina (red arrowhead) (D), a perivascular astrocytic process interdigitates into another perivascular astrocytic process and forms a large annular gap junction (red arrowhead) (E), stacked perivascular astrocytic processes surrounded by basal lamina (arrowhead) (F). Images are presented in pairs, with artificial colors in the lower panel: perivascular astrocytic processes are shown in yellow, with gap junctions in green, synapses in orange, endothelial cells in dark blue, mural cells in light blue, and tight junctions in purple.
Figure 7—figure supplement 2
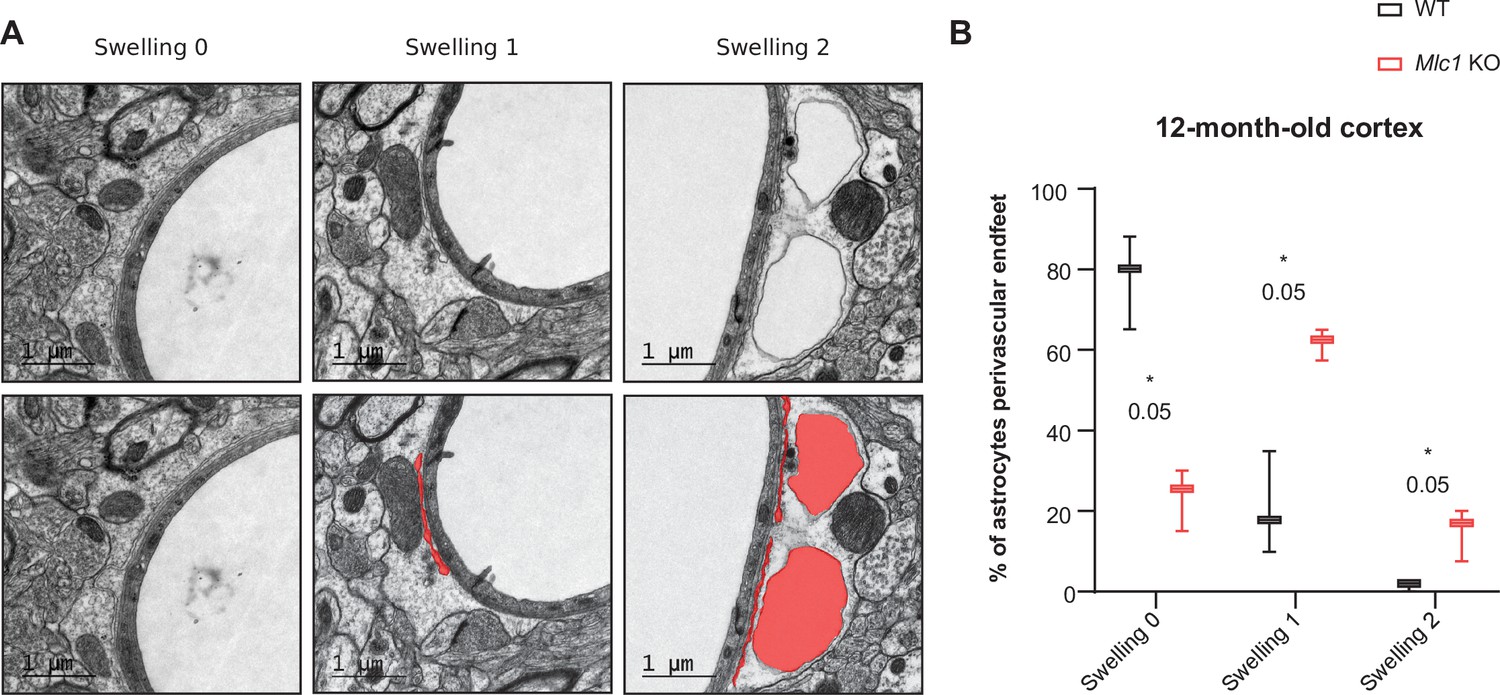
Astrocytic perivascular endfeet are swollen in 1-year-old Mlc1 KO mice.
(A) Representative transmission electron microscopy images of the gliovascular unit in the cortex of 1-year-old Mlc1 KO mice (n = 3 mice per genotype). Three phenotypes are observed: normal perivascular astrocytic process (swelling = 0); moderately swollen perivascular astrocytic process (swelling = 1); edematous perivascular astrocytic process (swelling = 2). Images are presented in pairs, with perivascular astrocytic process’ swollen areas in red (B). Comparative quantification in Mlc1 KO mice. Two-tailed Mann–Whitney test. The data are represented in a Tukey box plot (n = 314 Mlc1 KO cortical vessels; n = 328 WT cortical vessels; n = 3 mice per genotype) and given in Figure 7—figure supplement 2—source data 1. *p=0.05.
-
Figure 7—figure supplement 2—source data 1
Astrocytic perivascular endfeet are swollen in 1-year-old Mlc1 KO mice.
- https://cdn.elifesciences.org/articles/71379/elife-71379-fig7-figsupp2-data1-v2.xlsx
Figure 8
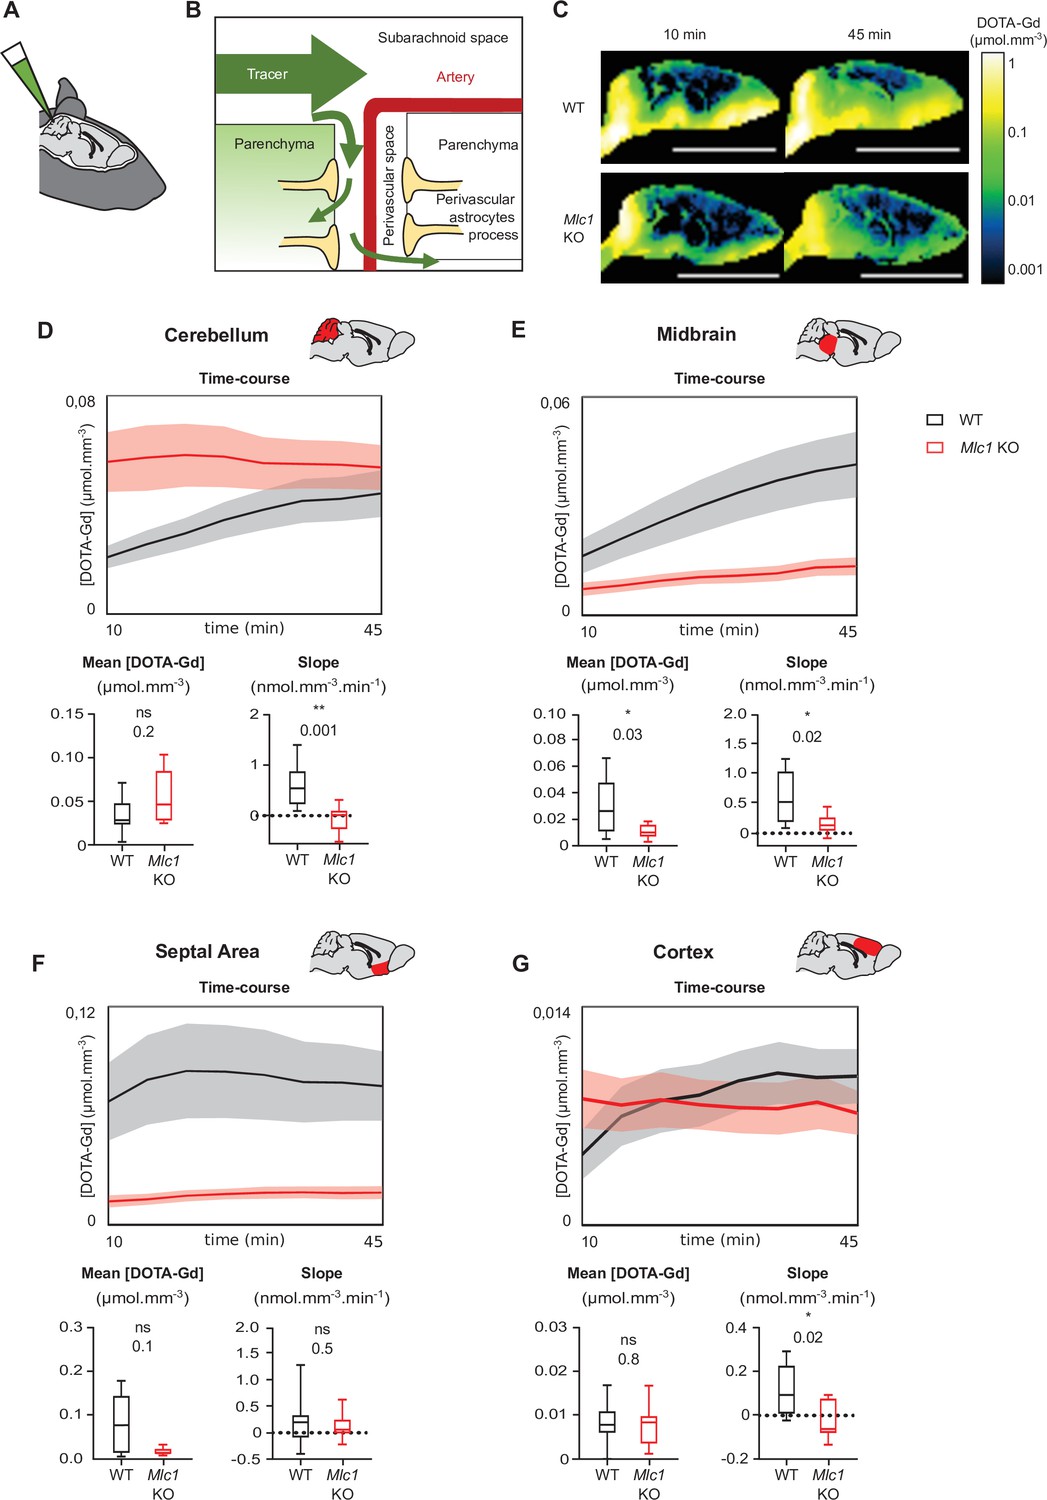
Contrast-enhanced magnetic resonance imaging reveals a low level of tracer dispersion from the cerebrospinal fluid (CSF) into the parenchyma in Mlc1 KO mice.
(A, B) Schematic representation of injecting 1 µL DOTA-Gd into the mouse’s CSF through the cisterna magna (A) and the disperse of the tracer through the brain into the subarachnoid space before entering the deep parenchyma through the perivascular spaces (B). (C) Quantitative contrast maps in WT and Mlc1 KO mice, 10 and 45 min after contrast injection (scale bar: 1 cm). (D–G) Based on the dynamic acquisitions, the changes over time in contrast agent concentration were extracted, and the mean contrast concentration and the contrast slope were calculated for the cerebellum (D), midbrain (E), septal area (F), and cortex (G). Two-tailed Mann–Whitney test. The data are represented in a Tukey box plot (n = 9 per genotype except 8 in the cortex of WT). The data are given in Figure 8—source data 1. *p≤0.05, **p≤0.01, ***p≤0.001, and ns: not significant.
-
Figure 8—source data 1
Contrast-enhanced magnetic resonance imaging reveals a low level of tracer dispersion.
- https://cdn.elifesciences.org/articles/71379/elife-71379-fig8-data1-v2.xlsx
Figure 9
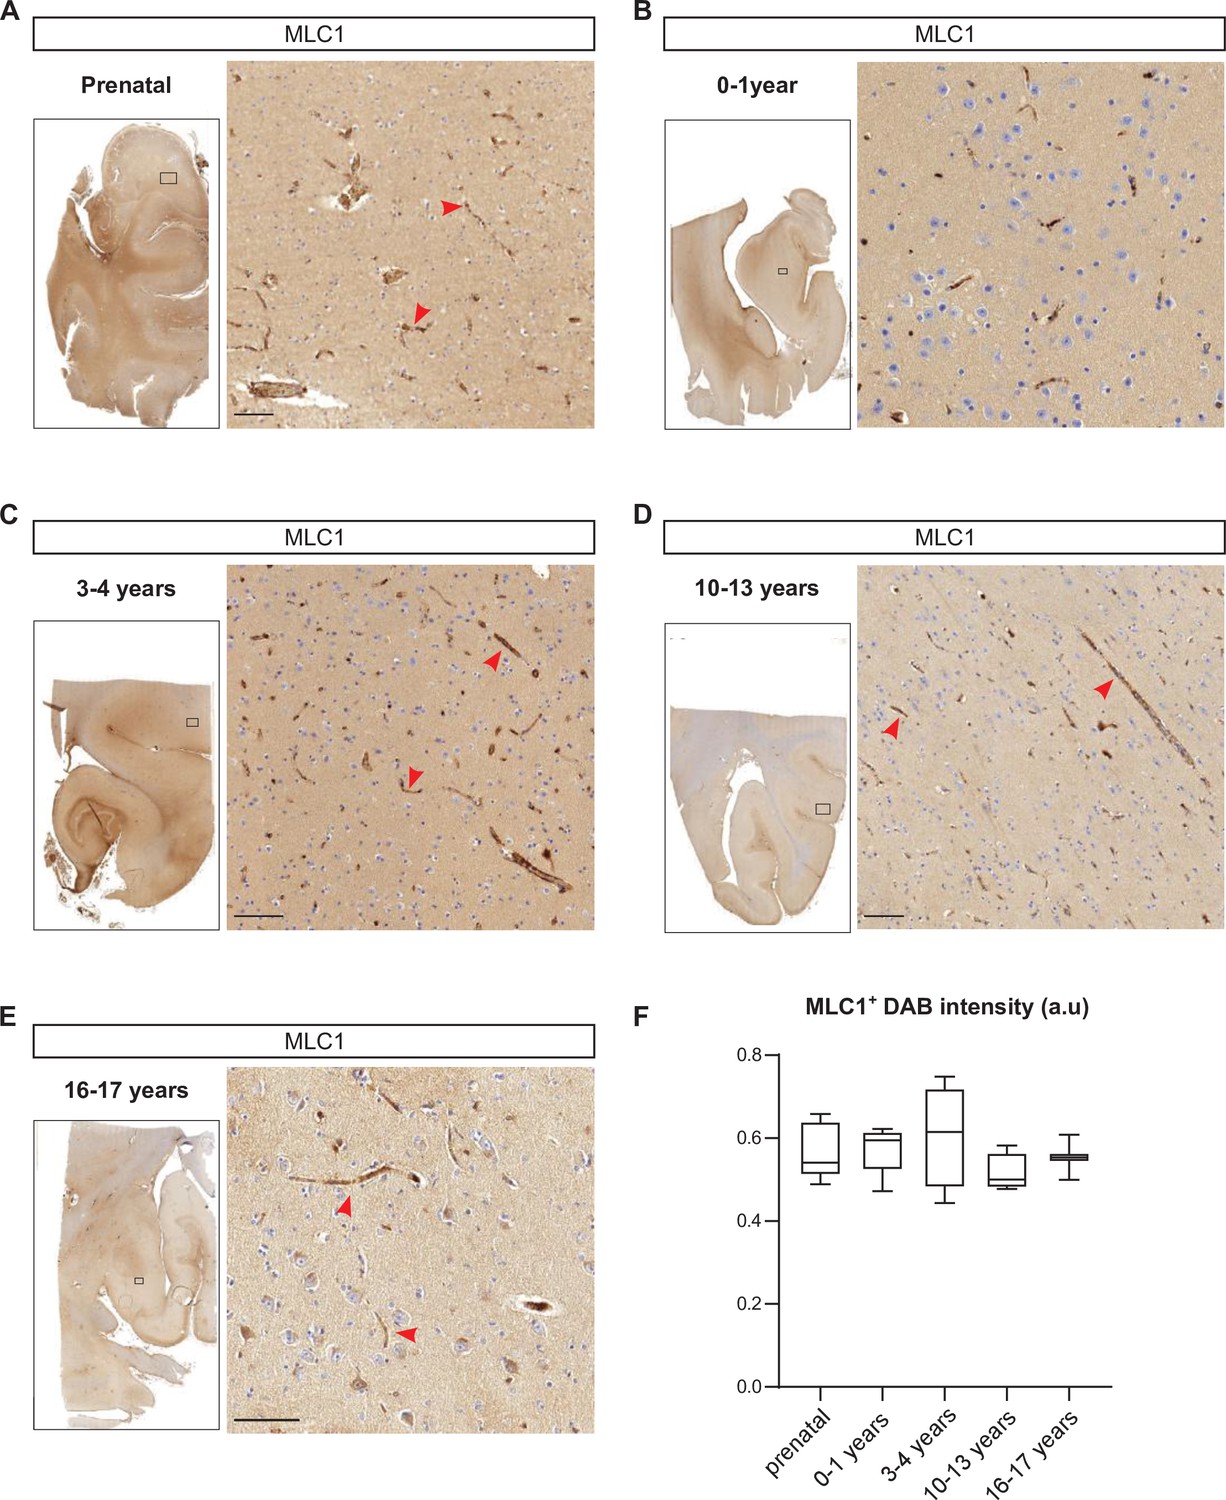
Developmental perivascular expression of MLC1 in the human cortex.
(A–E) Representative images of MLC1-immunostained human cortical slices (left) and a higher magnification image of the parenchyma in the boxed areas (right) at the prenatal stage (weeks of gestation: 15; 21; 28; 30; 39) (A); 0–1 year of age (ages: 3 weeks; 1 month; 2 months; 3 months; 8 months; 1 year) (B); 3–4 years of age (3 years; 4 years (n = 2)) (C); 10–13 years of age (10 years; 11 years; 12 years; 13 years (n = 2)) (D); and 16–17 years of age (16 years; 17 years) (E). Scale bar: 100 µm. MLC1 immunostaining (arrowheads) was revealed with 3, 3'-diaminobenzidine (DAB). (F) (DAB) intensity was quantified and presented as a Tukey box plot. We applied the Kruskal–Wallis test (overall, in bold) and a two-tailed Mann–Whitney test (for comparing stages). The number of samples per developmental age was 5 for the prenatal samples, 5 for 0–1 years of age, 4 for 3–4 years of age, 4 for 10–13 years of age, and 2 for 16–17 years of age. The data are given in Figure 9—source data 1.
-
Figure 9—source data 1
Developmental perivascular expression of MLC1 in the human cortex.
- https://cdn.elifesciences.org/articles/71379/elife-71379-fig9-data1-v2.xlsx
Tables
Key resources table
| Reagent type (species) or resource | Designation | Source or reference | Identifiers | Additional information |
|---|---|---|---|---|
| Sequence-based reagent | Acta2_F | This study | PCR primers | GTCCCAGACATCAGGGAGTAA |
| Sequence-based reagent | Acta2_R | This study | PCR primers | TCGGATACTTCAGCGTCAGGA |
| Sequence-based reagent | Atp1b1_F | This study | PCR primers | GCTGCTAACCATCAGTGAACT |
| Sequence-based reagent | Atp1b1_R | This study | PCR primers | GGGGTCATTAGGACGGAAGGA |
| Sequence-based reagent | Mdr1a (Abcb1)_F | This study | PCR primers | GATAGGCTGGTTTGATGTGC |
| Sequence-based reagent | Mdr1a (Abcb1)_R | This study | PCR primers | TCACAAGGGTTAGCTTCCAG |
| Sequence-based reagent | Cldn5_F | This study | PCR primers | TAAGGCACGGGTAGCACTCA |
| Sequence-based reagent | Cldn5_R | This study | PCR primers | GGACAACGATGTTGGCGAAC |
| Sequence-based reagent | Gapdh_F | This study | PCR primers | AGGTCGGTGTGAACGGATTTG |
| Sequence-based reagent | Gapdh_R | This study | PCR primers | TGTAGACCATGTAGTTGAGGTCA |
| Antibody | Claudin 5 (rabbit polyclonal) | Thermo Fisher | 34-1600 | Western blot (1:500) |
| Antibody | H3 (mouse monoclonal) | Ozyme | 14269S | Western blot (1:2000) |
| Antibody | P-gP (mouse monoclonal) | Enzo | ALX-801-002C100 | Western blot (1:200) |
| Antibody | SMA_cy3 (mouse monoclonal) | Sigma | C6198 | Immunofluorescence (1:250); western blot (1:1000) |
| Antibody | Pecam-1 (goat polyclonal) | R&D Systems | AF3628 | Immunofluorescence (1:300) |
| Antibody | Connexin 43 (mouse monoclonal) | BD transduction | 610062 | Immunofluorescence (1:200); western blot (1:500) |
| Antibody | GlialCAM (rabbit polyclonal) | Provided by Raul Estevez, Universitat de Barcelona, Spain. | / | Immunofluorescence (1:500); western blot (1:500) |
| Antibody | Aquaporin 4 (rabbit polyclonal) | Sigma | A5971 | Immunofluorescence (1:500); western blot (1:500) |
| Antibody | Neurofilament motor N (mouse monoclonal) | Provided by Beat M. Riederer, University of Lausanne, Switzerland. | / | Immunofluorescence (1:40); western blot (1:40) |
| Antibody | GFAP (rabbit polyclonal) | Sigma | G9269 | Immunofluorescence (1:500) |
| Antibody | MLC1human (rabbit polyclonal) | Provided by Raul Estevez, Universitat de Barcelona, Spain. | / | Immunofluorescence (1:200) |
| Antibody | MLC1pan (rabbit polyclonal) | Provided by Raul Estevez, Universitat de Barcelona, Spain. | / | Western blot (1:500) |
| Antibody | Kir 4.1 (rabbit polyclonal) | Alomone Labs | APC-035 | Western blot (1:5000) |
| Antibody | Kir 4.1 extracellular (rabbit polyclonal) | Alomone Labs | APC-165 | Immunofluorescence (1:200) |
| Antibody | Anti-rabbit_alexa 555 (goat polyclonal) | Thermo Fisher | A21429 | Immunofluorescence (1:2000) |
| Antibody | Anti-rabbit_alexa 488 (goat polyclonal) | Thermo Fisher | A11034 | Immunofluorescence (1:2000) |
| Antibody | Anti-mouse_alexa 555 (goat polyclonal) | Thermo Fisher | A21424 | Immunofluorescence (1:2000) |
| Antibody | Anti-oat_alexa 647 (donkey polyclonal) | Thermo Fisher | A-21447 | Immunofluorescence (1:2000) |
| Antibody | Anti-rabbit_HRP (goat polyclonal) | Biovalley | CSA2115 | Western blot (1:2500) |
| Antibody | Anti-mouse_HRP (goat polyclonal) | Biovalley | CSA2108 | Western blot (1:2500) |
| Antibody | Anti-rabbit STAR RED (goat polyclonal) | Abberior | STRED-1002 | Immunofluorescence (1:200) |
| Antibody | Anti-mouse STAR RED (goat polyclonal) | Abberior | STRED-1001 | Immunofluorescence (1:200) |
| Other | Alexa-conjugated isolectin (Griffonia simplicifolia) 647 | Thermo Fisher | I32450 | Immunofluorescence (1:100) |
| Other | Alexa-conjugated isolectin (Griffonia simplicifolia) 594 | Thermo Fisher | I21413 | Immunofluorescence (1:100) |
Additional files
Download links
A two-part list of links to download the article, or parts of the article, in various formats.
Downloads (link to download the article as PDF)
Open citations (links to open the citations from this article in various online reference manager services)
Cite this article (links to download the citations from this article in formats compatible with various reference manager tools)
Megalencephalic leukoencephalopathy with subcortical cysts is a developmental disorder of the gliovascular unit
eLife 10:e71379.
https://doi.org/10.7554/eLife.71379


