NMDA receptors in visual cortex are necessary for normal visuomotor integration and skill learning
- Friedrich Miescher Institute for Biomedical Research, Switzerland
- Faculty of Science, University of Basel, Switzerland
Figures
Figure 1 with 1 supplement
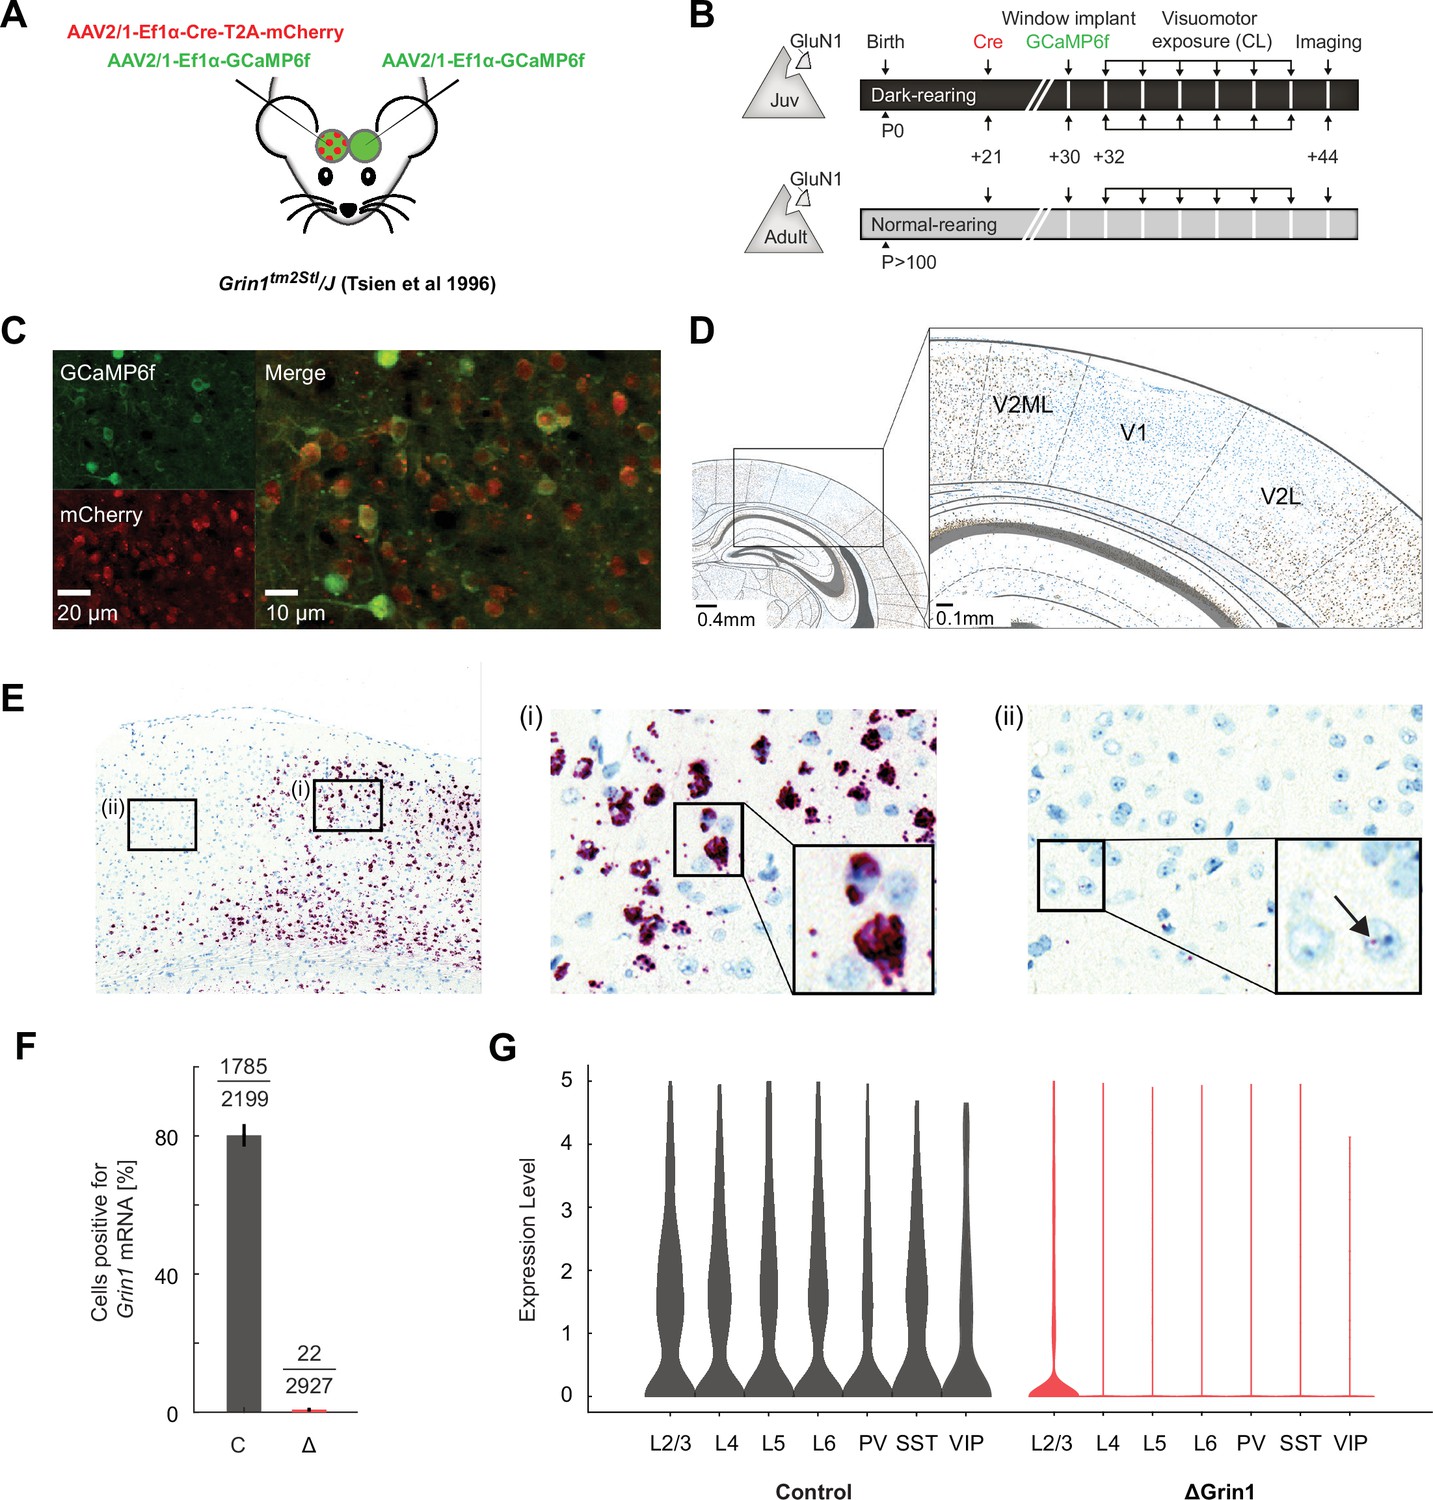
Characterization of N-methyl-d-aspartate (NMDA) receptor knockout.
(A) We injected an adeno-associated viral vector (AAV) to express Cre recombinase unilaterally and another to express a calcium indicator bilaterally (GCaMP6f) in V1 of ΔGrin1 mice. (B) Experimental timeline: a first group of Grin1 mice (ΔGrin1juv) was dark-reared from birth. We injected an AAV to express Cre at postnatal day (P)21 unilaterally in V1, injected a second AAV bilaterally to express GCaMP6f, and implanted imaging windows bilaterally at P30. A second group of Grin1 mice (ΔGrin1adult) was reared normally and received the same injections at p>100. All mice then had six sessions of visuomotor exposure in a closed-loop (CL) virtual environment before imaging experiments. (C) Example two-photon images showing co-expression of GCaMP6f and Cre-mCherry constructs. (D) In situ hybridization against Grin1 mRNA (see Materials and methods) confirming the local knockout of Grin1 in V1. Blue: hematoxylin stain for cell nuclei; brown: Grin1 hybridization signal. Brain regions were identified using a mouse brain atlas (Franklin and Paxinos, 2012). (E) Injection sites of Cre were readily visible in Grin1 in situ hybridization images. Outside of the injection site (i), labeling was dense in most cells with multiple puncta per cell. In injection sites (ii), labeling was almost completely absent. Inset shows a cell with one punctum (arrow); if a cell had more than two of these puncta, it was counted positive in the analysis shown in (F). (F) The fraction of cells positive (more than two puncta per cell) for Grin1 mRNA in 0.5 mm × 0.5 mm regions in injection sites (Δ) was strongly reduced compared to regions outside of injection sites (C). (G) Grin1 knockout reduced expression of Grin1 in all major cortical neuron types. Left: violin plots of the number of single-cell sequencing mRNA reads corresponding to the portion of the Grin1 gene knocked out in the ΔGrin1 mice and control mice. Layer 2/3 (L2/3), layer 4 (L4), layer 5 (L5), and layer 6 (L6) excitatory neurons, and parvalbumin (PV)-positive, somatostatin (SST)-positive, and vasoactive peptide (VIP)-positive interneurons. Expression levels are normalized to the total number of reads per nuclei. Right: the same data for ΔGrin1 mice. Expression levels were significantly downregulated in all neuron types, with the exception of VIP neurons (see Supplementary file 1A for statistics).
Figure 1—figure supplement 1
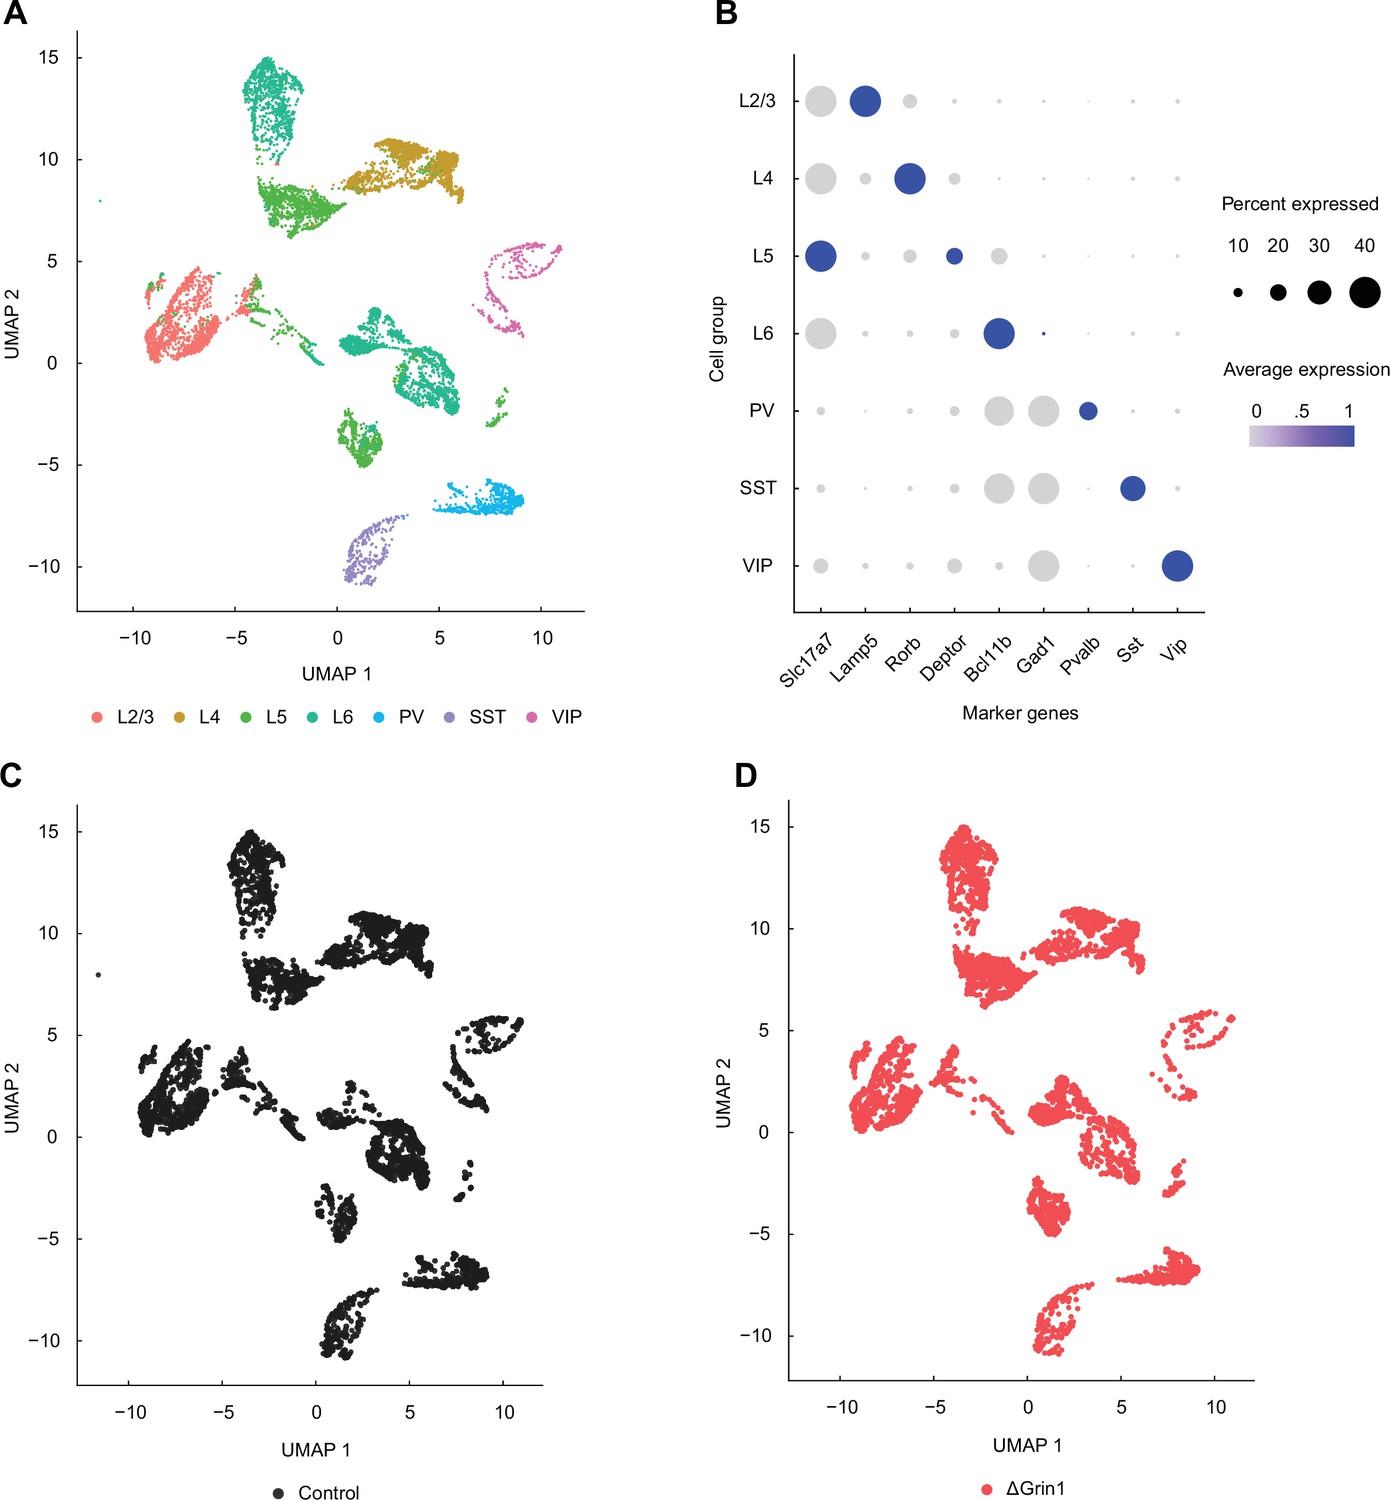
Single-nuclei RNA-sequencing data covers all major cortical neuron types.
(A) UMAP representation of the single-nuclei RNA-sequencing data with all major cortical groups annotated: layer 2/3 (L2/3), layer 4 (L4), layer 5 (L5), and layer 6 (L6) excitatory neurons, and parvalbumin (PV)-positive, somatostatin (SST)-positive, and vasoactive peptide (VIP)-positive interneurons. (B) Dot plot demonstrating enrichment for a select number of markers specific to each or several of the cortical cell groups. Average expression corresponds to values scaled for each gene across groups. (C) UMAP plot showing that control cells are distributed evenly across all cell groups. (D) As in (C), but for the knockout samples.
Figure 2 with 1 supplement
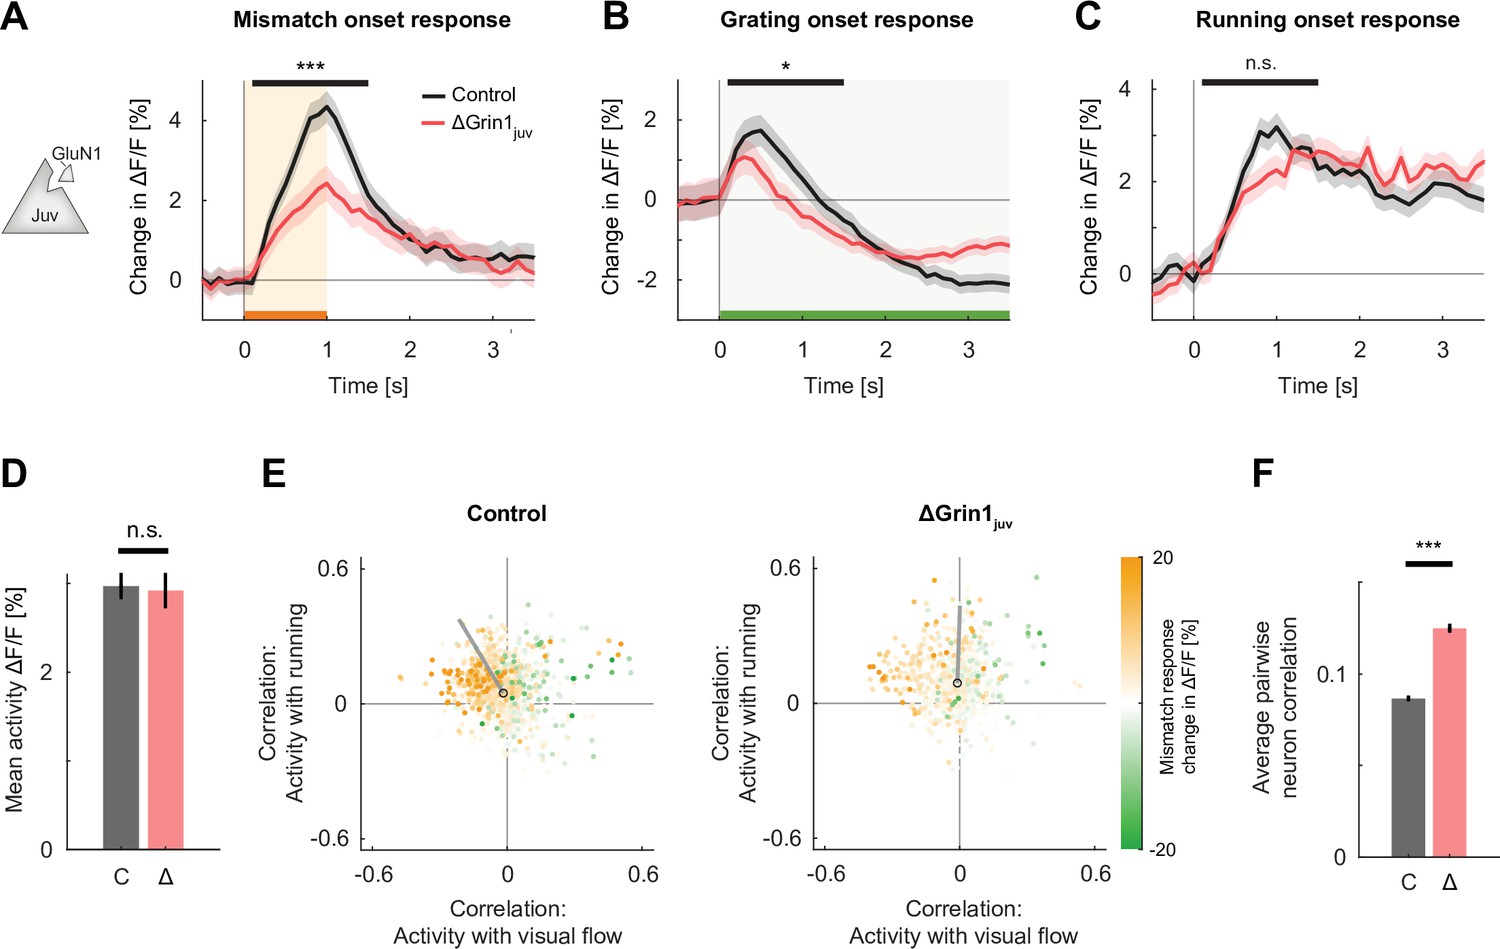
N-methyl-d-aspartate (NMDA) receptor knockout prior to first visual experience impaired the development of normal visual and visuomotor mismatch responses.
(A) The average L2/3 population response to mismatch was stronger in control (black) than in ΔGrin1juv (red) hemispheres. Shading indicates the standard error of the mean (SEM) across neurons. Orange shading and bar indicate the duration of mismatch. Mean responses were compared across neurons in the time window indicated by the black bar above the traces. Here and in subsequent panels, n.s.: p>0.05, *p<0.05, **p<0.01, ***p<0.001. For all details of statistical testing, see Supplementary file 1A. (B) As in (A), but for responses to the onset of a drifting grating stimulus (see Materials and methods). Green shading and bar indicate the presence of a grating stimulus. (C) As in (A), but for running onset responses in the closed-loop condition. (D) Mean calcium activity of neurons in the control (C, gray) and ΔGrin1juv (Δ, red) hemisphere during the closed-loop condition. Error bars indicate SEM across neurons. (E) Scatter plot of the correlation between neuronal activity and visual flow, and the correlation between neuronal activity and running speed in the open-loop condition for all L2/3 neurons recorded in control (left) and ΔGrin1juv (right) hemispheres. Each dot shows the correlations for one neuron, and dot color indicates the neuron’s mismatch response. Black circles mark the population mean, and solid gray lines indicate the direction of the first principal component of the distribution (see Figure 2—figure supplement 1B and Materials and methods). (F) Average pairwise correlation of neuronal activity was higher in ΔGrin1juv (Δ, red) compared to that in the control (C, gray) hemisphere. Error bars indicate SEM across neurons.
Figure 2—figure supplement 1
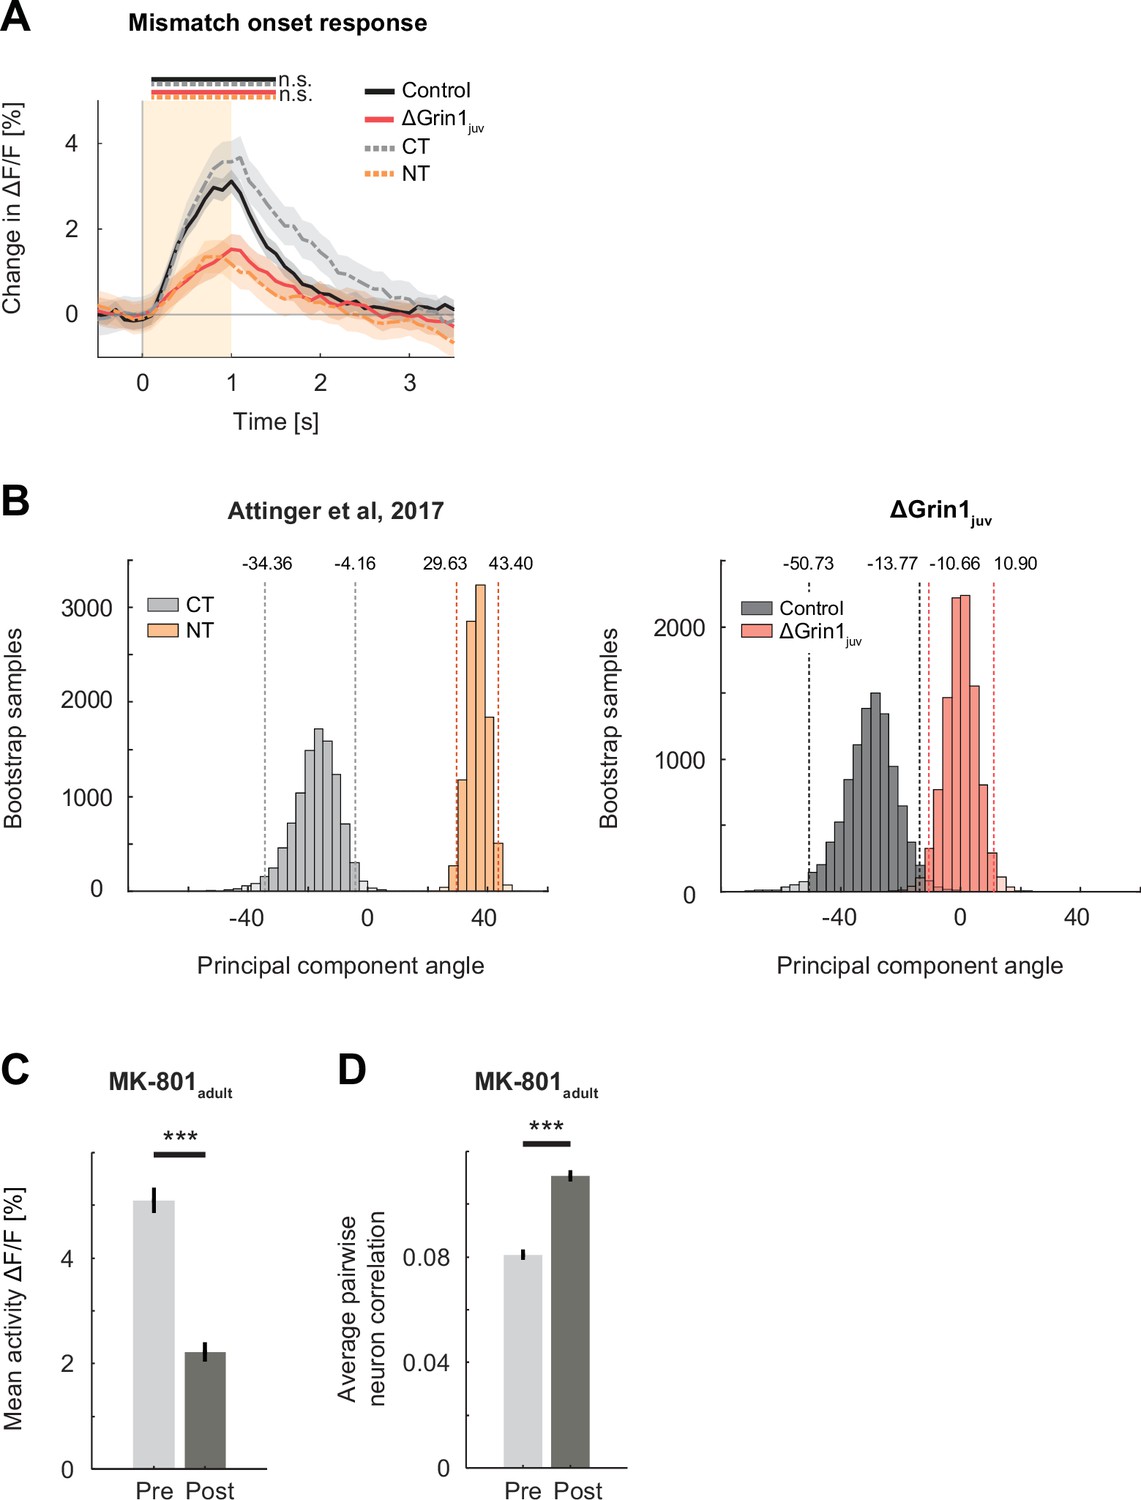
The effect of the N-methyl-d-aspartate (NMDA) receptor knockout was comparable to the lack of experience with visuomotor coupling or systemic block of NMDA receptors.
(A) Mean population response to mismatch in ΔGrin1juv (red) hemisphere, the control hemisphere (black), coupled trained controls (CT, dashed gray), and mice raised without visuomotor coupling (non-coupled trained [NT], orange). Responses in ΔGrin1juv are similar to those in NT mice, and responses in the control hemisphere were similar to those in CT mice. Note that the data shown in this figure includes all data, while the data shown in Figure 2 includes only those data from recording sites for which we also had sufficient grating and running onset data (see Materials and methods). Here and in subsequent panels, n.s.: p>0.05, *p<0.05, **p<0.01, ***p<0.001. For all details of statistical testing, see Supplementary file 1A. (B) Bootstrap distribution of principal component angles from correlational analysis of neuronal activity with running speed and visual flow in open-loop session. Data shown are from CT (dashed gray) and non-CT (NT, dashed orange) mice from Attinger et al., 2017, and for ΔGrin1juv (dashed red) and control hemisphere (dashed black) data. (C) Mean activity of L2/3 neurons in V1 before (Pre, light gray) and 1 hr after (Post, dark gray) intraperitoneal injection of the NMDA receptor antagonist MK-801 (0.1 mg/kg). Error bars indicate the standard error of the mean (SEM) across neurons. (D) Average pairwise correlation of neuronal activity was higher 1 hr after MK-801 injection. Error bars indicate SEM across neurons.
Figure 3
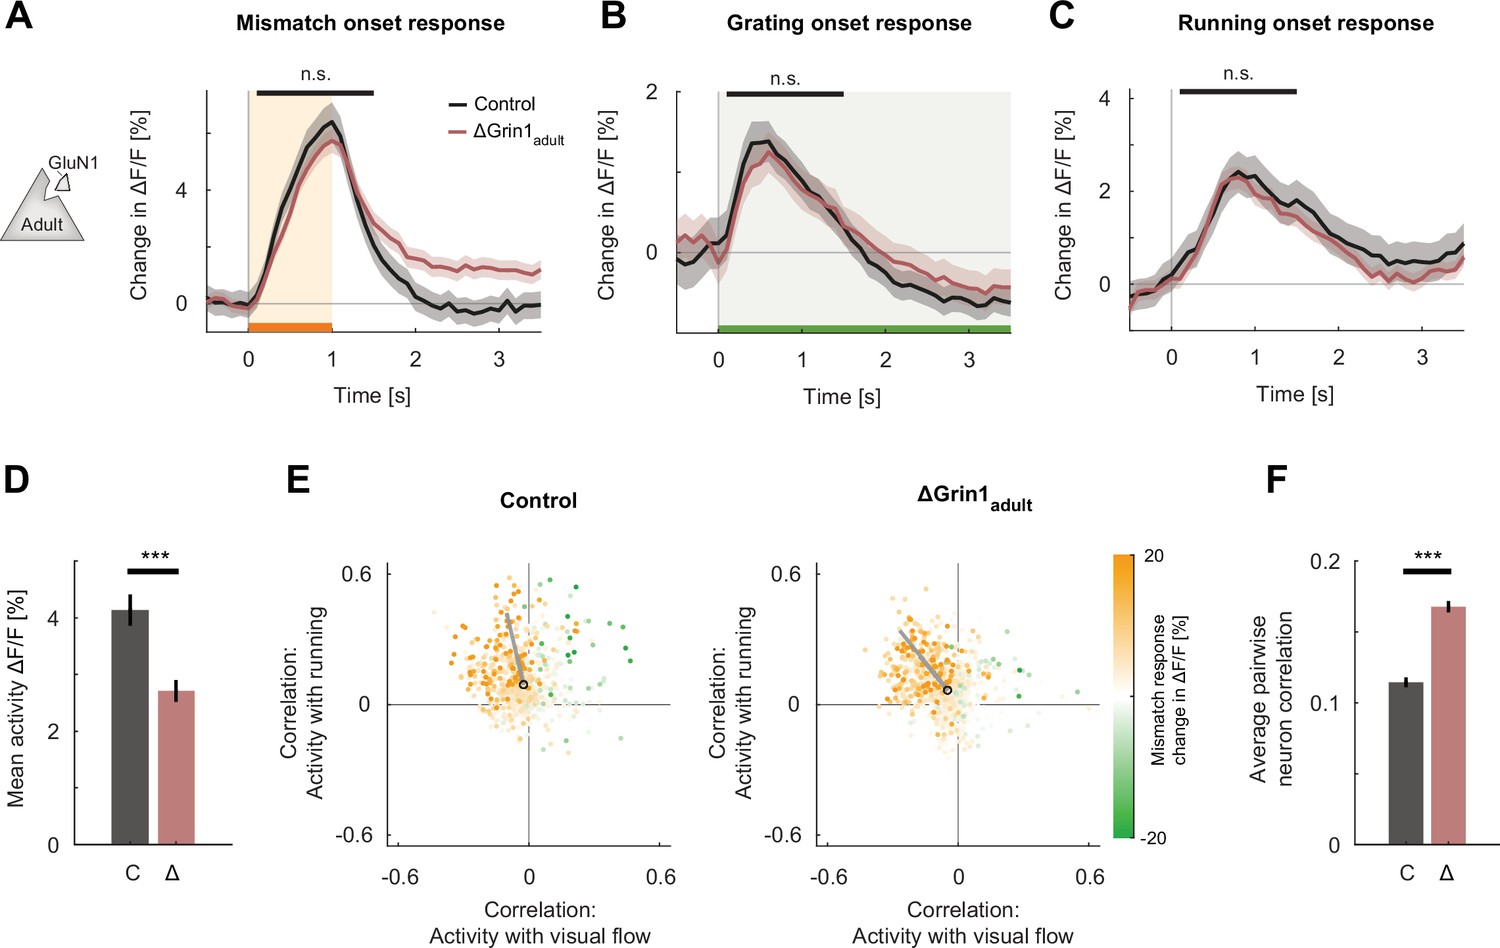
N-methyl-d-aspartate (NMDA) receptor knockout in the adult mouse did not impair visual and visuomotor responses.
(A) The average population response to mismatch was similar in control (black) and in ΔGrin1adult (dark red) hemispheres. Shading indicates the standard error of the mean (SEM) across neurons. Orange shading and bar indicate the duration of mismatch. Mean responses were compared across neurons in the time window indicated by the black bar above the traces. Here and in subsequent panels, n.s.: p>0.05, *p<0.05, **p<0.01, ***p<0.001. For all details of statistical testing, see Supplementary file 1A. (B) As in (A), but for responses to the onset of a drifting grating stimulus (see Materials and methods). Green shading and bar indicate the presence of grating stimulus. (C) As in (A), but for running onset responses in the closed-loop condition. (D) Mean activity of neurons in the control (C, gray) and ΔGrin1adult (Δ, dark red) hemisphere during the closed-loop condition. Error bars indicate SEM across neurons. (E) Scatter plot of the correlation between neuronal activity and visual flow, and the correlation between neuronal activity and running speed in the open-loop condition for all L2/3 neurons recorded in control (left) and ΔGrin1adult (right) hemispheres. Each dot shows the correlations for one neuron, and dot color indicates the neuron’s mismatch response. Black circles mark the population mean, and solid gray lines indicate the direction of the first principal component of the distribution (see Materials and methods). (F) Average pairwise correlation of neuronal activity was higher in ΔGrin1adult (Δ, dark red) compared to that in the control (C, gray) hemisphere. Error bars indicate SEM across neurons.
Figure 4
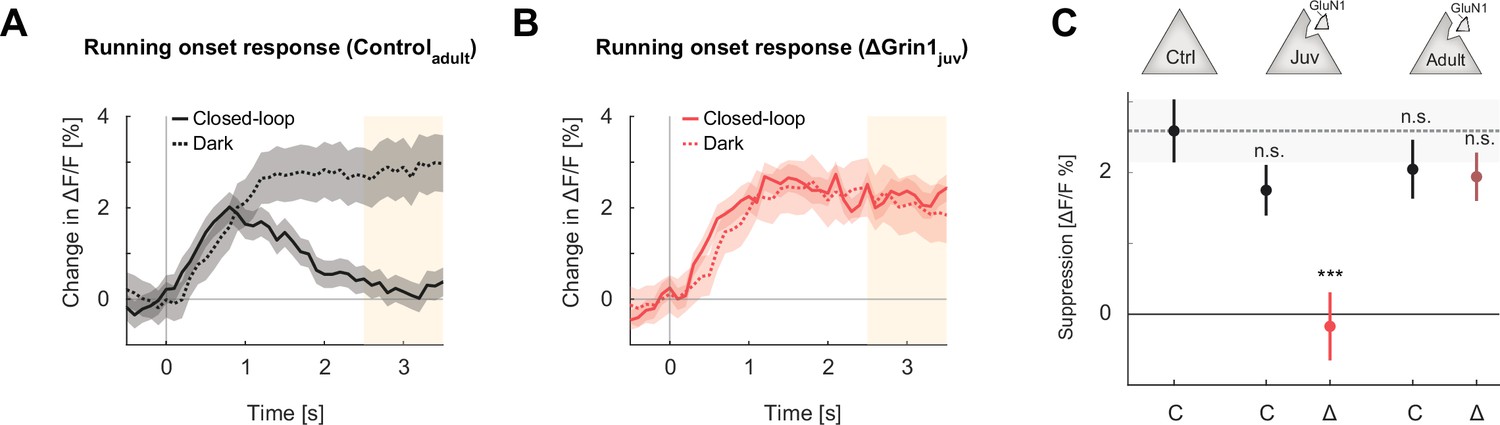
Suppression of running onset responses by visual flow was reduced by an N-methyl-d-aspartate (NMDA) receptor knockout prior to first visual experience.
(A) The average population response to running onset in the closed-loop condition (solid) and the dark condition (dotted) in adult control mice. Shading indicates the standard error of the mean (SEM) across neurons. Albescent white shading marks analysis window used in (C). Note that the visual flow associated with closed-loop running results in a suppression of motor-related responses. (B) As in (A), but for ΔGrin1juv data in the knockout hemisphere. (C) Average closed-loop visual feedback induced suppression of activity for all neurons in adult control mice and control (C) or knockout (Δ) hemispheres of ΔGrin1juv and ΔGrin1adult mice. Suppression was calculated as the difference between the running onset response in the dark and the closed-loop condition in the window 2.5–3.5 s after running onset, marked in (A) and (B). Error bars indicate SEM across neurons. Comparison against data from control mice; n.s.: p>0.05, ***p<0.001. For all details of statistical testing, see Supplementary file 1A.
Figure 5
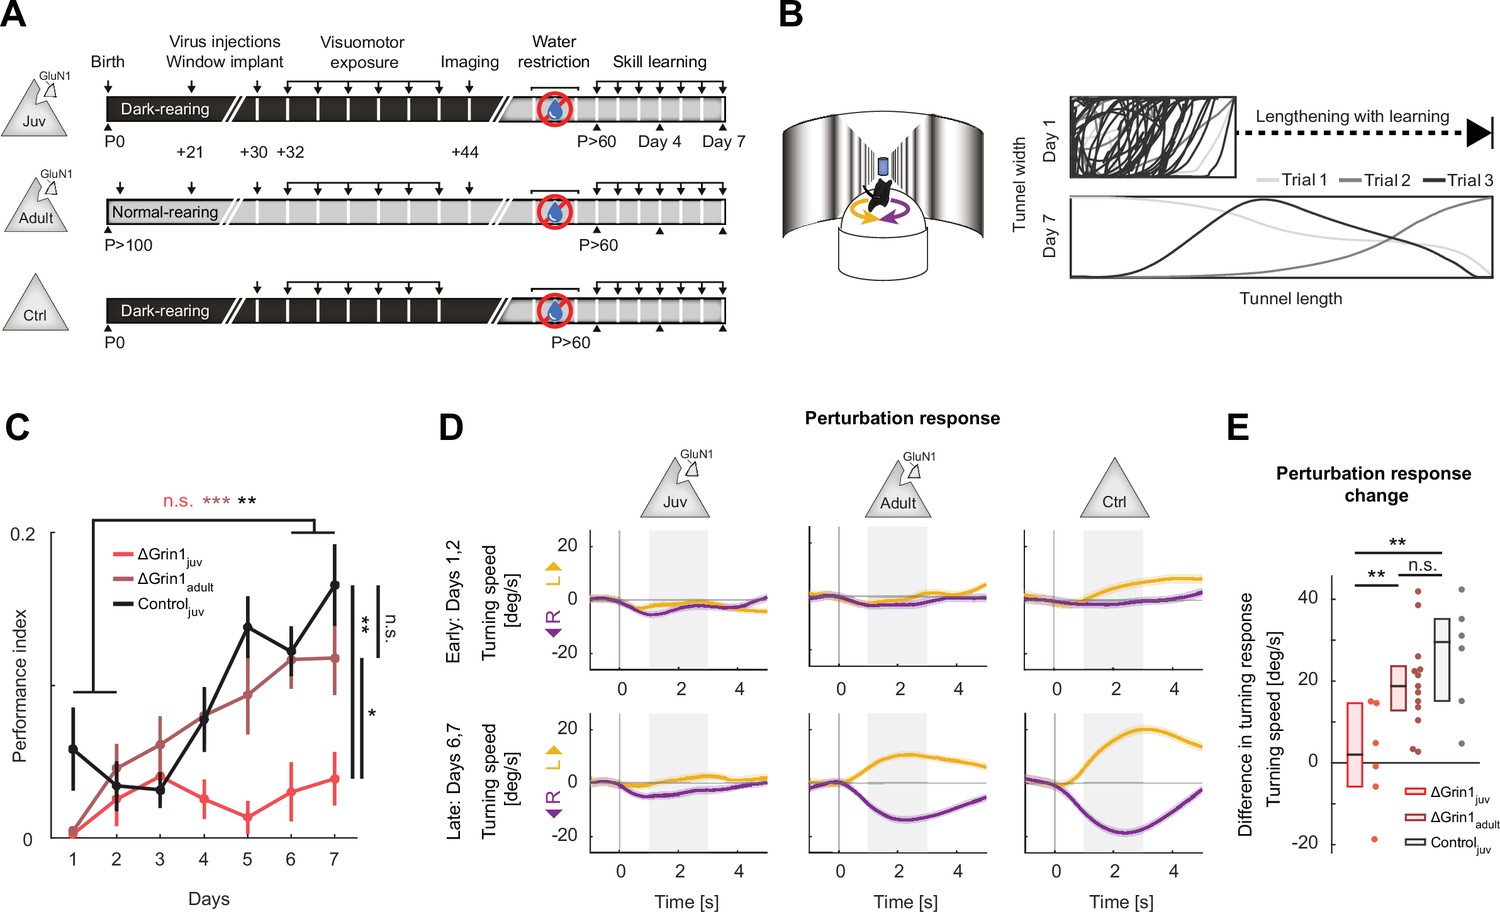
N-methyl-d-aspartate (NMDA) receptor knockout in V1 before first visuomotor experience impaired learning of a visuomotor task later in life.
(A) Experimental approach and timeline. Three groups of mice were trained: the first was composed of 6 ΔGrin1juv dark-reared mice, the second was composed of 13 ΔGrin1adult normally reared mice, and the third was composed of 6 C57BL/6 dark-reared control mice. Mice were water-restricted and subsequently trained to perform a virtual navigation task (see Materials and methods). (B) Left: schematic of virtual reality setup. Mice controlled forward translational motion and rotation in a virtual corridor by rotating a spherical treadmill and were trained to navigate to the end of a corridor for a water reward. As performance increased, the task difficulty was increased by lengthening the virtual corridor. Right: top-down view of the virtual corridor showing the trajectories of the mouse in three example trials (different gray levels) on days 1 (top) and 7 (bottom). The ratio of virtual corridor length to width is not drawn to scale. (C) Task performance as a function of training day (see Materials and mthods) of ΔGrin1juv mice (red), ΔGrin1adult mice (dark red), and dark-reared control mice (Controljuv, black) over the course of 7 days. Error bars indicate the standard error of the mean (SEM) across mice. ΔGrin1adult and Controljuv mice exhibited performance improvements over the course of training, while ΔGrin1juv mice did not. Performance on day 7 was different between ΔGrin1juv and both ΔGrin1adult and Controljuv mice. Here and in subsequent panels, n.s.: p>0.05, *p<0.05, **p<0.01, ***p<0.001. For all details of statistical testing, see Supplementary file 1A. (D) Turning in response to a perturbation that consisted of a sudden heading displacement of 30° to the left (yellow) or to the right (purple) of ΔGrin1juv, ΔGrin1adult, and Controljuv mice, early (top row) and late (bottom row) in training. Shading indicates SEM across trials. Gray shading indicates analysis window (+1 s to +3 s) used for quantification in (E). (E) Quantification of perturbation offset responses shown in (D) as the difference between average left and right perturbation turning responses, late (bottom row in D) minus early (top row in D) in training. Boxes show median and quartiles, all data are shown as dots (individual mice) to the right. ΔGrin1adult and Controljuv mice learned to initiate corrective turns in response to visual offset perturbations, while ΔGrin1juv mice did not.
Figure 6 with 3 supplements
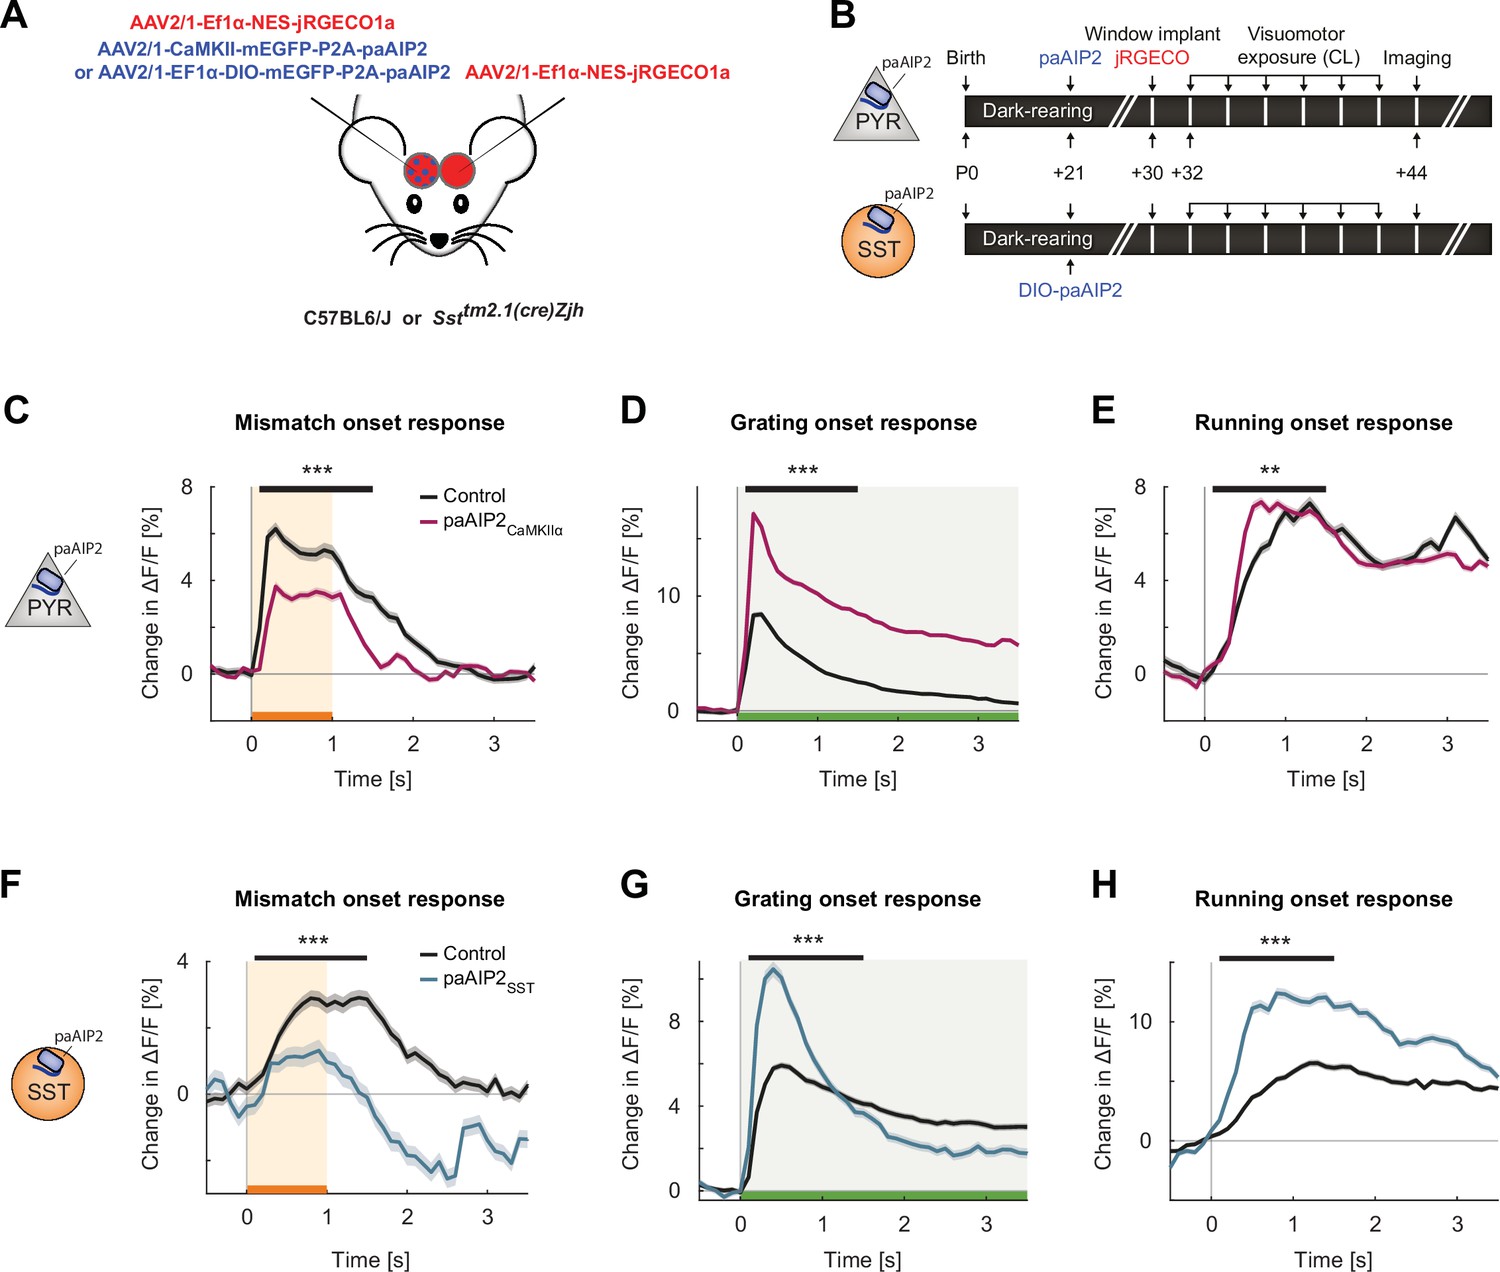
Inhibiting calcium/calmodulin-dependent kinase II (CaMKII) in excitatory neurons or somatostatin (SST) interneurons resulted in imbalanced visuomotor responses in L2/3 excitatory neurons.
(A) We injected an AAV2/1-CaMKII-mEGFP-P2A-paAIP2 (in C57BL/6J mice) or AAV2/1-Ef1α-mEGFP-P2A-paAIP2 (in SST-Cre mice) unilaterally in V1 to express the photoactivatable CaMKII inhibitor paAIP2 in excitatory or SST interneurons, respectively, and an AAV2/1-Ef1α-NES-jRGECO1a bilaterally to express the calcium indicator jRGECO for imaging in L2/3 excitatory neurons. (B) Mice were dark-reared from birth. Adeno-associated viral vector (AAV) injections occurred at postnatal day 21 (paAIP2 or DIO-paAIP2) and P30 (jRGECO1a). Imaging window implantation occurred on P30. Mice had six sessions of visuomotor exposure in a closed-loop (CL) virtual environment during which we illuminated cortex bilaterally with blue light (473 nm) to inhibit CaMKII. We used six C57BL/6J mice, in which paAIP2 was targeted to excitatory neurons using a CaMKIIα(1.3 kb) promoter (paAIP2CaMKIIα), and seven SST-Cre mice that received an injection of the DIO-paAIP2 vector (paAIP2SST). (C) The average L2/3 population response to mismatch was stronger in control (black) than in paAIP2CaMKIIα (purple) hemispheres. Shading indicates the standard error of the mean (SEM) across neurons. Orange shading and bar indicate the duration of mismatch. Mean responses were compared across neurons in the time window marked by the black bar above the traces. Here and in subsequent panels, n.s.: p>0.05, *p<0.05, **p<0.01, ***p<0.001. For all details of statistical testing, see Supplementary file 1A. (D) As in (C), but for responses to the onset of a drifting grating stimulus (see Materials and methods). Green shading and bar indicate the presence of grating stimulus. (E) As in (C), but for running onset responses in the CL condition. (F) As in (C), but for inhibition of CaMKII in SST interneurons. (G) As in (D), but for inhibition of CaMKII in SST interneurons. (H) As in (E), but for inhibition of CaMKII in SST interneurons.
Figure 6—figure supplement 1
Additional data for calcium/calmodulin-dependent kinase II (CaMKII) inhibition in excitatory or somatostatin (SST) inhibitory neurons.
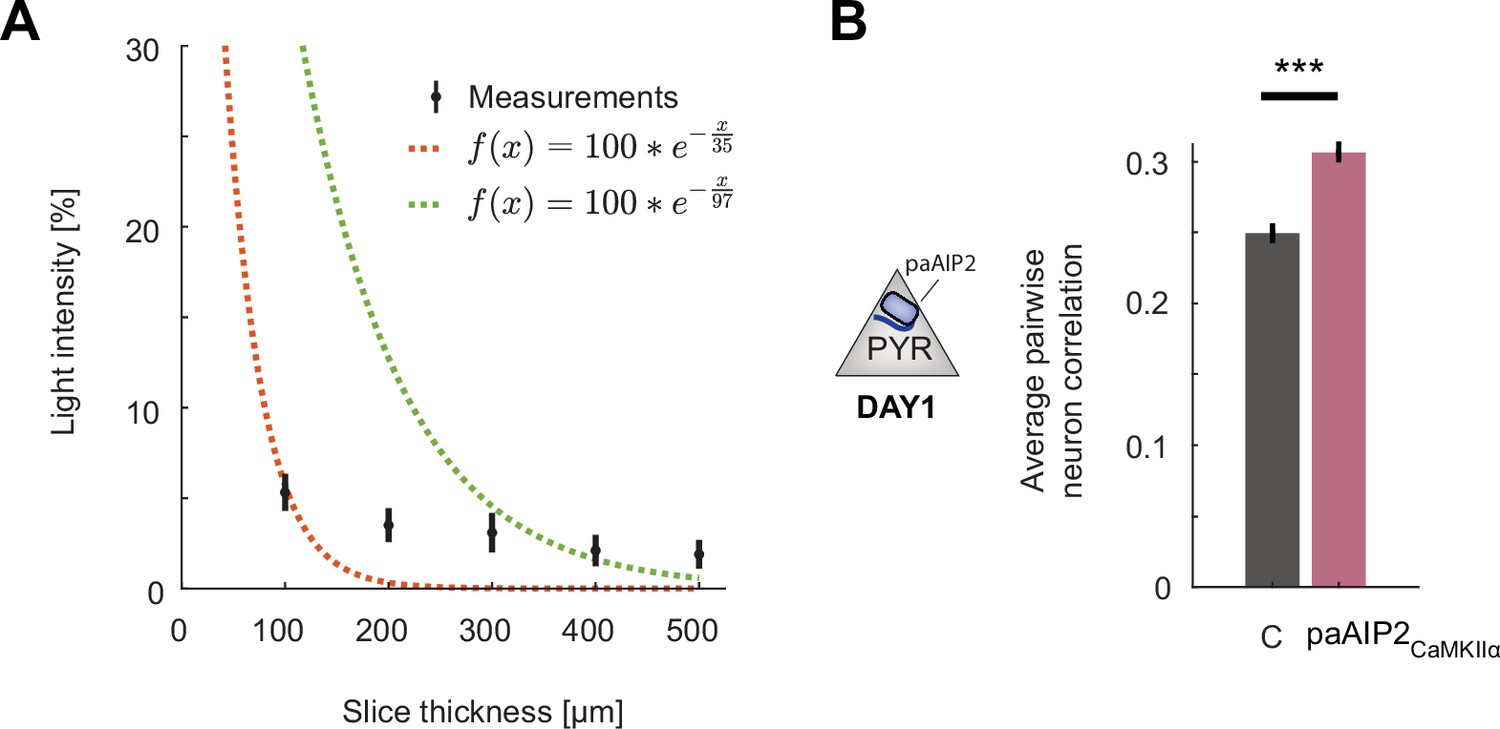
(A) Percentage of blue light (473 nm) power transmitted through acute slices of cortical tissue of varying thickness. Shown in black are mean and standard deviation over six slices. The dashed red line is a least-squares exponential fit with a decay constant of 37 µm, and the green line is the transform of a least-squares linear fit to the log-transformed data with a decay constant of 97 µm. Note that the data are not well fit by an exponential decay likely as a result of the point illumination. See Yona et al., 2016 for detailed modeling of power decay. (B) Average pairwise correlation of neuronal activity was higher in excitatory neurons in hemispheres that received CaMKII inhibition excitatory neurons (purple) compared to that in the uninhibited control hemisphere (gray). Error bars indicate the standard error of the mean (SEM), n.s.: p>0.05, *p<0.05, **p<0.01, ***p<0.001. For all details of statistical testing, see Supplementary file 1A.
Figure 6—figure supplement 2
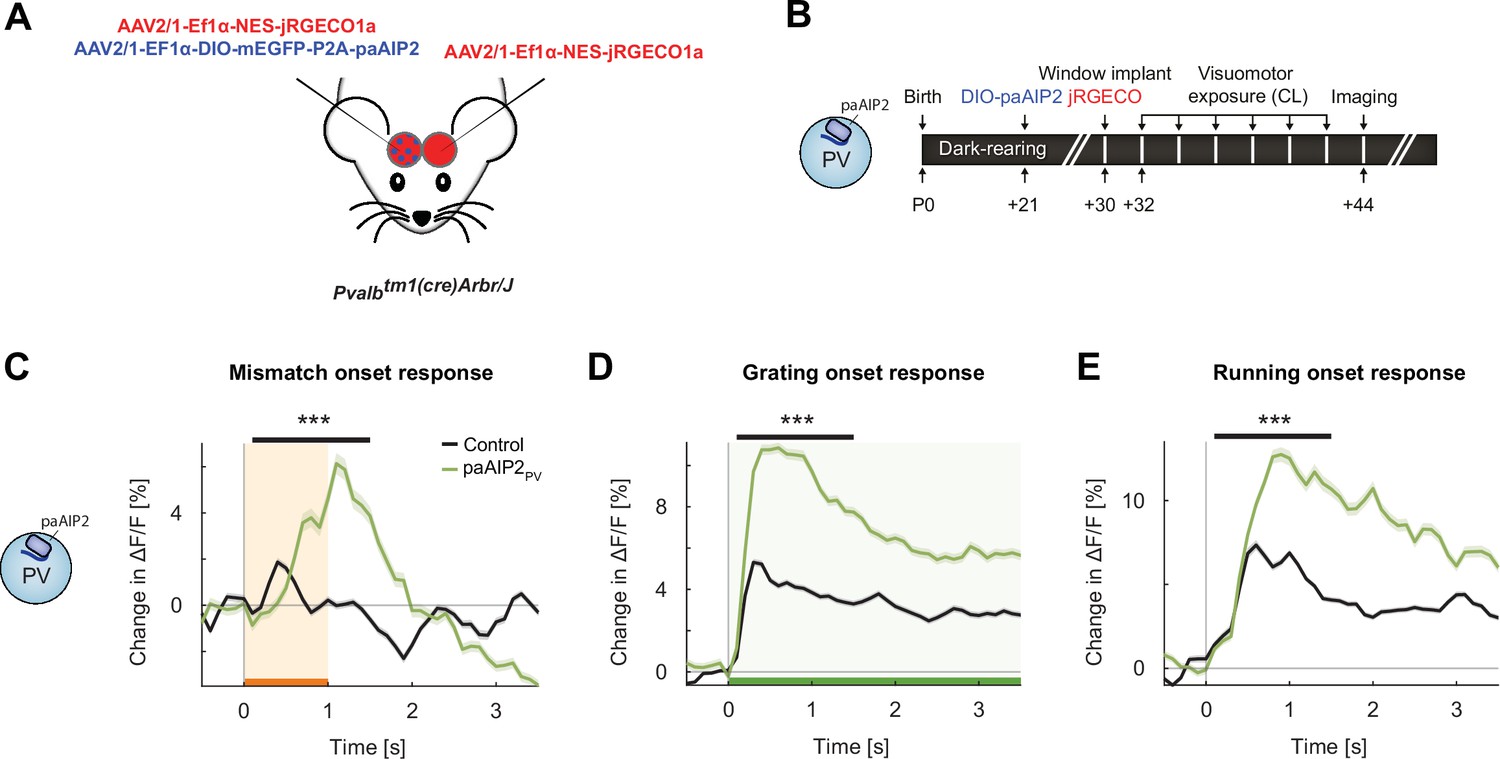
Inhibiting calcium/calmodulin-dependent kinase II (CaMKII) in parvalbumin (PV) interneurons resulted in an overall increase in onset responses in L2/3 excitatory neurons.
(A) We injected in V1 an AAV2/1-Ef1α-mEGFP-P2A-paAIP2 (in PV-Cre mice) unilaterally to express the photoactivatable CaMKII inhibitor paAIP2 in excitatory or PV interneurons, respectively, and an AAV2/1-Ef1α-NES-jRGECO1a bilaterally to express the calcium indicator jRGECO for imaging in L2/3 excitatory neurons. (B) Six PV-Cre mice were dark-reared from birth. Adeno-associated viral vector (AAV) injections occurred at postnatal day 21 (DIO-paAIP2) and P30 (jRGECO1a). Imaging window implantation occurred on P30. Mice had six closed-loop (CL) training sessions (visuomotor exposure) during which we illuminated cortex bilaterally with blue light (473 nm) to inhibit CaMKII (see Materials and methods). (C) The average population response to mismatch was stronger in the paAIP2PV (green) than in the control (black) hemispheres. Orange shading and bar indicate the duration of mismatch. Shading indicates the standard error of the mean (SEM). Mean responses are compared across neurons in the time window indicated by the black bar above the traces. Here and in subsequent panels, ***p<0.001. For all details of statistical testing, see Supplementary file 1A. (D) As in (C), but for responses to the onset of a drifting grating stimulus (see Materials and methods). Green shading and bar indicate the presence of grating stimulus. (E) As in (C), but for running onset responses in the CL condition.
Figure 6—figure supplement 3
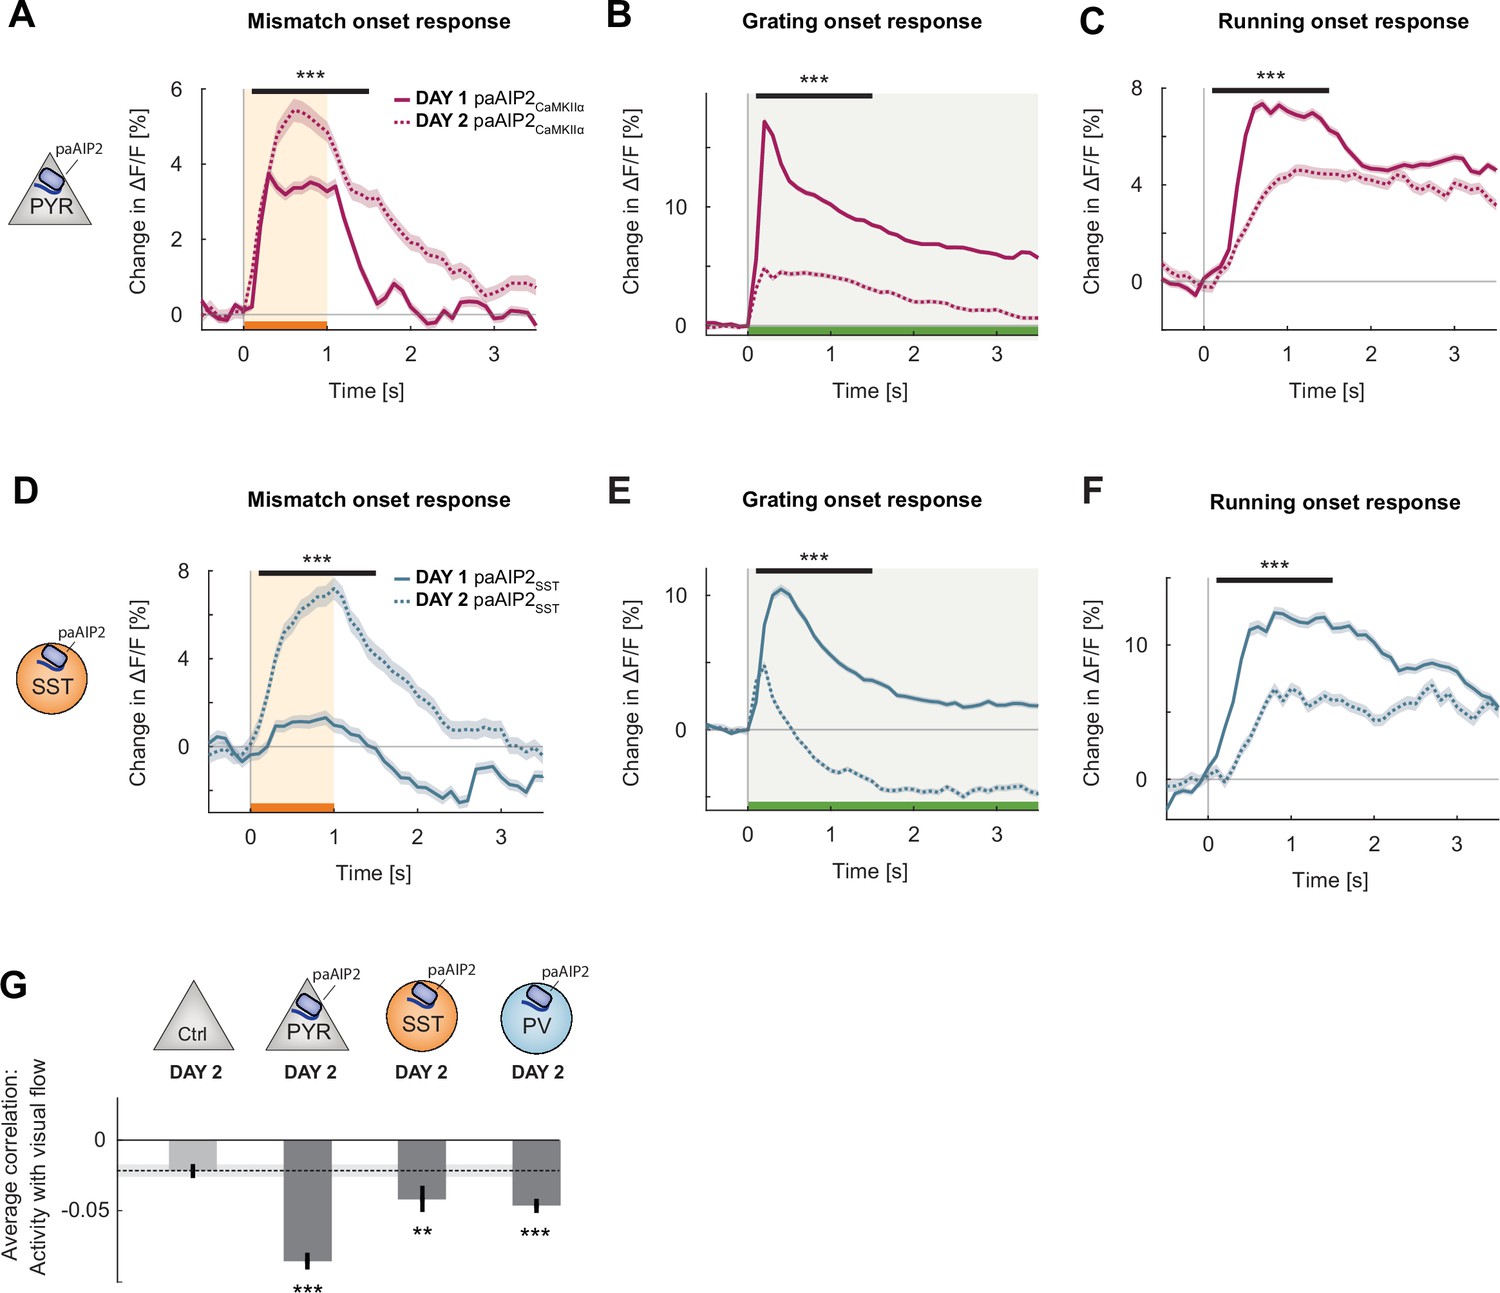
Changes induced by calcium/calmodulin-dependent kinase II (CaMKII) inhibition quickly reverted with exposure to normal visuomotor coupling.
(A) The average L2/3 population response to mismatch on day 2 of imaging (dashed) and on day 1 of imaging (solid). Shading indicates the standard error of the mean (SEM) over neurons. Orange shading and bar indicate the duration of mismatch. Mean responses are compared across neurons in the time window indicated by the black bar above the traces. Here and in subsequent panels, **p<0.01, ***p<0.001. For all details of statistical testing, see Supplementary file 1A. (B) As in (A), but for responses to the onset of a drifting grating stimulus (see Materials and methods). Green shading and bar indicate the presence of grating stimulus. (C) As in (A), but for running onset responses in the closed-loop condition. (D) As in (A), but for inhibition of CaMKII in somatostatin (SST) interneurons using paAIP2. (E) As in (B), but for inhibition of CaMKII in SST interneurons using paAIP2. (F) As in (C), but for inhibition of CaMKII in SST interneurons using paAIP2. (G) Mean correlation between neuronal activity and visual flow in the open-loop condition for all L2/3 neurons recorded in the paAIP2-inhibited hemispheres of paAIP2CaMKIIα, paAIP2SST, and paAIP2PV mice on day 2, compared to the responses in the adult control group. Error bars indicate SEM across neurons. Dashed black line and corresponding gray shading indicate the mean correlation of activity and visual flow and SEM of the C57Bl6/J control group. Comparison against normally reared, adult control data.
Figure 7
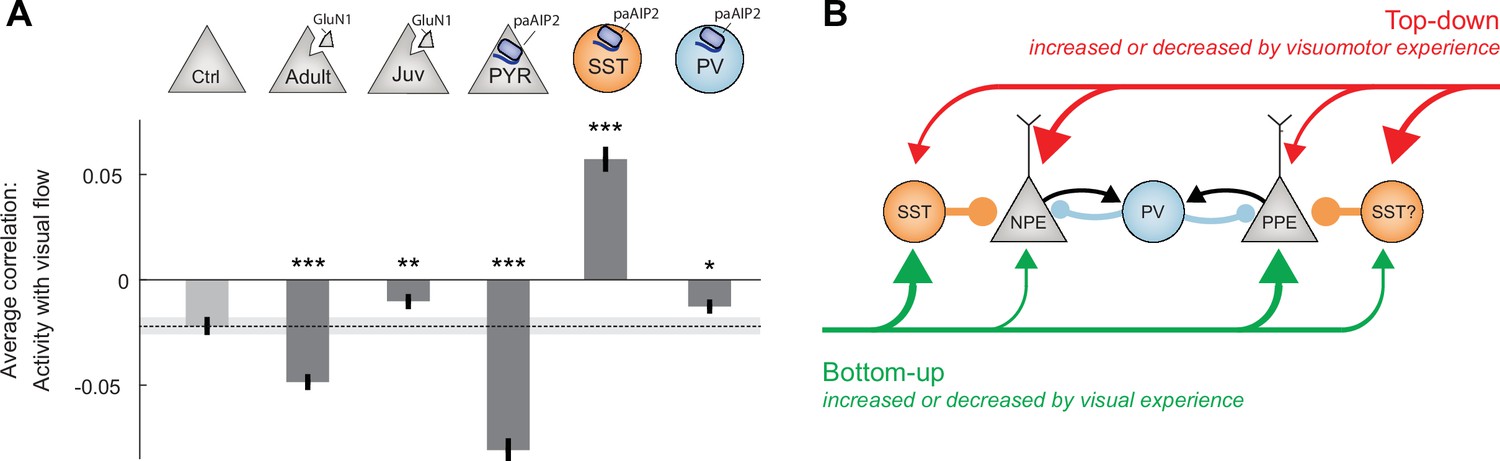
Calcium/calmodulin-dependent kinase II (CaMKII) inhibition in somatostatin (SST) interneurons during the first visuomotor experience reduced visually driven inhibition.
(A) Mean correlation between neuronal activity and visual flow in the open-loop condition for all L2/3 excitatory neurons recorded in adult control, ΔGrin1adult, ΔGrin1juv, paAIP2CaMKIIα, paAIP2SST, and paAIP2PV mice. Error bars indicate the standard error of the mean (SEM) across neurons. Dashed black line and corresponding gray shading indicate the mean correlation of activity and visual flow and SEM of the adult control group; gray shading indicates SEM across neurons. Comparison against adult control data: n.s.: p>0.05, **p<0.01, ***p<0.001. For all details of statistical testing, see Supplementary file 1A. (B) Through visuomotor experience, local plasticity in V1 establishes a balance between top-down and bottom-up input in L2/3 neurons (Jordan and Keller, 2020), which is thought to drive prediction error responses. In this model, we refer to neurons that receive strong bottom-up excitation and strong top-down inhibition as positive prediction error (PPE) neurons, while those that receive strong top-down excitation and strong bottom-up inhibition, we refer to as negative prediction error (NPE) neurons. Given that interfering with plasticity in either excitatory neurons or SST interneurons prevents normal development of visual responses in excitatory neurons, combined with the finding that visual responses in neither population of neurons depend on coupled visuomotor experience (Attinger et al., 2017), we conclude that visual experience is necessary and sufficient for shaping visual inputs onto both populations of neurons. As mismatch responses in excitatory neurons depend on visuomotor experience and are sensitive to blocking plasticity in excitatory neurons, the proper wiring of top-down input onto L2/3 excitatory neurons likely requires coupled visuomotor experience. SST interneurons likely mediate visually driven inhibition, and we speculate that they also mediate the top-down motor-related inhibition. The effect of interfering with plasticity in parvalbumin (PV) interneurons is consistent with the idea that they regulate overall gain of the circuit.
Author response image 1
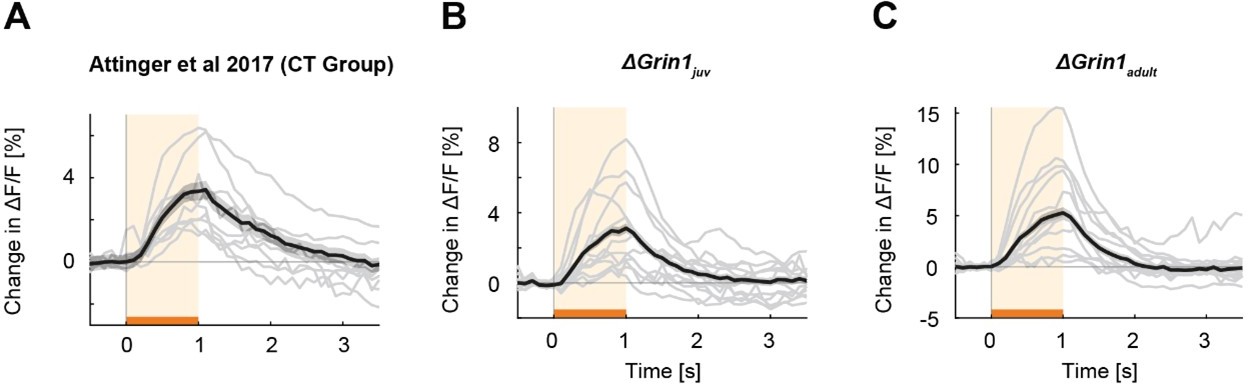
Mismatch responses per mouse.
Black lines are the average mismatch responses over mice, gray lines are the mismatch responses of individual mice (A) Data of coupled trained (CT) mice of the (Attinger et al., 2017) data. (B) Data of the ΔGrin1juv mice. (C) Data of the ΔGrin1adult mice. Representation as in Figure 2A.
Author response image 2
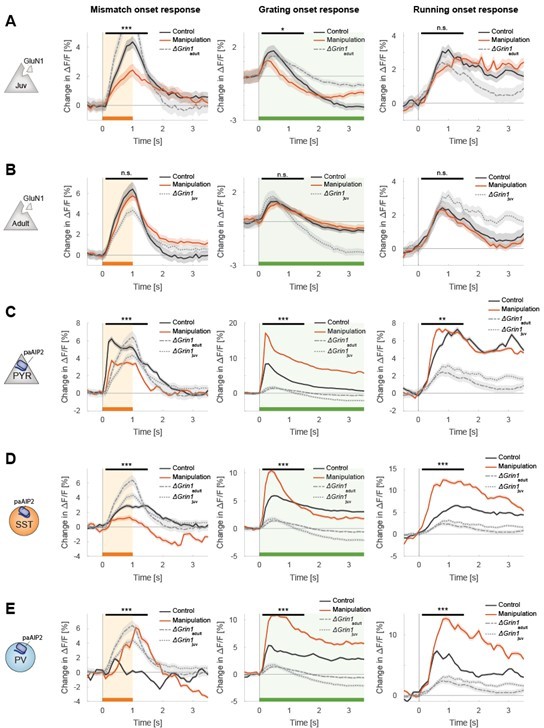
All plots as in the manuscript but overlaying additionally the data of the ΔGrin1juv and the ΔGrin1adult data.
(A) Data of ΔGrin1juv mice (B) Data of ΔGrin1adult mice, (C-E) Data for all three paAIP2 datasets. Representation as in Figures 2A-2C.
Author response image 3
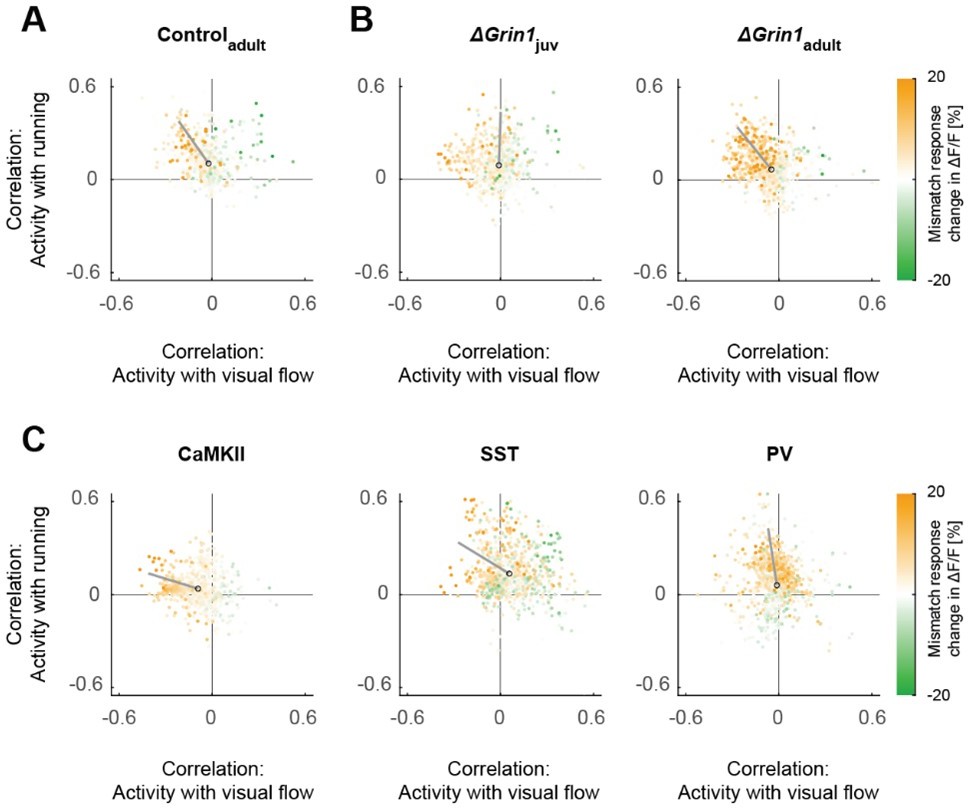
Scatter plots of the correlation between neuronal activity and visual flow, and the correlation between neuronal activity and running speed in open-loop sessions for (A) adult control mice, (B) the ΔGrin1juv and ΔGrin1adult dataset, and (C) all three paAIP2 datasets.
Corresponding to Figures 2E and 3E.
Author response image 4
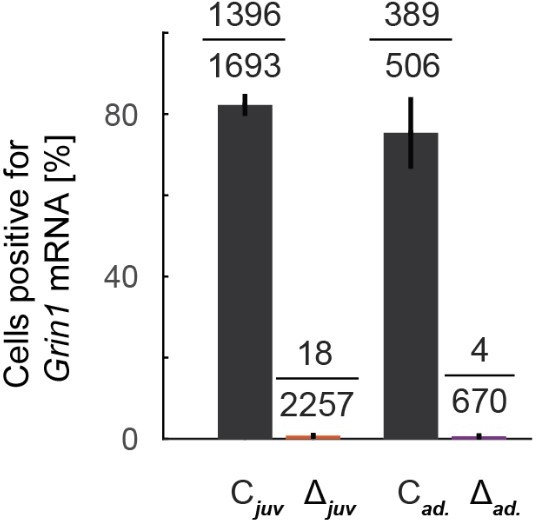
Analysis of Figure 1F split by age, matched to the two conditions used for the functional experiments, juvenile and adult.
Note, the data are based on multiple slices and quantification regions but are from one mouse each.
Tables
Key resources table
| Reagent type (species) or resource | Designation | Source or reference | Identifiers | Additional information |
|---|---|---|---|---|
| Strain, strain background (AAV) | AAV2/1-EF1α-GCaMP6f-WPRE | FMI vector core | 6.0 × 10¹¹–8.0 × 10¹² GC/ml | |
| Strain, strain background (AAV) | AAV2/1-EF1α-Cre-t2a-mcherry-WPRE | FMI vector core | 3.2 × 10¹¹–1.2 × 10¹³ GC/ml | |
| Strain, strain background (AAV) | AAV2/1-EF1α-Cre-WPRE | FMI vector core | 2.8 × 10¹⁰ GC/ml | |
| Strain, strain background (AAV) | AAV2/1-EF1α-NES-jRGECO1a-WPRE | FMI vector core | 4.8 × 10¹³ GC/ml | |
| Strain, strain background (AAV) | AAV2/1-CaMKIIα(1.3 kb)-mEGFP-P2A-paAIP2 | FMI vector core | 1.80 × 10¹³ GC/ml | |
| Strain, strain background (AAV) | AAV2/1-EF1α-DIO-mEGFP-P2A-paAIP2-WPRE | FMI vector core | 1.2 × 10¹³ GC/ml | |
| Strain, strain background (AAV) | AAV2/1-EF1α-mCherry- IRES-Flpo | FMI vector core | 1.3 × 10¹³ GC/ml | |
| Strain, strain background (Mus musculus) | C57BL6/J | Charles River | ||
| Strain, strain background (M. musculus) | Grin1tm2Stl/J | Jackson Laboratories | Cat# 005246 | |
| Strain, strain background (M. musculus) | Pvalbtm1(cre)Arbr | Jackson Laboratories | Cat# 008069 | |
| Strain, strain background (M. musculus) | Ssttm2.1(cre)Zjh | Jackson Laboratories | Cat# 018973 | |
| Chemical compound, drug | Fentanyl citrate | Actavis | CAS 990-73-8 | |
| Chemical compound, drug | Midazolam (Dormicum) | Roche | CAS 59467-96-8 | |
| Chemical compound, drug | Medetomidine (Domitor) | Orion Pharma | CAS 86347-14-0 | |
| Chemical compound, drug | Ropivacaine | Presenius Kabi | CAS 132112-35-7 | |
| Chemical compound, drug | Lidocaine | Bichsel | CAS 137-58-6 | |
| Chemical compound, drug | Buprenorphine | Reckitt Benckiser Healthcare | CAS 52485-79-7 | |
| Chemical compound, drug | Ophthalmic gel (Humigel) | Virbac | ||
| Chemical compound, drug | Flumazenil (Anexate) | Roche | CAS 78755-81-4 | |
| Chemical compound, drug | Atipamezole (Antisedan) | Orion Pharma | CAS 104054-27-5 | |
| Chemical compound, drug | N-Butyl-2-cyanoacrylate (Histoacryl) | Braun | CAS 6606-65-1 | |
| Chemical compound, drug | Dental cement (Paladur) | Heraeus Kulzer | CAS 9066-86-8 | |
| Chemical compound, drug | MK-801 | Sigma | CAS 77086-22-7 | |
| Software, algorithm | MATLAB (2020b) | MathWorks | RRID:SCR_001622 | |
| Software, algorithm | LabVIEW | National Instruments | RRID:SCR_014325 | |
| Software, algorithm | Two-photon acquisition software | Keller laboratory | https://sourceforge.net/p/iris-scanning/ | |
| Software, algorithm | Image data processing software | Keller laboratory | https://sourceforge.net/p/iris-scanning/calliope | |
| Software, algorithm | Python | https://python.org | RRID:SCR_008394 | |
| Software, algorithm | Panda3D | https://panda3d.org | ||
| Software, algorithm | R (v 4.0) | https://r-project.org | RRID:SCR_001905 | |
| Software, algorithm | LIGER (v 0.5) | (Welch et al., 2019) https://github.com/welch-lab/liger | RRID:SCR_018100 | |
| Software, algorithm | DropletUtils (v 1.8) | https://bioconductor.org | ||
| Software, algorithm | Seurat (v 3.1.5.9008) | https://satijalab.org | RRID:SCR_016341 | |
| Software, algorithm | Scater (v 1.16.0) | https://bioconductor.org | RRID:SCR_015954 | |
| Other | mRNA probe Mm-Grin1-O1 (probe region 2892–4127) | ACD bio | Cat# 473079 | |
| Other | Optogenetic-stimulation laser (OBIS 473 nm LX) | Coherent | Cat# 1187194 |
Additional files
-
Supplementary file 1
Statistical information.
(A) Table of all statistical information for all figure panels that display the results of statistical testing. (B) List of the number of mice of each genotype for each experiment.
- https://cdn.elifesciences.org/articles/71476/elife-71476-supp1-v2.docx
-
Transparent reporting form
- https://cdn.elifesciences.org/articles/71476/elife-71476-transrepform1-v2.pdf
Download links
A two-part list of links to download the article, or parts of the article, in various formats.
Downloads (link to download the article as PDF)
Open citations (links to open the citations from this article in various online reference manager services)
Cite this article (links to download the citations from this article in formats compatible with various reference manager tools)
NMDA receptors in visual cortex are necessary for normal visuomotor integration and skill learning
eLife 11:e71476.
https://doi.org/10.7554/eLife.71476


