Spatial transcriptomics reveals metabolic changes underly age-dependent declines in digit regeneration
- Department of Orthopaedics, Johns Hopkins University, United States
- Department of Surgery, Tulane School of Medicine, United States
- Department of Mathematics, Tulane University, United States
- Department of Biological & Agricultural Engineering, Louisiana State University, United States
- Center for Molecular Medicine, Maine Medical Center Research Institute, United States
- Department of Orthopaedic Surgery, Louisiana State University Health Sciences Center, United States
Figures
Figure 1 with 3 supplements
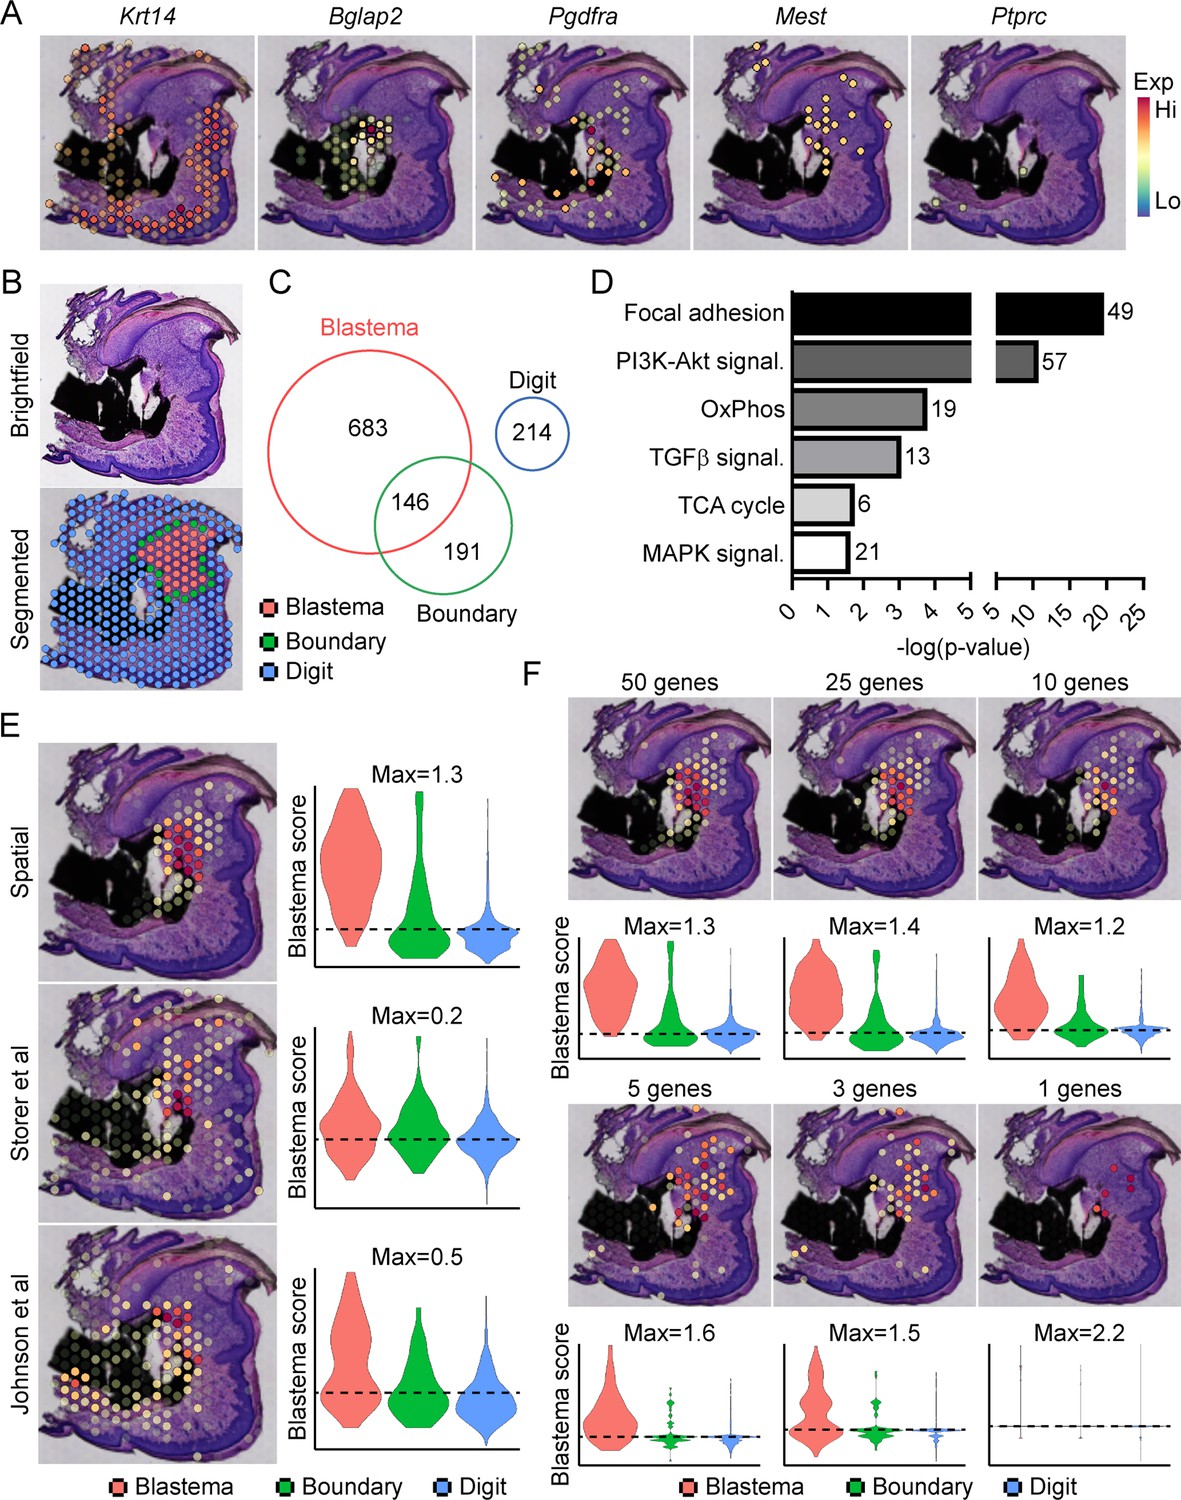
Transcriptional profiling of the blastema using spatial transcriptomics.
(A) Representative spatial gene expression of epithelial (Krt14), bone (Bglap2), blastema (Pdgfra, Mest), and hematopoietic cell (CD45, encoded by Ptprc) transcripts. (B) Manual segmentation of spatial data into blastema (red), boundary (green), and remaining digit spots (blue) based on histological guidance. (C) Differentially expressed genes (DEGs) showing enriched expression in the blastema, boundary spots, or remaining digit. (D) Pathway analysis of genes showing enriched expression in the blastema. Number at end of bar denotes the number of significantly regulated genes assigned to each indicated KEGG term. (E) Module scoring of top 100 blastema genes derived from spatial transcriptomics or single-cell RNA sequencing (scRNAseq) (Storer et al., 2020; Johnson et al., 2020). (F) Blastema module scoring based on decreasing numbers of genes as indicated. Dotted lines denote a blastema modular score of 0 with higher values indicative of enrichment for the blastema fingerprint.
Figure 1—figure supplement 1
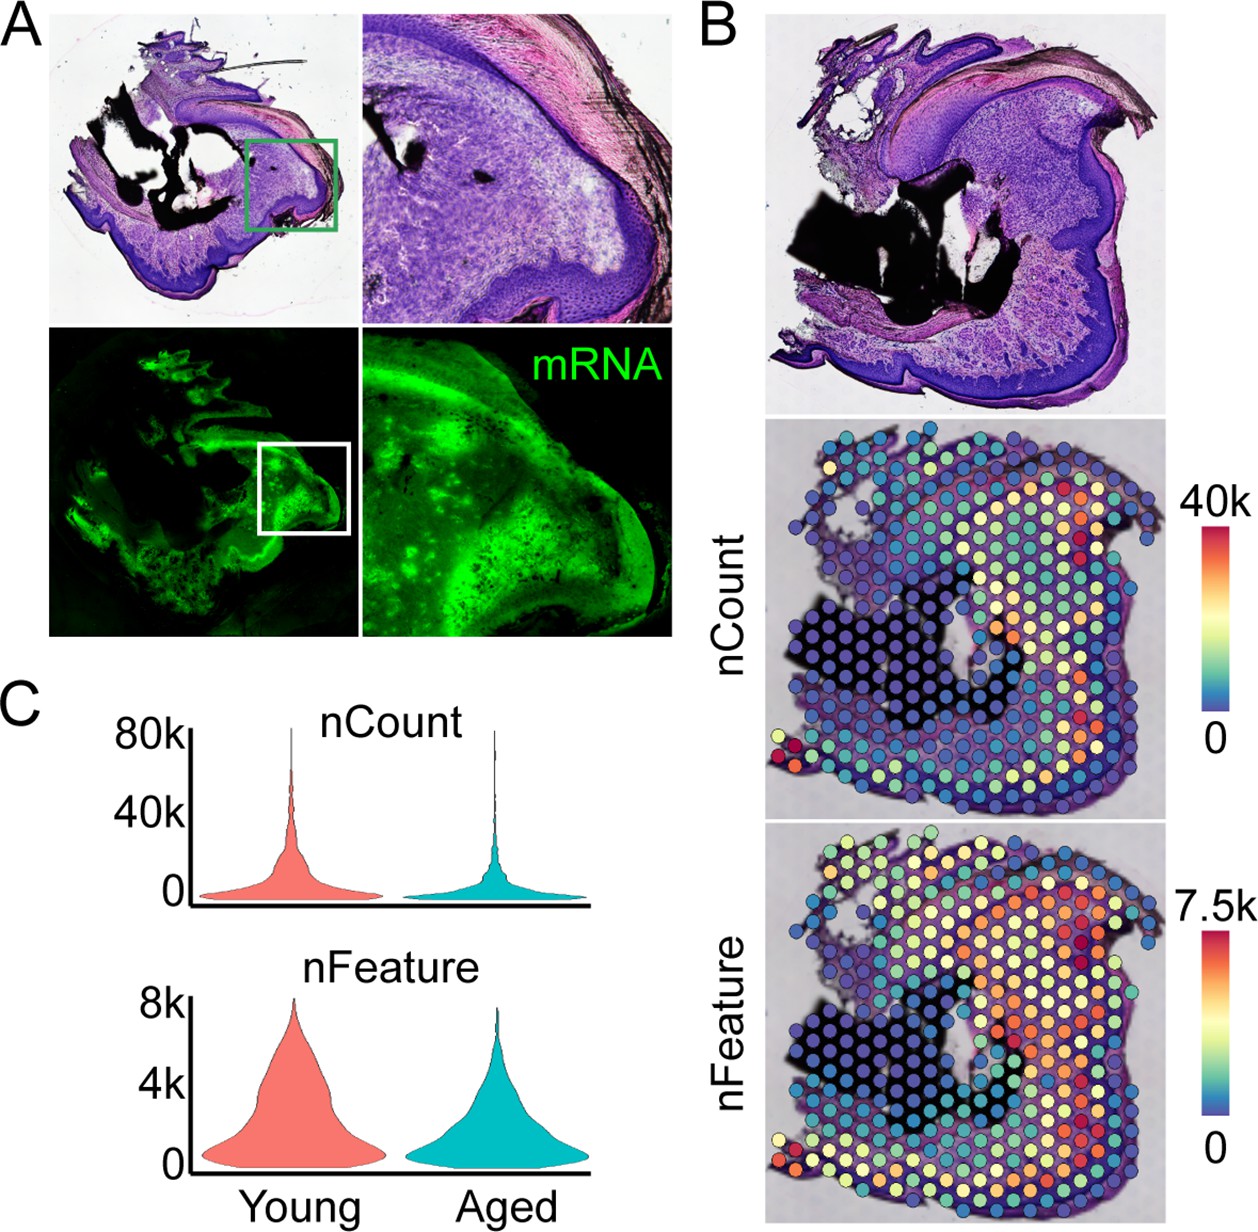
Overview of spatial transcriptomics approach.
(A) Fresh frozen samples are sectioned onto slides, subjected to a modified hematoxylin and eosin (H&E) and imaged. Optimization of enzymatic permeabilization, visualized through incorporation of fluorescent nucleotides during first strand synthesis of captured mRNAs. (B) Spatial barcodes are used to map each transcript back to its 2D position of origin, registered to the original H&E image. (C) Spatial distribution of counts and features of mRNA molecules.
Figure 1—figure supplement 2
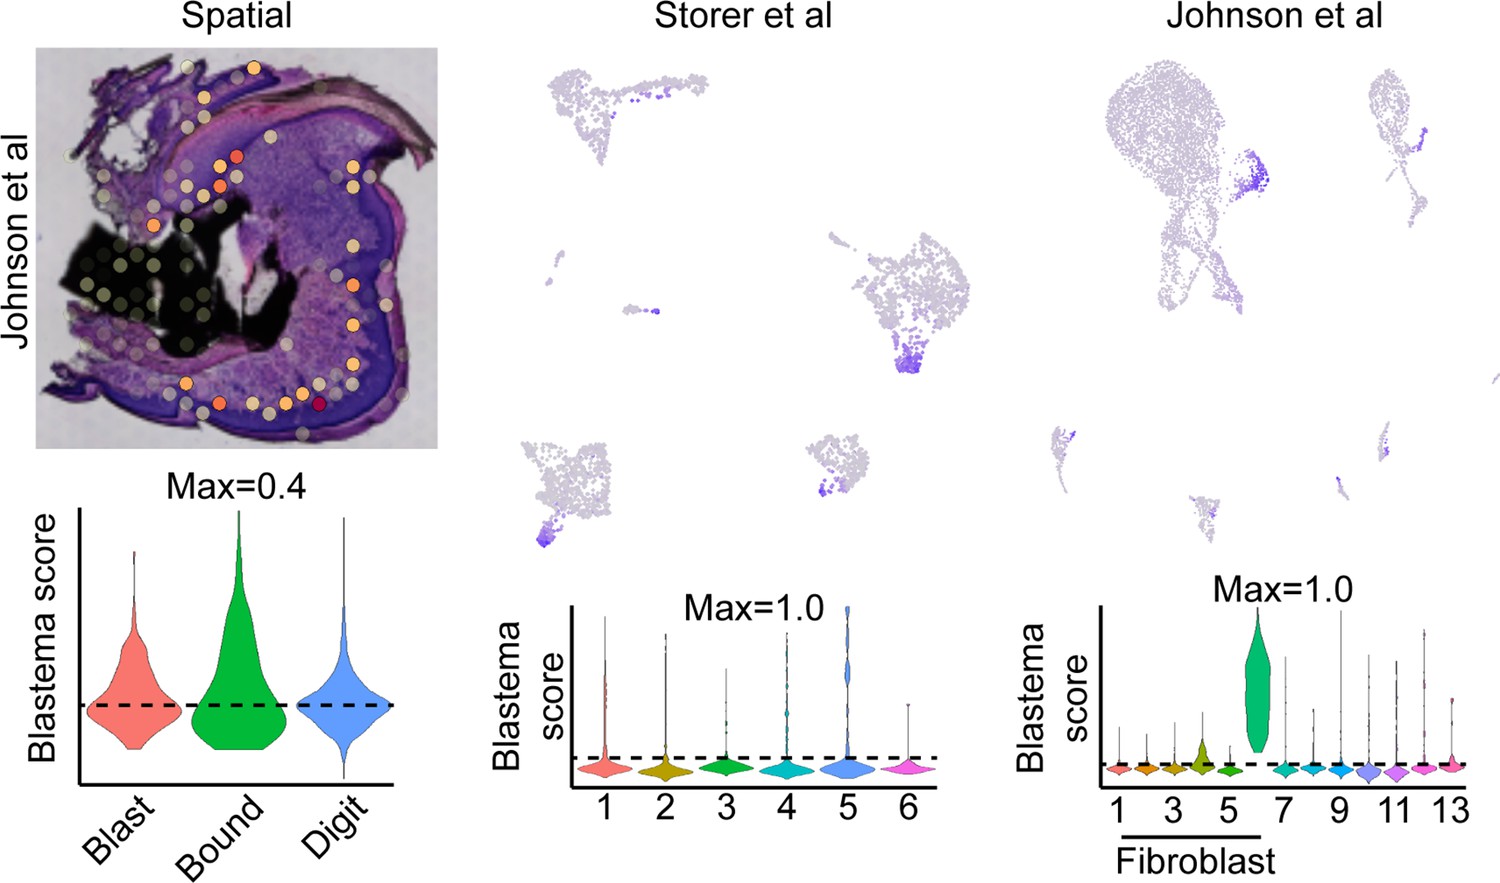
Exclusion of cell cycling cells identified in fibroblast cluster 8 from Johnson et al., 2020, improves labeling proficiency of the spatial blastema footprint.
Module scoring of the blastema signature derived from all fibroblast-like cell populations from Johnson et al. mapped to spatial data (left), or single-cell RNA sequencing (scRNAseq) data derived from Storer et al., 2020 (middle) or Johnson et al., 2020 (right).
Figure 1—figure supplement 3
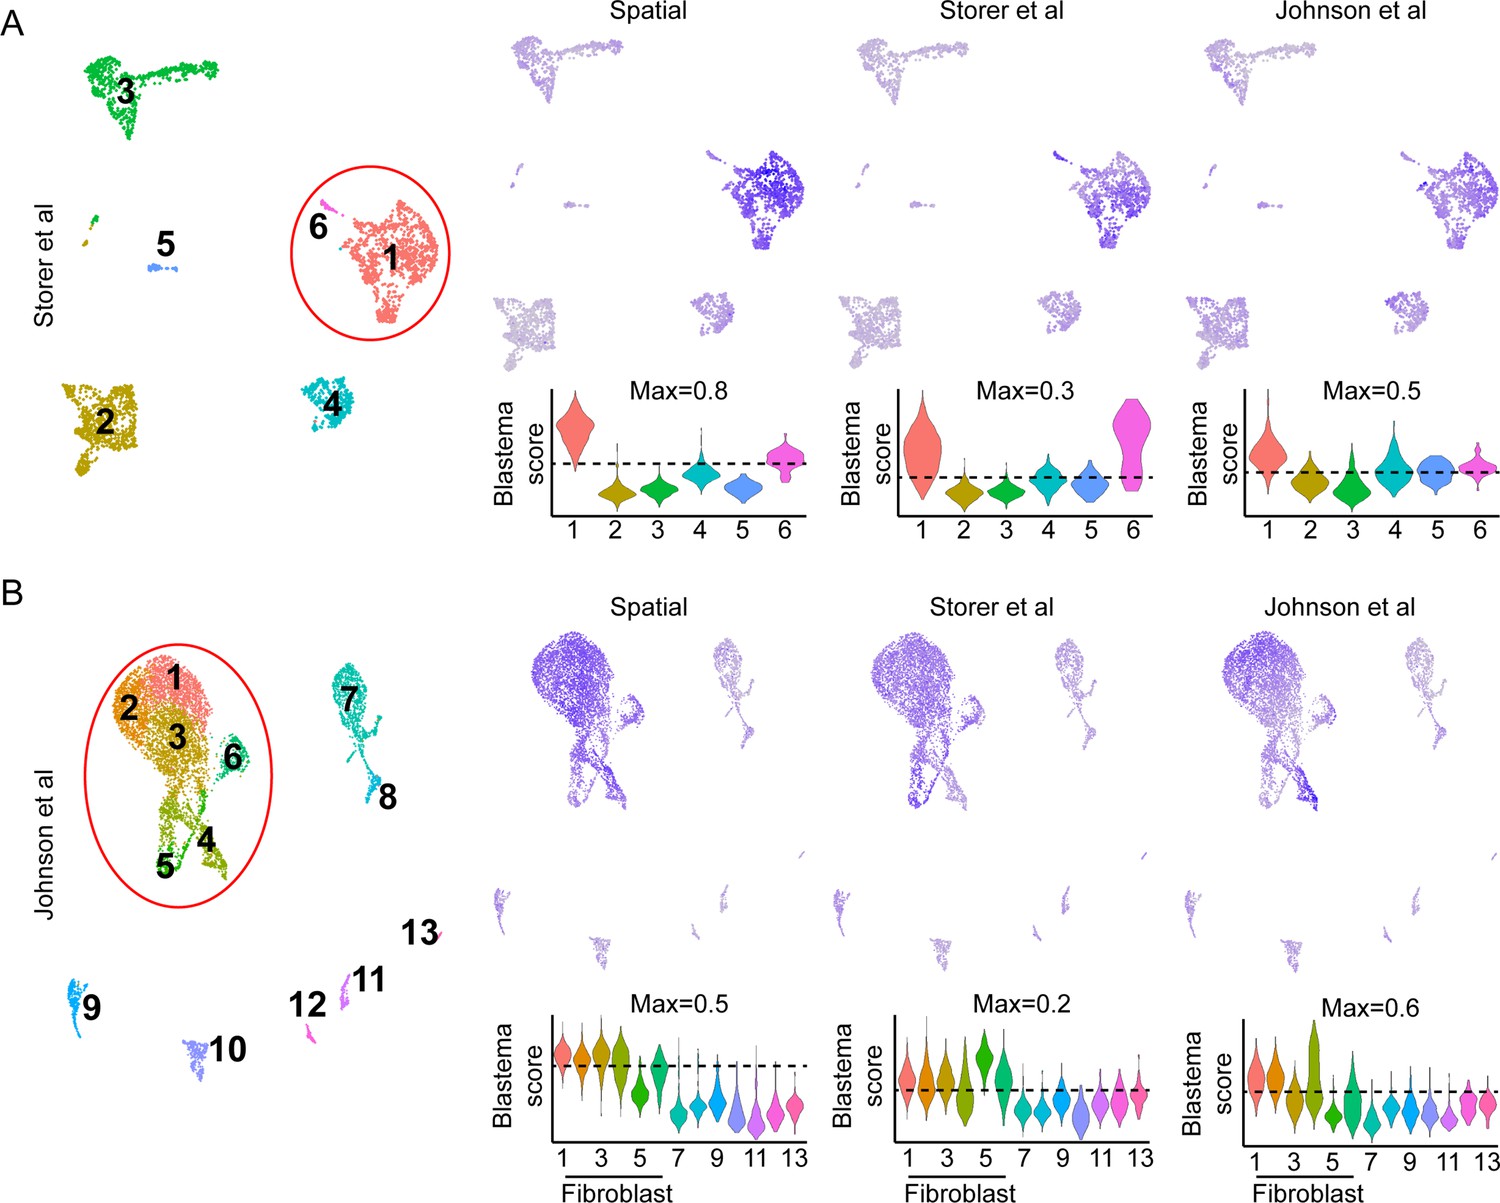
Comparison of blastema gene signatures in single-cell RNA sequencing (scRNAseq) data sets.
UMAP (left) and module scoring of blastema signature genes from Supplementary file 4 mapped to the (A) (Storer et al., 2020) or (B) (Johnson et al., 2020) data sets.
Figure 2
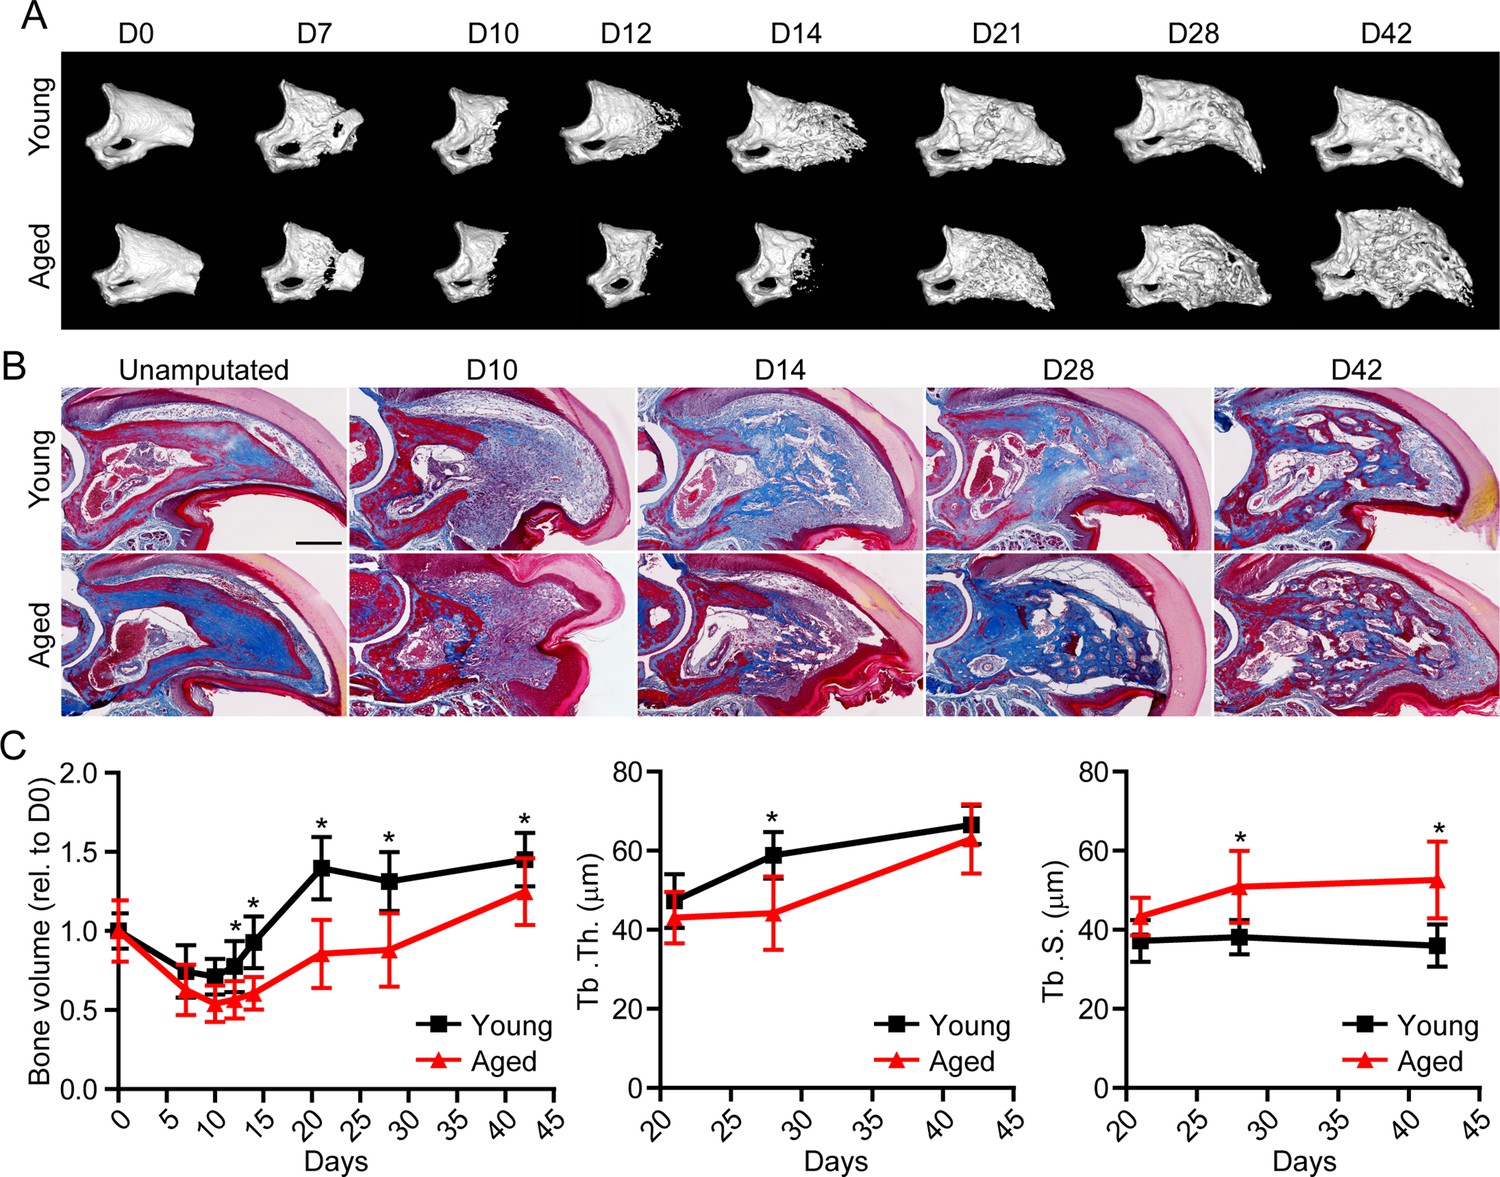
Aged mice show impaired regeneration in the digit tip amputation model.
(A) Radiographic imaging from day 0 to day 42 (D0 to D42) in young and aged mice following amputation of the distal P3. (B) Masson’s trichrome staining of young and aged mice. (C) Micro-computed tomography (micro-CT) quantification of bone volume (relative to D0), trabecular thickness (Tb. Th.), and trabecular separation (Tb. S.) of regenerated bone over time. Graphs represent average values ± SD. n=4–14 digits/time point/age. *p<0.05.
Figure 3 with 1 supplement
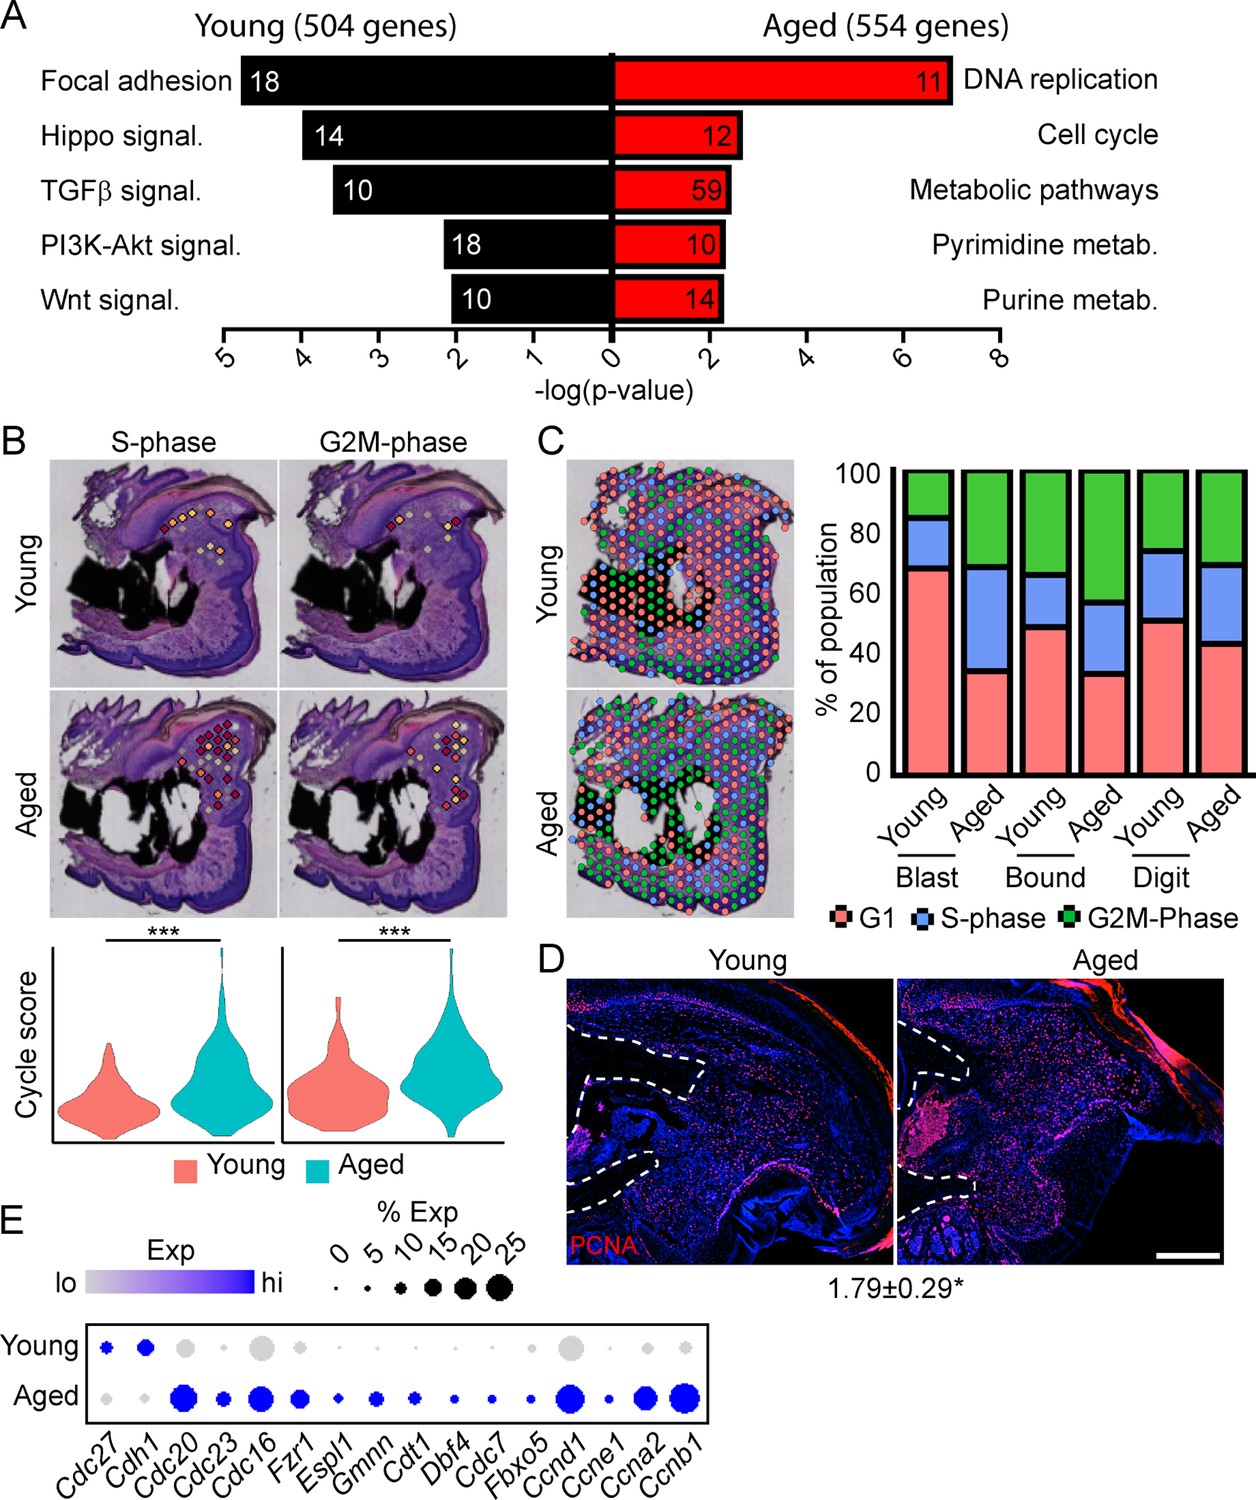
Spatial transcriptomics reveals altered cellular metabolism in aged mice.
(A) Pathway analysis of blastema genes showing differential expression between the young and aged blastema. Number at end of bar denotes the number of significantly regulated genes assigned to each indicated gene ontology (GO term). (B) Spatial and violin plots showing S-phase and G2M-phase cell cycle scoring in the blastemas of young and aged mice. (C) Cumulative distribution of indicated cell cycle phase assignment for each region of the digit. (D) PCNA immunofluorescence in young and aged blastemas. n=3–4. Numbers below image represent the ratio of PCNA-positive nuclei ± SD in aged blastemas relative to young, with values over 1 indicating increased proliferation in aged blastema. Scale bar, 200 µm. (E) Dot plot showing relative expression of cell cycle progression genes in young and aged spatial blastema. Values represent average values ± SD. ***p<0.001, *p<0.05.
Figure 3—figure supplement 1
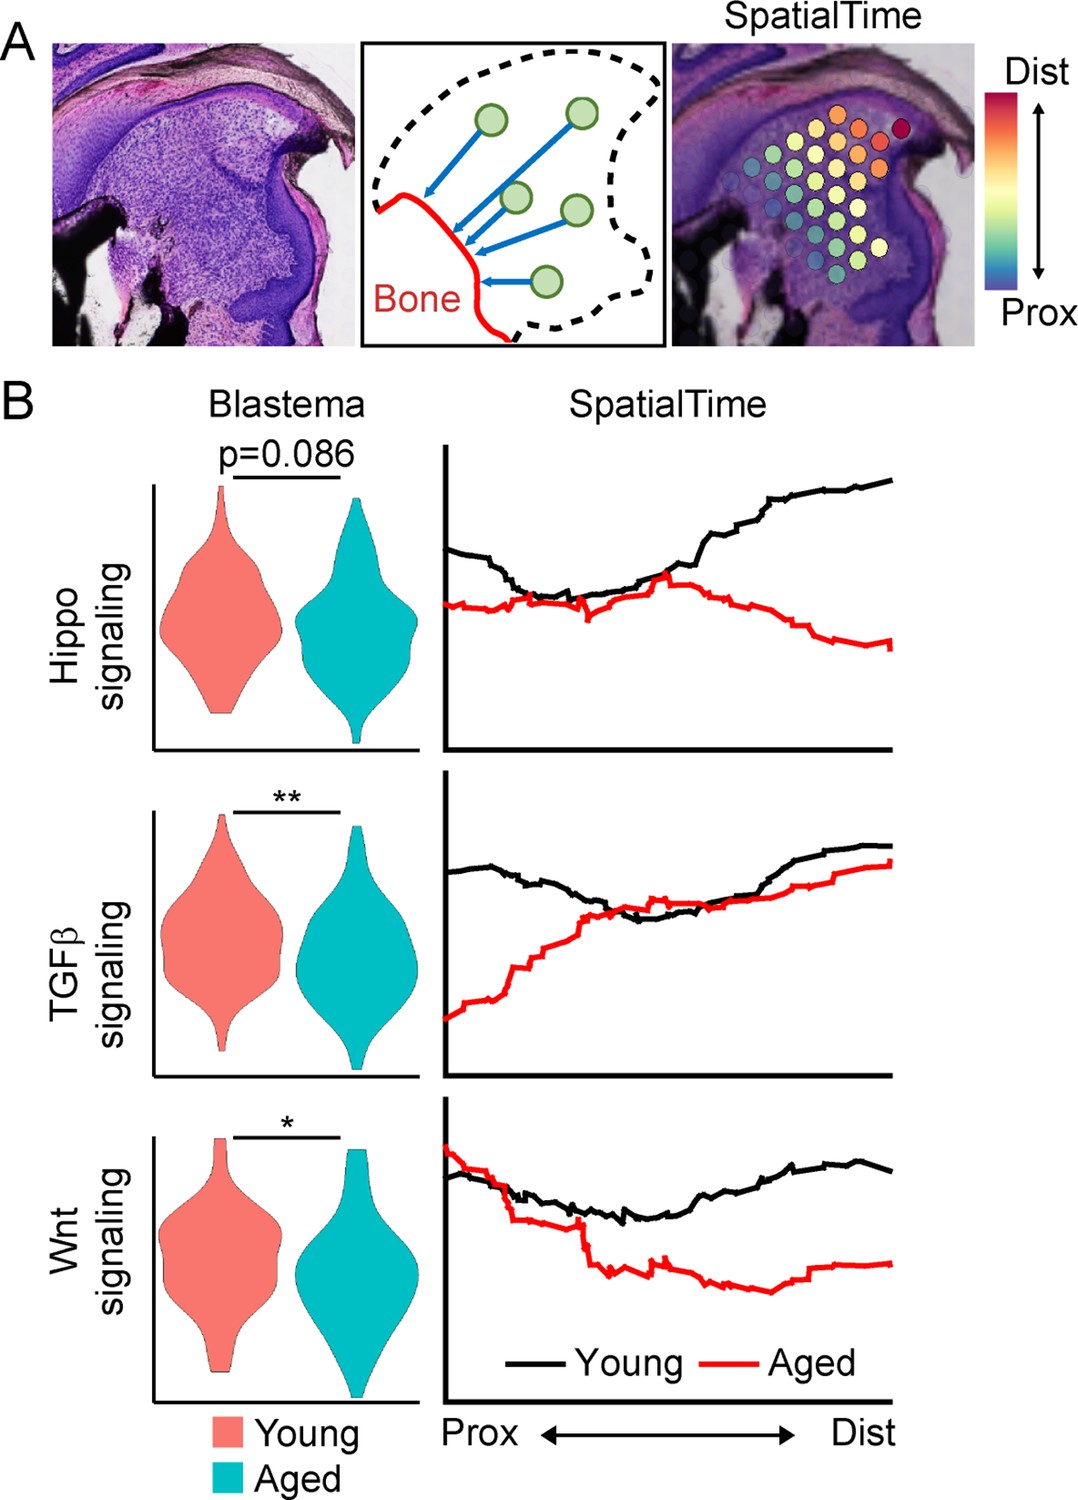
SpatialTime analysis of the young and aged blastema reveals regional specific changes in pathway activation between young and aged mice.
(A) Assignment of SpatialTime values to spatial spots within the blastema from the proximal to distal ends using the residual bone stump as reference. (B) Module scoring for activation of pathways identified from Figure 3A within the overall blastema (left) or across SpatialTime (right). *p<0.05, **p<0.01.
Figure 4 with 1 supplement
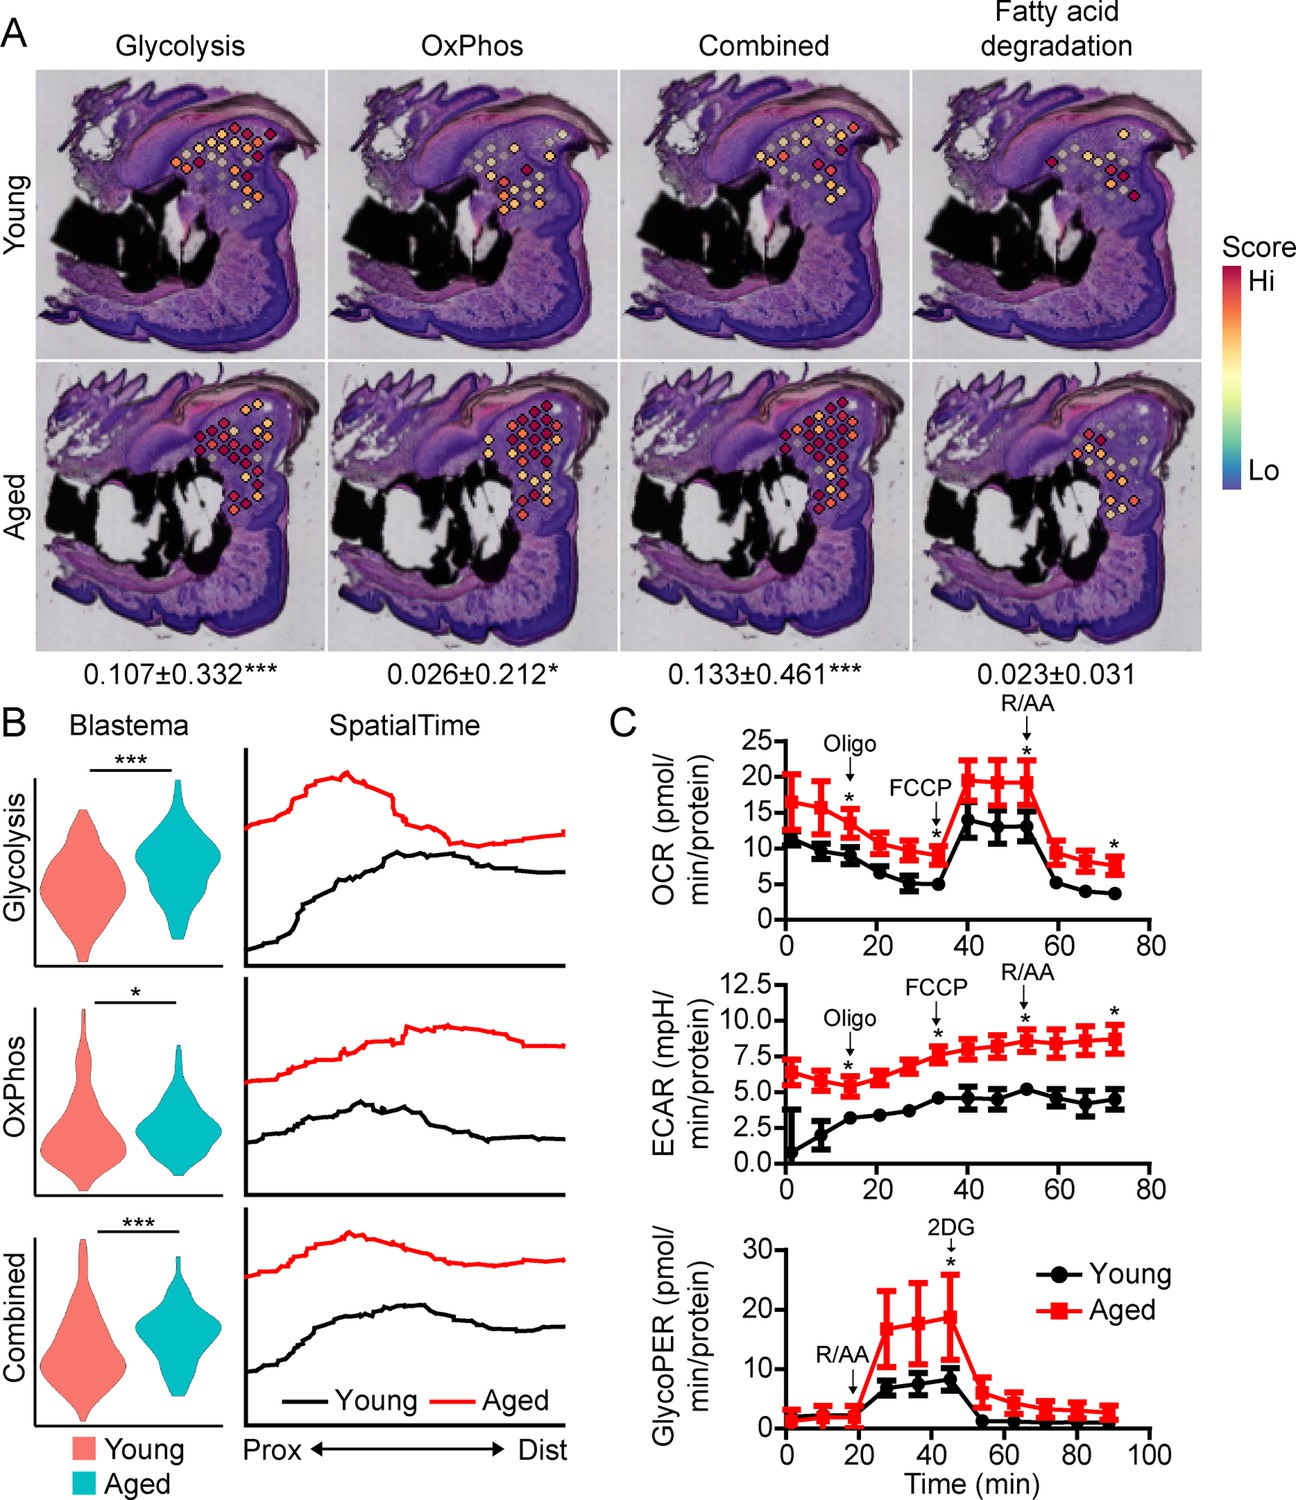
Aged blastemas have increased bioenergetics.
(A) Module scoring for cell metabolism pathways within young and aged blastemas. Combined is the cumulative module scoring values of glycolysis and oxidative phosphorylation (OxPhos). Values below images indicate difference in spatial spot module score within pooled blastema of aged vs. young mice ± SD, with values above 0 indicating increased activation in aged blastema. (B) Violin (left) and SpatialTime plot showing metabolic module score. Prox, proximal; Dist, distal. (C) Seahorse Mito Stress Test (oxygen consumption rate, OCR; extracellular acidification rate, ECAR) and Glycolytic Rate Assay (glycolygic proton efflux rate, GlycoPER) of dissected blastema from young and aged mice (Oligo, oligomycin; R/AA, rotenone/antimycin A). n=8–9 mice. Graphs represent average values ± SEM. *p<0.05, ***p<0.001.
Figure 4—figure supplement 1
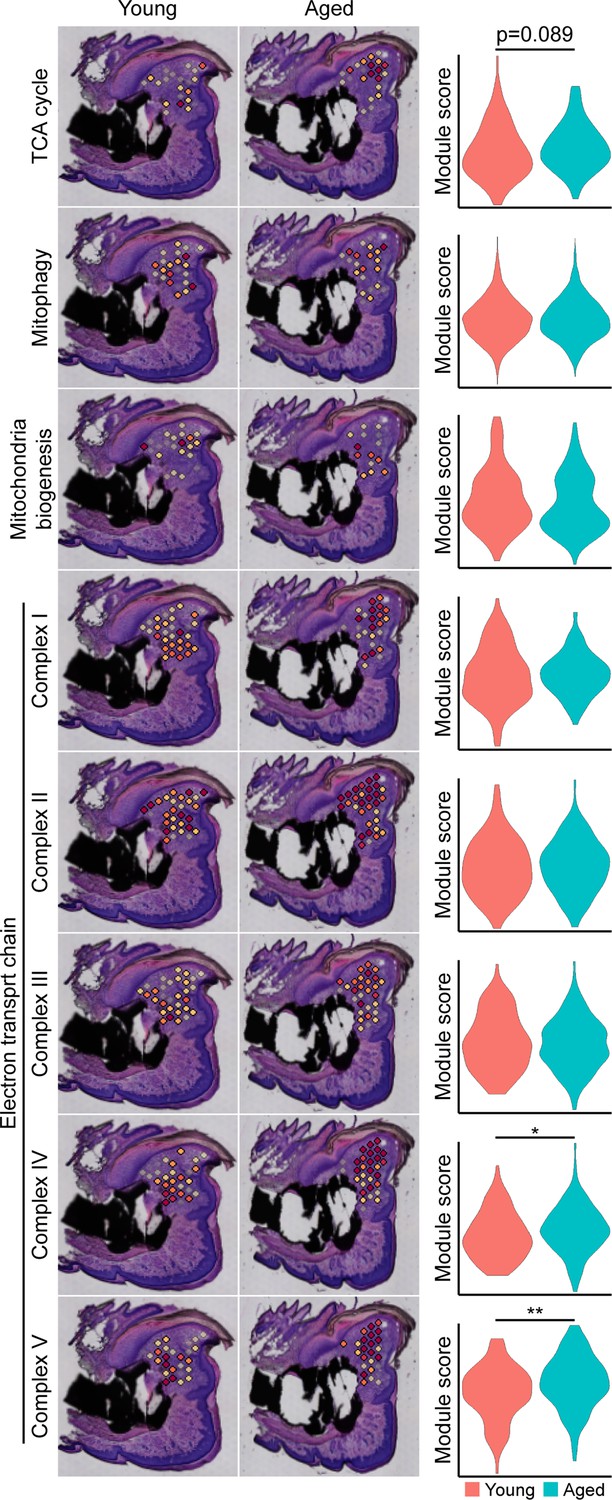
Metabolic pathway-specific changes within the blastema of young and aged mice.
Spatial and violin plots of module scoring for indicated metabolic pathway in young and aged blastemas. *p<0.05, **p<0.01.
Figure 5

Increased intracellular hypoxia and vascularization in aged mice.
(A) Spatial module scoring of hypoxia-related transcripts. (B) Hypoxyprobe staining in young and aged blastema. Scale bar, 100 µm. Dotted lines indicate the P3 cortical bone stump. (C) Spatial module scoring of vascular endothelial growth factor (VEGF) signaling. (D) Spatial module scoring of vascular markers. Values below images indicate difference in spatial spot module score or hypoxyprobe fluorescent intensity within pooled blastema of aged minus young mice ± SD, with values above 0 indicating increased activation in aged blastema. (E) SpatialTime analysis of the vascular module score from the proximal (residual bone stump) to distal blastema tip in young and aged mice. (F) Hematoxylin and eosin (H&E) staining and immunofluorescent imaging of CD31 showing increased vascularization within the blastema of aged mice at day 10. Scale bar, 100 µm. Arrow heads denote immature vessels. (G) Hypoxyprobe and CD31 staining of digits at day 42. Scale bar, 250 µm. (H) Micro-computed tomography (micro-CT)-based inner void calculations within the regenerated digit. Graphs represent average values ± SD. n=4–6 samples/condition. *p<0.05, **p<0.01, ***p<0.001.
Figure 6
Treatment with oxaloacetate (OAA) enhances regeneration in aged mice.
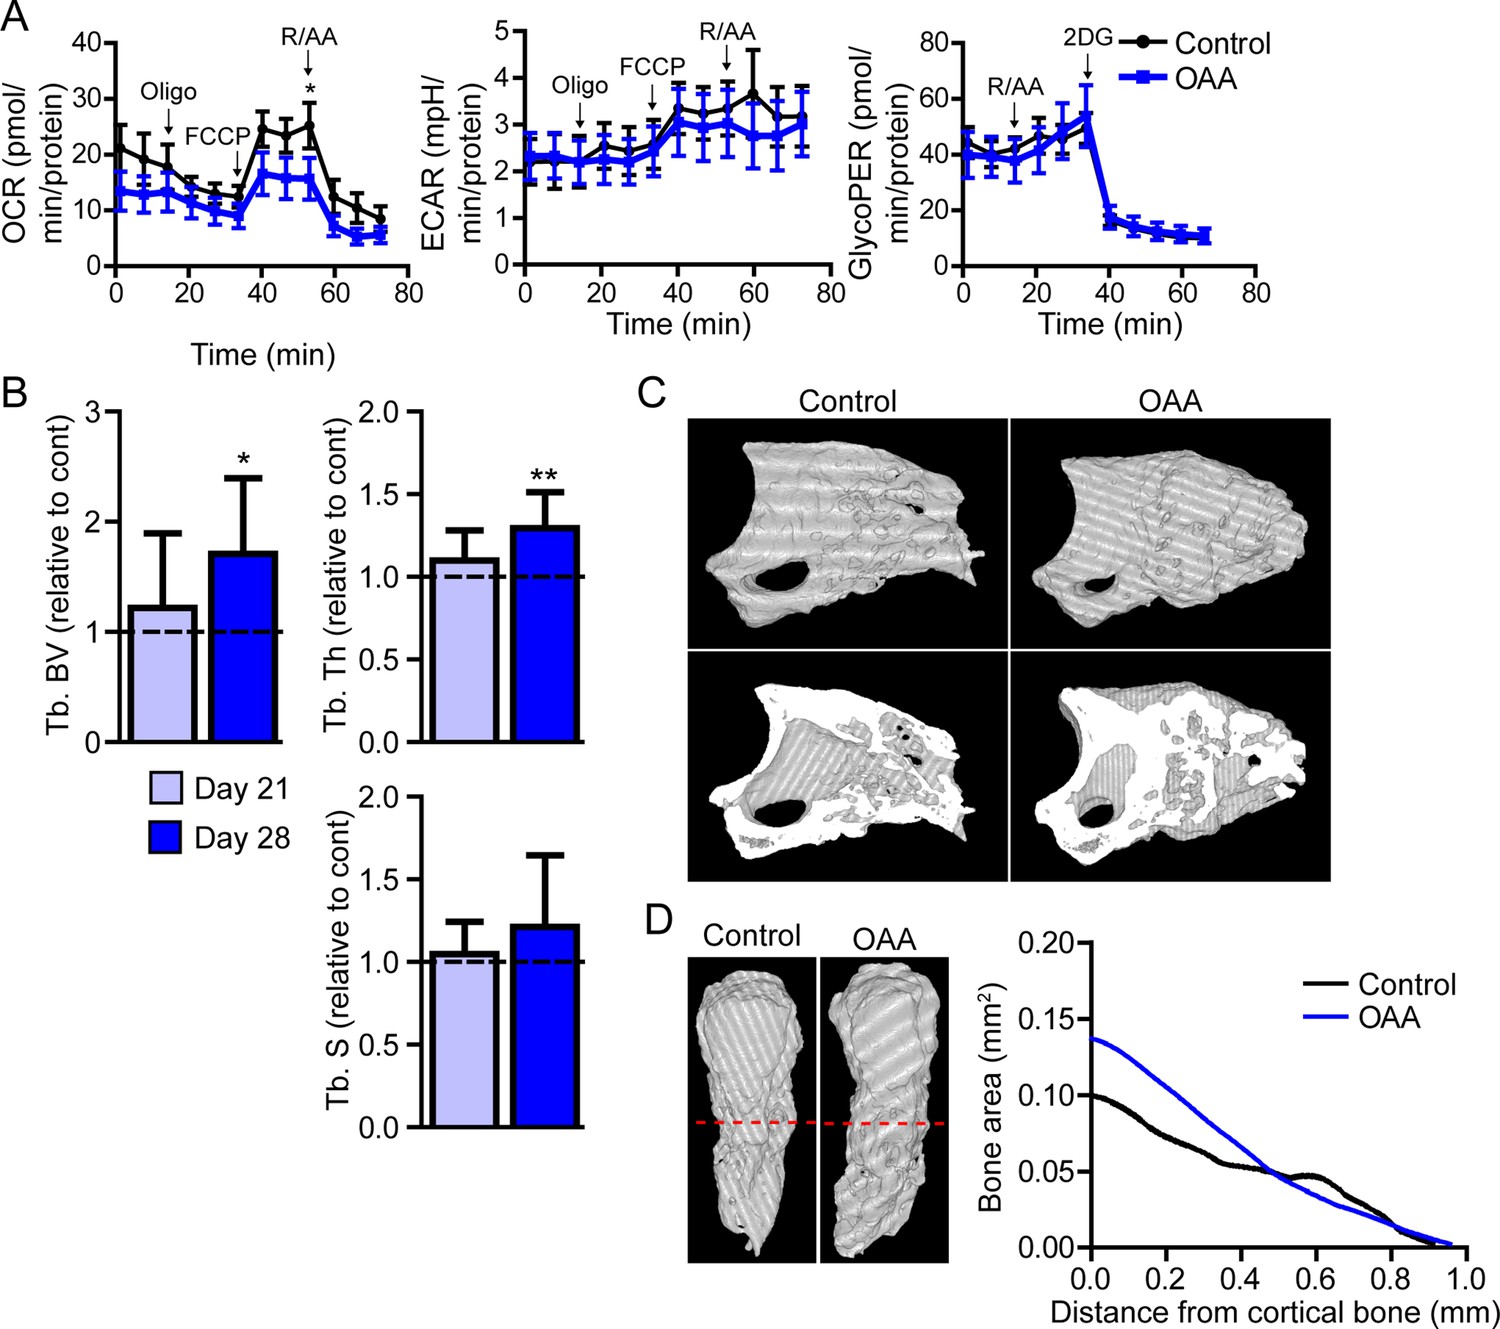
(A) Seahorse Mito Stress Test (oxygen consumption rate, OCR; extracellular acidification rate, ECAR) and Glycolytic Rate Assay (glycolygic proton efflux rate, GlycoPER) of dissected blastema from aged mice treated with oxaloacetate (OAA) (Oligo, oligomycin; R/AA, rotenone/antimycin A). (B) Micro-computed tomography (micro-CT) quantification of trabecular bone volume (Tb. BV.), trabecular thickness (Tb. Th.), and trabecular separation (Tb. S.) of regenerated OAA treated bone at day 21 and day 28 post amputation, relative to time-matched, saline-treated controls. n=11–19 digits/group. Graphs represent average values ± SEM. *p<0.05, **p<0.01, ***p<0.001. (C) Representative whole (top) or bisected (bottom) day 28 digits from saline control or OAA-treated mice. (D) 2D micro-CT analysis of regenerated bone from the remaining P3 cortical bone stump extending distally from aged saline control and OAA-treated mice.
Figure 7
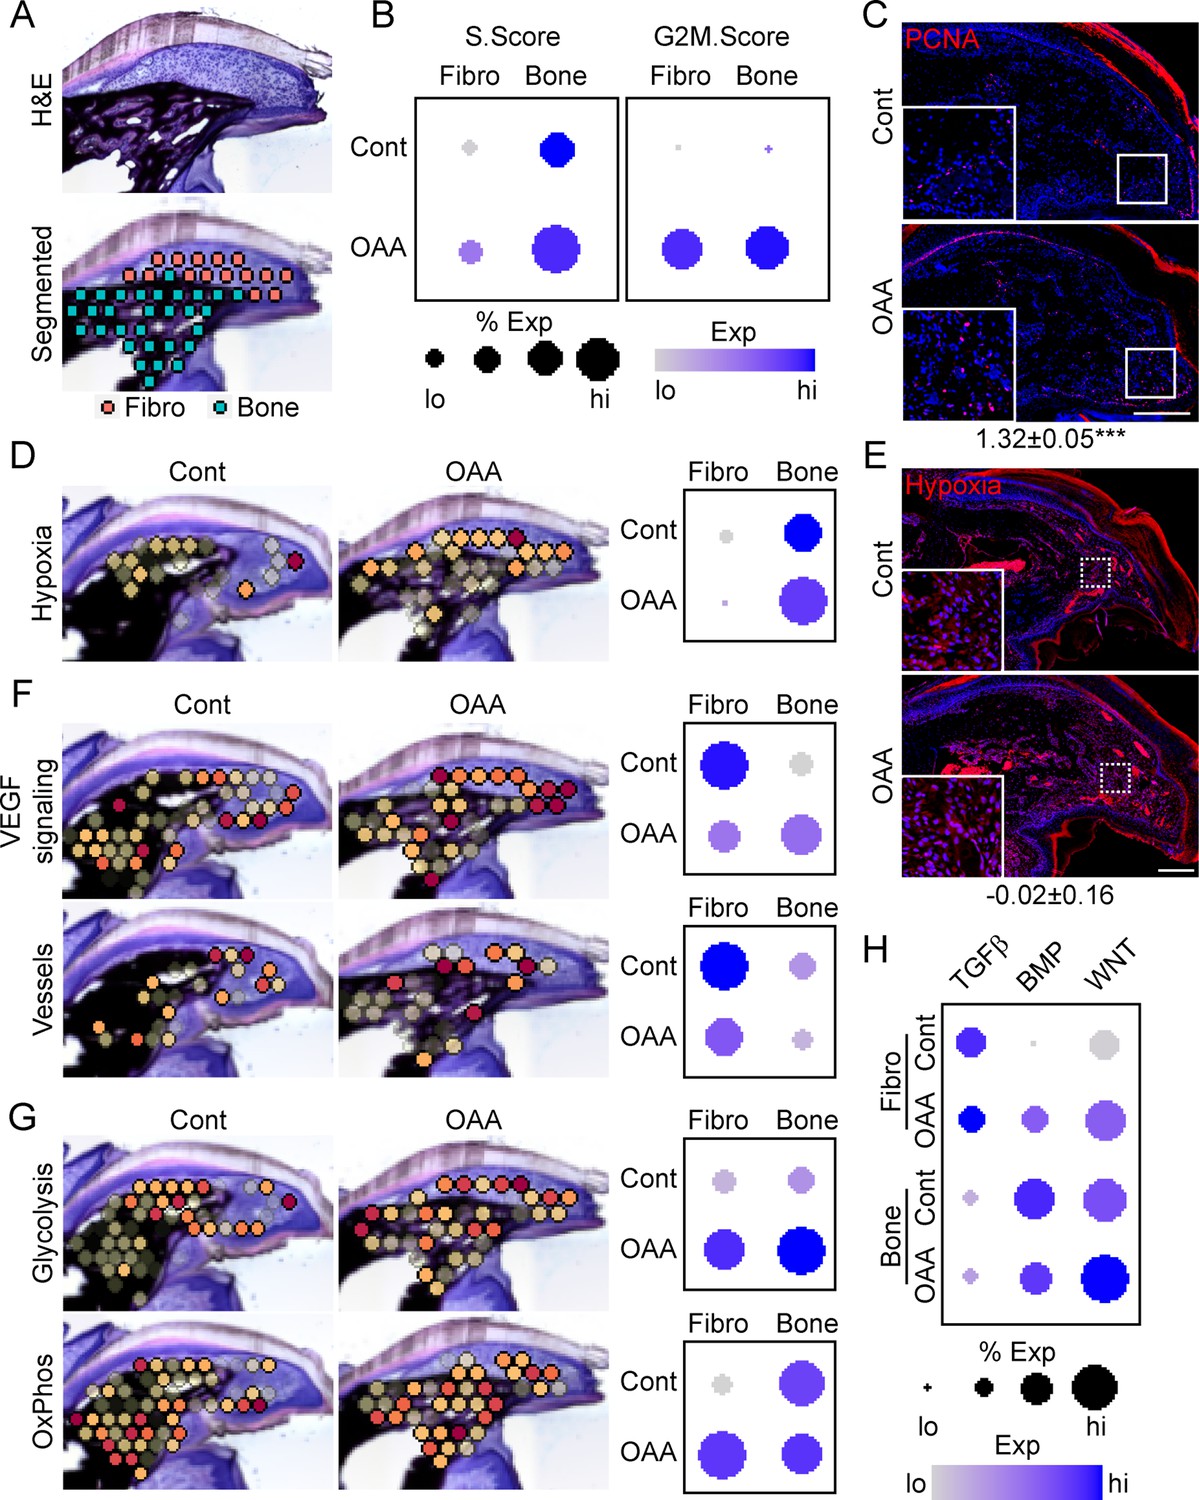
Oxaloacetate (OAA) treatment promotes proliferation and WNT signaling.
(A) Aged mice treated daily with OAA from D10 were sacrificed at D21 and subjected to spatial transcriptomics and the regenerated digit divided into fibroblast (fibro) and bone areas. (B) S- and G2M-phase scoring of aged mice treated with OAA or saline controls (Cont). (C) PCNA immunofluorescence in OAA-treated aged mice vs. saline controls (D21). n=3. Numbers below image represent the ratio of PCNA-positive nuclei ± SD in aged mice treated with OAA relative to saline control, with values over 1 indicating increased proliferation in aged blastema. Scale bar, 200 µm. (D) Spatial and dot plots showing module scoring of hypoxia pathway activation. (E) Hypoxia as assessed by Hypoxyprobe immunofluorescence (D21). Values below images indicate difference in Hypoxyprobe fluorescent intensity within the regenerated digits of aged mice treated with OAA or saline control ± SD, with values below 0 indicating decreased activation in OAA-treated digits. Scale bar, 200 µm. (F) Spatial and dot plots showing module scoring of vascular endothelial growth factor (VEGF) signaling activation and vessel markers. (G) Spatial and dot plots showing module scoring of glycolysis and oxidative phosphorylation (OxPhos) activation. (H) Dot plots showing module scoring of transforming growth factor beta (TGFβ), BMP, and WNT pathway activation. n=4–7 digits per treatment group.
Author response image 1
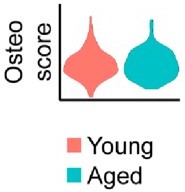
No notable shift in osteogenic transcript expression is observed by spatial transcriptomics.
Relative expression of osteogenic genes in the blastema of young and aged mice 10 days post amputation. This osteoscore is comprised of the following genes: Alpl, Bglap, Bglap2, Col1a1, Col1a2, Dmp1, Ibsp, Mef2c, Postn, Runx2, Sp7, Sparc, Phex, Satb2, Pth1r, Ostn, Car3.
Tables
Key resources table
| Reagent type (species) or resource | Designation | Source or reference | Identifiers | Additional information |
|---|---|---|---|---|
| Strain, strain background (Mus musculus) | CD1 | Charles River Laboratories | Strain 022 | Female and male, 6–22 months of age RRID:IMSR_CRL:022 |
| Chemical compound, drug | Oxaloacetate | Sigma | 07753 | Oxaloacetic acid |
| Other | Z-Fix | Anatech | 5701ZF | Fixative |
| Other | Decal I | Surgipath | Decalcifier | |
| Other | Blocking solution | Thermo | 27515 | Blocking solution |
| Commercial assay, kit | Masson’s Trichrome Kit | Poly Scientific | K037 | Stain kit |
| Commercial assay, kit | Tyramide signal amplification | Invitrogen | T20924 | |
| Commercial assay, kit | Hypoxyprobe Plus Kit | Hypoxyprobe | HP2 | Stain kit |
| Commercial assay, kit | Mito Stress Test Kit | Agilent Seahorse | 103015-100 | |
| Commercial assay, kit | Glycolytic Rate Assay Kit | Agilent Seahorse | 103344-100 | |
| Software, algorithm | GEN5IPRIME V3.05.11 | Biotek | ||
| Software, algorithm | GraphPad Prism 9 | GraphPad | ||
| Software, algorithm | CTAn | Bruker | ||
| Software, algorithm | NRECON | Bruker | ||
| Software, algorithm | CTVox | Bruker | ||
| Antibody | (Rabbit Monoclonal) Anti-CD31 antibody | Abcam | ab182981 | (1:100) |
| Antibody | (Mouse Monoclonal) Anti-PCNA antibody | Abcam | ab29 | RRID:AB_303394 (1:200) |
| Software, algorithm | CellRanger | Version 6 | 10× Genomics | |
| Software, algorithm | Seurat | Version 3 | R package | Stuart et al., 2019 |
| Software, algorithm | ggpubr | Version 0.4.0 | R package | Kassambara, STHDA July 2016 |
Additional files
-
Supplementary file 1
Differentially expressed genes (DEGs) preferentially expressed in the blastema.
- https://cdn.elifesciences.org/articles/71542/elife-71542-supp1-v1.csv
-
Supplementary file 2
Differentially expressed genes (DEGs) preferentially expressed in the boundary.
- https://cdn.elifesciences.org/articles/71542/elife-71542-supp2-v1.csv
-
Supplementary file 3
Differentially expressed genes (DEGs) preferentially expressed in the remaining digit.
- https://cdn.elifesciences.org/articles/71542/elife-71542-supp3-v1.csv
-
Supplementary file 4
Blastema fingerprint genes identified from published single-cell RNA sequencing (scRNAseq) and spatial transcriptomics.
- https://cdn.elifesciences.org/articles/71542/elife-71542-supp4-v1.csv
-
Supplementary file 5
Blastema differentially expressed genes (DEGs) differentially expressed between young and aged mice.
- https://cdn.elifesciences.org/articles/71542/elife-71542-supp5-v1.csv
-
Supplementary file 6
Spatial differentially expressed genes (DEGs) differentially expressed between control and oxaloacetate (OAA)-treated mice.
- https://cdn.elifesciences.org/articles/71542/elife-71542-supp6-v1.csv
-
Transparent reporting form
- https://cdn.elifesciences.org/articles/71542/elife-71542-transrepform1-v1.pdf
Download links
A two-part list of links to download the article, or parts of the article, in various formats.
Downloads (link to download the article as PDF)
Open citations (links to open the citations from this article in various online reference manager services)
Cite this article (links to download the citations from this article in formats compatible with various reference manager tools)
Spatial transcriptomics reveals metabolic changes underly age-dependent declines in digit regeneration
eLife 11:e71542.
https://doi.org/10.7554/eLife.71542


