Experience-dependent weakening of callosal synaptic connections in the absence of postsynaptic FMRP
- Department of Neuroscience, O’Donnell Brain Institute, University of Texas Southwestern Medical Center, United States
Figures
Figure 1
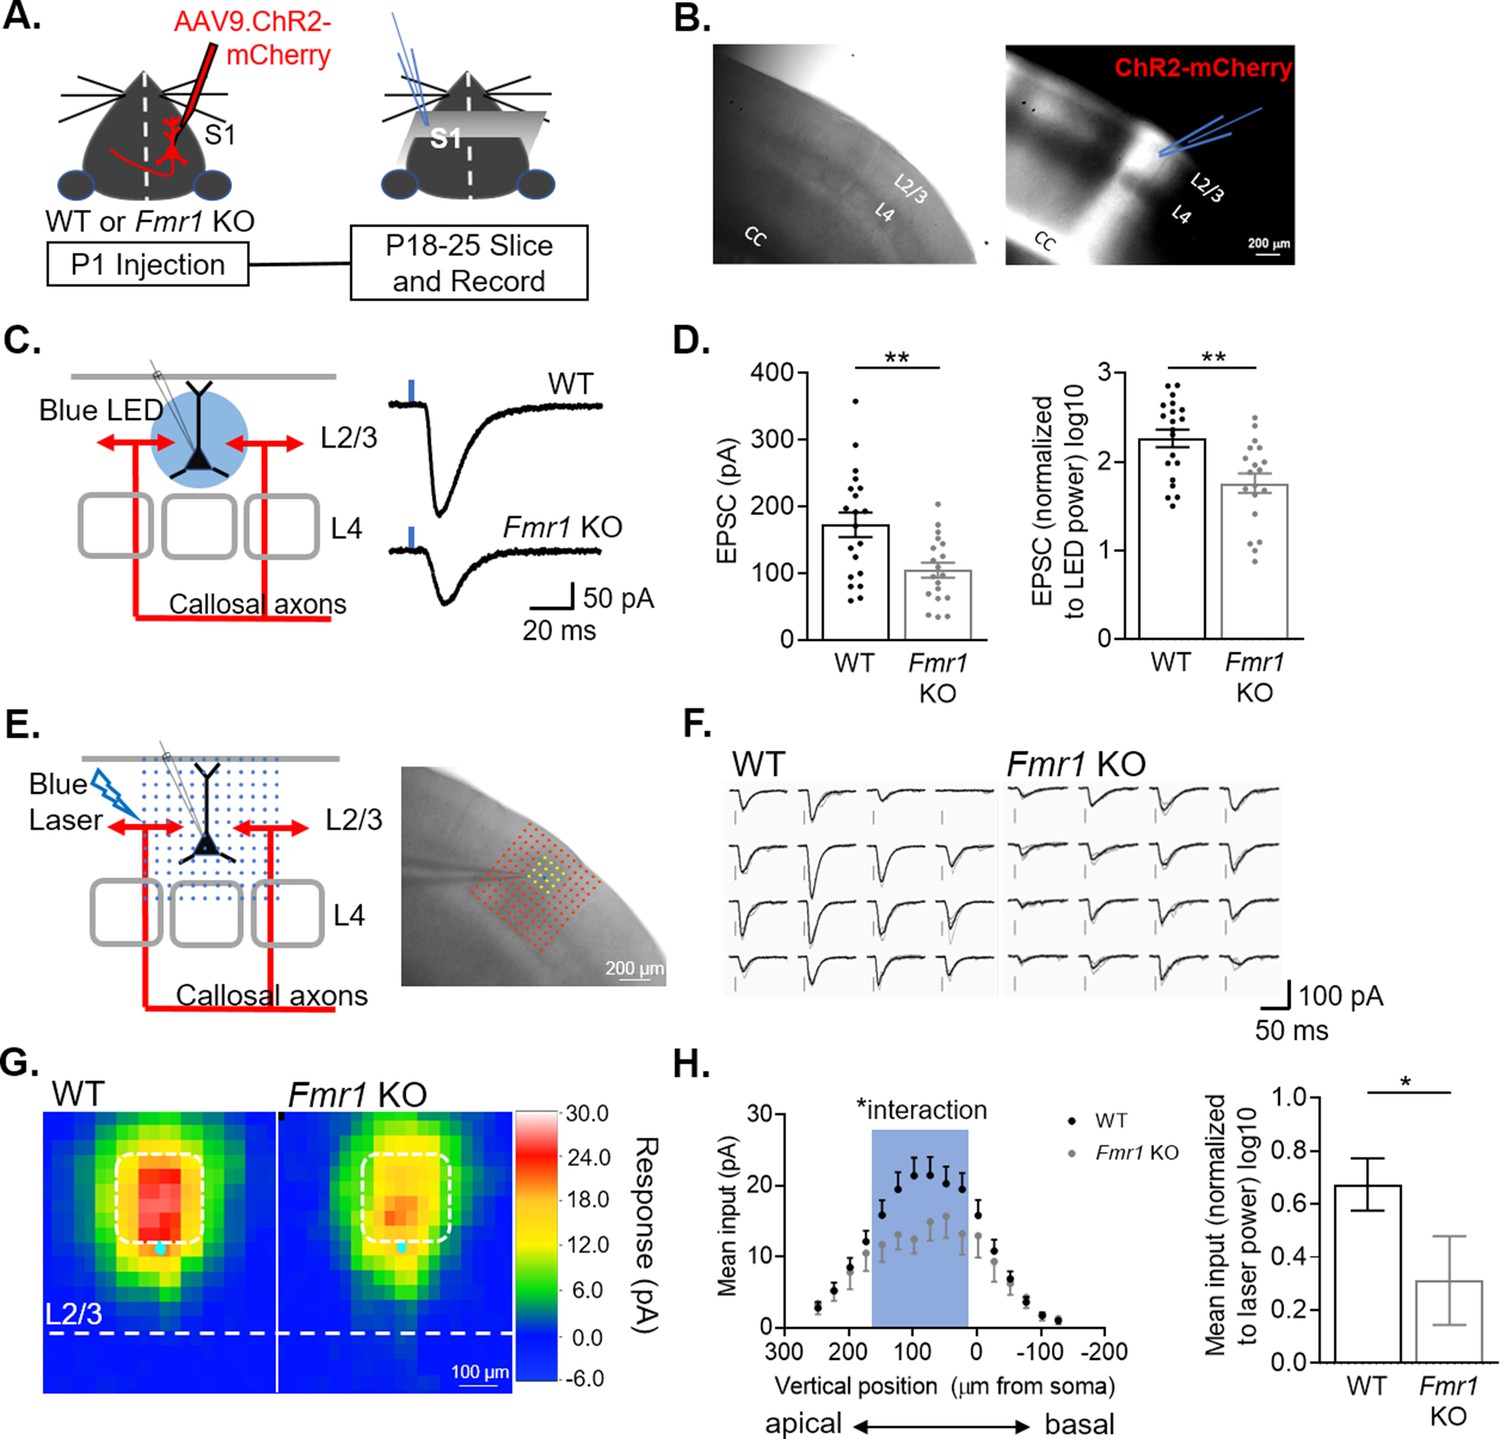
L2/3 pyramidal neurons in barrel cortex of Fmr1 KO mice have weak callosal synaptic inputs.
(A) Timeline and schematic of experimental paradigm. (B) Example image of S1 contralateral to AAV ChR2-mCherry injection. Left: DIC. Right: Red fluorescence of ChR2-mCherry labeled axons in corpus callosum (CC) and cortex. Recordings were performed on L2/3 neurons in an area of mCherry fluorescence. (C) LED stimulation paradigm (left) and example EPSCs from WT and Fmr1 KO mice (right). Blue rectangle = 2 ms blue LED flash. (D) Left: Raw LED-evoked EPSC amplitudes in WT and Fmr1 KO animals (WT = 172 ± 18 pA, n = 20; KO = 105 ± 11 pA, n = 19; unpaired t-test); Right: LED-evoked EPSC amplitudes normalized to LED power (WT = 2.2 ± 0.1, n = 20; KO = 1.7 ± 0.1, n = 19; unpaired t-test). (E) Schematic (left) and example experiment (right) of grid of blue laser stimulation during sCRACM relative to recorded neuron. (F) Example laser-evoked EPSCs at the locations highlighted in yellow in E from WT and Fmr1 KO mice. (G) Group average of EPSC amplitudes evoked at different locations relative to the cell soma in WT and Fmr1 KO mice. Individual maps are aligned by the location of soma (cyan dot). Pixel color represents the average amplitude of EPSCs evoked from that location. (H) Left: Vertical profile of mean synaptic input strength (mean input – average of EPSC amplitudes from individual locations within a specific area)(soma, x = 0) (Fmr1 n.s. p = 0.16, F(1, 60) = 2.060; Fmr1 x vertical position, F(15, 849) = 1.723; mixed-effects model). Right: Mean of EPSC amplitudes in the outlined area in G (white) and left graph (blue), normalized to laser power. (WT = 0.674 ± 0.098, n = 40; KO = 0.312 ± 0.167, n = 22; Mann Whitney). For this and all figures, error bars represent standard error mean (SEM). *p < 0.05, **p < 0.01.
-
Figure 1—source data 1
LED induced EPSC amplitudes and quantification of sCRACM maps.
- https://cdn.elifesciences.org/articles/71555/elife-71555-fig1-data1-v2.xlsx
Figure 2 with 2 supplements
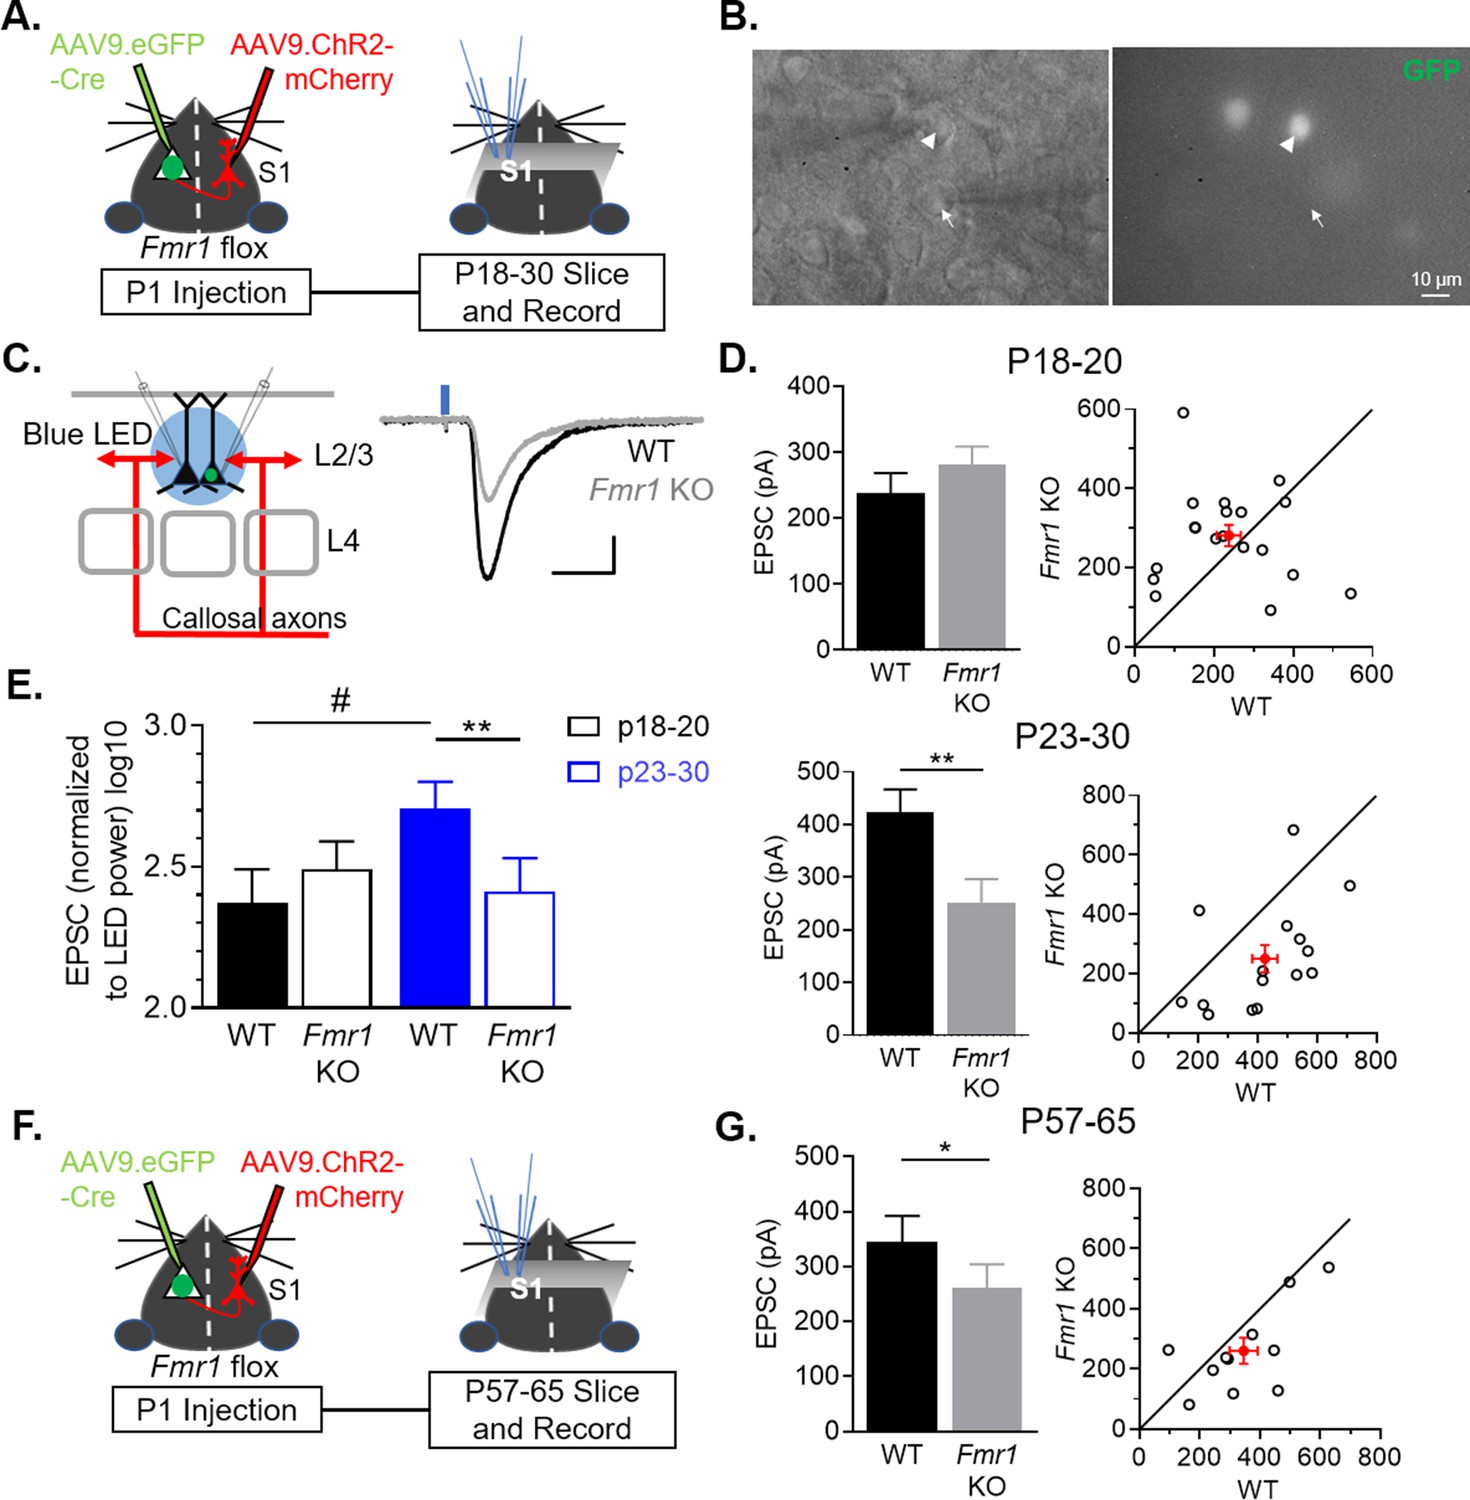
Postnatal and postsynaptic deletion of Fmr1 in L2/3 pyramidal neurons cell autonomously weakens callosal synaptic inputs.
(A) Timeline and schematic of experimental paradigm for juvenile recordings. (B) Simultaneous patch clamping of a neighboring AAV Cre-GFP+, Fmr1 KO (arrowhead) and GFP-, Fmr1 WT (arrow) pyramidal neurons in L2/3 of barrel cortex. Left: DIC. Right: Green fluorescence. (C) LED bulk stimulation paradigm (left) and example EPSCs from a pair of WT and Fmr1 KO neurons (right). Scale = 100 pA, 20 ms. (D) Left: Group average of LED-induced EPSC amplitudes in WT and Fmr1 KO neurons at P18-20 (top) (WT = 238 ± 30 pA; KO = 281 ± 27 pA, n = 19 pairs, n.s.) and P23-30 (bottom) (WT = 424 ± 42 pA; KO = 250 ± 46 pA, n = 15 pairs; paired t-test); Right: EPSC amplitudes from individual cell pairs (open circles). Mean ± SEM (filled circle). Diagonal line represents equality. (E) EPSC amplitudes, normalized to LED power, across different ages (replot from D) (Fmr1 x Age ***p < 0.001, F(1, 32) = 13.87; Fmr1, Age, ns, ANOVA; #p < 0.1, multiple comparison). (F) Timeline and schematic of 2 month old recordings. (G) Left: Group average of LED-induced EPSC amplitudes in WT and Fmr1 KO neurons at 2 month old (WT = 346 ± 47 pA; KO = 260 ± 43 pA, n = 11 pairs, paired t-test); Right: Distribution of values from individual cell pairs. *p < 0.05; **p < 0.01;***p < 0.001.
-
Figure 2—source data 1
LED induced EPSC amplitudes from different age groups.
- https://cdn.elifesciences.org/articles/71555/elife-71555-fig2-data1-v2.xlsx
Figure 2—figure supplement 1
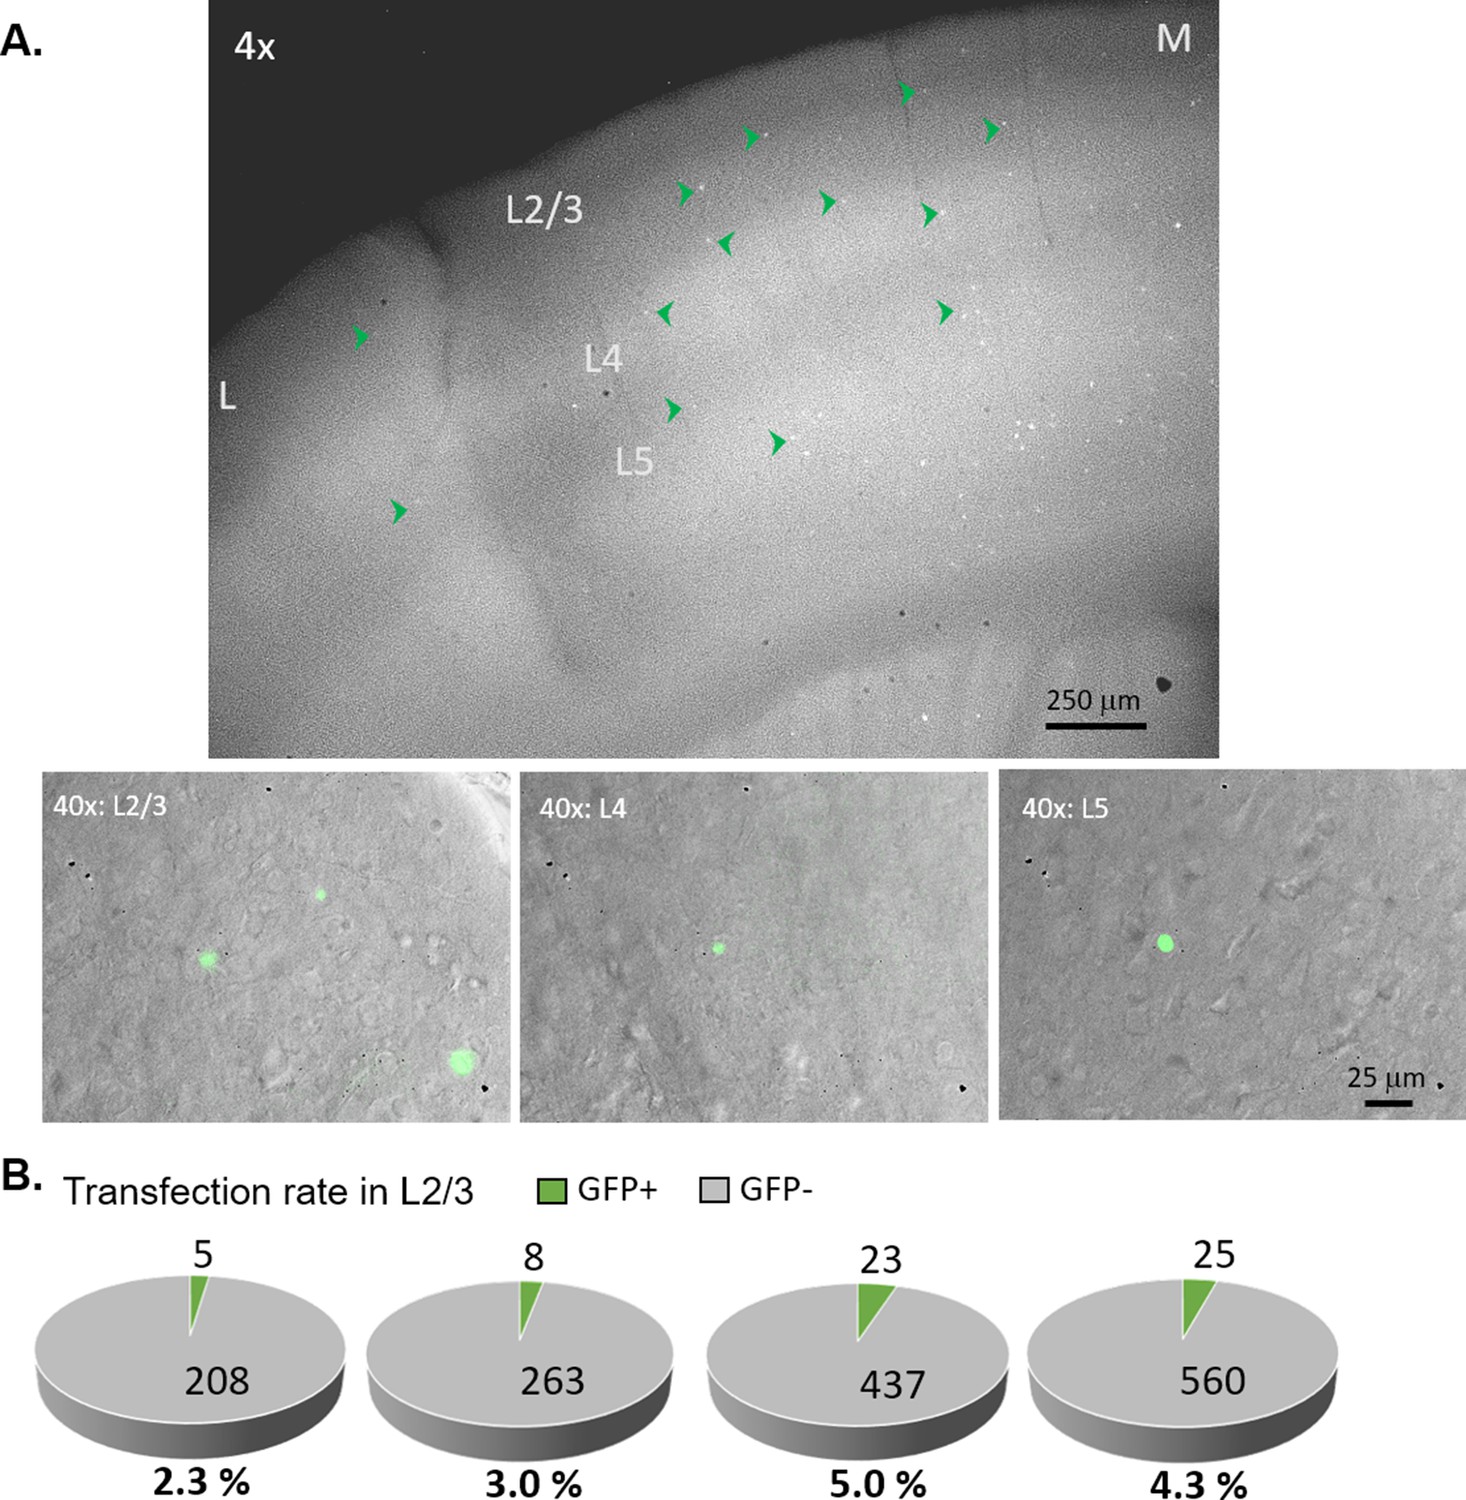
Sparse transfection of Cre-GFP in the recorded hemisphere.
(A) Top: Representative epifluorescence image of GFP for an acute coronal slice (300 µm thick) showing barrel cortex from the Cre-GFP injected hemisphere under low magnification (4 x). Cre-GFP is sparsely expressed across all cortical layers in a similar level (see green arrowheads for example GFP+ cells). The medial side (M) has higher transfection than the lateral side (L) because it’s closer to the needle tract (not shown in the image) going into the ventricle. Bottom: representative composite images of GFP (green) and DIC under high magnification (40 x) for L2/3, L4 and L5. (B) Estimation of percentage Cre-GFP transfection in L2/3 of the ipsilateral barrel cortex from four animals individually. These were calculated from 5 to 15 field of views (0.05 mm2 each) from at least two slices per animal. Transfection rates in layers 4 and 5 are similar to L2/3.
Figure 2—figure supplement 2
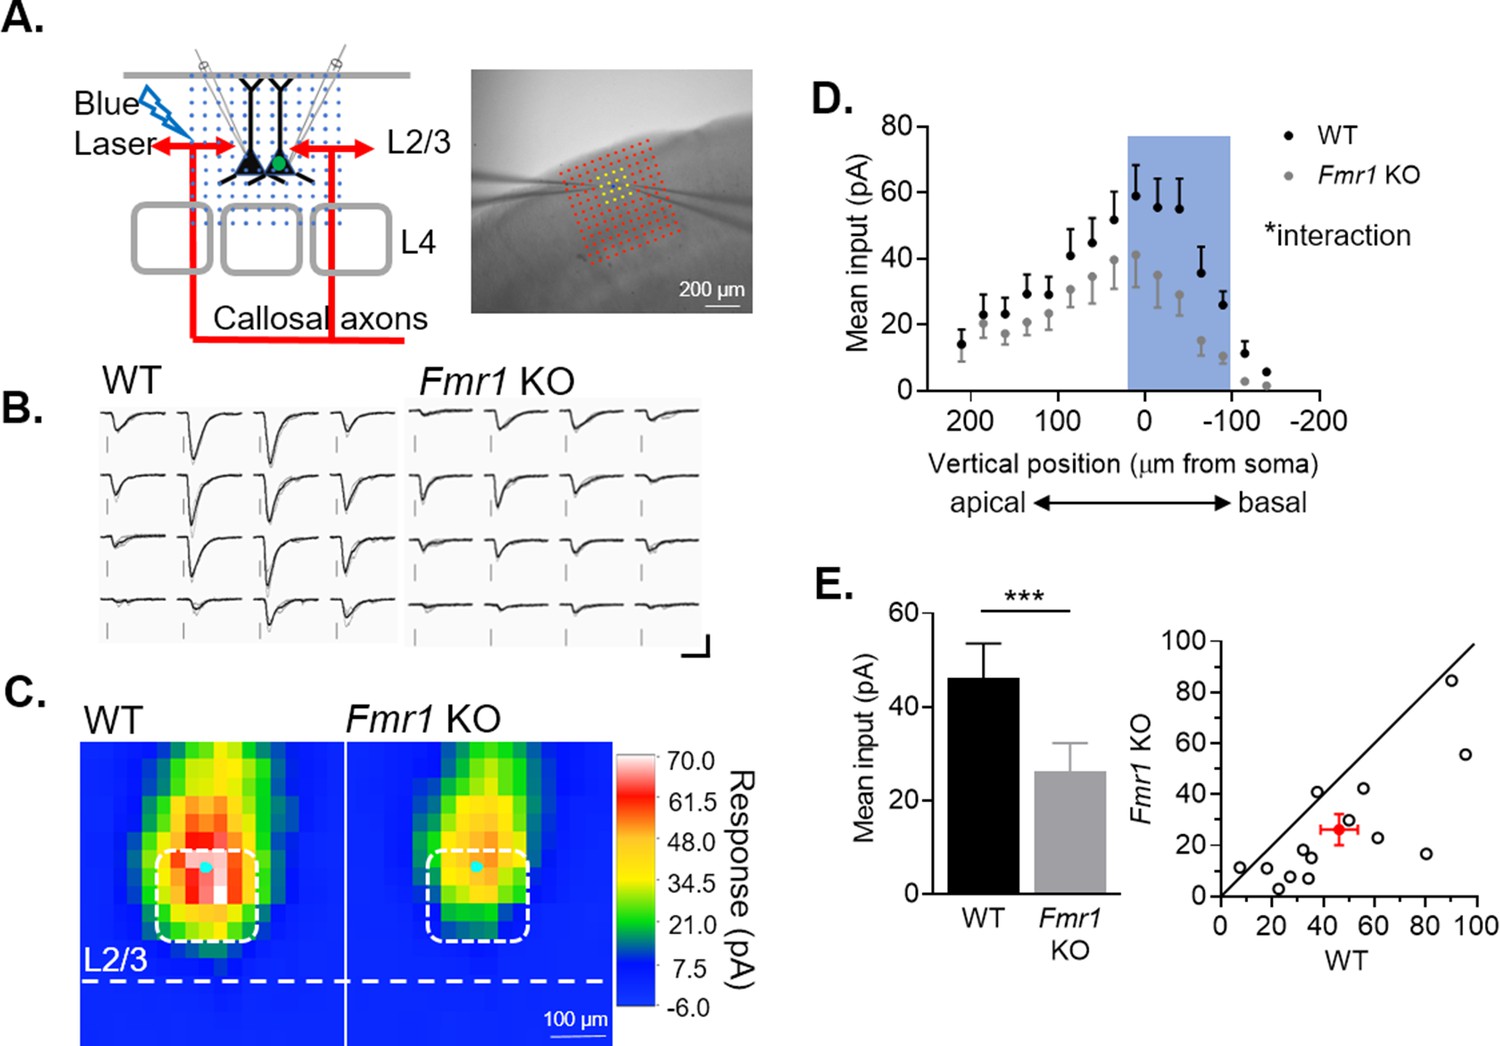
Weakening of callosal synaptic inputs onto postsynaptic Fmr1 KO L2/3 neurons is confirmed by sCRACM with spatial distribution.
(A) Schematic (left) and image (right) of blue laser stimulation grid configuration and dual recordings for sCRACM experiments. (B) Example of laser-induced EPSCs at location highlighted in A (yellow) from WT and Fmr1 KO pair. Scale = 100 pA, 50 ms (C) Averaged color map of subcellular distribution of callosal synaptic input strengths onto WT and Fmr1 KO L2/3 pyramidal neurons at P23-30. (D) Vertical profile of mean synaptic inputs strength along the neuronal dendritic tree (soma, x = 0) (Fmr1 F(1, 13) = 5.956; Fmr1 x vertical position F(14, 144) = 1.793; mixed-effects model). (E) Left: Quantification of mean synaptic inputs strength from the highlighted positions in C (white) and D (blue), (WT = 46 ± 7; KO = 26 ± 6 pA, n = 14 pairs; Wilcoxon test); Right: Distribution of values from individual cell pairs. *p < 0.05;***p < 0.001.
-
Figure 2—figure supplement 2—source data 1
Quantification of sCRACM maps.
- https://cdn.elifesciences.org/articles/71555/elife-71555-fig2-figsupp2-data1-v2.xlsx
Figure 3 with 1 supplement

Callosal synapses onto Fmr1 KO neurons have reduced quantal event frequency and a selective weakening of AMPA receptor-mediated synaptic transmission.
(A) Example traces of Sr2+-evoked quantal events. Scale = 25 pA, 100 ms. Baseline, spontaneous events are defined as those which occur within 1 s prior to LED flash (red dotted line) and evoked events occur 50–350 ms after LED flash (red line). (B) Left: Baseline frequency (top) (WT = 1.3 ± 0.1, KO = 1.2 ± 0.2 Hz, n.s., paired t-test) and amplitude (bottom) (WT = 12 ± 1, KO = 11 ± 1 pA, n.s., Wilcoxon test) of quantal EPSCs for WT and Fmr1 KO neuron pairs; Right: distribution of values from individual cell pairs. (C) Left: Evoked frequency (top) (WT = 8.3 ± 0.5, KO = 6.7 ± 0.5 Hz, *p < 0.05, Wilcoxon test) and amplitude (bottom) (WT = 15 ± 1, KO = 15 ± 1 pA, n.s., Wilcoxon test, n = 13 pairs) of quantal EPSCs for WT and Fmr1 KO neuron pairs; Right: distribution of values from individual cell pairs. (D) Top: Example NMDAR EPSCs from a WT and Fmr1 KO pair. Scale = 25 pA, 20 ms. Bottom: LED-induced NMDAR EPSC amplitudes of WT and Fmr1 KO neuron pairs (WT = 124 ± 20, KO = 120 ± 18 pA, n.s., paired t-test, n = 15 pairs); Right: distribution of values from individual cell pairs.
-
Figure 3—source data 1
Quantal events and NMDAR EPSC.
- https://cdn.elifesciences.org/articles/71555/elife-71555-fig3-data1-v2.xlsx
Figure 3—figure supplement 1
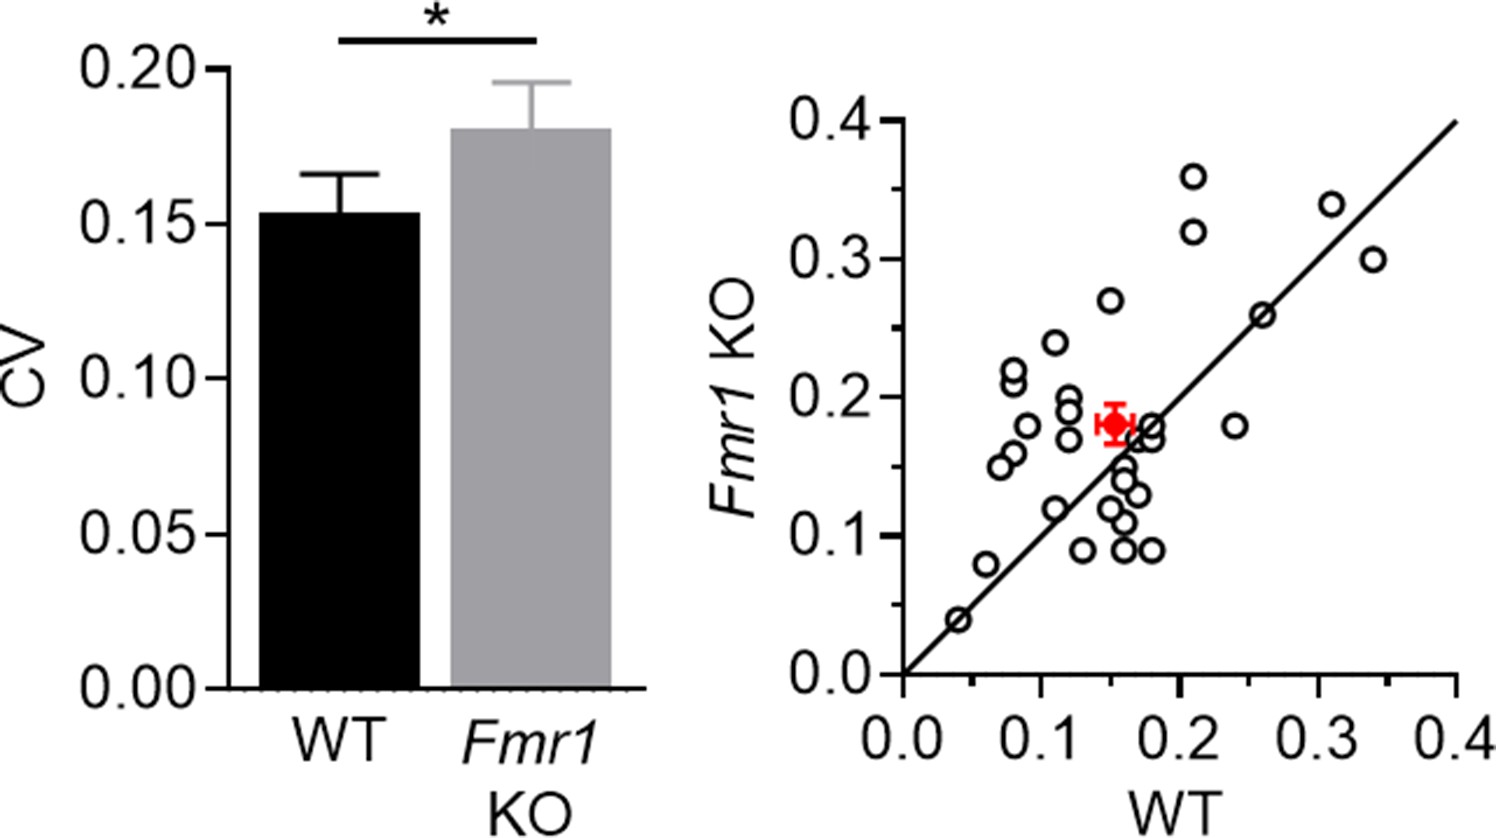
Coefficient of variance (C.V.) of LED-evoked EPSCs from P23-30 cell pairs in Figure 2D and 5B1.
Left: summary statistics (WT = 0.153 ± 0.013, KO = 0.181 ± 0.015 Hz, *p < 0.05, paired t-test, n = 30 pairs); Right: distribution of values from individual cell pairs.
-
Figure 3—figure supplement 1—source data 1
CV analysis.
- https://cdn.elifesciences.org/articles/71555/elife-71555-fig3-figsupp1-data1-v2.xlsx
Figure 4 with 2 supplements
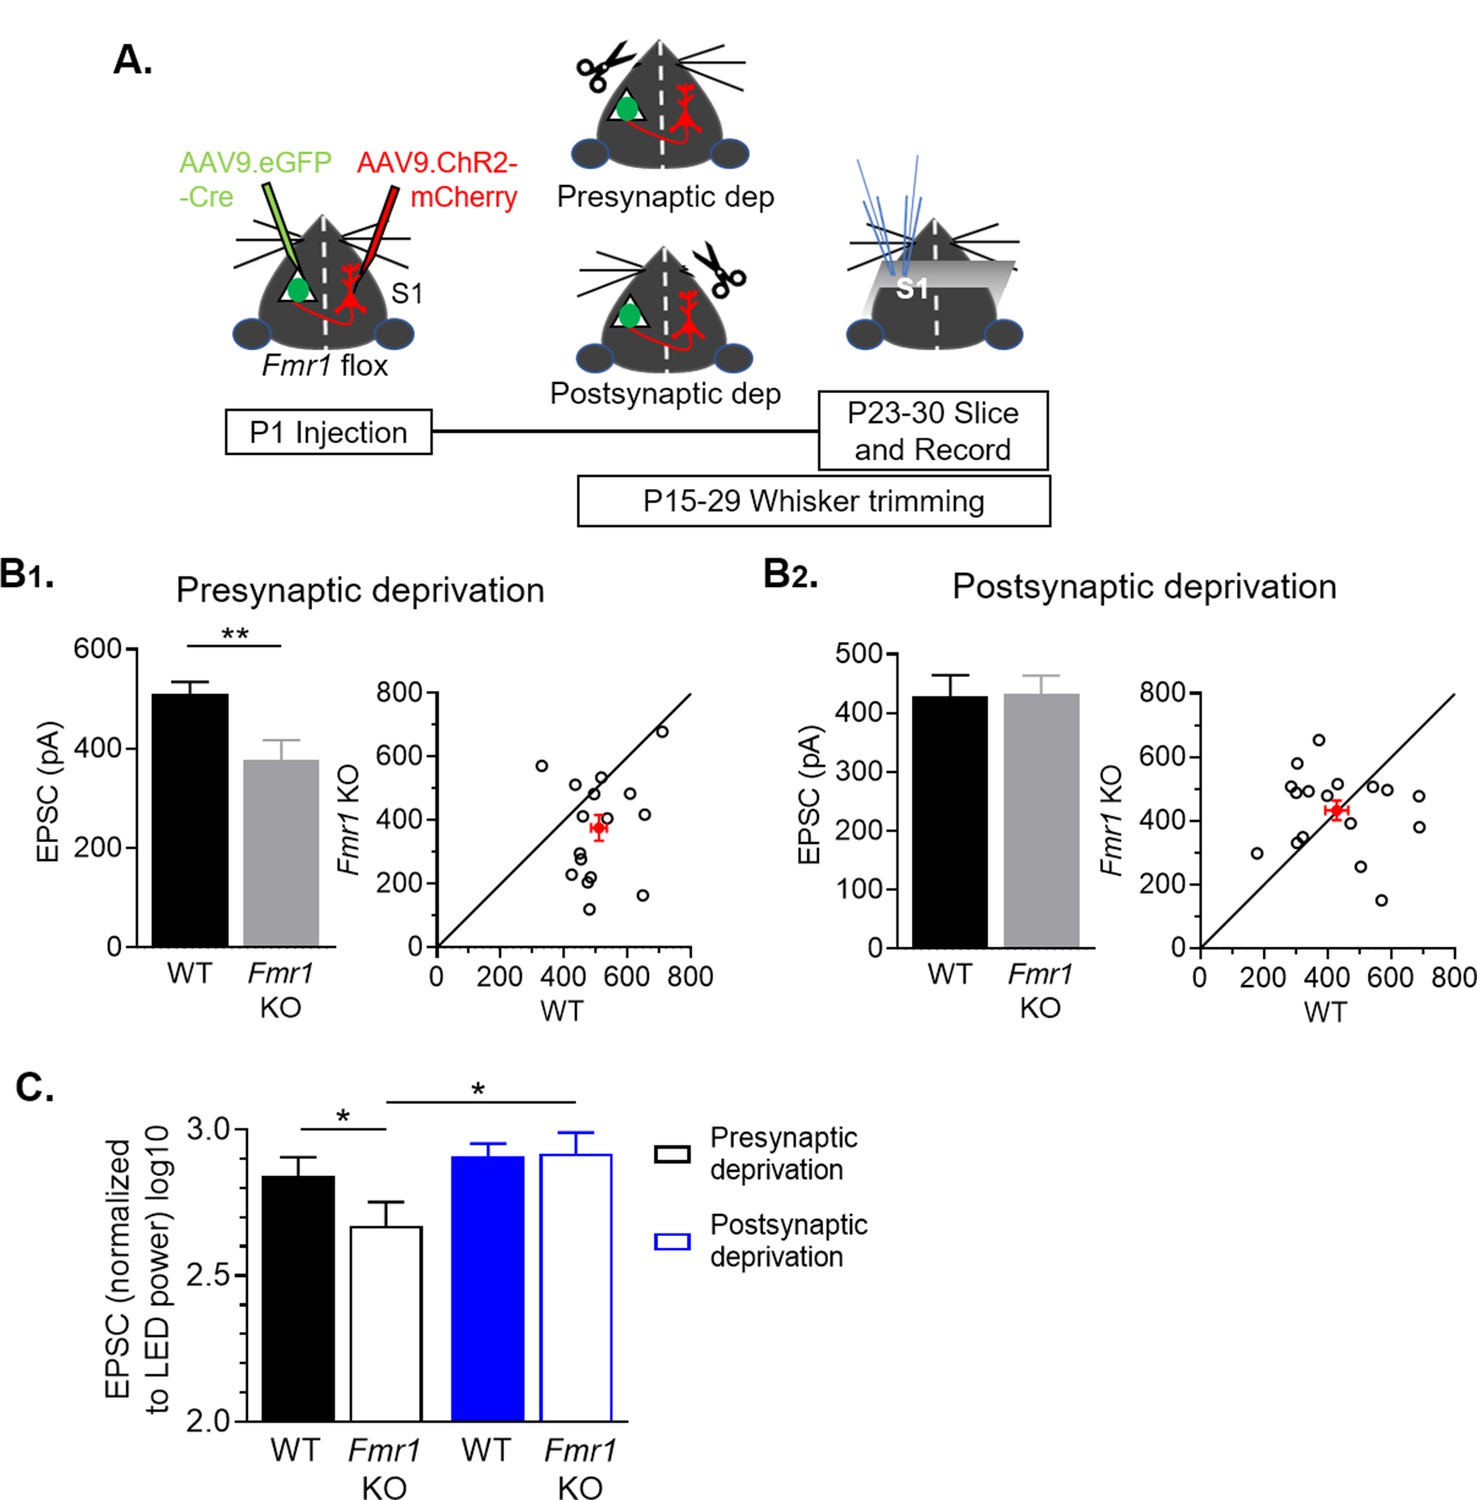
Sensory deprivation by whisker trimming normalizes callosal input strength onto postsynaptic Fmr1 KO neurons.
(A) Experimental paradigm. Trimming the whisker pad either ipsilateral or contralateral to the AAV-Cre-GFP injected hemisphere deprived either the presynaptic callosal projection neurons or postsynaptic Fmr1 KO neurons, respectively, of patterned sensory experience- driven activity. (B1, B2) Left: Raw LED-induced EPSC amplitudes in WT and Fmr1 KO neurons with presynaptic deprivation (WT = 510 ± 25; KO = 376 ± 41 pA, n = 16 pairs, **p < 0.01, paired t-test) or with postsynaptic deprivation (WT = 428 ± 36; KO = 433 ± 31 pA, n = 17 pairs, n.s., paired t-test): Right: Values from individual cell pairs. (C) LED-induced EPSC amplitudes normalized to LED power (replot from (B)) (Fmr1 x deprivation interaction *p < 0.05, F(1, 31) = 4.977, ANOVA; presynaptic deprivation WT vs. Fmr1 KO, *p < 0.05, Fmr1 KO presynaptic deprivation vs. postsynaptic deprivation, *p < 0.05, Sidak’s multiple comparisons).
-
Figure 4—source data 1
LED induced EPSC amplitudes with deprivation.
- https://cdn.elifesciences.org/articles/71555/elife-71555-fig4-data1-v2.xlsx
Figure 4—figure supplement 1
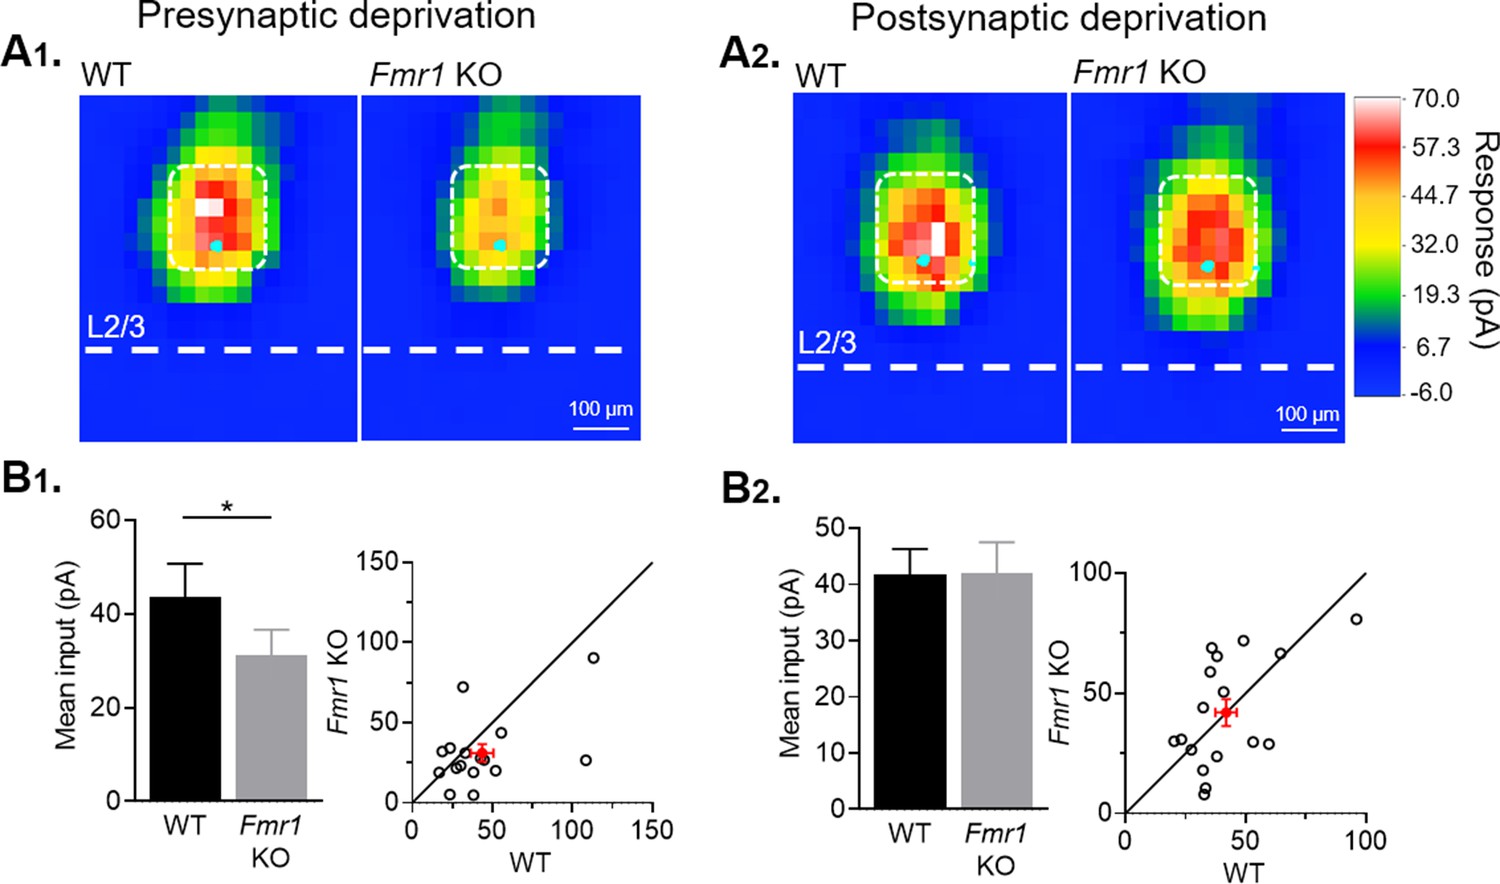
Sensory experience dependent weakening of callosal inputs is confirmed by sCRACM.
(A) Averaged color map of subcellular distribution of callosal synaptic inputs onto WT and Fmr1 KO neurons with presynaptic (A1) or postsynaptic (A2) sensory deprivation. (B1, B2) Left: Mean synaptic inputs strength onto soma and proximal apical dendrites (highlighted in white in A) for WT and Fmr1 KO neurons with presynaptic (WT = 43 ± 7; KO = 31 ± 5 pA, n = 16 pairs, *p < 0.05, Wilcoxon test) or postsynaptic (WT = 42 ± 4; KO = 42 ± 6 pA, n = 17 pairs, n.s., Wilcoxon test) sensory deprivation; Right: values from individual cell pairs.
-
Figure 4—figure supplement 1—source data 1
Quantification of mean inputs.
- https://cdn.elifesciences.org/articles/71555/elife-71555-fig4-figsupp1-data1-v2.xlsx
Figure 4—figure supplement 2
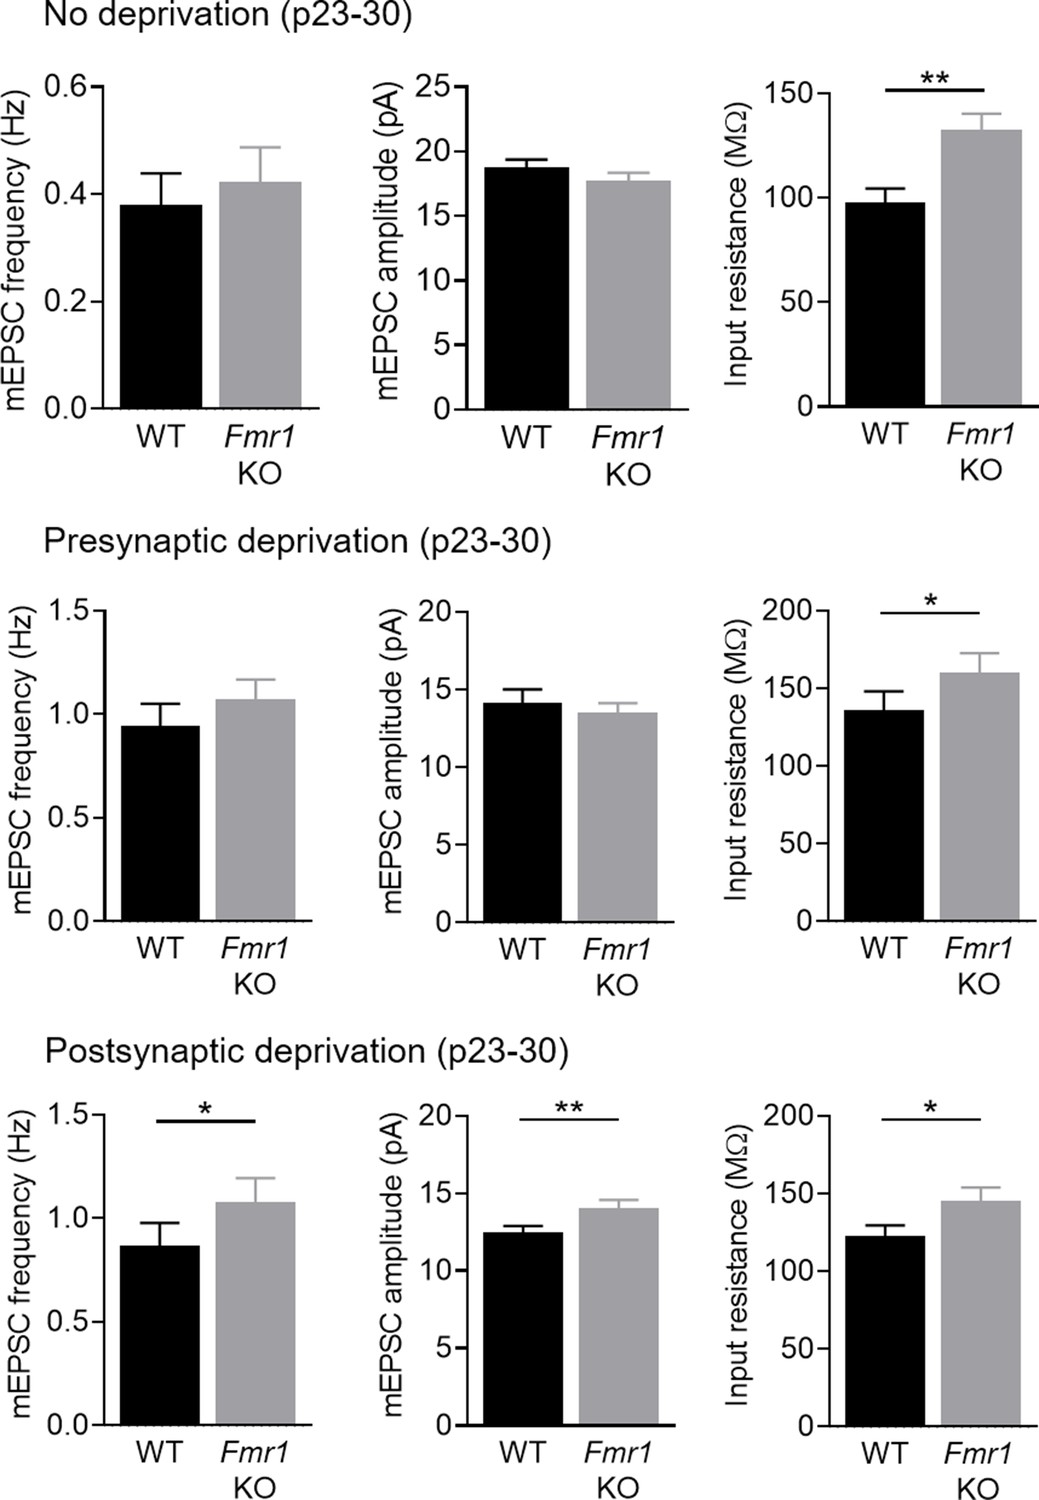
Miniature (m) EPSC frequency and amplitude, as well as input resistance from pairs of WT and postsynaptic Fmr1 KO L2/3 pyramidal neurons in P23-30 sensory intact, presynaptic sensory deprived and postsynaptic sensory deprived animals.
-
Figure 4—figure supplement 2—source data 1
Miniature EPSC and input resistance.
- https://cdn.elifesciences.org/articles/71555/elife-71555-fig4-figsupp2-data1-v2.xlsx
Figure 5

Cell autonomous deletion of Fmr1 in postsynaptic L2/3 or L5 neurons results in weak action-potential driven synaptic transmission from callosal inputs.
(A) Top: Average color map of action-potential-mediated callosal synaptic input strengths onto pairs of WT and Fmr1 KO L2/3 pyramidal neurons at P23-30; Bottom: Example responses from the highlighted positions (white). Scale = 100 pA, 50 ms. (B) Top: Mean callosal inputs strength from area highlighted in white in A (WT = 61 ± 13, KO = 35 ± 6 pA, n = 11 pairs, *p < 0.05, paired t-test); Bottom: Distribution of values from individual cell pairs. (C) Top: Average color map of callosal input strengths onto pairs of WT and Fmr1 KO L5 pyramidal neurons at P23-30; Bottom: Example responses from the highlighted area (white). Scale = 200 pA, 60 ms. (D) Top: Mean callosal input strengths onto L5 neurons from the area highlighted in white in C (WT = 49 ± 9, KO = 31 ± 4 pA, n = 12 pairs, *p < 0.05, paired t-test). Bottom: distribution of values from individual cell pairs.
-
Figure 5—source data 1
Quantification of mean inputs.
- https://cdn.elifesciences.org/articles/71555/elife-71555-fig5-data1-v2.xlsx
Figure 6 with 2 supplements
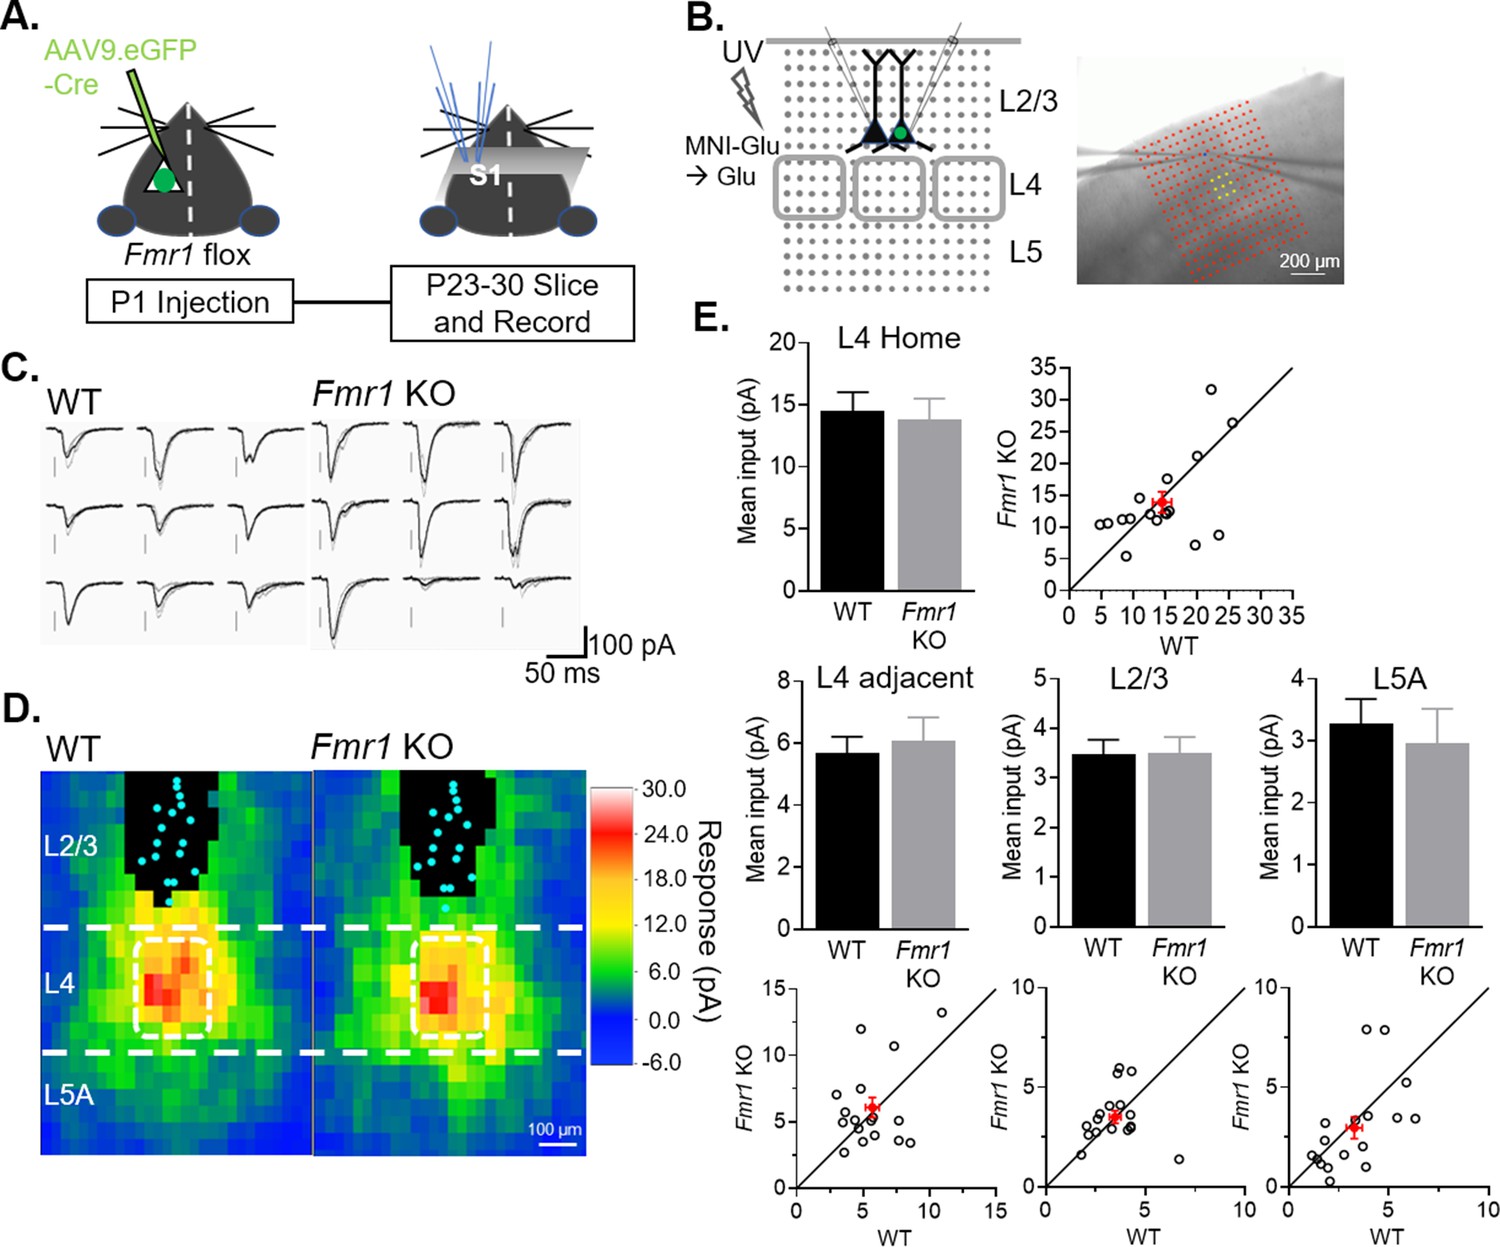
Postsynaptic deletion of Fmr1 in L2/3 neurons does not affect excitatory synaptic inputs from local columnar circuit.
(A) Experimental design schematic. (B) Left: Position of UV laser scanning photostimulation (LSPS) grid (grey dots) relative to cortical layers and recorded neurons in L2/3 and L4 barrels (gray squares). Right: IR-DIC image of dual recordings in L2/3 in a slice with laser stimulation grid (red). Yellow dots indicate L4 home barrel. (C) Example of EPSCs in a pair of WT and Fmr1 KO L2/3 neurons in response to LSPS and glutamate uncaging in L4 home barrel (yellow dots in B; right). (D) Color map of spatial distribution of average synaptic input strengths in response to LSPS. L4 home barrel (white rectangle). Cyan dots represent locations of soma and black pixels are direct responses. (E) Mean synaptic input strength from L4 home barrel, L4 adjacent barrels, adjacent L2/3 and L5A (WT vs. Fmr1 KO, n.s., n = 17 pairs, Wilcoxon or paired t-test) and values from individual cell pairs.
-
Figure 6—source data 1
Mean inputs from LSPS maps.
- https://cdn.elifesciences.org/articles/71555/elife-71555-fig6-data1-v2.xlsx
Figure 6—figure supplement 1
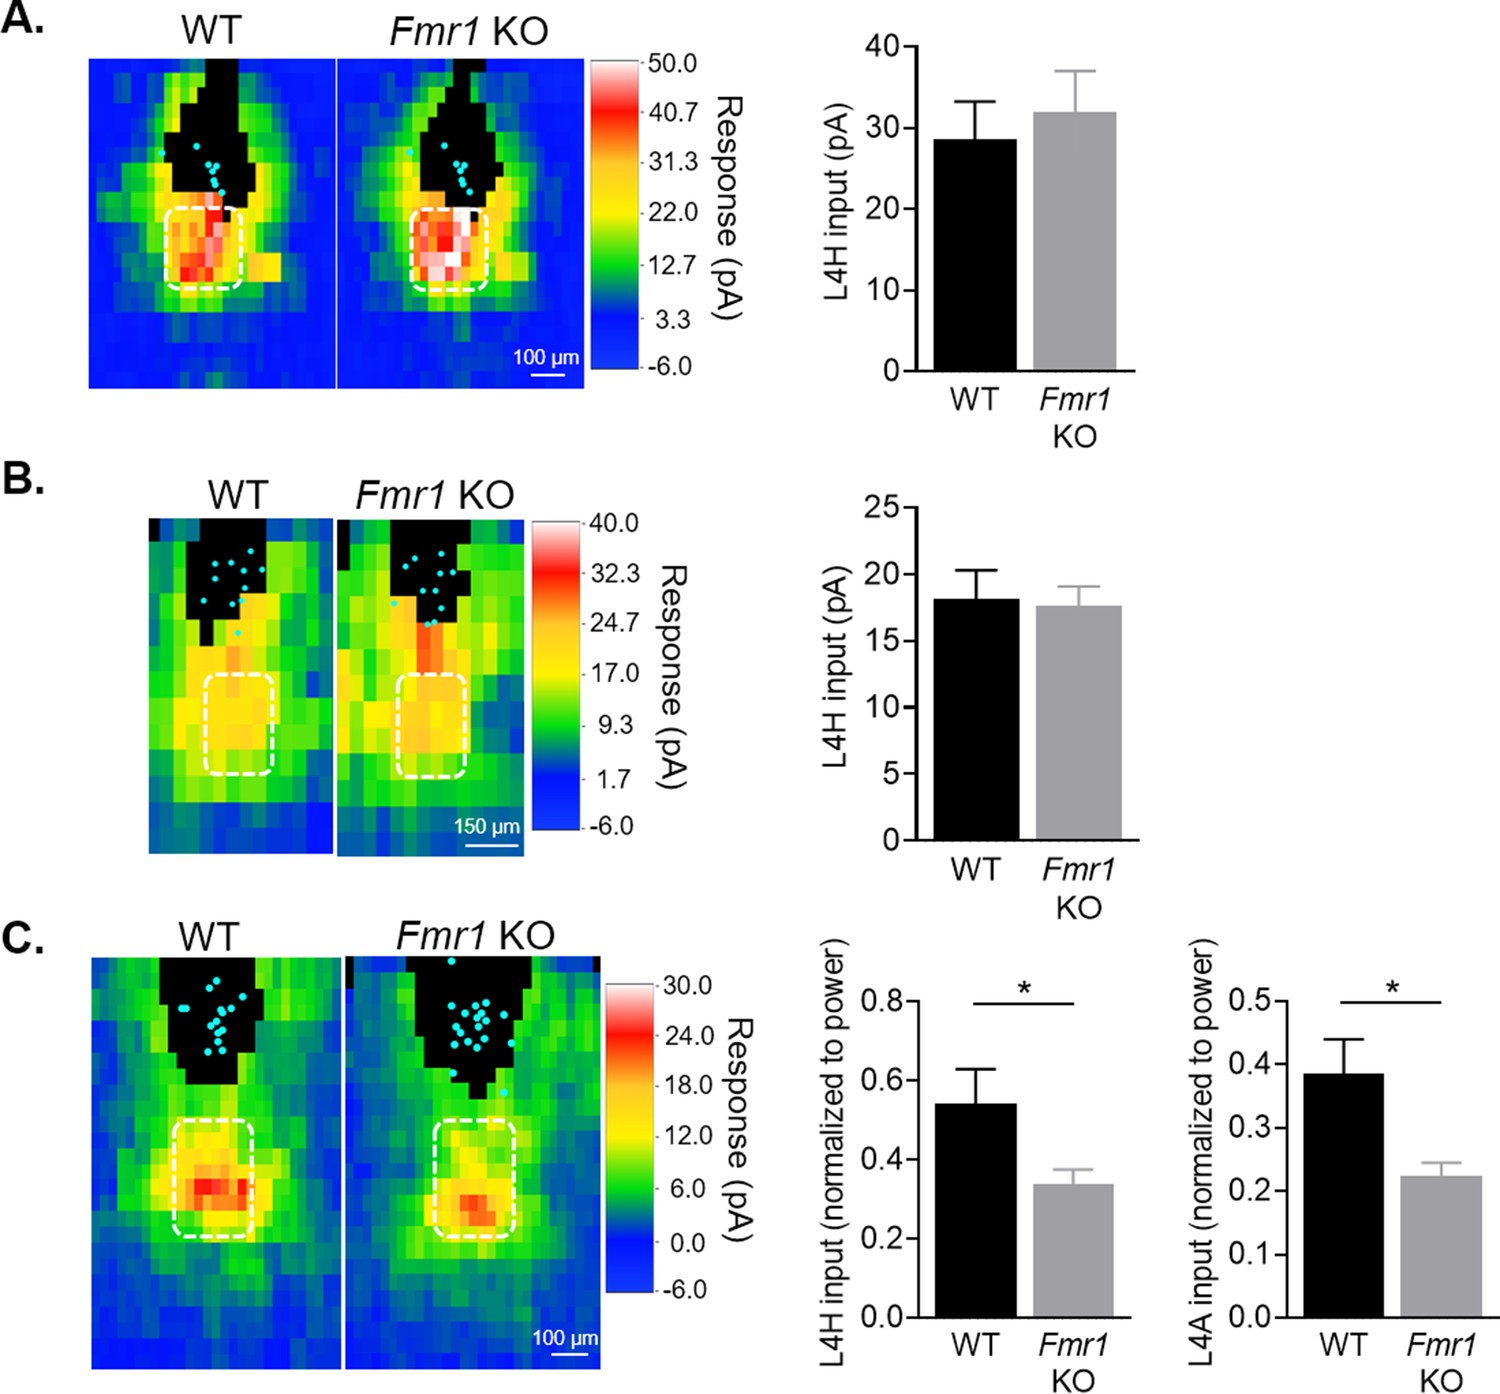
Postsynaptic deletion of Fmr1 does not affect local columnar circuit inputs onto L2/3 pyramidal neurons at 2 weeks of age.
(A) Right: Sparse deletion of Fmr1 in L2/3 neurons using AAV.GFP-Cre injection at P1 does not affect local synaptic input strength from L4 home barrel (L4H) measured at P14-17 (n = 8 pairs). (B) Similar as (A), but experiment was done in mosaic Fmr1 females (Fmr1-/gfp) (n = 11 pairs). Half of the cells are Fmr1 KO GFP- while the other half are Fmr1 WT GFP+ due to X chromosome inactivation. (C) Averaged LSPS color maps (left) and quantification of local synaptic input strength from L4 home and adjacent (L4A) barrels (right) comparing across WT and Fmr1 global KO animals at 3 weeks of age (P18-25) (n = 15 for WT, n = 20 for KO). Quantified inputs were normalized to the respective laser power and log transformed to enable cross-animal comparison.
-
Figure 6—figure supplement 1—source data 1
L4 mean inputs from LSPS maps.
- https://cdn.elifesciences.org/articles/71555/elife-71555-fig6-figsupp1-data1-v2.xlsx
Figure 6—figure supplement 2
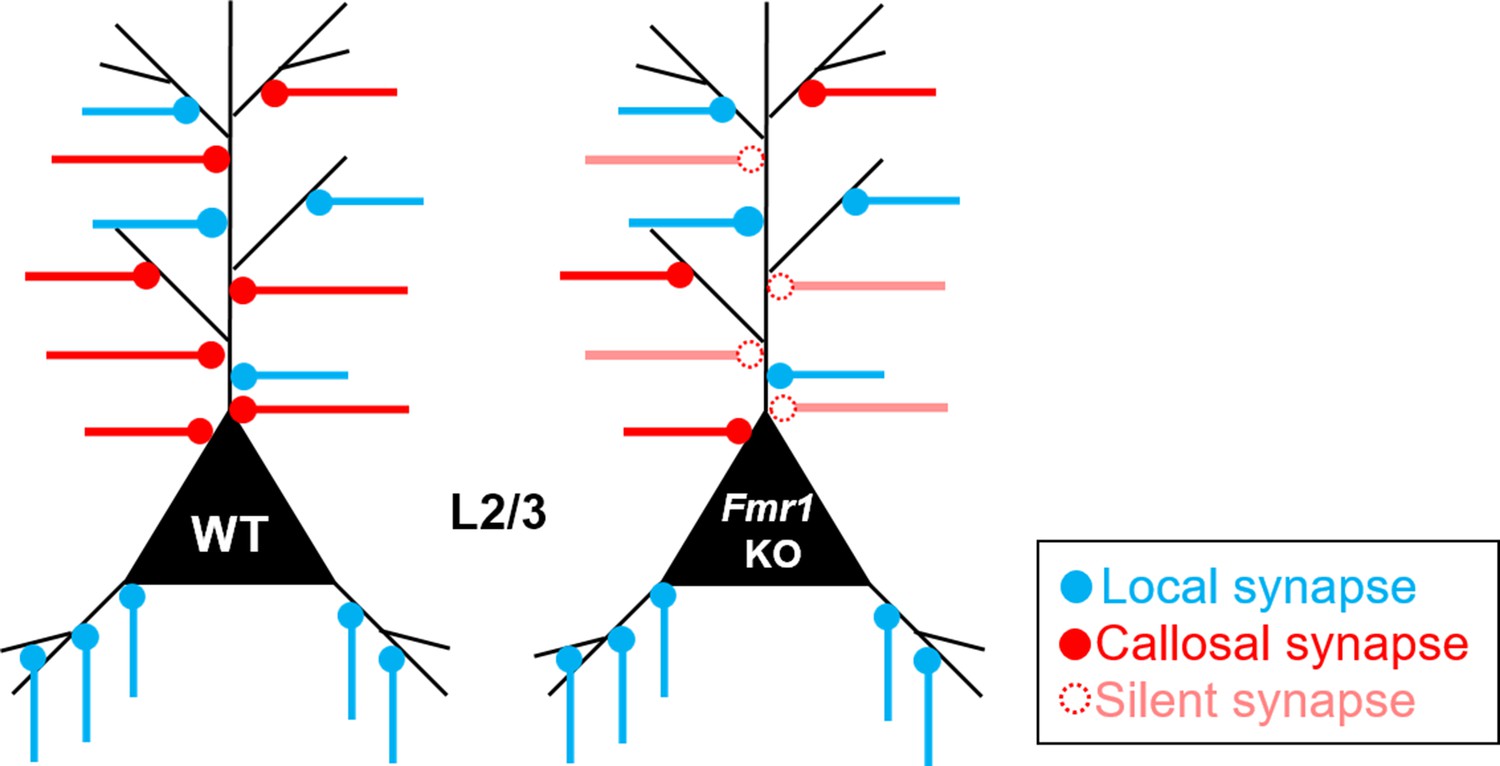
Summary model of the role of postsynaptic Fmr1 on development of callosal and local neocortical synapses.
During development of cortical circuits for mouse primary somatosensory barrel cortex (postnatal 4 weeks), Fmr1 functions postnatally and cell autonomously in postsynaptic L2/3 pyramidal neurons to promote maturation or stability of callosal synaptic connections by promoting/maintaining AMPAR transmission. Without postsynaptic Fmr1, our results suggest that there are more ‘NMDAR-only’ or ‘silent’ immature callosal synapses onto Fmr1 KO neurons and callosal synapses undergo synaptic silencing that depends on sensory experience driven activity of postsynaptic L2/3 neurons. Postsynaptic Fmr1 selectively promotes callosal synaptic connections for L2/3 neurons as local circuit inputs from other layers or columns are not changed.
Author response image 1
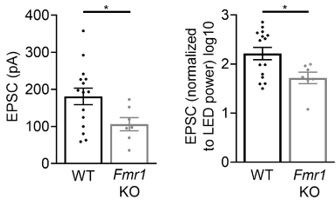
Young (P18-20) global Fmr1 KO mice have weak callosal synaptic connections.
Left: Raw LED-induced EPSC amplitudes in WT and Fmr1 KO animals (WT = 181.2 ± 22.18 pA, n = 15; KO = 106.1 ± 17.77 pA, n = 7, *p < 0.05, unpaired t-test); Right: LED-induced EPSC amplitude normalized to LED power and log transformed (WT = 2.216 ± 0.125, n = 15; KO = 1.718 ± 0.118, n = 7, *p < 0.05, unpaired t-test).
Author response image 2
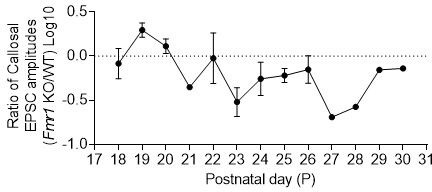
For each neuron pair, a ratio of Fmr1 KO to WT responses was taken, log10 transformed and plotted by the postnatal day.
A value less than 0 will indicate that Fmr1 postsynaptic KO neuron has weaker callosal synaptic inputs than the neighboring WT neuron.
Author response image 3
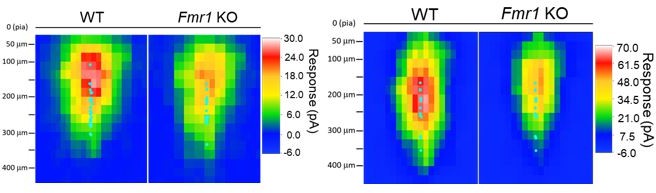
Left: sCRACM maps from WT and Fmr1 global KO (Figure 1) aligned to pia surface; Right: sCRACM maps from WT and postsynaptic Fmr1 KO neuron pairs (Figure 2 – figure supplement 2) aligned to pia surface.
Cyan dots represent the location of soma.
Author response image 4
Tables
Key resources table
| Reagent type (species) or resource | Designation | Source or reference | Identifiers | Additional information |
|---|---|---|---|---|
| Genetic reagent (M. musculus) | Fmr1-/y (male) | Jackson Laboratory | 003025 | |
| Genetic reagent (M. musculus) | Fmr1fl/fl (female)Fmr1fl/y (male) | PMID:16257225 | Dr. David Nelson (Baylor College of Medicine) | |
| Genetic reagent (M. musculus) | X-linked GFP | Jackson Laboratory | 003116 | |
| Strain, strain background (AAV) | AAV9.CMV.HI.eGFP-Cre. WPRE.SV40 | Addgene | 105545 | |
| Strain, strain background (AAV) | AAV9.CAG.hChR2(H134R)-mCherry.WPRE.SV40 | Addgene | 100054 | |
| Chemical compound, drug | MNI-caged-L-glutamate | Tocris / HelloBio | 1490/ HB0423 | |
| Chemical compound, drug | (RS)-CPP | Tocris / HelloBio | 0173/ HB0036 | |
| Chemical compound, drug | 4-Aminopyridine (4-AP) | Sigma- Aldrich | A78403 | |
| Chemical compound, drug | DNQX disodium salt | Tocris | 2,312 | |
| Software, algorithm | LabView | National Instruments | RRID:SCR_014325 | |
| Software, algorithm | Multiclamp 700 A | Molecular Devices | RRID:SCR_021040 | |
| Software, algorithm | Prism 8 | Graphpad Software | RRID:SCR_002798 |
Additional files
Download links
A two-part list of links to download the article, or parts of the article, in various formats.
Downloads (link to download the article as PDF)
Open citations (links to open the citations from this article in various online reference manager services)
Cite this article (links to download the citations from this article in formats compatible with various reference manager tools)
Experience-dependent weakening of callosal synaptic connections in the absence of postsynaptic FMRP
eLife 10:e71555.
https://doi.org/10.7554/eLife.71555


