Witnessing the structural evolution of an RNA enzyme
- Department of Molecular, Cellular and Developmental Biology, Yale University, United States
- The Salk Institute, United States
- Howard Hughes Medical Institute, United States
Figures
Figure 1

Synthesis of functional RNA molecules by the 38-6 and 52-2 polymerases.
(A) Synthesis of the hammerhead ribozyme in the presence of either 50 or 200 mM Mg2+ after 1 hr. (B) Synthesis of the class I ligase ribozyme in the presence of 200 mM Mg2+ after 24 hr. Reaction conditions for (A) and (B): 100 nM polymerase, 80 nM primer, 100 nM template, 4 mM each NTP, and either 50 or 200 mM MgCl2 at pH 8.3 and 17°C. Intermediate-length products are numbered at the left. Black dots indicate full-length products. (C) Time course of RNA ligation catalyzed by the class I ligase ribozyme that had been synthesized by the 52-2 polymerase, as shown in (B), comparing the RNA-catalyzed (black circles) and the uncatalyzed (white circles) reactions, which have a rate of 0.31 and 0.00021 hr–1, respectively. Reaction conditions: ±1 µM ligase ribozyme, 20 µM 5’-substrate, 80 µM 3’-substrate, 60 mM MgCl2, 200 mM KCl, and 0.6 mM EDTA at pH 8.3 and 23°C.
-
Figure 1—source data 1
Gel images (raw and annotated) of hammerhead (Figure 1A) and class I ligase (Figure 1B) ribozymes synthesized by the 52-2 polymerase.
- https://cdn.elifesciences.org/articles/71557/elife-71557-fig1-data1-v2.zip
-
Figure 1—source data 2
Product yields and linear regression parameters for the reaction catalyzed by the class I ligase that had been synthesized by the 52-2 polymerase (Figure 1C).
- https://cdn.elifesciences.org/articles/71557/elife-71557-fig1-data2-v2.xlsx
Figure 2 with 2 supplements
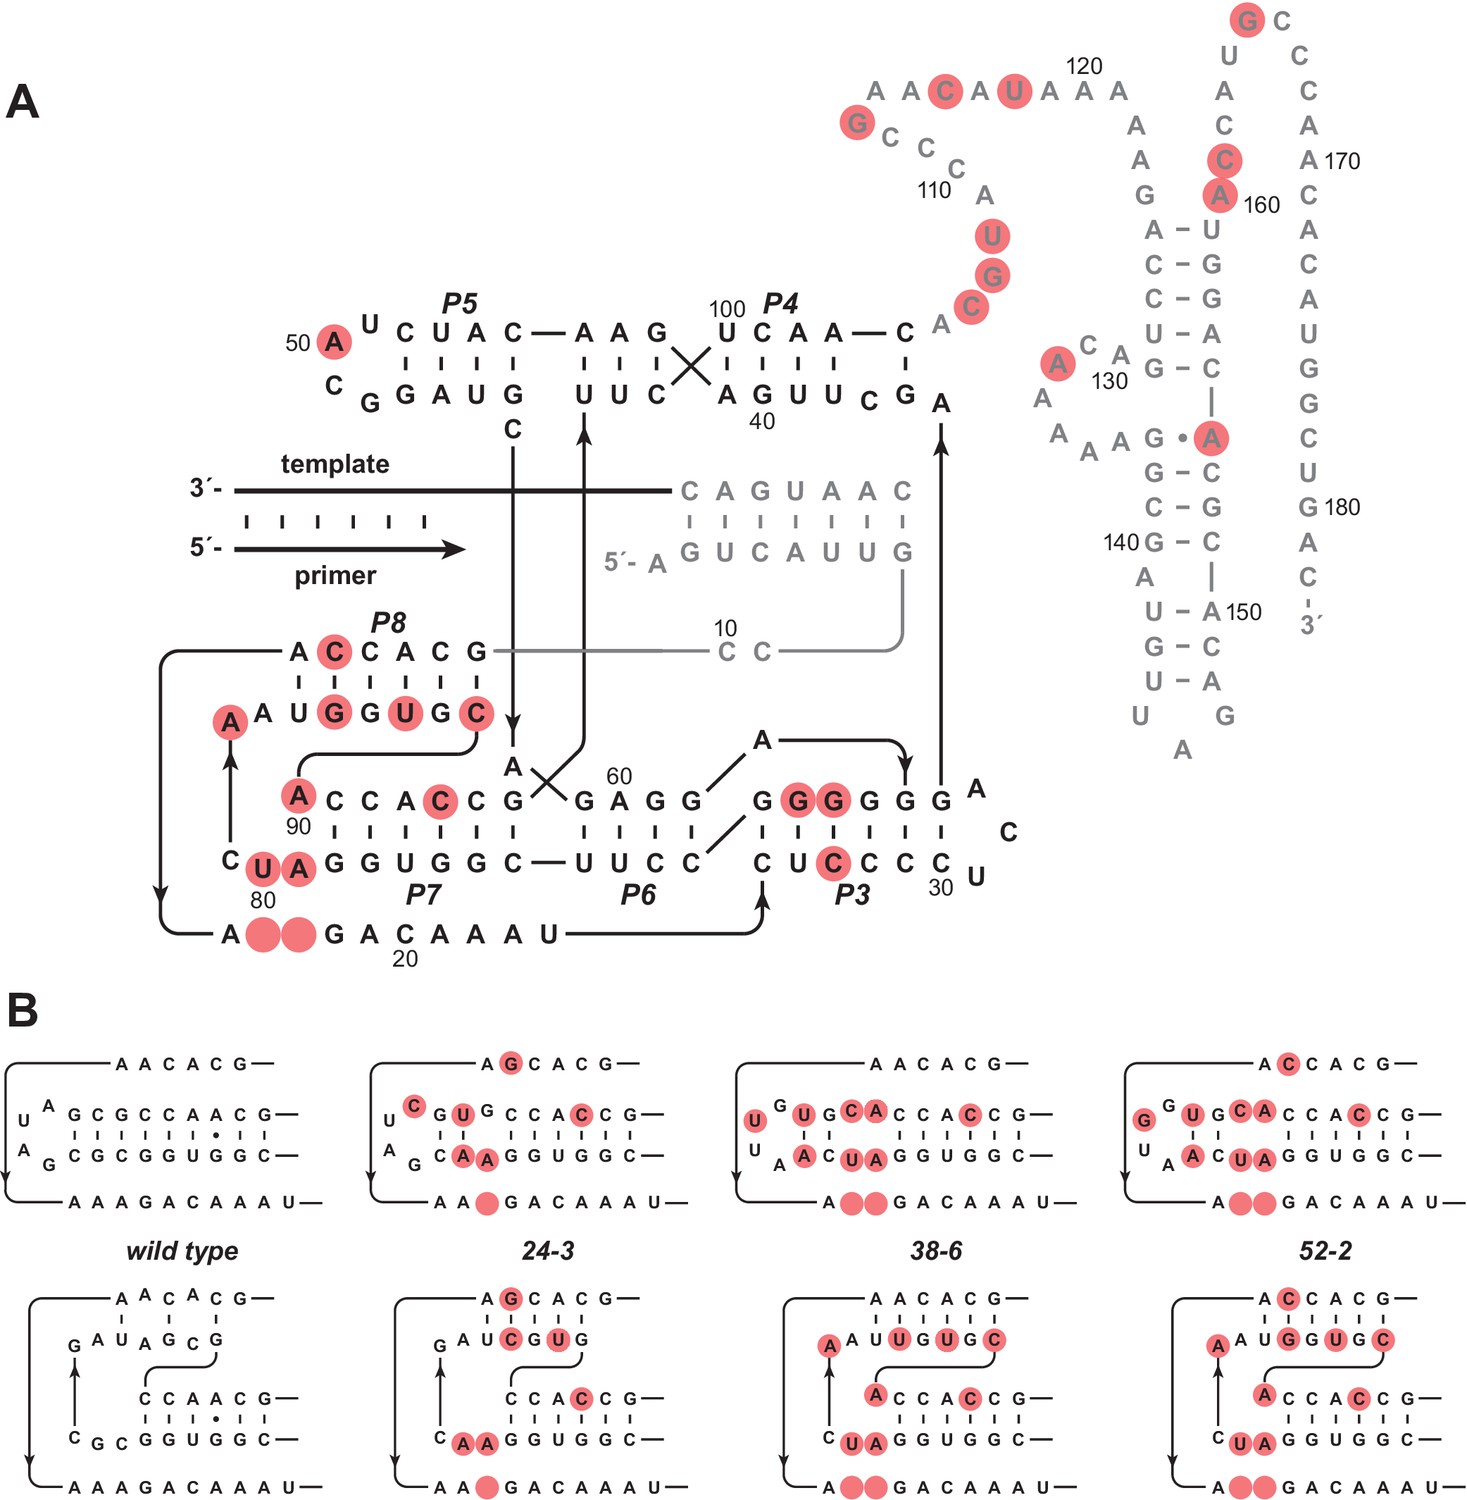
Evolution of the novel pseudoknot structure.
(A) Sequence and secondary structure of the 52-2 polymerase. Red circles indicate mutations relative to the wild-type polymerase. Regions outside the ligase core are shown in gray. Paired regions and nucleotides are numbered according to the 52-2 polymerase, with corresponding nucleotides numbered similarly for all polymerase variants. (B) Progressive mutation of the region encompassing the P7 and P8 stems, mapped onto both the old structure (top) and the new pseudoknot structure (bottom). Blank circles indicate deletions.
Figure 2—figure supplement 1
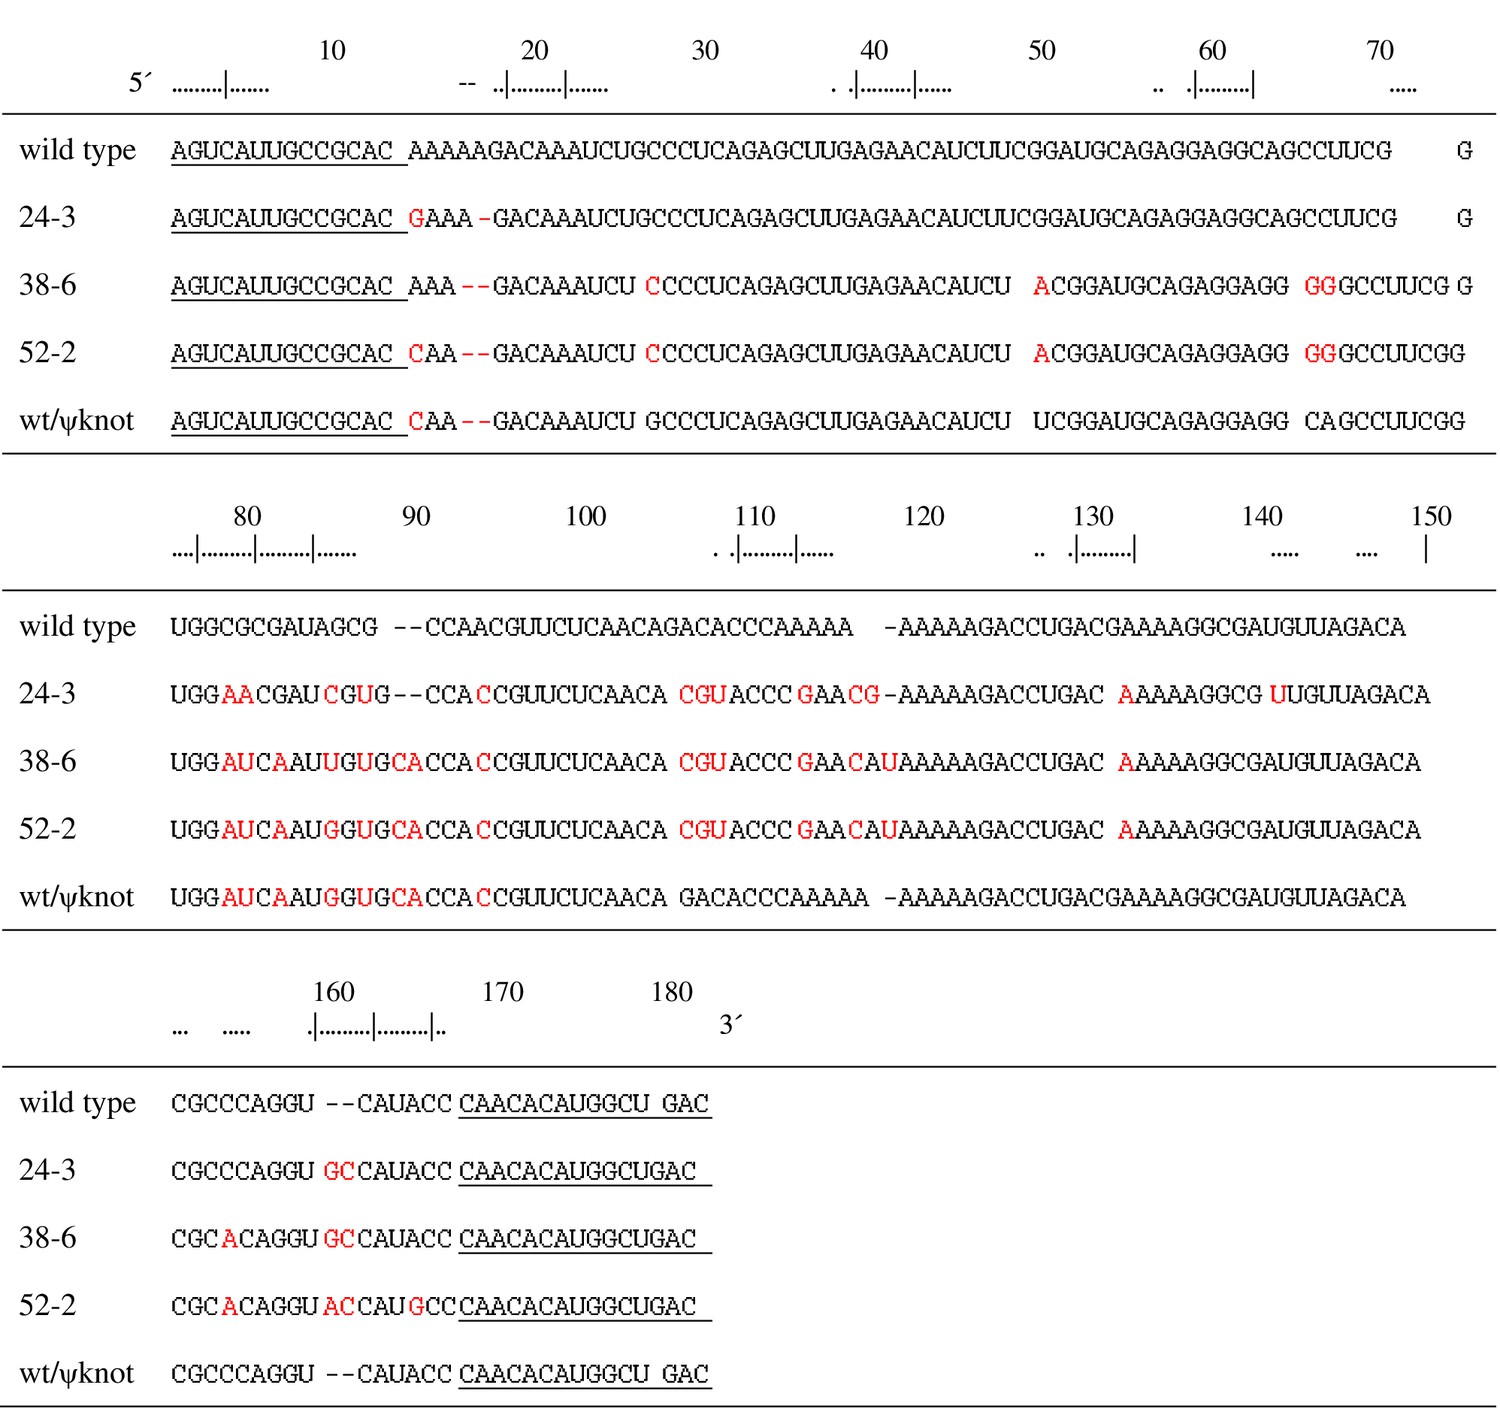
Aligned sequences of the named polymerase ribozymes.
Nucleotide positions are numbered according to the 52-2 polymerase (Figure 2A). Fixed primer binding sites are underlined. Mutations relative to the wild type are shown in red. wt/ψknot is a chimeric molecule that contains the pseudoknot structure of the 52-2 polymerase transplanted onto the wild-type background.
Figure 2—figure supplement 2
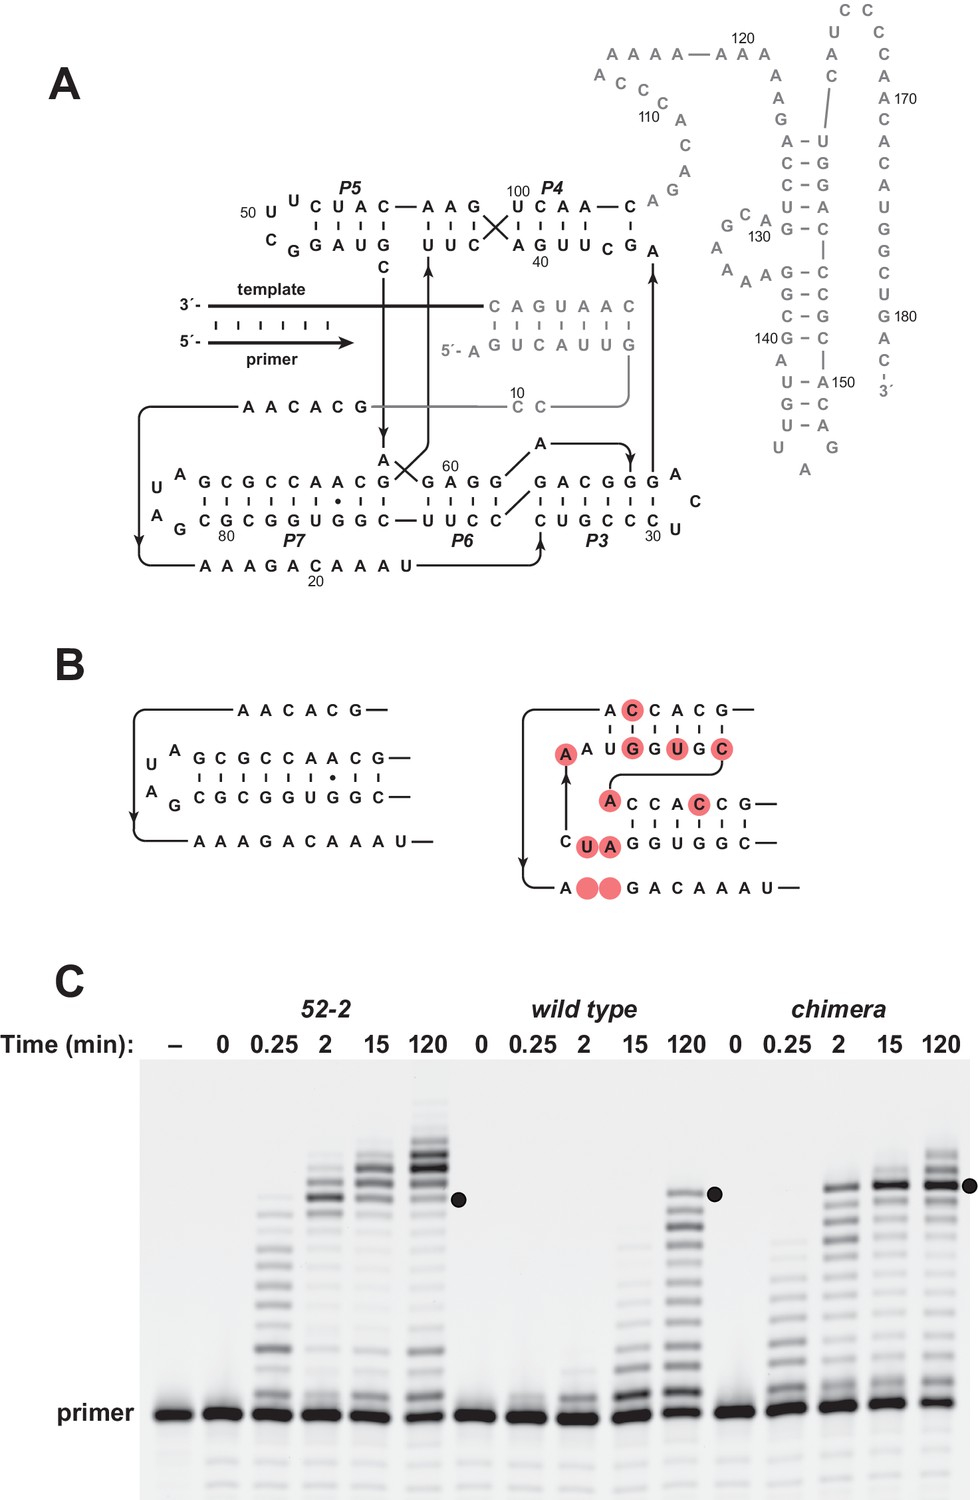
Installing the pseudoknot structure on the wild-type background.
(A) Sequence and secondary structure of the wild-type polymerase. Paired regions and nucleotides are numbered according to the 52-2 polymerase (see Figure 2A). (B) Region encompassing the P7 and P8 stems for both the wild-type (left) and 52-2 (right) polymerase. (C) Comparative activity of the 52-2, wild-type, and chimeric polymerases, the latter containing the pseudoknot structure (P7 and P8 region) from the 52-2 polymerase, but otherwise having the sequence of the wild type. Black dots indicate full-length products. Reaction conditions: 100 nM polymerase, 100 nM template encoding the sequence 5’-UGCGAAGCGUG-3’, 80 nM primer, 4 mM each NTP, and 200 mM MgCl2 at pH 8.3 and 17°C.
-
Figure 2—figure supplement 2—source data 1
Gel images (raw and annotated) of the reaction catalyzed by the 52-2, wild-type, and chimeric polymerases (Figure 2—figure supplement 2C).
- https://cdn.elifesciences.org/articles/71557/elife-71557-fig2-figsupp2-data1-v2.zip
Figure 3 with 2 supplements

Effect on polymerase activity of disruptive and compensatory mutations within the P8 stem.
(A) Yield of full-length RNA relative to that of the 52-2 polymerase in a 30 min reaction requiring the addition of 28 nucleoside 5’-triphosphates (NTPs) (note the logarithmic scale). At each position within the P8 stem, a transversion mutation was made in either the 5’ strand (blue) or the 3’ strand (gold), or the two mutations were combined to restore complementarity (green). Values are the average of at least three replicates with standard deviation. (B) Time course of primer extension by at least one nucleotide on an 11-nucleotide template, comparing the 52-2 polymerase (black), C12G mutant (blue), G88C mutant (gold), and C12G/G88C double mutant (green). The data were fit to a single exponential rise to maximum, allowing for an initial burst phase. (C) Average number of nucleotides added during the first 30 s of the reactions depicted in (B). The data were fit to a linear equation. For both (B) and (C), values are the average of two replicates with standard deviation. Reaction conditions: 100 nM polymerase, 100 nM template, 80 nM primer, 4 mM each NTP, and 200 mM MgCl2 at pH 8.3 and 17°C.
-
Figure 3—source data 1
Product yields and regression parameters for the reaction catalyzed by the standard and various mutant forms of the 52-2 polymerase (Figure 3 and Figure 3—figure supplement 1).
- https://cdn.elifesciences.org/articles/71557/elife-71557-fig3-data1-v2.xlsx
Figure 3—figure supplement 1
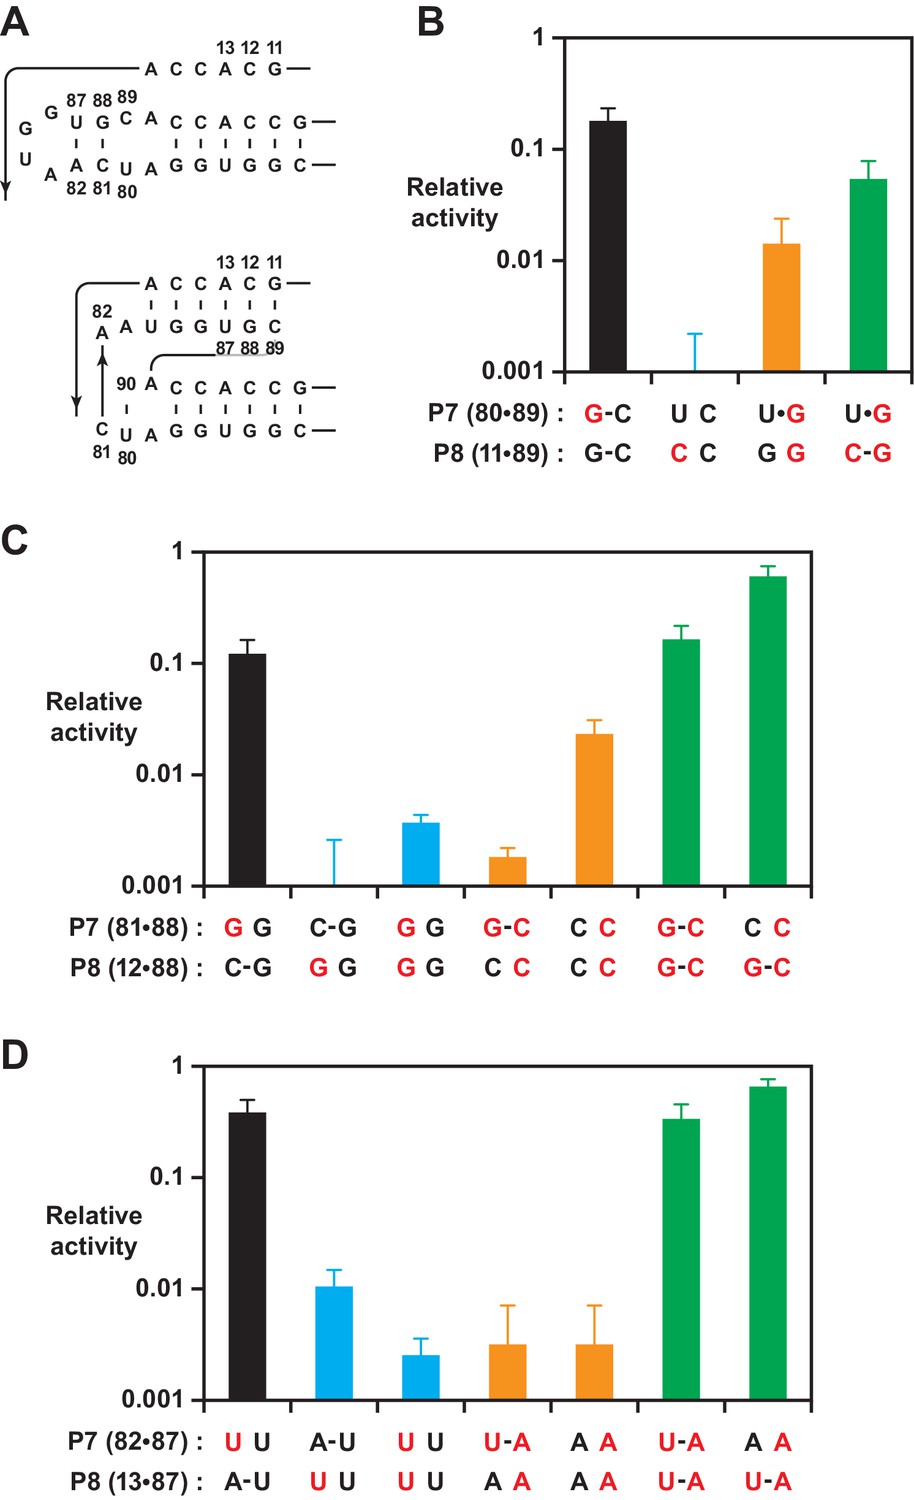
Effect on polymerase activity of mutations within the P7 and P8 stems.
(A) Secondary structure of the region encompassing the P7 and P8 stems, mapped onto both the old (top) and new (bottom) structures. Nucleotide positions that were subject to mutation are numbered. (B) Activity relative to the 52-2 polymerase due to mutations (red) that would have different consequences for the old vs. new structure, affecting the U80-C89 pair of P7 and/or G11-C89 pair of P8. Bars indicate activity following mutations that did not alter the P8 pair (black), introduced a transversion mutation in either the 5’ (blue) or 3’ (gold) strand, or introduced compensatory mutations to restore complementarity (green). (C) Activity determined as above for mutations affecting the C81-G88 pair of P7 and/or C12-C88 pair of P8. (D) Activity determined as above for mutations affecting the A82-U87 pair of P7 and/or A13-U87 pair of P8. For (B), (C), and (D), relative activity is the yield of full-length RNA compared to that of the 52-2 polymerase in a 30 min reaction requiring the addition of 28 nucleoside 5’-triphosphates (NTPs). Values are the average of at least three replicates with standard deviation. Reaction conditions as in Figure 3.
Figure 3—figure supplement 2
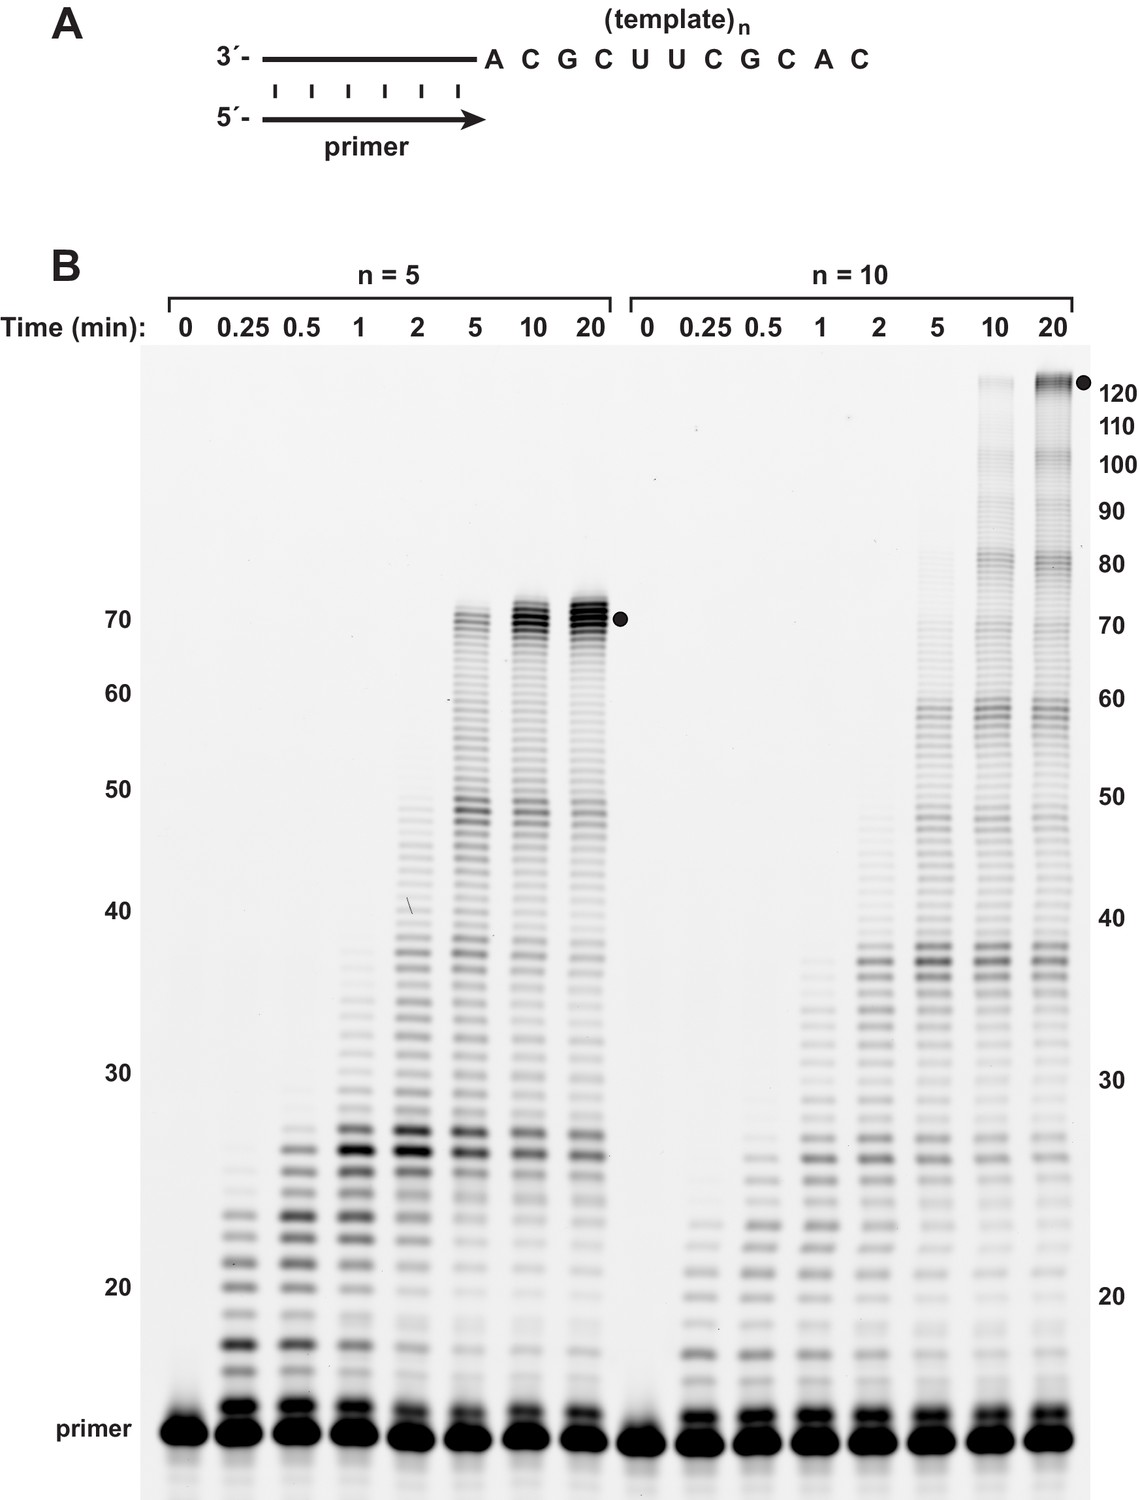
Burst-phase synthesis on long RNA templates.
(A) The template encoded either 5 or 10 repeats of the sequence 5’-UGCGAAGCGUG-3’. (B) Time course of primer extension on the long templates, demonstrating persistence of the burst phase to reach full-length products (indicated by black dots) by 5 or 10 min, respectively. Reaction conditions as in Figure 3.
-
Figure 3—figure supplement 2—source data 1
Gel images (raw and annotated) of the burst-phase reaction by the 52-2 polymerase on long RNA templates (Figure 3—figure supplement 2).
- https://cdn.elifesciences.org/articles/71557/elife-71557-fig3-figsupp2-data1-v2.zip
Figure 4 with 1 supplement
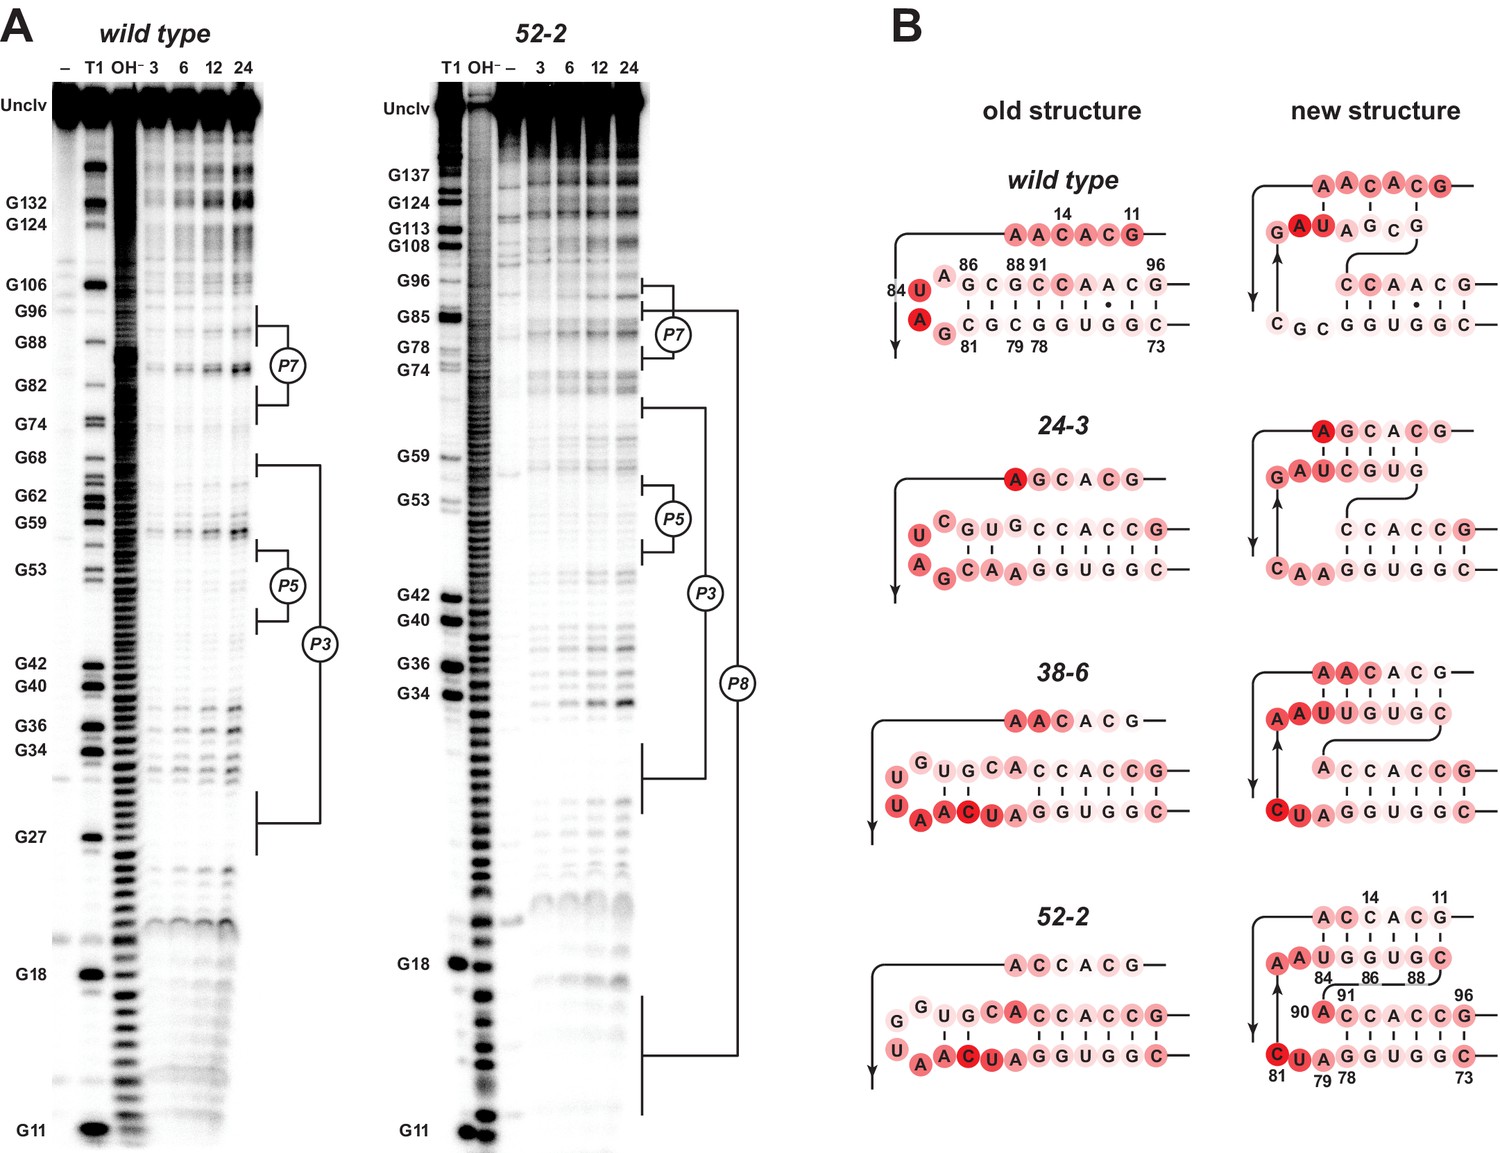
Analysis of polymerase structure by in-line probing.
(A) Polyacrylamide gel electrophoresis analysis of [5’-32 P]-labeled wild-type and 52-2 polymerases, incubated under polymerization conditions for 3, 6, 12, or 24 hr, in comparison to unincubated material (–) and material that had been subjected to partial digestion with either RNase T1 (cleaves after G residues) or NaOH. Full-length polymerase (unclv) and various G residues are labeled at the left; stem regions are labeled at the right. (B) Sensitivity to in-line cleavage mapped onto the P7 and P8 stems for both the old structure (left) and the new pseudoknot structure (right). For each polymerase, red circles of varying intensity indicate % cleavage after 24 hr at each nucleotide position relative to the position with the highest level of cleavage within the region shown.
-
Figure 4—source data 1
Gel images (raw and annotated) of in-line probing of the wild-type and 52-2 polymerases (Figure 4A).
- https://cdn.elifesciences.org/articles/71557/elife-71557-fig4-data1-v2.zip
-
Figure 4—source data 2
Quantitation of in-line probing data at positions 11–16 and 83–96 of the wild-type, 24-3, 38-6, and 52-2 polymerases after 24 hr (Figure 4B).
- https://cdn.elifesciences.org/articles/71557/elife-71557-fig4-data2-v2.xlsx
Figure 4—figure supplement 1
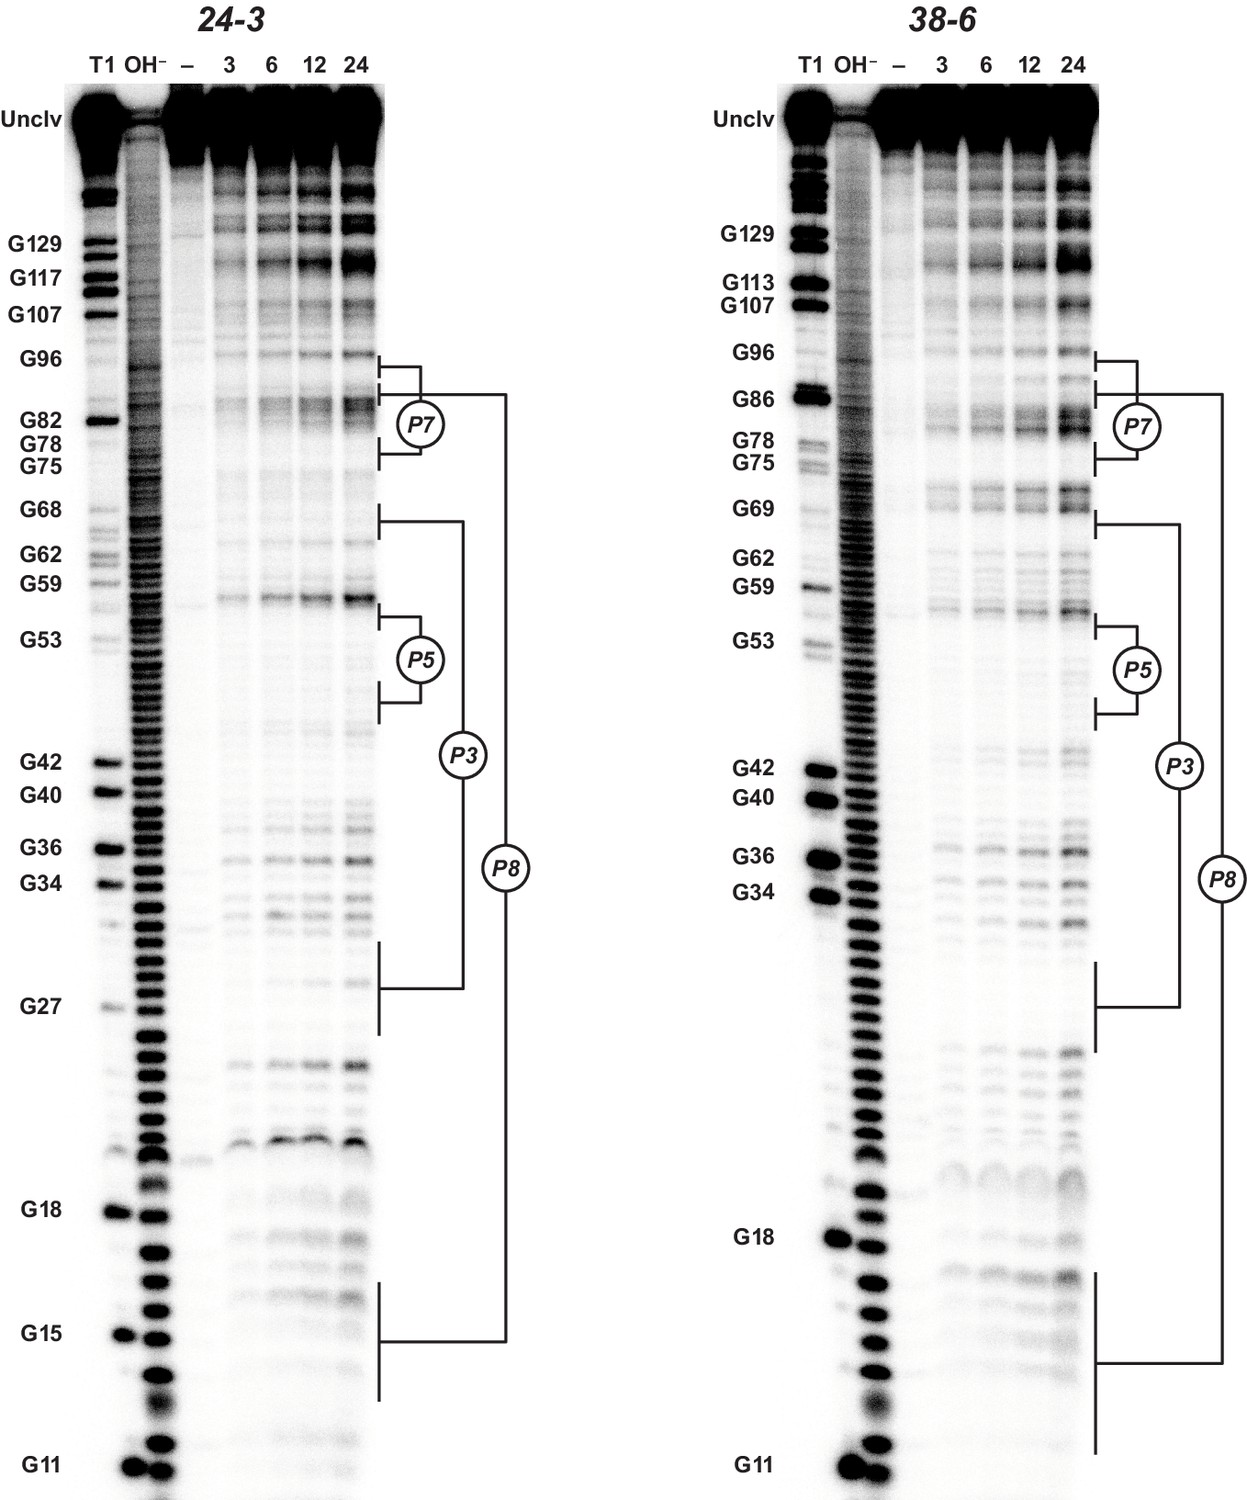
Analysis of polymerase structure by in-line probing.
Polyacrylamide gel electrophoresis analysis of [5’-32 P]-labeled 24-3 and 38-6 polymerases, incubated under polymerization conditions for 3, 6, 12, or 24 hr, in comparison to unincubated material (–) and material that had been subjected to partial digestion with either RNase T1 (cleaves after G residues) or NaOH. Full-length polymerase (unclv) and various G residues are labeled at the left; stem regions are labeled at the right.
-
Figure 4—figure supplement 1—source data 1
Gel images (raw and annotated) of in-line probing of the 24-3 and 38-6 polymerases.
- https://cdn.elifesciences.org/articles/71557/elife-71557-fig4-figsupp1-data1-v2.zip
Figure 5 with 1 supplement
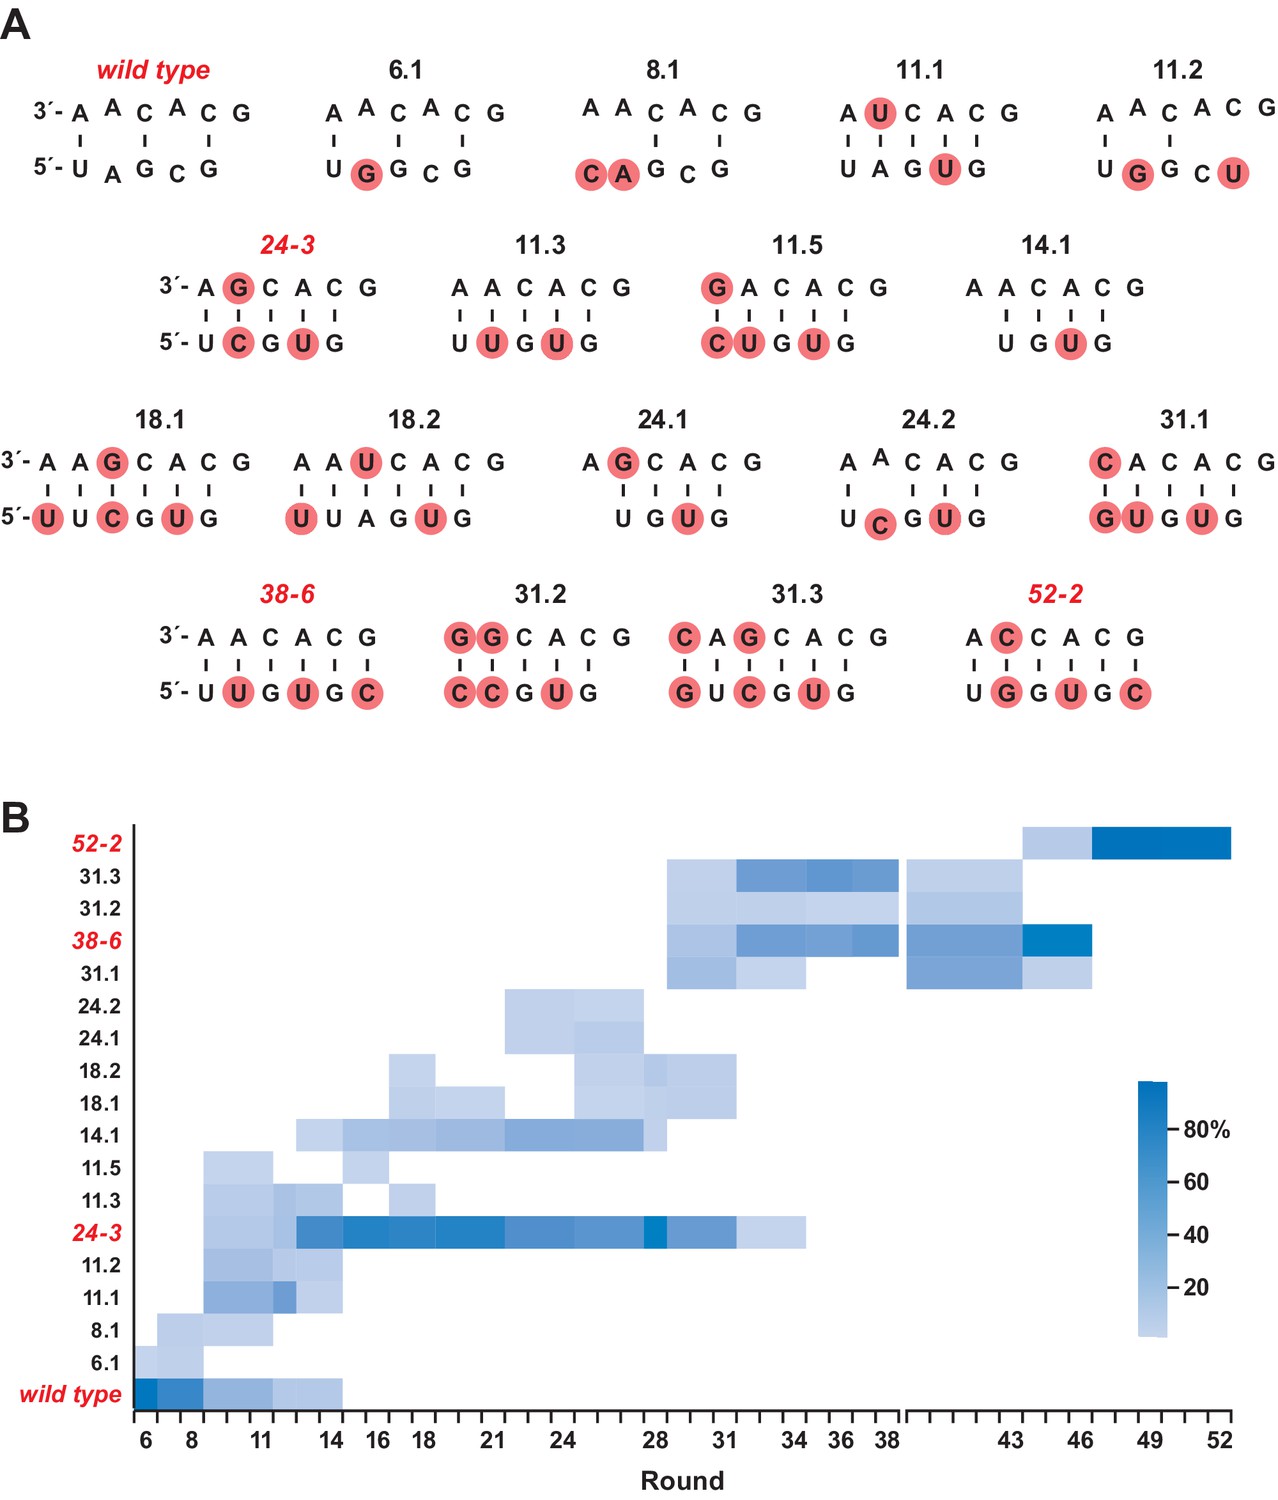
Composition of the evolving population.
(A) The 18 most highly represented sequence clusters for the P8 stem. Clusters that include the wild-type, 24-3, 38-6, and 52-2 polymerases are named for those polymerases; all other clusters are named according to the round in which they first appeared at a frequency of >1%. Red circles indicate mutations relative to the wild type. Note that for clusters 14.1 and 24.1, an A residue has been deleted in the bottom strand. (B) Heatmap depicting the representation of the 18 clusters over the course of evolution (scale bar at right). Axis break after round 38 indicates that the 38-6 polymerase was isolated from the population and mutated at a frequency of 10% per nucleotide position before resuming directed evolution.
Figure 5—figure supplement 1

Composition of each strand of the P8 stem over the course of evolution.
Individual frequency of occurrence of variants of the 5’ and 3’ strands of P8 (darker and lighter colors, respectively) corresponding to those that occur in the wild-type (red), 24-3 (gold), 38-6 (green), and 52-2 (blue) polymerases. For the 38-6 and 52-2 polymerases, the frequencies were identical for the two strands. The first four nucleotides of the 5’ strand are fixed as part of the primer binding site, thus limiting sequence variability to two nucleotides. For this reason, some variants appearing in rounds 16–28 (gray) could not be assigned to a named polymerase because they contain the same two nucleotides in the 5’ strand as both the wild-type and 38-6 polymerases.
-
Figure 5—figure supplement 1—source data 1
Frequency of occurrence of variants of the 5’ and 3’ strands of the P8 stem over the course of evolution.
- https://cdn.elifesciences.org/articles/71557/elife-71557-fig5-figsupp1-data1-v2.xlsx
Additional files
-
Supplementary file 1
Parameters for directed evolution of polymerase ribozymes.
The third column indicates the number of nucleoside 5’-triphosphates (NTPs) to be added in order to meet the selection criterion. ‘+’ indicates PCR mutagenesis; ‘10%’ indicates random mutagenesis of the 38-6 polymerase at 10% degeneracy per position.
- https://cdn.elifesciences.org/articles/71557/elife-71557-supp1-v2.docx
-
Supplementary file 2
Fidelity of the 52-2 polymerase.
The 52-2 polymerase was used to synthesize the hammerhead and class I ligase ribozymes (see Supplementary file 4 for sequences). The hammerhead was synthesized in the presence of either 200 or 50 mM Mg2+ and the ligase was synthesized in the presence of 200 mM Mg2+. The full-length products were analyzed by deep sequencing to obtain the frequencies of each type of mutation. The average fidelity was calculated as the geometric mean of the fidelities for each templating nucleobase, which gave values of 91.7% or 94.4% for the hammerhead with either 200 or 50 mM Mg2+, respectively, and 84.1% for the ligase. Deletions were included as mutations and insertions were treated as a single mutation at the immediately upstream position.
- https://cdn.elifesciences.org/articles/71557/elife-71557-supp2-v2.docx
-
Supplementary file 3
Prevalent sequence clusters over the course of evolution.
Clusters representing >1% of the population in a given round are shown. Clusters that differ by only a single nucleotide outside the P8 stem are given the same name. Clusters that include the wild type, 24-3, 38-6, or 52-2 polymerase are given the name of that polymerase.
- https://cdn.elifesciences.org/articles/71557/elife-71557-supp3-v2.docx
-
Supplementary file 4
Sequences of RNA and DNA molecules used in this study.
The molecules were synthesized in-house (syn), purchased from IDT (com), or prepared by in vitro transcription (ivt). The T7 RNA polymerase promoter sequence is underlined. Sequences in green indicate the complementary tag on the ribozyme and templates used to improve processivity. Sequences in blue indicate the primer binding site for RNA-templated RNA polymerization. Nucleotides in red are mutations relative to the 52-2 polymerase, that were introduced during PCR assembly. hex, hexynyl group for click chemistry; PEG, polyethylene glycol linker; pcl, photocleavable linker; FAM, 6-fluorescein label; Cy5, cyanine 5-methine label; ppp, 5’-triphosphate added by chemical synthesis.
- https://cdn.elifesciences.org/articles/71557/elife-71557-supp4-v2.docx
-
Transparent reporting form
- https://cdn.elifesciences.org/articles/71557/elife-71557-transrepform1-v2.docx
-
Source data 1
Cluster analysis of the nucleotide sequence at positions 9–17 and 83–95 of the polymerase over the course of evolution.
- https://cdn.elifesciences.org/articles/71557/elife-71557-supp5-v2.xlsx
-
Source code 1
Python script used to identify unique polymerase sequences and their corresponding number of reads for each round of evolution that was analyzed.
- https://cdn.elifesciences.org/articles/71557/elife-71557-supp6-v2.zip
Download links
A two-part list of links to download the article, or parts of the article, in various formats.
Downloads (link to download the article as PDF)
Open citations (links to open the citations from this article in various online reference manager services)
Cite this article (links to download the citations from this article in formats compatible with various reference manager tools)
Witnessing the structural evolution of an RNA enzyme
eLife 10:e71557.
https://doi.org/10.7554/eLife.71557


