Control of protein synthesis and memory by GluN3A-NMDA receptors through inhibition of GIT1/mTORC1 assembly
- lnstituto de Neurociencias (UMH-CSIC), Spain
- Centro de Investigación Médica Aplicada (CIMA), University of Navarra, Spain
- Centre for Developmental Neurobiology, Institute of Psychiatry, King’s College London, United Kingdom
- National Eye Institute, National Institutes of Health, United States
- Institute of Science and Technology Austria, Austria
- Institut de Biologie de l’Ecole Normale Supérieure/CNRS/INSERM, France
- Centro de Biología Molecular Severo Ochoa (UAM-CSIC), Spain
- Institut de Neurociències, Departament de Psicobiologia i de Metodologia de les Ciències de la Salut, Unitat de Neurociència Traslacional, Parc Taulí Hospital Universitari, Institut d’Investigació i Innovació Parc Taulí (I3PT), Universitat Autònoma de Barcelona, Spain
- Centro de Investigación Biomédica en Red de Salud Mental (CIBERSAM), Instituto de Salud Carlos III, Spain
- ICREA, Spain
- Department of Pharmacological and Biomolecular Sciences, University of Milan, Italy
- Department of Pharmacology, Addiction Science, and Toxicology, University of Tennessee Health Science Center, United States
Figures
Figure 1 with 2 supplements
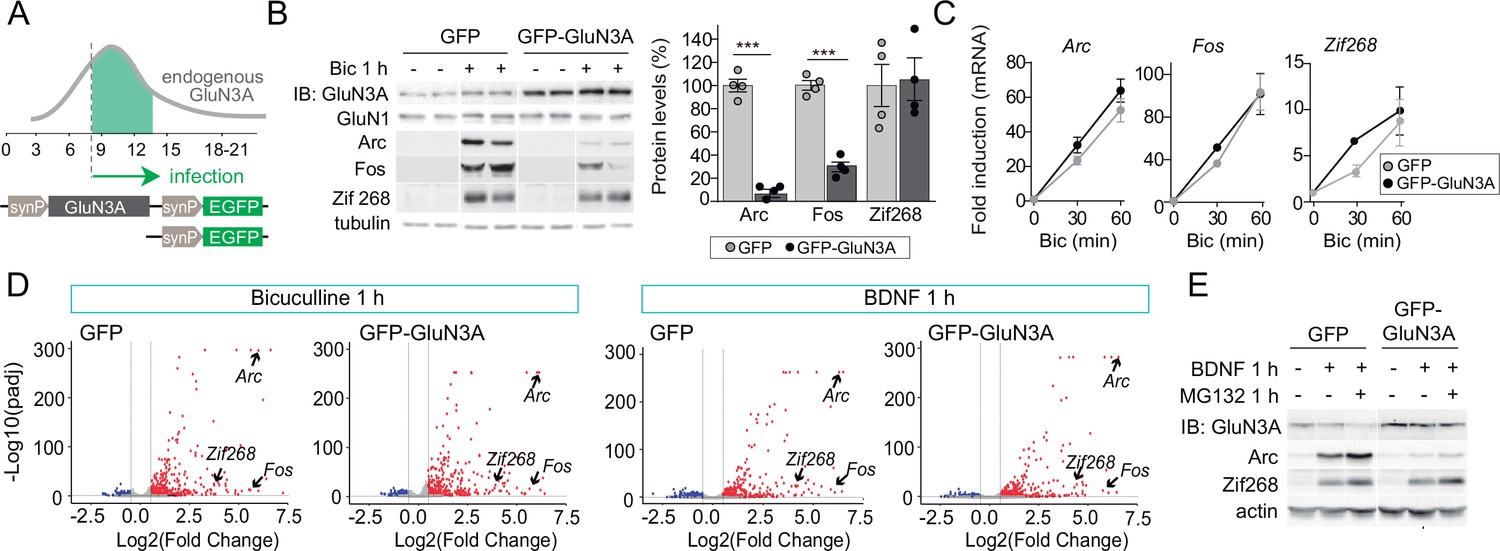
GluN3A inhibits the activity-dependent induction of a subset of immediate-early genes (IEGs).
(A) Timeline of endogenous GluN3A expression and downregulation and of lentiviral infections. Rat cortical neurons in primary culture were infected on days in vitro (DIV) 9 with lentiviruses where Green fluorescent protein (GFP) or GluN3A and GFP (GFP-GluN3A) expression is driven by the human synapsin 1 promoter (synP). (B, C) DIV14 neurons were treated with bicuculline (50 μM, 1 hr) and matching samples collected for immunoblot and mRNA analyses (n = 4 from two independent cultures; ***p < 0.001, two-tailed unpaired t-test). (B) Left, representative western blots show that GluN3A inhibits the induction of the IEGs Arc and Fos but not Zif268. Right, signal intensities of indicated proteins as percentage of stimulated GFP-infected neurons. (C) quantitative Reverse Transcription-Polymerase Chain Reaction (qRT-PCR) analysis of IEG mRNA induction. Plotted values are fold-induction relative to non-stimulated neurons. (D) Volcano plots presenting the RNAseq-based differential expression analysis in DIV14 neurons treated with bicuculline or Brain-derived neurotrophic factor (BDNF) for 1 hr (n = 2–4 from two independent cultures). (E) DIV14 neurons were treated with MG132 (30 μM). A representative western blot probed with the indicated antibodies is shown. In immunoblot analyses, tubulin or actin was used as a loading control and GluN1 as a measure of potential effects of GluN3A on overall NMDAR numbers. Histograms in this and subsequent figures are mean ± standard error of the mean (SEM).
-
Figure 1—source data 1
Western blots for immediate-early gene (IEG) induction in GFP and GFP-GluN3A-infected neurons after bicuculline treatment.
- https://cdn.elifesciences.org/articles/71575/elife-71575-fig1-data1-v1.zip
-
Figure 1—source data 2
Western blots for bicuculline induction of immediate-early genes (IEGs) in GFP and GFP-GluN3A-infected neurons in the presence of MG132.
- https://cdn.elifesciences.org/articles/71575/elife-71575-fig1-data2-v1.zip
Figure 1—figure supplement 1

Selective versus global effects of GluN3A expression and general NMDAR blockade on activity-dependent signaling.
(A) Immunoblot (IB) analysis of the time-course of expression of NMDAR subunits and a repertoire of synaptic proteins in cultured cortical neurons. (B) Immunoblot analysis of extracellular signal-regulated kinase (ERK1/2) and cAMP Response Element Binding Protein (CREB) phosphorylation in whole-cell lysates of days in vitro (DIV) 14 cortical neurons treated with bicuculline for 1 hr. Left, representative western blots probed with the indicated antibodies. Right, fold-induction by bicuculline of phosphorylated proteins normalized to their total levels (n = 6–8 from three to four independent cultures). (C) Total lysates from cortical neurons pretreated with D-2-amino-5-phosphonovaleric acid (APV) (50 μM, 30 min) before stimulation with bicuculline (50 μM, 1 hr) were immunoblotted with the indicated antibodies. Quantification showed a general blockade of activity dependent by APV (n = 4–6 samples from two to three independent cultures, **p < 0.01, ***p < 0.001 analysis of variance (ANOVA) followed by Tukey’s test). (D) APV blocked the increase in Arc and Fos mRNA induced by bicuculline (n = 6–10 samples from three independent cultures, ***p < 0.001 one-way ANOVA followed by Tukey’s test). Data are expressed as fold-induction of non-stimulated neurons. (E, F) Analogous experiments to the ones in Figure 1B and C were conducted upon stimulation with BDNF (100 ng/ml, 1 hr).
-
Figure 1—figure supplement 1—source data 1
Annotated western blots and original scans.
- https://cdn.elifesciences.org/articles/71575/elife-71575-fig1-figsupp1-data1-v1.zip
-
Figure 1—figure supplement 1—source data 2
Annotated western blots and original scans.
- https://cdn.elifesciences.org/articles/71575/elife-71575-fig1-figsupp1-data2-v1.zip
-
Figure 1—figure supplement 1—source data 3
Annotated western blots and original scans.
- https://cdn.elifesciences.org/articles/71575/elife-71575-fig1-figsupp1-data3-v1.zip
-
Figure 1—figure supplement 1—source data 4
Annotated western blots and original scans.
- https://cdn.elifesciences.org/articles/71575/elife-71575-fig1-figsupp1-data4-v1.zip
Figure 1—figure supplement 2

RNAseq analysis of activity-dependent gene expression.
(A) Principal component analysis plot representing all RNAseq samples. (B) Volcano plot from RNAseq analysisof gene expression in untreated days in vitro (DIV) 14 neurons infected with GFP or GFP-GluN3A. (C) Integrative Genome Viewer tracks for RNAseq signal at representative genes in the different conditions. The immediate-early genes (IEGs) Arc, Fos, and Egr1 are similarly induced by bicuculline (Bic) and BDNF treatments in GFP and GFP-GluN3A-infected cultures. As expected, levels of Grin3a are increased in GFP-GluN3A- compared to GFP-infected cultures.
Figure 2 with 1 supplement
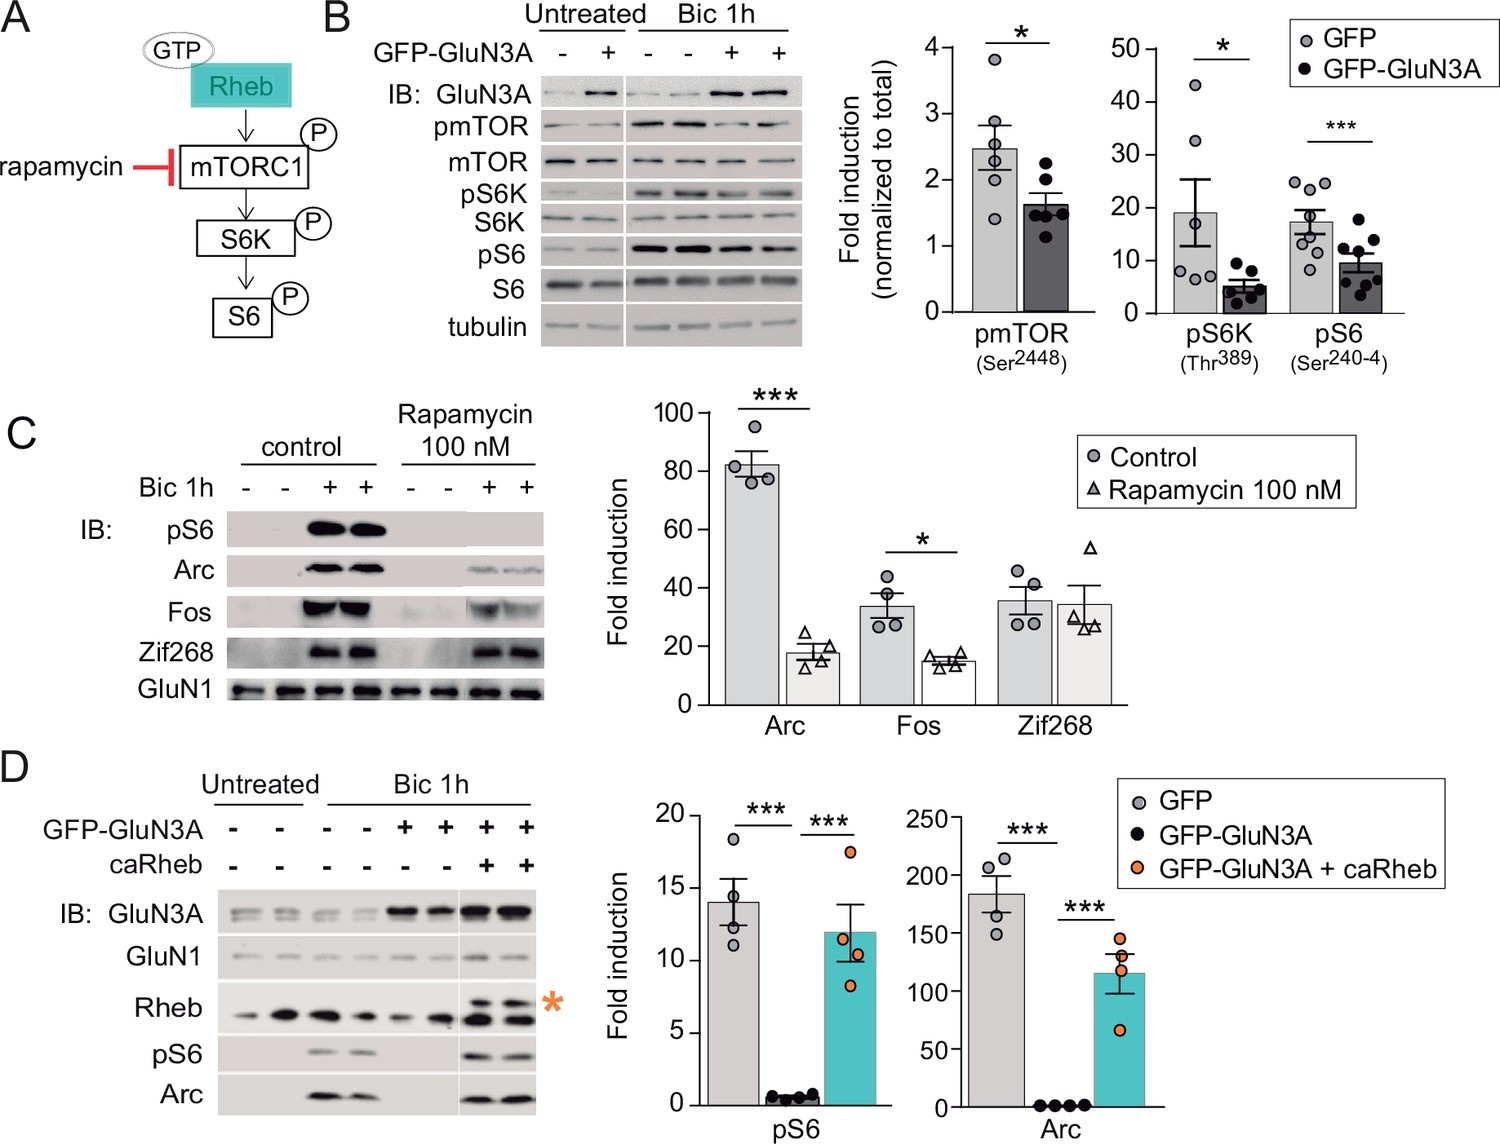
GluN3A inhibits the activation of mTORC1 signaling by synaptic stimuli.
(A) Schematic of the mTORC1 signaling pathway. (B) Left, representative western blots of primary rat cortical neurons infected with GFP and GFP-GluN3A (days in vitro [DIV] 9) and treated with bicuculline at DIV14. Right, fold-induction of phosphorylated mTOR, S6 kinase (S6K), and S6 normalized to total protein (n = 6–8 from three to four independent cultures; *p < 0.05, ***p < 0.001, two-tailed paired t-test). (C) mTOR is required for activity-dependent induction of Arc and Fos but not Zif268. Left, representative western blots of DIV14 neurons stimulated with bicuculline after preincubation with rapamycin (100 nM, 1 hr before and during bicuculline treatment). Right, fold-induction of immediate-early genes (IEGs) in response to bicuculline (n = 4 from two independent cultures; *p < 0.05, ***p < 0.001, two-tailed paired t-test). (D) Reactivation of mTOR in GFP-GluN3A-infected neurons by adeno-associated virus (AAV) driven constitutively active Rheb (caRheb) rescues Arc induction. Left, representative western blots of neurons infected with lentiviral GFP-GluN3A and AAV-caRheb and treated with bicuculline. Right, fold-induction by bicuculline of pS6 and Arc in the indicated conditions (n = 4 from two independent cultures; ***p < 0.001, one-way analysis of variance [ANOVA] followed by Tukey’s test).
-
Figure 2—source data 1
Western blots for mTOR and downstream effector phosphorylation in GFP and GFP-GluN3A-infected cortical neurons after bicuculline treatment.
- https://cdn.elifesciences.org/articles/71575/elife-71575-fig2-data1-v1.zip
-
Figure 2—source data 2
Western blots for rapamycin dependence of immediate-early gene (IEG) induction in DIV14 cortical neurons by bicuculline treatment.
- https://cdn.elifesciences.org/articles/71575/elife-71575-fig2-data2-v1.zip
-
Figure 2—source data 3
Western blots for S6 phosphorylation and Arc induction by bicuculline in GFP and GFP-GluN3A-infected cortical neurons in the presence of caRheb.
- https://cdn.elifesciences.org/articles/71575/elife-71575-fig2-data3-v1.zip
Figure 2—figure supplement 1

General inhibition of the activity induction of immediate-early genes (IEGs) by anisomycin.
(A) Immunoblot analysis of the phosphorylation status of the mTOR downstream effector S6 in lysates from days in vitro (DIV) 14 cortical neurons stimulated with bicuculline in the absence (Ctrl) or presence of D-2-amino-5-phosphonovaleric acid (APV) (50 μM, 30 min) or MK801 (10 μM, 1 hr). (B) General inhibition of protein synthesis blocks activity induction of Arc, Fos, and Zif268. Whole lysates from DIV14 cortical neurons either untreated or treated with bicuculline (50 μM, 1 hr) and anisomycin (0.8 μM, 1 hr) were immunoblotted with the indicated antibodies. Left, representative immunoblots and right, quantifications, show a general blockade of IEGs tested by anisomycin. Data are expressed as fold-induction of nontreated neurons (n = 3–4 independent cultures, ***p < 0.001 analysis of variance [ANOVA] followed by Tukey’s test).
-
Figure 2—figure supplement 1—source data 1
Annotated western blots and original scans.
- https://cdn.elifesciences.org/articles/71575/elife-71575-fig2-figsupp1-data1-v1.zip
-
Figure 2—figure supplement 1—source data 2
Annotated western blots and original scan.
- https://cdn.elifesciences.org/articles/71575/elife-71575-fig2-figsupp1-data2-v1.zip
Figure 3
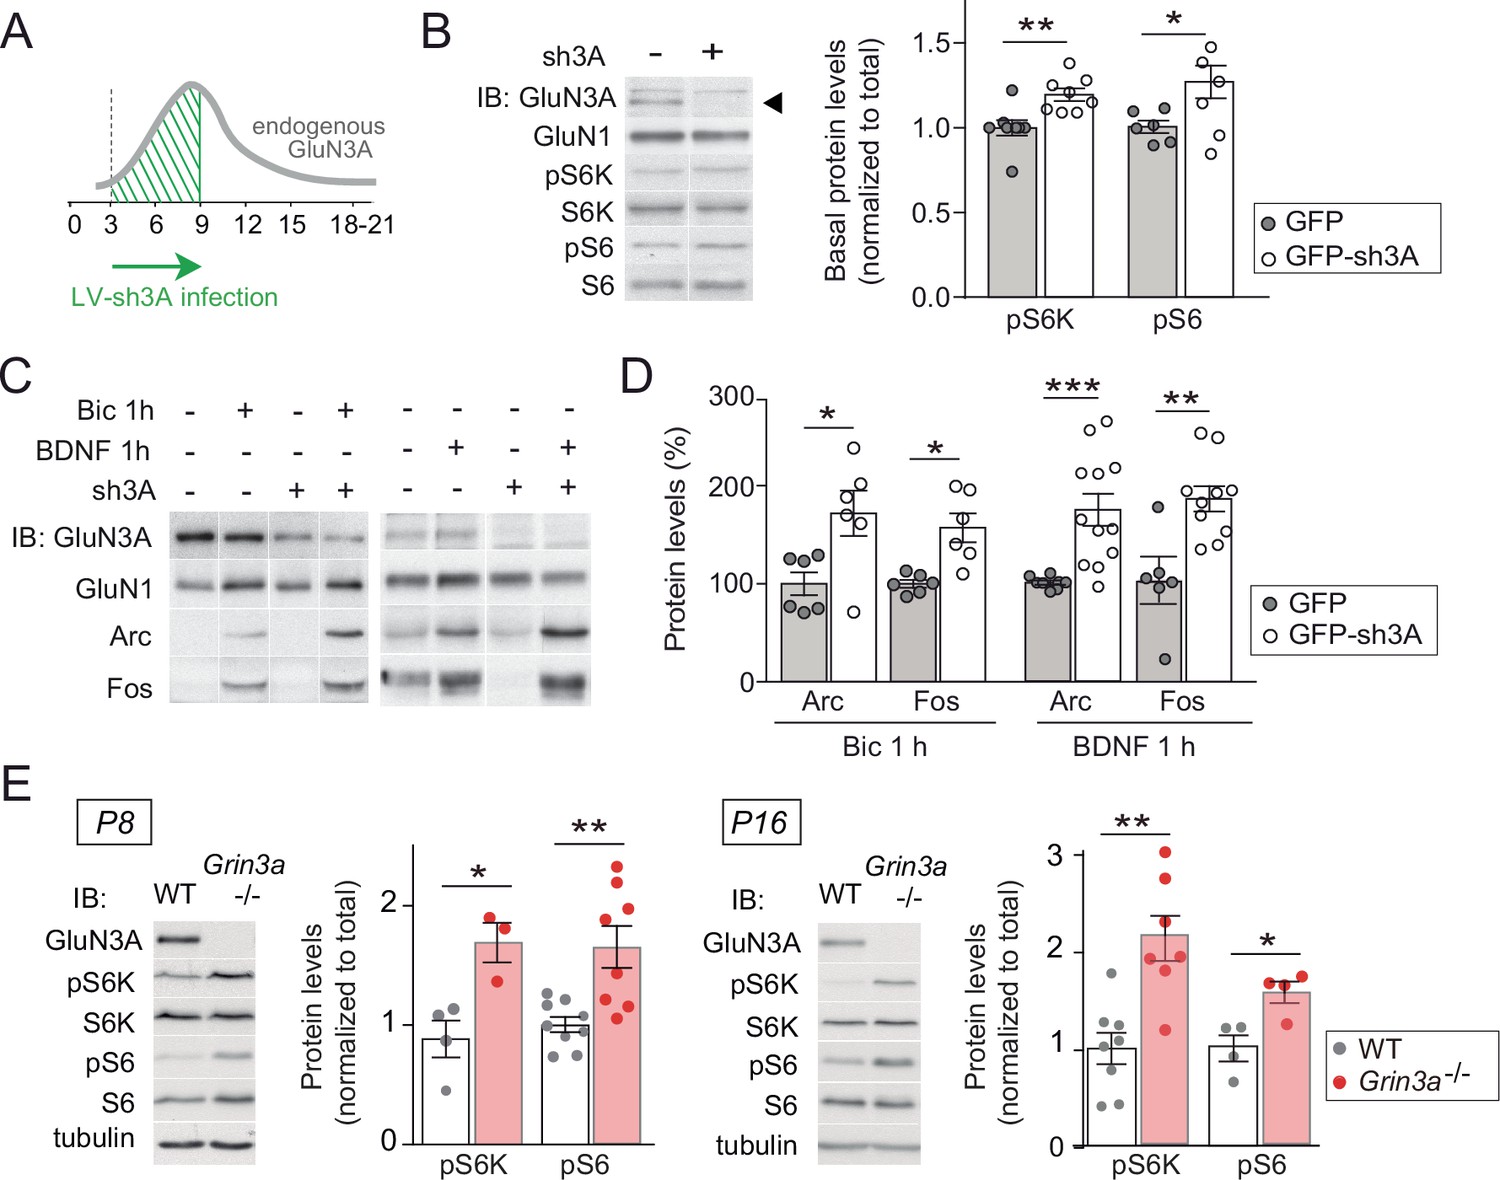
GluN3A deletion potentiates synaptic mTORC1 signaling.
(A) Primary rat cortical neurons were infected on days in vitro (DIV) 3 with lentiviruses expressing GFP alone or along with a small hairpin RNA (shRNA) against GluN3A (GFP-sh3A) and collected at DIV7–9, when GluN3A expression is maximal. (B) Representative blots and quantification of phosphorylated S6 kinase (S6K) and S6 normalized to total protein (n = 6–8 from three to four independent cultures; *p < 0.05, **p < 0.01 two-tailed paired t-test). Arrow marks specific GluN3A band. (C, D) Representative western blots and quantification of immediate-early gene (IEG) induction by bicuculline or BDNF (n = 6–12 from three independent cultures; *p < 0.05, **p < 0.01, ***p < 0.001, two-tailed paired t-test). Data plotted as percentage of stimulated control GFP-infected neurons. (E) Immunoblots and quantification of S6K and S6 phosphorylation in lysates from wild-type (WT) and Grin3a−/− hippocampi (n = 4–8 mice; *p < 0.05, **p < 0.01, two-tailed unpaired t-test).
-
Figure 3—source data 1
Western blots for S6 kinase (S6K) and S6 phosphorylation in control and sh3A-infected days in vitro (DIV) 7 cortical neurons.
- https://cdn.elifesciences.org/articles/71575/elife-71575-fig3-data1-v1.zip
-
Figure 3—source data 2
Western blots for Arc and Fos induction by bicuculline and BDNF in control and sh3A-infected days in vitro (DIV) 7 cortical neurons.
- https://cdn.elifesciences.org/articles/71575/elife-71575-fig3-data2-v1.zip
-
Figure 3—source data 3
Western blots for S6 kinase (S6K) and S6 phosphorylation in lysates from P8 and P16 wild-type and Grin3a−/− hippocampi.
- https://cdn.elifesciences.org/articles/71575/elife-71575-fig3-data3-v1.zip
Figure 4 with 1 supplement
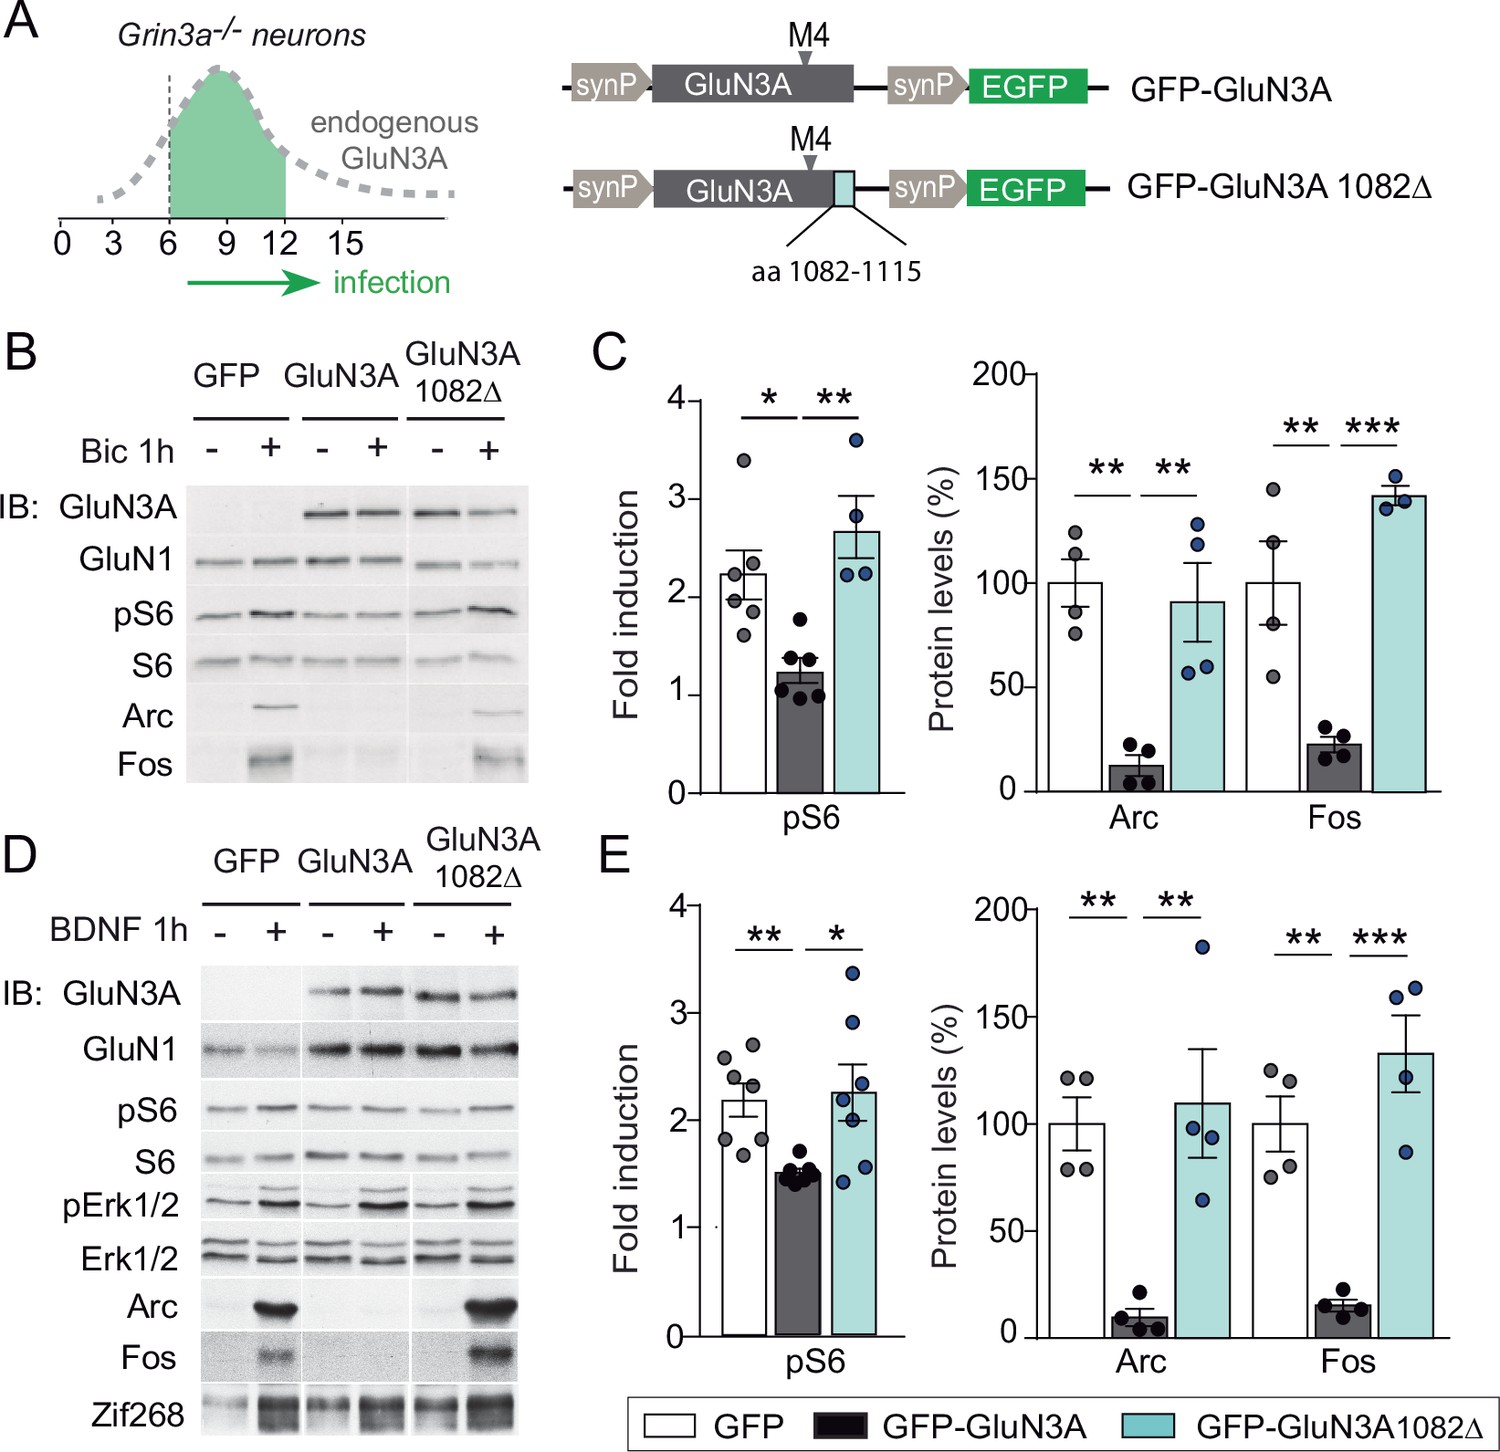
mTORC1 inhibition is mediated by GluN3A C-terminal domain interactions.
(A) Cortical neurons from Grin3a−/− mice were infected on days in vitro (DIV) 6 with lentiviruses expressing GFP, GFP-GluN3A, or GFP-GluN3A1082∆, and stimulated with bicuculline or BDNF at DIV12. (B, D) Representative western blots of lysates from bicuculline or BDNF-treated neurons probed for the indicated antibodies. (C, E) Induction of phosphorylated S6 (normalized to total levels), Arc and Fos by bicuculline or BDNF (n = 3–7 from two to four independent cultures, *p < 0.05, **p < 0.01, ***p < 0.001 analysis of variance [ANOVA] followed by Tukey’s test).
-
Figure 4—source data 1
Western blots for mechanistic target of rapamycin (mTOR) effector phosphorylation and Arc and Fos induction in GFP, GFP-GluN3A, and GFP-GluN3A1082Δ-infected cortical neurons after bicuculline treatment.
- https://cdn.elifesciences.org/articles/71575/elife-71575-fig4-data1-v1.zip
-
Figure 4—source data 2
Western blots for mechanistic target of rapamycin (mTOR) effector phosphorylation and Arc and Fos induction in GFP, GFP-GluN3A, and GFP-GluN3A1082Δ-infected cortical neurons after BDNF treatment.
- https://cdn.elifesciences.org/articles/71575/elife-71575-fig4-data2-v1.zip
Figure 4—figure supplement 1
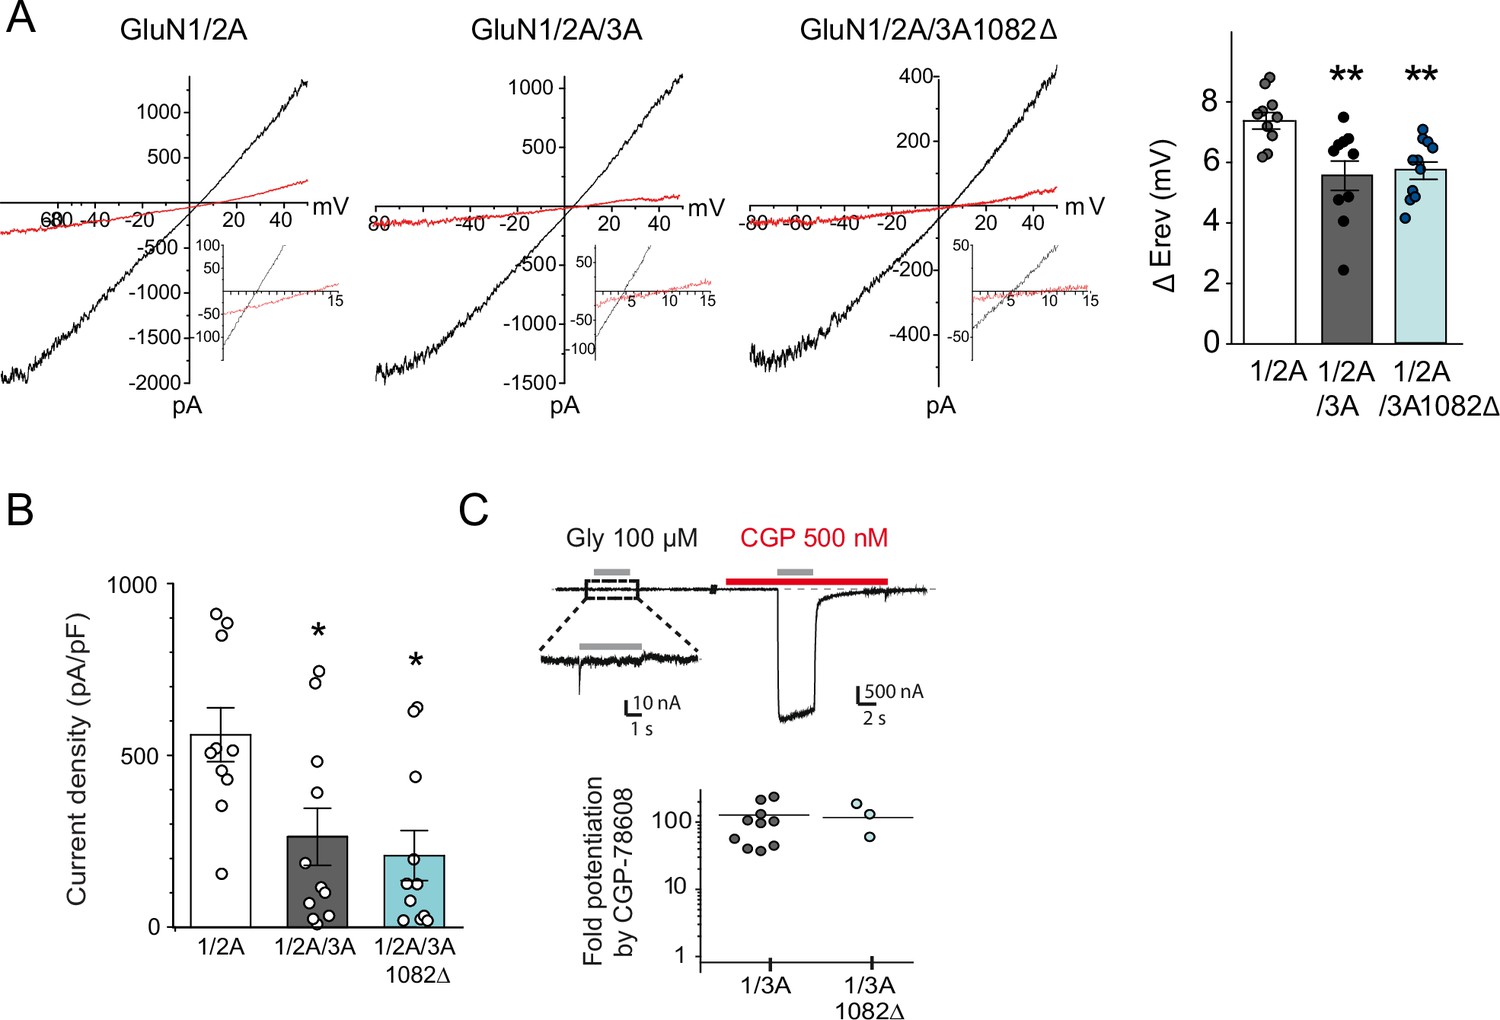
Electrophysiological properties of recombinant NMDA and excitatory glycine receptors containing full-length or truncated GluN3A.
(A) Left, representative steady-state glutamate-evoked ramp currents obtained with 2 mM (black) and 10 mM (red) extracellular Ca2+ for HEK293 cells expressing GluN1A/GluN2A alone, or with either GFP-GluN3A or GFP-GluN3A1082Δ. Insets show currents on expanded scale to highlight the Erev. Right, summary graph of the ΔErev obtained from multiple experiments is shown on right (n = 10–11, **p < 0.01, one-way analysis of variance [ANOVA] followed by Bonferroni post hoc test). (B) Summary graph depicting current density from HEK293 cells expressing GluN1A/GluN2A alone, or with either GFP-GluN3A or GFP-GluN3A1082Δ (*p < 0.05 compared to GluN1A/GluN2A, one-way analysis of variance (ANOVA) followed by Bonferroni post hoc test). (C) Top, responses to glycine of HEK293 cells expressing GluN1/GluN3A receptors in the absence or presence of CGP-78608 (500 nM). Bottom, quantification of fold peak current potentiation by CGP-78608 for GluN1/GluN3A and GluN1/GluN3A1082Δ receptors (n = 3–11).
Figure 5
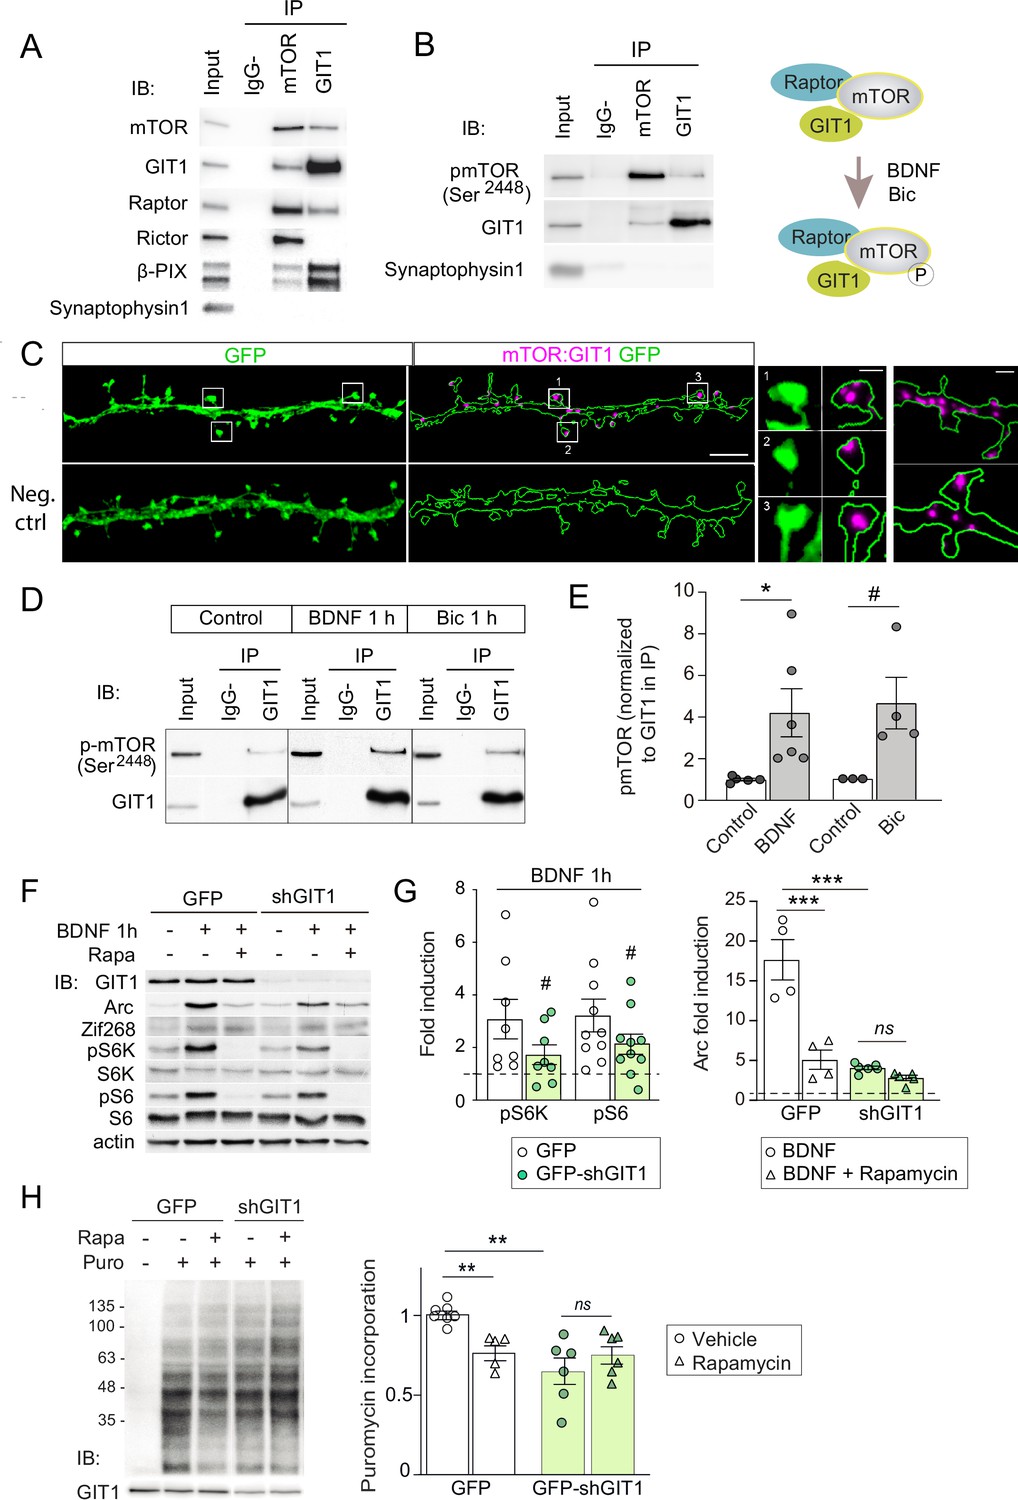
GIT1/mechanistic target of rapamycin (mTOR)/Raptor complexes couple synaptic activation to mTORC1-dependent protein synthesis.
(A, B) Protein extracts from P16 mouse hippocampus were solubilized with 0.3 % CHAPS buffer, incubated with antibodies against mTOR or GIT1 (IP), and immunoprecipitated proteins analysed by immunoblot (IB). Input: 10 % of lysate used for immunoprecipitation. IgG−: no antibody control. A cartoon of the interactions and regulation by activity (see panel D) is shown. (C) Representative images of proximity ligation assay for rat mTOR: GIT1 (magenta) in days in vitro (DIV) 17 rat hippocampal neurons transfected with GFP (green) to visualize dendritic morphology (scale bar, 5 μm). High magnification examples of spines and dendrites (scale bars, 0.5 and 1 μm) are shown. As negative control, only mTOR primary antibody was used. (D, E) Rat cortical neurons stimulated with BDNF or bicuculline were solubilized with 0.3 % CHAPS and incubated with GIT1 antibody (IP). Representative immunoblots (D) and quantification of mTOR phosphorylation in GIT1 immunoprecipitates (E) are shown (n = 3–6 from three independent cultures; *p < 0.05, # = 0.06, two-tailed unpaired t-test). (F–H) Primary mouse cortical neurons were infected with lentiviruses expressing GFP or GFP-shGIT1 on DIV7. mTOR responses to BDNF (F, G) and puromycin incorporation (H) in the presence or absence of 100 nM rapamycin were analyzed at DIV14. Quantification of phosphorylated S6K and S6 and Arc induction (#pS6K: p = 0.13, #pS6: p = 0.05, two-tailed paired; ***p < 0.001, two-way analysis of variance [ANOVA] followed by Tukey’s test) (G) and puromycin levels normalized to Ponceau S (n = 5–7 from four independent cultures, **p < 0.01, two-way ANOVA followed by Tukey’s test) (H) are shown.
-
Figure 5—source data 1
Coimmunoprecipitation assays of GIT1 with mechanistic target of rapamycin (mTOR), Raptor, and Rictor in P16 mouse hippocampus.
- https://cdn.elifesciences.org/articles/71575/elife-71575-fig5-data1-v1.zip
-
Figure 5—source data 2
Coimmunoprecipitation of GIT1 with phosphorylated mechanistic target of rapamycin (mTOR) in Ser2448 in P16 mouse hippocampus.
- https://cdn.elifesciences.org/articles/71575/elife-71575-fig5-data2-v1.zip
-
Figure 5—source data 3
Coimmunoprecipitaion of GIT1 and phosphorylated mechanistic target of rapamycin (mTOR) in days in vitro (DIV) 17 hippocampal neurons after bicuculline and BDNF treatment.
- https://cdn.elifesciences.org/articles/71575/elife-71575-fig5-data3-v1.zip
-
Figure 5—source data 4
Western blots of mechanistic target of rapamycin (mTOR) effectors and immediate-early gene (IEG) induction by BDNF in the presence or absence of rapamycin in days in vitro (DIV) 14 cortical neurons infected with control or shGIT1-expressing lentiviruses.
- https://cdn.elifesciences.org/articles/71575/elife-71575-fig5-data4-v1.zip
-
Figure 5—source data 5
Western blots of puromycin incorporation in days in vitro (DIV) 14 cortical neurons infected with control or shGIT1-expressing lentiviruses.
- https://cdn.elifesciences.org/articles/71575/elife-71575-fig5-data5-v1.zip
Figure 6 with 2 supplements
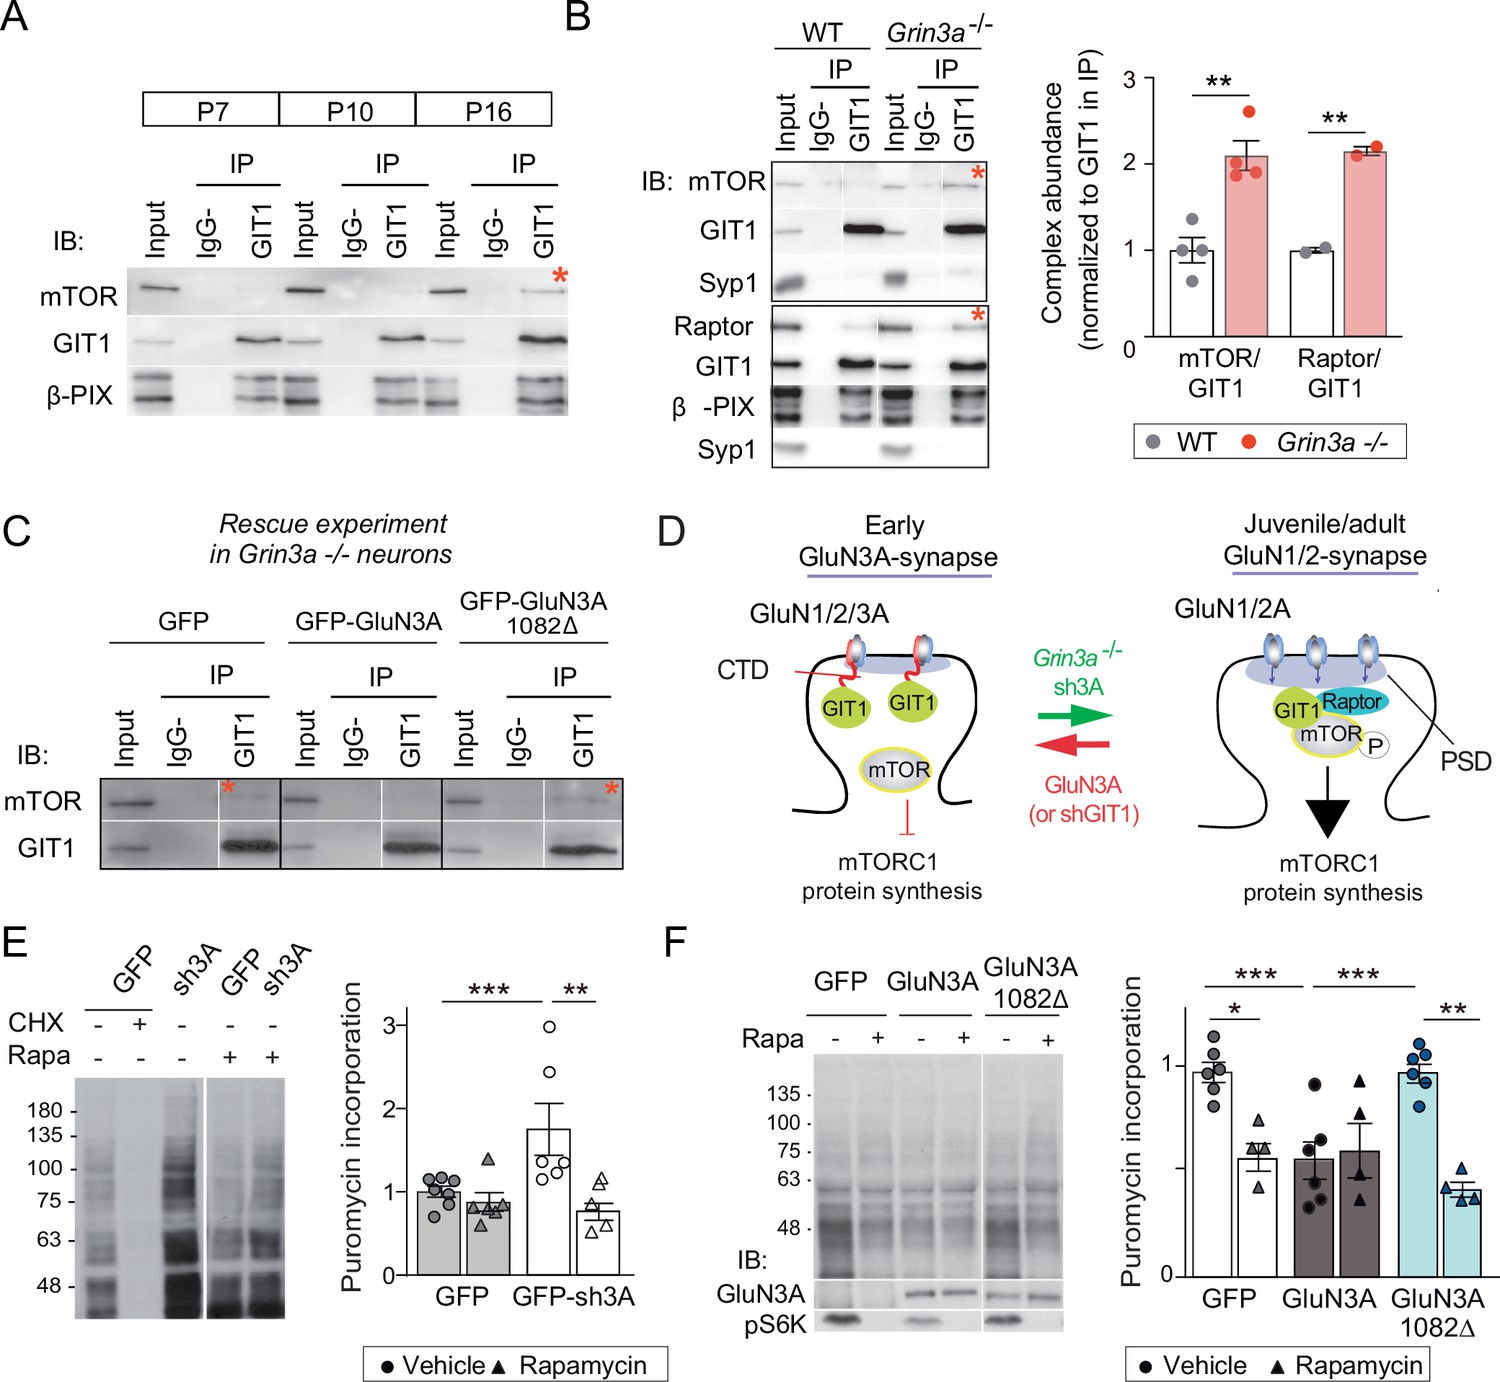
GluN3A/GIT1 interactions control the age-dependent onset of mTORC1-dependent protein synthesis.
(A) Hippocampi from P7, P10, and P16 wild-type mice were lysed, immunoprecipitated with GIT1 antibody and probed for the indicated antibodies. Input: 10 % of the lysate used for immunoprecipitation. IgG−: negative control without antibody. Red asterisks here and other panels indicate mechanistic target of rapamycin (mTOR)- and Raptor bound to GIT1. (B) GIT1/mTORC1 complex formation is enhanced in P10 Grin3a−/− hippocampus. Representative blots of GIT1 immunoprecipitates and quantifications are shown (n = 2–4 mice; **p < 0.01 unpaired t-test). Bound mTOR and Raptor are normalized to immunoprecipitated GIT1. Syp1: synaptophysin 1. (C) Grin3a−/− cortical neurons infected with GFP, GFP-GluN3A, or GFP-GluN3A1082Δ were solubilized and GIT1 immunoprecipitates blotted as indicated (IB). (D) GIT1/GluN3A control mTORC1 translation. Left: at early postnatal stages, immature synapses express GluN3A-NMDARs, which bind the postsynaptic scaffold GIT1 via their C-terminal tail preventing the nucleation of GIT1/mTORC1 and the mTORC1-mediated synthesis of plasticity proteins. Right: at juvenile/adult stages, GluN3A downregulation enables GIT1/mTOR/Raptor complex assembly and primes synapses for mTORC1 translation of mRNAs involved in synapse and memory consolidation. The genetic manipulations shown here to alter the age-dependent switch from mTORC1-independent to mTORC1-dependent modes of translation are indicated. Note that GluN3A expression is retained by subsets of synapses in adult brains and might play roles in selecting synapses that will be recruited to stably encode memory traces (see Discussion). (E) Mouse cortical neurons were infected with lentiviruses expressing GFP or GFP-sh3A on days in vitro (DIV) 3 and protein synthesis analyzed at DIV7–9. Representative blots and quantification of puromycin incorporation in infected neurons treated with rapamycin (100 nM), cycloheximide (CHX, 25 μM), or vehicle. (F) Grin3a−/− cortical neurons were infected with GFP, GFP-GluN3A, or GFP-GluN3A1082∆ lentiviruses, and protein synthesis analyzed at DIV12. GluN3A expression and mTOR activation were monitored with the indicated antibodies (IB). In panels D–E, n = 4–7 from three to four independent cultures (*p < 0.05, **p < 0.01, ***p < 0.001, two-way analysis of variance [ANOVA] followed by Tukey’s test).
-
Figure 6—source data 1
Coimmunoprecipitation of GIT1 and mechanistic target of rapamycin (mTOR) in lysates from P7, P10, and P16 mouse hippocampus.
- https://cdn.elifesciences.org/articles/71575/elife-71575-fig6-data1-v1.zip
-
Figure 6—source data 2
Coimmunoprecipitation of GIT1 with mechanistic target of rapamycin (mTOR) and Raptor in hippocampal lysates from P10 wild-type and Grin3a−/− mice.
- https://cdn.elifesciences.org/articles/71575/elife-71575-fig6-data2-v1.zip
-
Figure 6—source data 3
Coimmunoprecipitation of GIT1 with mechanistic target of rapamycin (mTOR) in Grin3a−/− cortical neurons infected with GFP, GFP-GluN3A, and GFP-GluN3A1082Δ lentiviruses.
- https://cdn.elifesciences.org/articles/71575/elife-71575-fig6-data3-v1.zip
-
Figure 6—source data 4
Western blots of puromycin incorporation in neurons infected with control or sh3A-expressing lentiviruses.
- https://cdn.elifesciences.org/articles/71575/elife-71575-fig6-data4-v1.zip
-
Figure 6—source data 5
Western blots of puromycin incorporation in the presence or absence of rapamycin in Grin3a−/− cortical neurons infected with GFP, GFP-GluN3A, and GFP-GluN3A1082Δ.
- https://cdn.elifesciences.org/articles/71575/elife-71575-fig6-data5-v1.zip
Figure 6—figure supplement 1

Postnatal regulation of GIT1/mTORC1 complexes in mouse somatosensory cortex.
Somatosensory cortices from P7, P10, and P16 wild-type mice were lysed, immunoprecipitated with GIT1 antibody and probed for the indicated antibodies. Input: 10 % of the lysate used for immunoprecipitation. IgG− refers to a negative control without antibody. Red asterisk indicates mechanistic target of rapamycin (mTOR)-bound GIT1.
-
Figure 6—figure supplement 1—source data 1
Annotated western blots and original scans.
- https://cdn.elifesciences.org/articles/71575/elife-71575-fig6-figsupp1-data1-v1.zip
Figure 6—figure supplement 2

Age-dependent emergence of mTORC1-dependent protein synthesis in cultured rat cortical neurons.
Representative blots and quantification of puromycin incorporation in the presence or absence of 100 nM rapamycin in wild-type days in vitro (DIV) 7 and DIV14 neurons. Puromycin levels were normalized to Ponceau S staining (n = 6–8 samples from three to four independent cultures; **p < 0.01, followed by Tukey’s test).
-
Figure 6—figure supplement 2—source data 1
Annotated western blots and original scans.
- https://cdn.elifesciences.org/articles/71575/elife-71575-fig6-figsupp2-data1-v1.zip
Figure 7 with 2 supplements
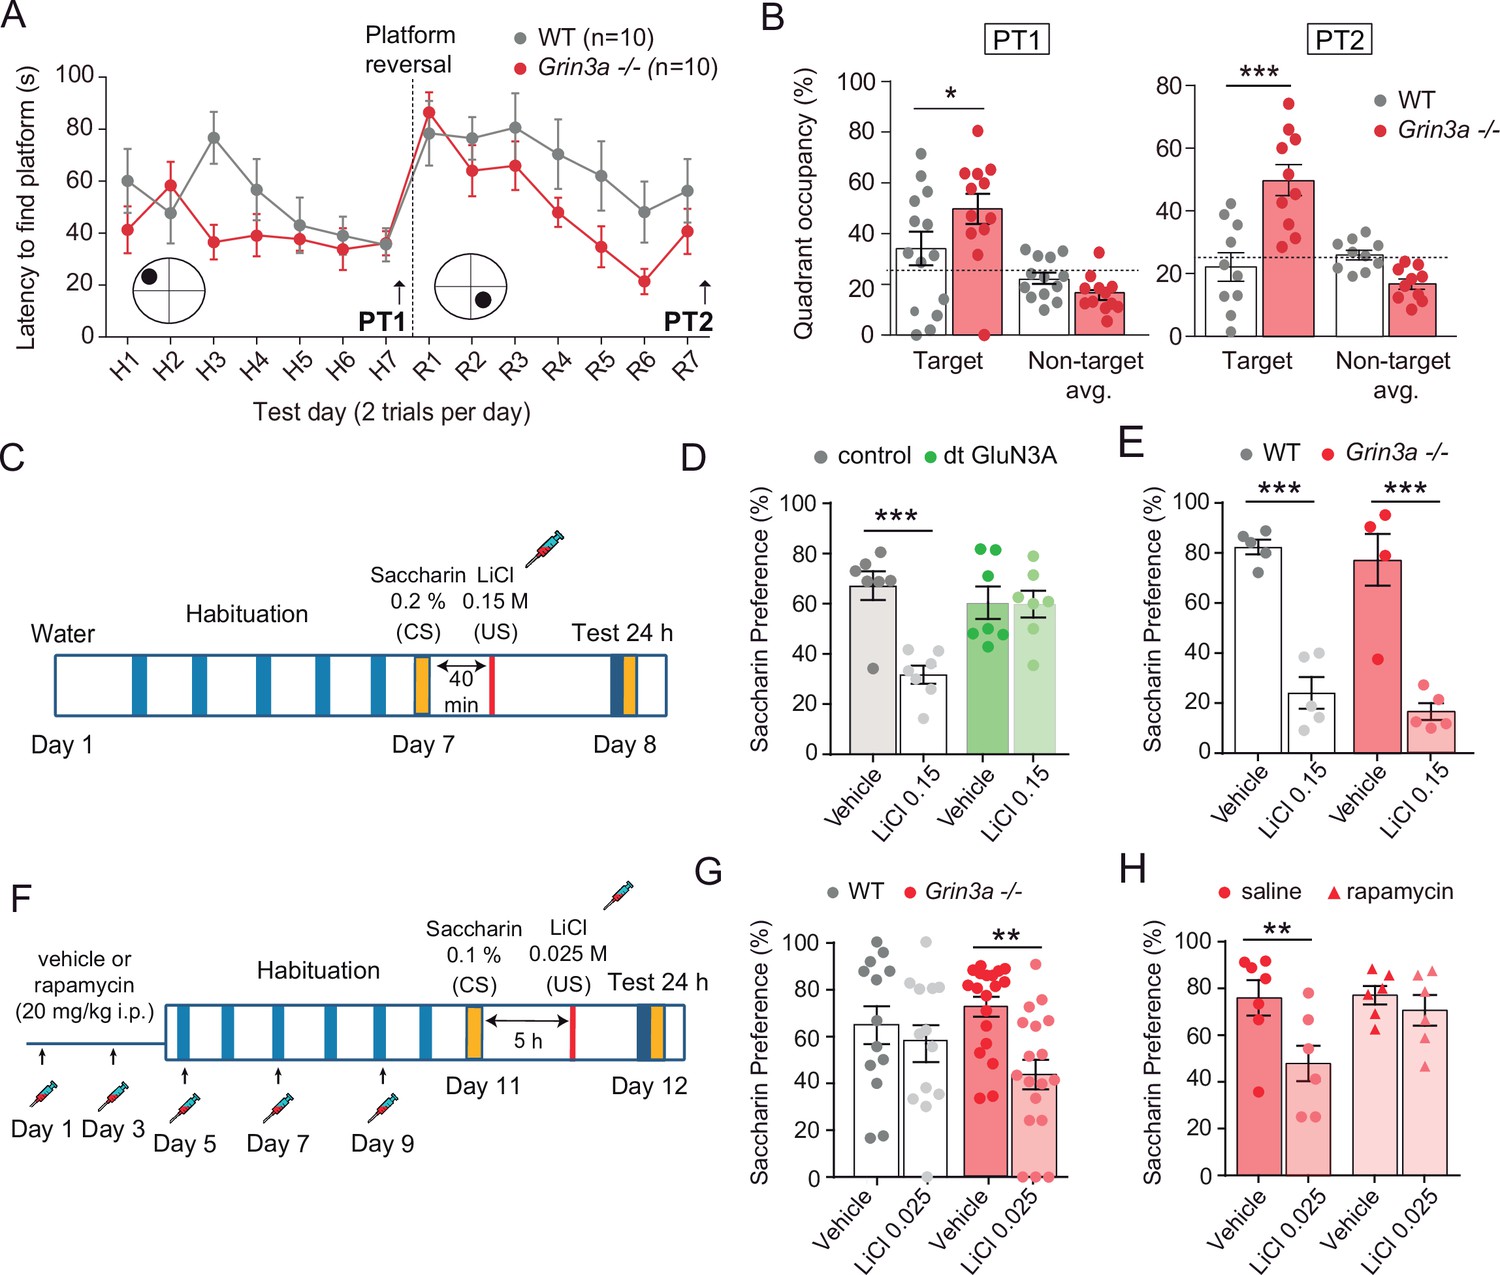
GluN3A deletion facilitates spatial and associative learning.
(A) Escape latencies of male wild-type (WT) and Grin3a−/− mice on a weak version of the Morris water maze (two trials per day) during 7-day training and after platform reversal on day 8. (B) Probe trials performed 24 hr after day 7 (PT1), or 24 hr after reversal training (PT2) (n = 10–13 mice per genotype; two-way analysis of variance [ANOVA] with Bonferroni post hoc test, *p < 0.05, ***p < 0.0001). (C) Conditioned taste aversion (CTA) paradigm. (D) Saccharin preference of control and double transgenic (dt) GluN3A mice, and (E) WT and Grin3a−/− mice after vehicle or LiCl injection (n = 5–7 mice per group; ***p < 0.001, two-way ANOVA followed by Bonferroni post hoc test). (F–H) Weak CTA paradigm and rapamycin treatment regime. Decreased saccharin preference of Grin3a−/− mice on the weak CTA (G) was reversed by rapamycin (H) (**p < 0.01, two-way ANOVA followed by Bonferroni post hoc test).
Figure 7—figure supplement 1

Behavior of male and female Grin3a−/− mice in the Morris water maze.
(A) Escape latencies of male wild-type (WT) and Grin3a−/− mice over the time-course of training on a standard hidden platform version of the Morris water maze (7 days, four trials per day). (B) Escape latencies of female Grin3a−/− and WT mice over the course of training (two trials per day). (C) On probe trials for memory acquisition performed 24 hr after day 7 (PT1), both groups showed similar preference for the target quadrant (n = 11–13 mice per group). Dashed lines indicate chance levels (25%). (D) Left, on the probe test performed 24 hr after day 7 (PT1), female Grin3a−/− mice showed enhanced preference for the target quadrant relative to WT (n = 11–13 mice per group; two-way analysis of variance [ANOVA] with Bonferroni post hoc test; p = 0.0062). Right, on probe tests 24 hr after completion of reversal training (PT2), female Grin3a−/− showed significant preference for the target quadrant (n = 11–13 mice per genotype; two-way ANOVA with Bonferroni post hoc test, **p<0.01, ***p < 0.0001). (E) WT and Grin3a−/− mice showed no differences in times to reach a visible platform. (F) Swimming speed over the training period. Data plotted correspond to the experiment shown in Figure 7C. (G) Alternation index of wild-type (WT) and Grin3a−/− mice in the Y-maze (n = 9–10 mice per genotype).
Figure 7—figure supplement 2
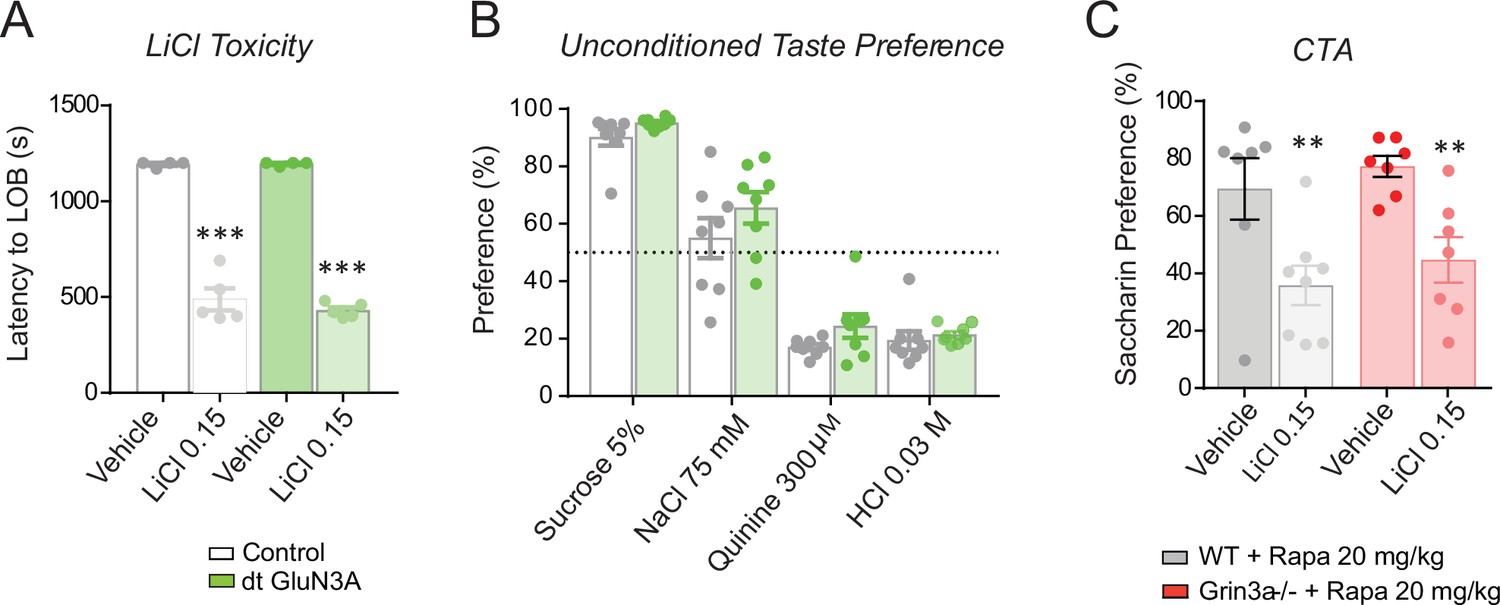
Controls for conditioned taste aversion (CTA) experiments.
(A) Double transgenic GluN3A (dtGluN3A) and wild-type (WT) mice showed similar ‘lying on belly’ latencies after a 0.15 M LiCl injection (n = 4–5 mice per group; unpaired two-tailed t-test, ***p < 0.001). (B) dt-GluN3A and control mice showed similar taste preferences (n = 8 mice per group). (C) The rapamycin treatment regime used does not impair the formation of ‘standard’ CTA memory in WT nor Grin3a−/− mice (n = 6–8 mice per group; two-way analysis of variance [ANOVA] with Bonferroni post hoc test, **p < 0.01).
Figure 8 with 1 supplement
GluN3A deletion from excitatory neurons in adult mice is sufficient for memory enhancement.
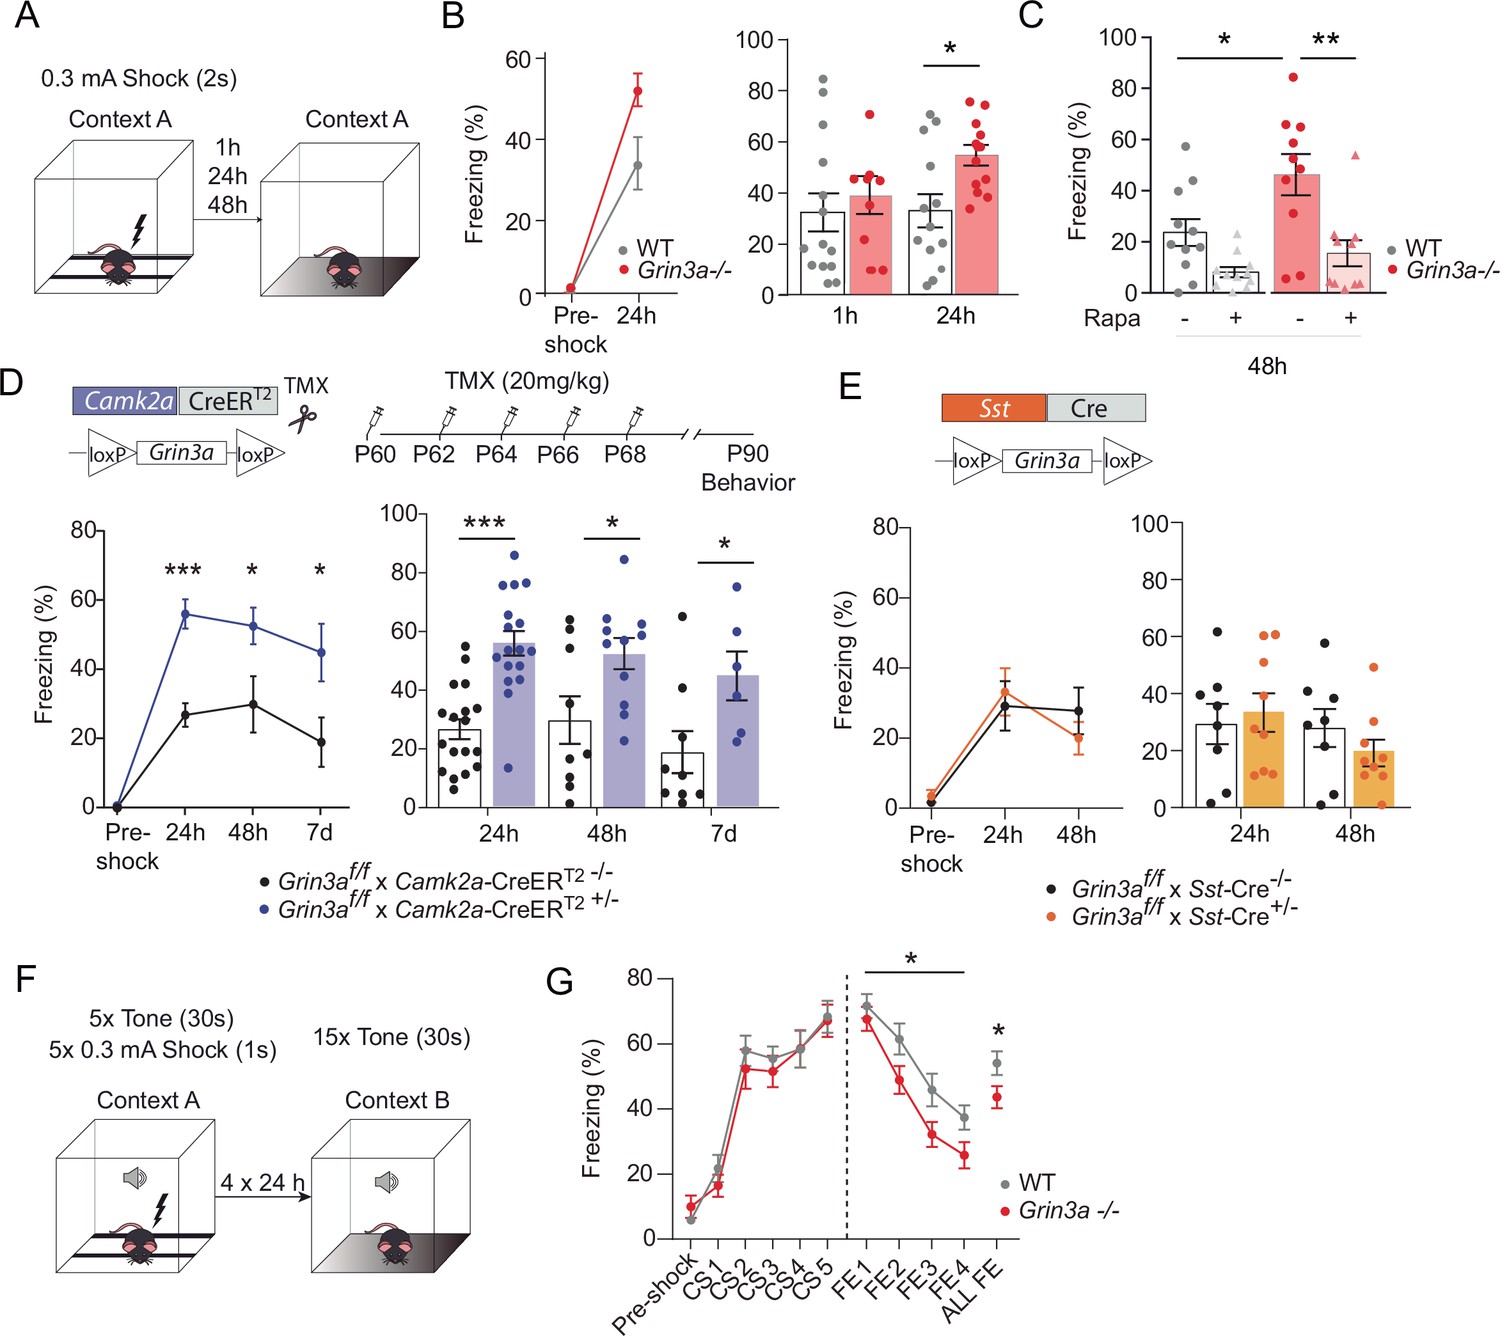
(A) Contextual fear conditioning test. (B) Enhanced contextual fear conditioning in Grin3a−/− mice 24 hr but not 1 hr after training (n = 9–13 mice per group; left: repeated measures two-way analysis of variance [ANOVA] with Bonferroni post hoc test, p = 0.004; right: two-tailed unpaired t-test, *p < 0.05). (C) Enhanced contextual fear conditioning in Grin3a−/− mice at 48 hr is reversed by rapamycin (2 × 20 mg/kg i.p., 24 hr apart, prior to training) (n = 10–11 mice per group; *p < 0.05; **p < 0.01, two-way ANOVA with Bonferroni post hoc test). (D, E) Conditional deletion of GluN3A from adult excitatory neurons, but not somatostatin (Sst) interneurons, enhances long-term contextual fear memory. The regime for tamoxifen (TMX) injection is indicated (*p < 0.05: ***p < 0.001 two-tailed unpaired t-test). (F, G) Cued-fear extinction in Grin3a−/− and wild-type littermates over a four-day fear extinction paradigm (n = 14–13 mice per group; *p = 0.0461 between-subjects effect, repeated measures ANOVA). Freezing levels were not different between phenotypes in FE1 (t(25) = 0.760, p = 0.455).
Figure 8—figure supplement 1

Expression of GluN3A and other synaptic proteins in conditional Grin3a knockout mice.
(A) Top, tamoxifen (TMX) administration regime to Grin3af/f × CamK2a-CreERT2 mice. Hippocampal lysates of P90 mice were analyzed by sodium dodecyl sulfate polyacrylamide gel electrophoresis (SDS–PAGE) and immunoblotted for the indicated proteins (n = 4–8 mice per group; unpaired two-tailed t-test, ***p < 0.0001). (B) Immunoblot analysis of hippocampal lysates of P90 Grin3af/f × Som-Cre mice (n = 4–10 mice per group; unpaired two-tailed t-test, **p < 0.01). Note that conditional deletion of Grin3a decreases GluN3A expression without affecting other synaptic proteins.
-
Figure 8—figure supplement 1—source data 1
Annotated western blots and original scans.
- https://cdn.elifesciences.org/articles/71575/elife-71575-fig8-figsupp1-data1-v1.zip
-
Figure 8—figure supplement 1—source data 2
Annotated western blots and original scans.
- https://cdn.elifesciences.org/articles/71575/elife-71575-fig8-figsupp1-data2-v1.zip
Tables
Key resources table
| Reagent type (species) or resource | Designation | Source or reference | Identifiers | Additional information |
|---|---|---|---|---|
| Antibody | GIT-1 (mouse monoclonal, clone A-1) | Santa Cruz Biotechnology | Cat# sc-365084; RRID: AB_10850059 | PLA 1:150 |
| Antibody | Arc (mouse monoclonal, clone C-7) | Santa Cruz Biotechnology | Cat# sc-17839; RRID: AB_626696 | WB 1:100 |
| Antibody | beta-Tubulin III (mouse monoclonal) | Sigma-Aldrich | Cat# T8660; RRID: AB_477590 | WB 1:20,000 |
| Antibody | NMDAR1, all splice variants (mouse monoclonal, clone R1JHL) | Millipore | Cat# MAB1586; RRID: AB_11213180 | WB 1:1000 |
| Antibody | NR2B (mouse monoclonal, clone BWJHL) | Millipore | Cat# 05–920; RRID: AB_417391 | WB 1:1000 |
| Antibody | NR3A (mouse monoclonal) | Kindly provided by Jim Trimmer | N/A | WB 1:100 |
| Antibody | PSD-95 (mouse monoclonal, clone K28/43) | Antibodies Incorporated | Cat# 75–028RRID: AB_10698024 | WB 1:1000 |
| Antibody | Puromycin (mouse monoclonal, clone 12D10) | Millipore | Cat# MABE343; RRID: AB_2566826 | WB 1:2000 |
| Antibody | Synapsin I (mouse monoclonal, clone 46.1) | Synaptic Systems | Cat# 106 011RRID: AB_2619772 | WB 1:5000 |
| Antibody | Synaptophysin (mouse monoclonal, clone SY38) | Millipore | Cat# MAB5258-20UG; RRID: AB_11214133 | WB 1:2000 |
| Antibody | CREB (rabbit monoclonal, clone 48H2) | Cell Signaling Technology | Cat# 9197; RRID: AB_331277 | WB 1:1000 |
| Antibody | NR2A (rabbit monoclonal, clone A12W) | Millipore | Cat# 05–901 R; RRID: AB_10805961 | WB 1:1000 |
| Antibody | Phospho-CamKinase II alpha (CaMKIIα) Thr286 (rabbit monoclonal, clone D21E4) | Cell Signaling Technology | Cat# 12716; RRID: AB_2713889 | WB 1:1000 |
| Antibody | Phospho-p70 S6 kinase Thr389 (rabbit monoclonal, clone 108D2) | Cell Signaling Technology | Cat# 9234; RRID: AB_2269803 | WB 1:1000 |
| Antibody | Raptor (rabbit monoclonal, clone 24C12) | Cell Signaling Technology | Cat# 2280; RRID: AB_561245 | WB 1:1000 |
| Antibody | Rheb (rabbit monoclonal, clone E1G1R) | Cell Signaling Technology | Cat# 13879; RRID: AB_2721022 | WB 1:1000 |
| Antibody | Rictor (rabbit monoclonal, clone 53A2) | Cell Signaling Technology | Cat# 2114; RRID: AB_2179963 | WB 1:500 |
| Antibody | S6 ribosomal protein (rabbit monoclonal, clone 5G10) | Cell Signaling Technology | Cat# 2217; RRID: AB_331355 | WB 1:1000 |
| Antibody | GIT1 (rabbit polyclonal) | Cell Signaling Technology | Cat# 2919; RRID: AB_2109982 | IP 1:200, WB 1:1000 |
| Antibody | Egr-1/Zif268 (rabbit polyclonal) | Santa Cruz Biotechnology | Cat# sc-110; RRID: AB_2097174 | WB 1:500 |
| Antibody | beta-Pix, SH3 domain (rabbit polyclonal) | Millipore | Cat# 07–1450; RRID: AB_1586904 | WB 1:1000 |
| Antibody | c-Fos (rabbit polyclonal) | Santa Cruz Biotechnology | Cat# sc-52; RRID: AB_2106783 | WB 1:500 |
| Antibody | CaMKIIα (rabbit polyclonal) | Sigma-Aldrich | Cat# C6974; RRID: AB_258984 | WB 1:1000 |
| Antibody | mTOR (rabbit polyclonal) | Cell Signaling Technology | Cat# 2972; RRID: AB_330978 | IP 1:100, PLA 1:150, WB 1:1000 |
| Antibody | NMDAR2A&B, pan antibody (rabbit polyclonal) | Millipore | Cat# AB1548; RRID: AB_11212156 | WB 1:1000 |
| Antibody | NR3A (rabbit polyclonal) | Millipore | Cat# 07–356; RRID: AB_2112620 | WB 1:1000 |
| Antibody | p30alpha (rabbit polyclonal) | Santa Cruz Biotechnology | Cat# sc-535; RRID: AB_632138 | WB 1:1000 |
| Antibody | p44/42 MAPK (Erk1/2) (rabbit polyclonal) | Cell Signaling Technology | Cat# 9102; RRID: AB_330744 | WB 1:1000 |
| Antibody | p70 S6 kinase (rabbit polyclonal) | Cell Signaling Technology | Cat# 9202; RRID: AB_331676 | WB 1:1000 |
| Antibody | Phospho-CREB Ser133 (rabbit polyclonal) | Millipore | Cat# 06–519; RRID: AB_310153 | WB 1:1000 |
| Antibody | Phospho-mTOR Ser2448 (rabbit polyclonal) | Cell Signaling Technology | Cat# 2971; RRID: AB_330970 | WB 1:1000 |
| Antibody | Phospho-p38 MAPK Thr180/Tyr182 (rabbit polyclonal) | Cell Signaling Technology | Cat# 9911; RRID: AB_10695905 | WB 1:1000 |
| Antibody | Phospho-p44/42 MAPK (Erk1/2) Thr202/Tyr204 (rabbit polyclonal) | Cell Signaling Technology | Cat# 9101; RRID: AB_331646 | WB 1:1000 |
| Antibody | Phospho-S6 ribosomal protein Ser240/244 (rabbit polyclonal) | Cell Signaling Technology | Cat# 2215; RRID: AB_331682 | WB 1:1000 |
| Cell line (Homo sapiens) | HEK293 | ATCC | Cat# CRL-1573; RRID: CVCL_0045 | |
| Chemical compound, drug | (−)-Bicuculline methiodide | Abcam | Cat# Ab120108; CAS: 55950-07-7 | |
| Chemical compound, drug | (D,L)-APV sodium salt | Tocris | Cat# 3693; CAS: 1303993-72-7 | |
| Chemical compound, drug | Anisomycin | Sigma-Aldrich | Cat# A5892; CAS: 22862-76-6 | |
| Chemical compound, drug | B27 supplement | Thermo Fisher Scientific | Cat# 17504044 | |
| Chemical compound, drug | BDNF | PeproTech | Cat# 450-02; AN: P23560 | |
| Chemical compound, drug | CGP-78608 | Tocris | Cat# 1493; CAS: 1135278-54-4 | |
| Chemical compound, drug | cOmplete Protease Inhibitor Cocktail | Sigma-Aldrich | Cat# 04693116001 | |
| Chemical compound, drug | Cycloheximide | Sigma-Aldrich | Cat# C7698; CAS: 66-81-9 | |
| Chemical compound, drug | MK-801 | Tocris | Cat# 0924; CAS: 77086-22-7 | |
| Chemical compound, drug | Puromycin dihydrochloride | Sigma-Aldrich | Cat# P8833; CAS: 58-58-2 | |
| Chemical compound, drug | Rapamycin | Alfa Aesar | Cat# J62473; CAS: 53123-88-9 | |
| Chemical compound, drug | Tamoxifen | Sigma-Aldrich | Cat# T5648 | |
| Chemical compound, drug | Tetrodotoxin citrate | Alomone Labs | Cat# T-550; CAS: 18660-81-6 | |
| Commercial assay, kit | Duolink In Situ Red Starter Kit Mouse/Rabbit | Sigma-Aldrich | Cat# DUO92101 | |
| Commercial assay, kit | MasterMix qPCR ROx PyroTaq EvaGreen | cmb | Cat# 87H24 | |
| Commercial assay, kit | Nucleospin RNA | Macherey-Nagel | Cat# 740955.50 | |
| Commercial assay, kit | Pierce BCA Protein Assay kit | Thermo Fisher Scientific | Cat# 23,227 | |
| Commercial assay, kit | SuperScript IV First-Strand cDNA Synthesis System | Invitrogen | Cat# 18-091-050 | |
| Genetic reagent (Mus musculus) | Mouse: B6;129 × 1-Grin3atm1Nnk/J | The Jackson Laboratory | Cat# JAX:029974; RRID: IMSR_JAX:029974 | |
| Genetic reagent (Mus musculus) | Mouse: CaMKIIα-CreERT2+/- | Erdmann et al., 2007 | ||
| Genetic reagent (Mus musculus) | Mouse: Grin3atm1a(EUCOMM)Hmgu/H | EUCOMM | | |
| Genetic reagent (Mus musculus) | Mouse: Sst-IRES-Cre | The Jackson Laboratory | Stock: 018973 | |
| Genetic reagent (virus) | LV-hSYN-WPRE-hSYN-GFP-WPRE | Gascón et al., 2008 | ||
| Genetic reagent (virus) | LV-hSYN-GluN3A-WPRE-hSYN-GFP-WPRE | This paper | See Materials and methods; generated/stored in Perez-Otano’s lab. | |
| Genetic reagent (virus) | LV-hSYN-GluN3A1082Δ-WPRE-hSYN-GFP-WPRE | This paper | See Materials and methods; generated/stored in Perez-Otano’s lab. | |
| Genetic reagent (virus) | pLentiLox3.7-GFP (pLL3.7-GFP) | Kindly provided by Dr. Michael Ehlers | Addgene plasmid #11795; RRID: Addgene_11795 | |
| Genetic reagent (virus) | pLL3.7-shGluN3A1185-GFP (Target sequence: CTACAGCTGAGTTTAGAAA) | Yuan et al., 2013 | ||
| Genetic reagent (virus) | pLL3.7-shGIT1-GFP (Target sequence: TGATCACAAGAATGGGCATTA) | This paper | See Materials and methods; generated/stored in Perez-Otano’s lab. | |
| Recombinant DNA reagent (plasmid) | pcDNA1-Amp-GluN1-1A | Perez-Otano et al., 2001 | ||
| Recombinant DNA reagent (plasmid) | pcDNA1-Amp-GluN2A | Perez-Otano et al., 2001 | ||
| Recombinant DNA reagent (plasmid) | pCIneo-GFPGluN3A | Perez-Otano et al., 2001 | ||
| Recombinant DNA reagent (plasmid) | pCIneo-GFPGluN3A1082Δ | This paper | See Materials and methods; generated/stored in Perez-Otano’s lab. | |
| Recombinant DNA reagent (plasmid) | pRK5-GFP | Kindly provided by Dr. Michael Ehlers | ||
| Sequence-based reagent (oligonucleotide) | Arc_fwd (mouse) | This paper | GAGCCTACAGAGCCAGGAGA | |
| Sequence-based reagent (oligonucleotide) | Arc_rv (mouse) | This paper | TGCCTTGAAAGTGTCTTGGA | |
| Sequence-based reagent (oligonucleotide) | c-Fos_fwd (mouse/rat) | Chen et al., 2020 | CTGCTCTACTTTGCCCCTTCT | |
| Sequence-based reagent (oligonucleotide) | c-Fos_rv (mouse/rat) | Chen et al., 2020; | TTTATCCCCACGGTGACAGC | |
| Sequence-based reagent (oligonucleotide) | GAPDH_fwd (mouse/rat) | This paper | CATGGCCTTCCGTGTTCCT | |
| Sequence-based reagent (oligonucleotide) | GAPDH_rv (mouse/ rat) | This paper | TGATGTCATCATACTTGGCAGGTT | |
| Software, algorithm | ImageJ | Schneider, Rasband and Eliceiri, 2012 | https://imagej.nih.gov/ij/ | |
| Software, algorithm | ImageQuant software version 5.2 | GE Healthcare | ||
| Software, algorithm | Prism software version 7.00 | Graphpad | ||
| Software, algorithm | QuantStudio 3 Design and Analysis software v1.5.1 | Thermo Fisher Scientific | ||
| Software, algorithm | SMART software for video-tracking | PanLab S.L. |
Additional files
Download links
A two-part list of links to download the article, or parts of the article, in various formats.
Downloads (link to download the article as PDF)
Open citations (links to open the citations from this article in various online reference manager services)
Cite this article (links to download the citations from this article in formats compatible with various reference manager tools)
Control of protein synthesis and memory by GluN3A-NMDA receptors through inhibition of GIT1/mTORC1 assembly
eLife 10:e71575.
https://doi.org/10.7554/eLife.71575


