Generation of functional hepatocytes by forward programming with nuclear receptors
- Wellcome-MRC Cambridge Stem Cell Institute, University of Cambridge, United Kingdom
- Department of Surgery, University of Cambridge and NIHR Cambridge Biomedical Research Centre, United Kingdom
- Wellcome Sanger Institute, Wellcome Genome Campus, United Kingdom
Figures
Figure 1 with 2 supplements

Forward programming of human pluripotent stem cells (hPSCs) into hepatocytes with four and three liver-enriched transcription factors (LETFs).
(A) Schematic representation of the two sequentially targeted loci. The human ROSA26 was targeted with a constitutively expressed reverse tetracycline transactivator (rtTA). The AAVS1 locus was targeted with the four LETFs HNF1A, HNF6, FOXA3, and HNF4A downstream of a TET-responsive element (TET). (B) mRNA induction levels of the four factors in targeted human embryonic stem cells (hESCs) (Targ) relative to untargeted (Untarg) hESCs stimulated with doxycycline (dox) for 24 hr (n=3). Data is shown relative to the untargeted control. (C) Immunofluorescence staining of the four LETFs in targeted and untargeted hESCs after 24 hr of inducible overexpression (iOX) with dox confirming transgene induction. Nuclei were counterstained with DAPI (blue). Scale bar, 200µm. (D) Schematic representation of the iOX culture conditions for forward programming. Phase contrast images of hESCs targeted with the four LETFs after 10 and 15 days of forward programming. Scale bar, 200µm. (E) mRNA levels of hepatocyte markers (ALB, SERPINA1, and AFP) in hESCs targeted with the four LETFs after 10 and 15 days of forward programming. Untargeted hESCs treated with the same protocol as in (D) were used as control (n=4). Statistical difference was calculated with unpaired t-test against untargeted. (F) CYP3A4 activity levels normalised per cell number (millions) in untargeted and targeted hESCs with the four LETFs after 15 days of forward programming (n=5) . Statistical difference between targeted and untargeted cells was calculated with unpaired t-test. (G,H,I) mRNA levels of hepatocyte markers (ALB, SERPINA1, and AFP) in hESCs targeted with the four LETFs and with combinations of three LETFs (n=4). The factor removed from each construct is indicated. Expression levels were determined after 10, 15, 20, and 25 days of forward programming. Statistical differences were calculated with one-way ANOVA, corrected for multiple comparisons compared to four LETFs. All mRNA levels were normalised to the average of two housekeeping genes (PBGD and RPLP0). (J) CYP3A4 activity levels normalised per cell number (millions) in hESCs targeted with the four LETFs and combinations of three LETFs after 10, 15, 20, and 25 days of forward programming (n=3–5). Statistical differences were calculated with one-way ANOVA, corrected for multiple comparisons compared to four LETFs. In all plots, bars represent mean with SD, and individual datapoints are shown for all biological replicates. Hepatocyte-like cells (HLCs) generated by direct differentiation and primary human hepatocytes (PHHs) where plotted as controls for all CYP3A4 activity and expression data. Significant p-values are shown at each comparison and indicated as *p<0.05, **p<0.01, ***p<0.001, ****p<0.0001.
-
Figure 1—source data 1
Individual measurements and statistical tests related to Figure 1.
- https://cdn.elifesciences.org/articles/71591/elife-71591-fig1-data1-v1.xlsx
Figure 1—figure supplement 1
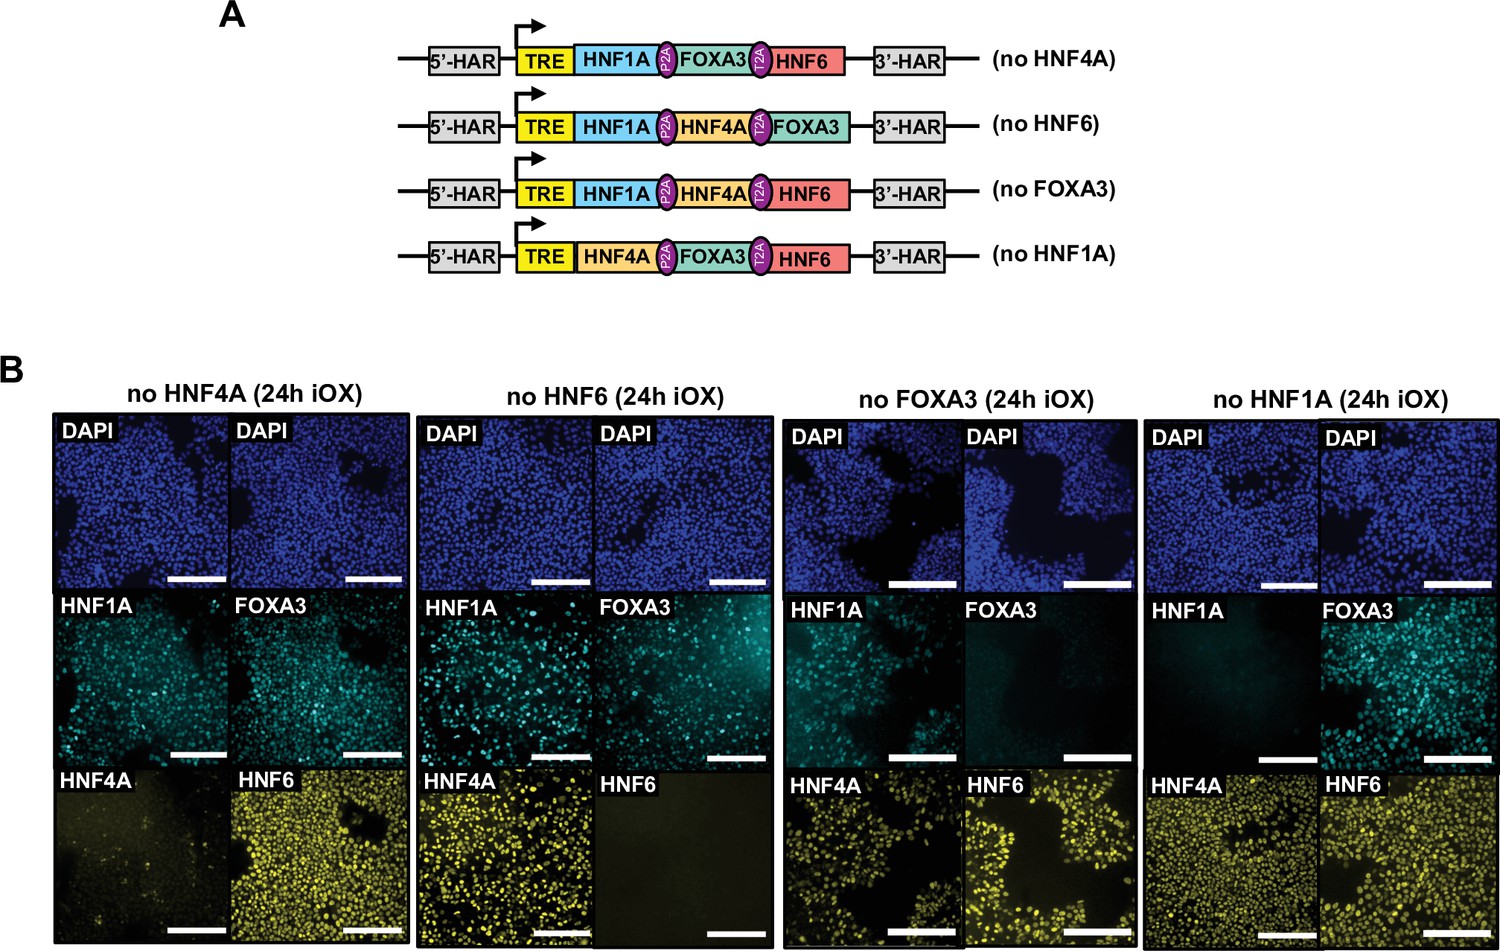
Validation of inducible overexpression (iOX).
(A) Schematic representation of the combinations of three liver-enriched transcription factors (LETFs) cloned into the AAVS1 safe harbour. (B) Immunofluorescence staining of all four LETFs in human embryonic stem cells (hESCs) targeted with the constructs shown in (A) after 24 hr of iOX with doxycycline (dox) confirming transgene induction. Nuclei were counterstained with DAPI (blue). Scale bars, 200 µm.
Figure 1—figure supplement 2
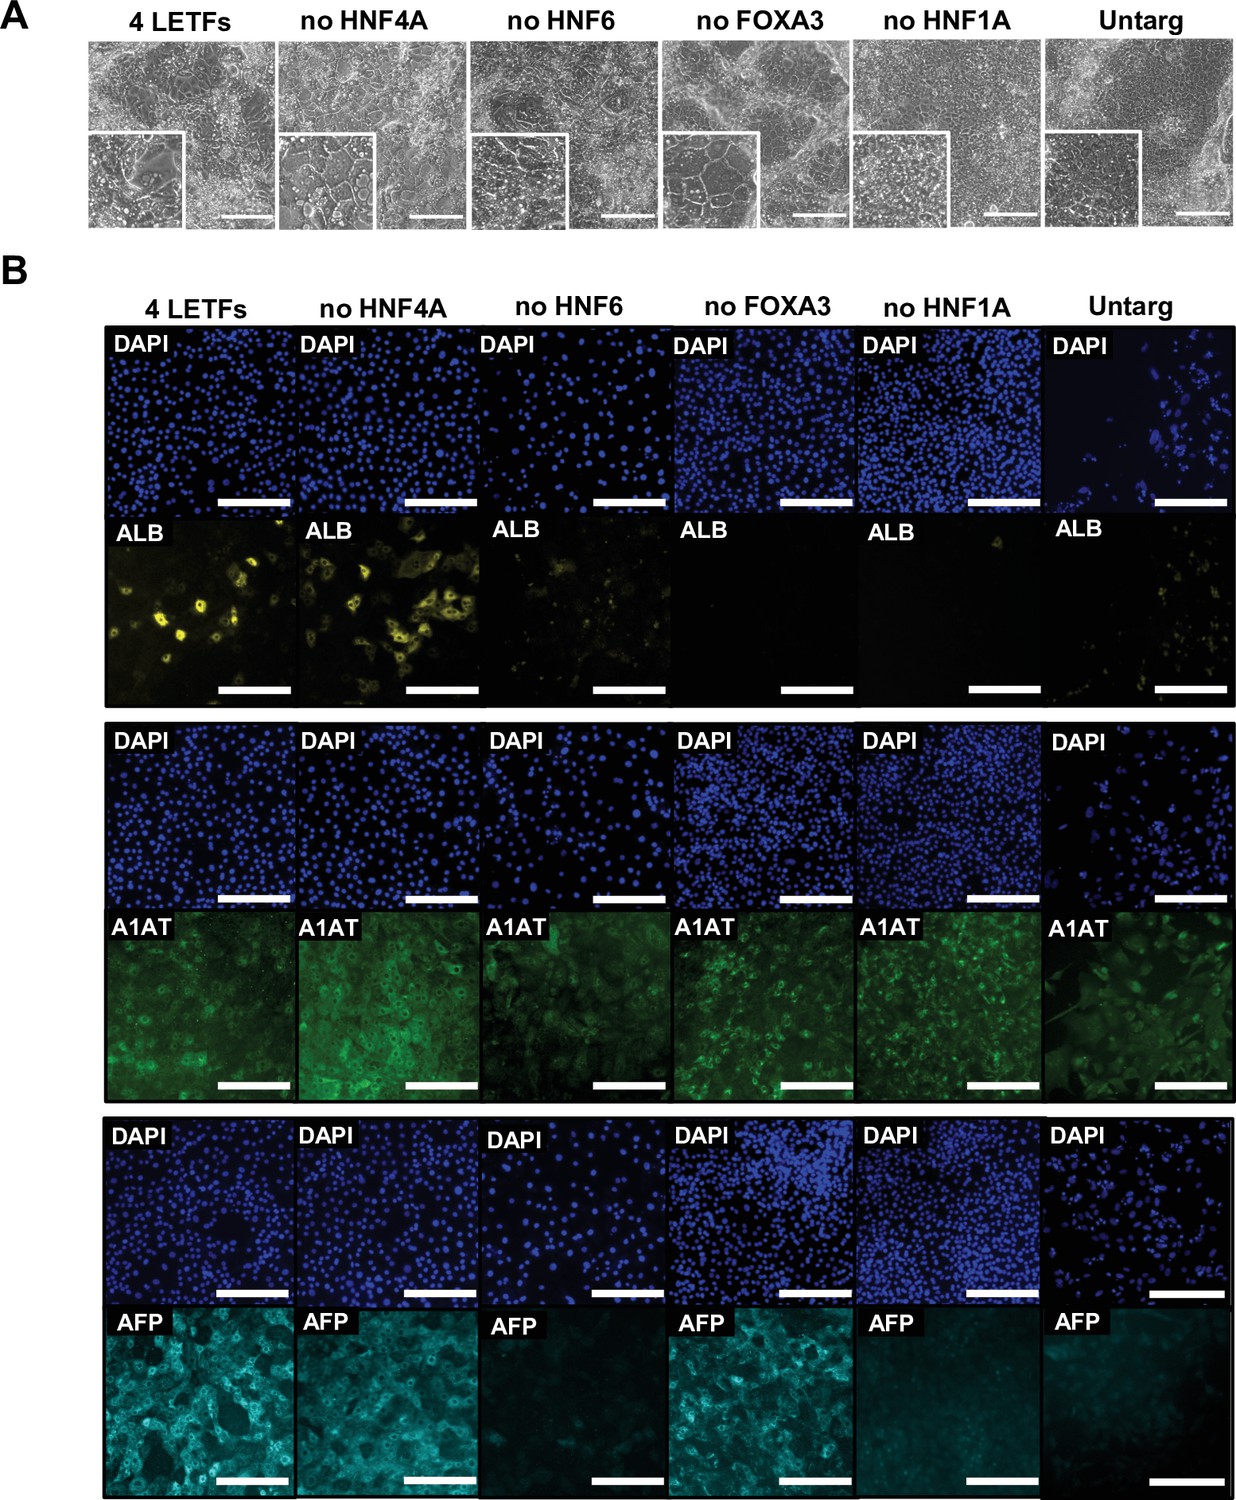
Characterisation of the phenotype of human pluripotent stem cells (hPSCs) forward programmed into hepatocytes with three liver-enriched transcription factors (LETFs).
(A) Phase contrast images and (B) immunofluorescence staining of hepatocyte markers Albumin (yellow), A1AT (green), and AFP (cyan) in human embryonic stem cells (hESCs) forward programmed with either four or three LETFs for 20 days. Untargeted hESCs treated with the same protocol for 20 days were used as control. Nuclei were counterstained with DAPI (blue). Scale bar, 200 µm.
Figure 2 with 1 supplement

Hepatocyte-like cells (HLCs) and primary human hepatocytes (PHHs) display transcriptomic differences associated with their state of maturation.
(A) Immunofluorescence staining of Albumin (yellow) and HNF4A (red) in HLCs differentiated for 30 days. Nuclei were counterstained with DAPI (blue). Scale bar, 100 µm. (B) CYP3A4 activity levels normalised per cell number (millions) in HLCs differentiated for 30 days (n=6) and PHHs (n=4). Bars represent mean with SD, and individual datapoints represent the different biological replicates. Statistical difference was calculated with unpaired t-test. (C) Principal component analysis (PCA) of undifferentiated human induced pluripotent stem cells (hiPSCs), HLCs derived from human embryonic stem cell (hESC) (hESC_HLCs) and hiPSC (hiPSC_HLCs), freshly harvested PHHs (fPHHs), or plated PHHs (pPHHs). (D) Heatmap showing the proportion of genes differentially expressed in each cell type (cluster 1 – PHHs, cluster 2 – HLCs, cluster 4 – hiPSCs) as well as in Heps (HLCs and PHHs) against undifferentiated hiPSCs (cluster 3). (E, F) Dotplot showing the top 15 hits on gene ontology enrichment analysis on genes associated to cluster 1 and cluster 3 as shown in (D). The size of each dot represents number of genes associated to each term and the colours represents the adjusted p-value. (G) Heatmap showing the differential gene expression of transcription factors between PHHs (fresh or plated) and HLCs (hESC and hiPSC derived). (H) Reactome pathway enrichment analysis on transcription factors identified in (G). Differential gene expression was calculated with log2(fold change) higher than 2 and adjusted p-value <0.05. Hierarchical clustering on samples was generated by Euclidean distance.
-
Figure 2—source data 1
Individual measurements and statistical tests related to Figure 2 and corresponding supplements.
- https://cdn.elifesciences.org/articles/71591/elife-71591-fig2-data1-v1.xlsx
-
Figure 2—source data 2
List of genes differentially expressed in the four clusters in Figure 2D.
- https://cdn.elifesciences.org/articles/71591/elife-71591-fig2-data2-v1.xlsx
Figure 2—figure supplement 1
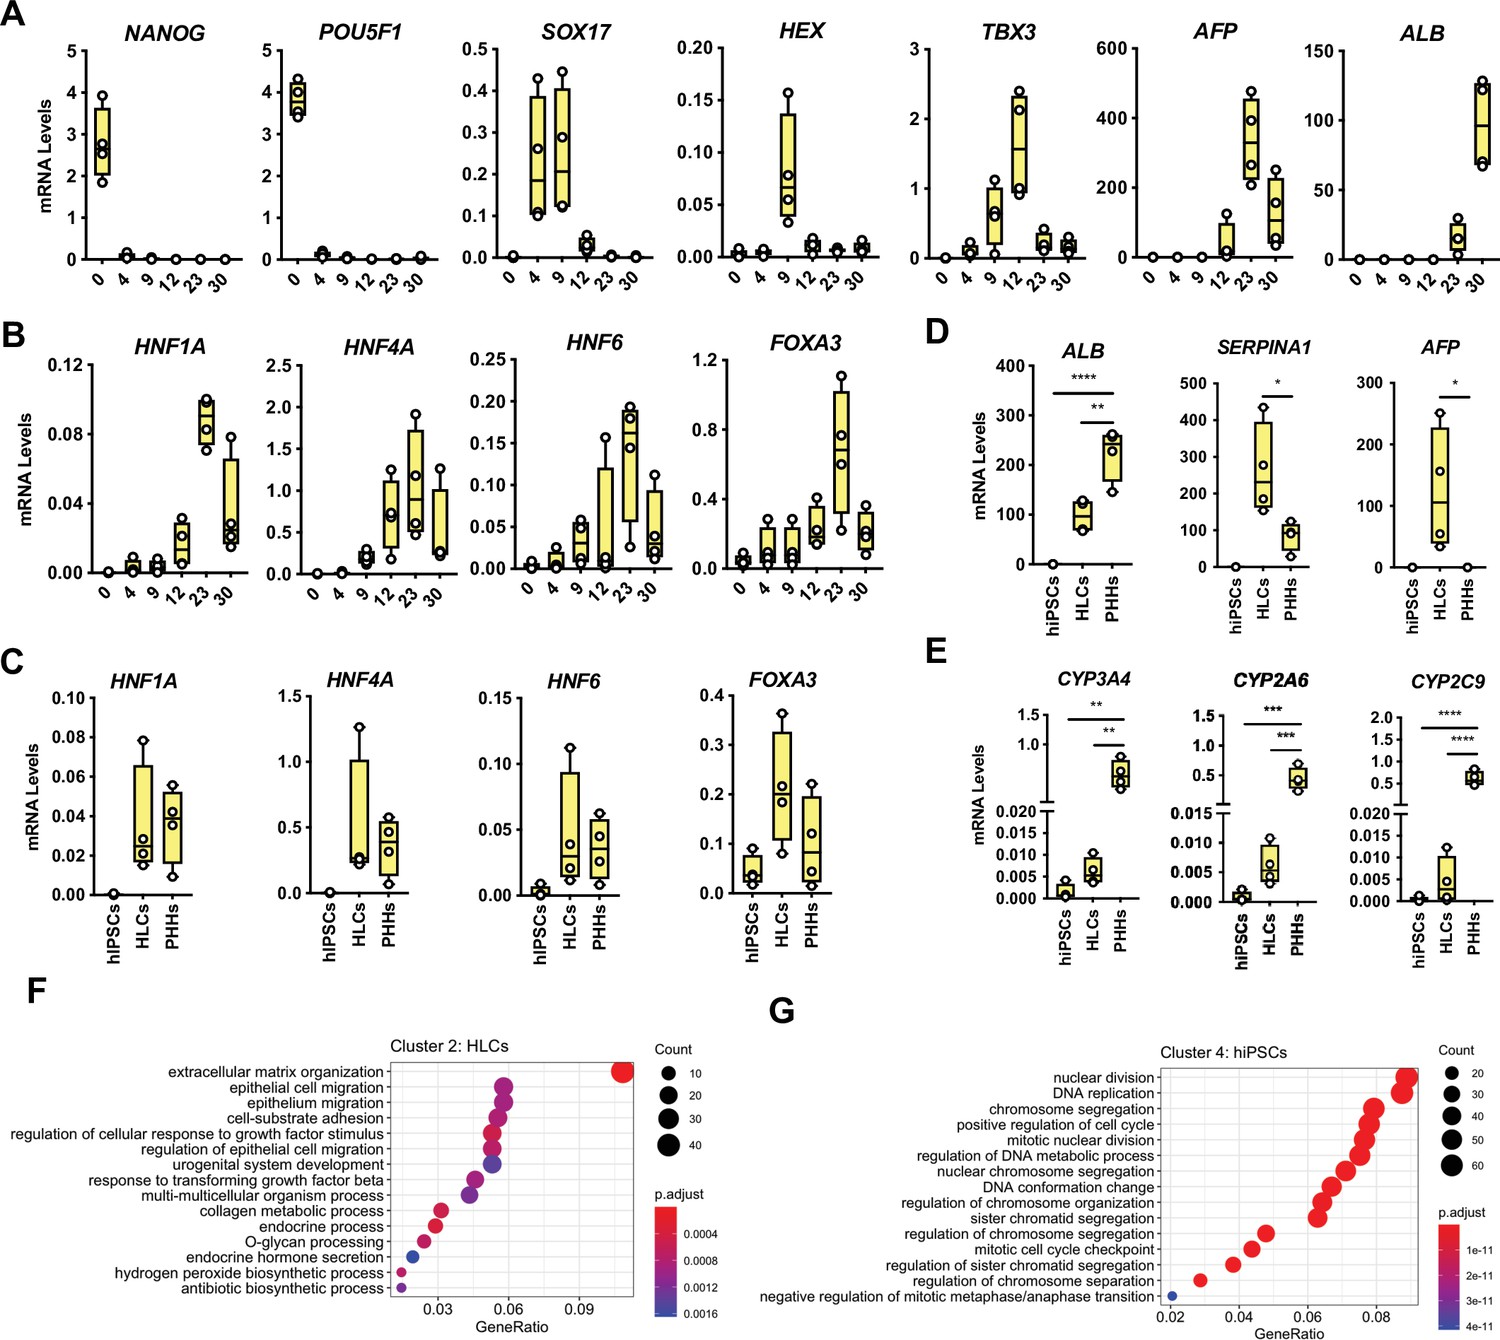
Characterisation of transcriptional differences between hepatocyte-like cells (HLCs) and primary human hepatocytes (PHHs).
(A) mRNA levels measured by qPCR throughout 30 days of human induced pluripotent stem cell (hiPSC) differentiation into HLCs. Representative markers of each stage of differentiation are shown: pluripotency (NANOG, POU5F1), endoderm (SOX17), foregut (HHEX), hepatoblast (TBX3), foetal (AFP), and mature (ALB) hepatocytes. (B) mRNA levels of the four liver-enriched transcription factors (LETFs) tested in forward programming quantified throughout 30 days of hiPSC direct differentiation into HLCs. (C) Comparison of the mRNA levels of the four LETFs in differentiated HLCs in (B) with PHHs. (D) mRNA levels of hepatocyte markers ALB, SERPINA1, and AFP in undifferentiated hiPSCs, 30-day differentiated HLCs and PHHs. (E) mRNA levels of hepatocyte markers CYP3A4, CYP2A6, and CYP2C9 in undifferentiated hiPSCs, HLCs, and PHHs. All mRNA levels were normalised to the average of two housekeeping genes (PBGD and RPLP0). Bars represent mean with SD, and individual datapoints are shown for n=4 biological replicates. Statistical difference was calculated with one-way ANOVA, corrected for multiple comparisons compared to PHHs. p-Values are indicated as *p<0.05, **p<0.01, ***p<0.001, ****p<0.0001. (F,G) Dotplot showing the top 15 hits on gene ontology enrichment analysis on genes associated to cluster 2 and cluster 4 as shown in Figure 2D. The size of each dot represents number of genes associated to each term and the colours represent the adjusted p-value.
Figure 3 with 1 supplement
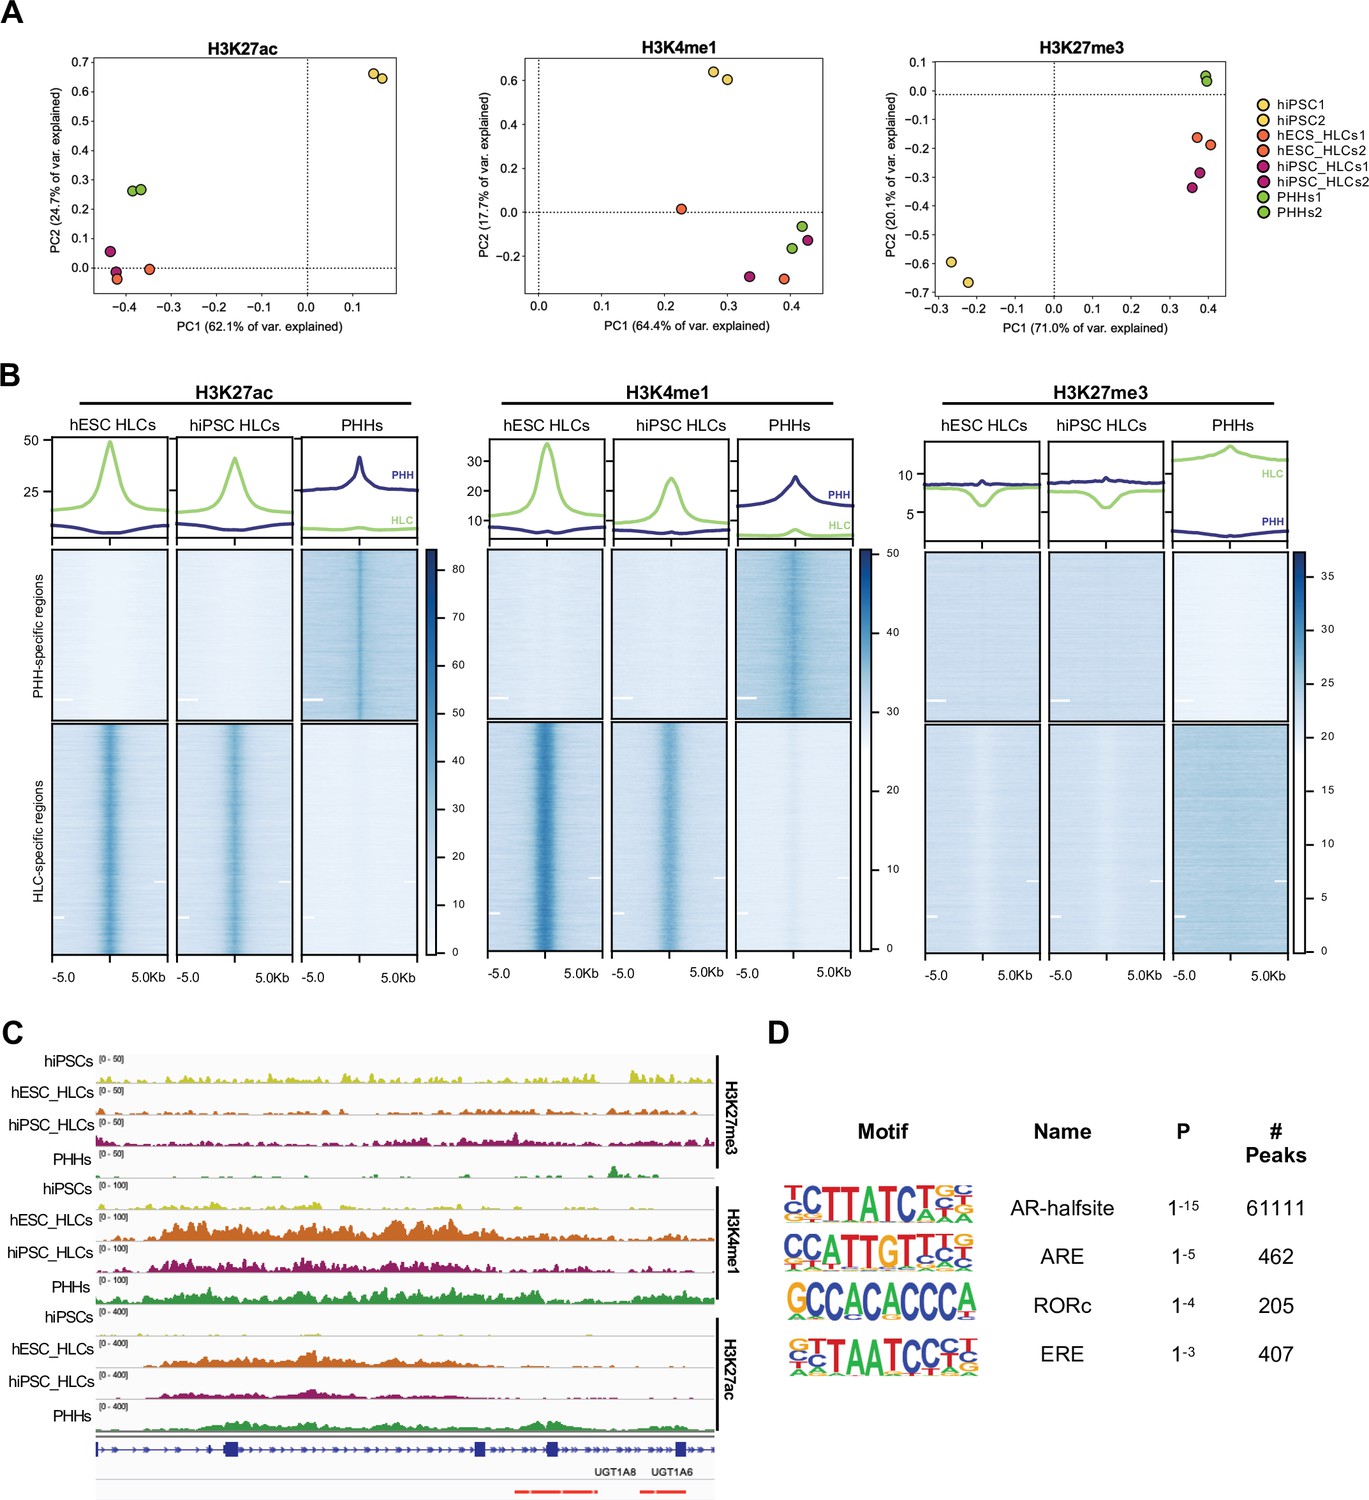
Epigenetic status of regulatory regions differs between states of maturation in hepatocyte-like cells (HLCs) and primary human hepatocytes (PHHs).
(A) Principal component analysis (PCA) of the global enrichment profile of H3K27ac, H3K4me1, and H3K27me3 across two replicates of undifferentiated human induced pluripotent stem cells (hiPSCs), human embryonic stem cell (hESC), and hiPSC-derived HLCs, and PHHs. Average scores were computed for genomic regions of 1000 bp for the entire genome. (B) Average density plots and heatmaps showing enrichment levels for H3K27ac, H3K4me1, and H3K27me3 within a 10 kb window centred at H3K27ac PHH-unique (blue) or HLC-unique (green) regions. Scales are adjusted to maximum peak intensity for each dataset. (C) Enrichment profiles of H3K27ac, H3K4me1, and H3K27me3 across the UGT1A locus. Profiles are shown for one replicate of undifferentiated hiPSCs, hESC, and hiPSC-derived HLCs, and PHHs. Red bars represent PHH-unique H3K27ac peaks. (D) Nuclear receptor motifs identified as overrepresented binding sites at H3K27ac PHH-unique regions.
-
Figure 3—source data 1
Peak annotation results for primary human hepatocyte (PHH)-unique H3K27ac regions.
- https://cdn.elifesciences.org/articles/71591/elife-71591-fig3-data1-v1.xlsx
-
Figure 3—source data 2
Peak annotation results for hepatocyte-like cell (HLC)-unique H3K27ac regions.
- https://cdn.elifesciences.org/articles/71591/elife-71591-fig3-data2-v1.xlsx
-
Figure 3—source data 3
Motif enrichment results for primary human hepatocyte (PHH)-unique H3K27ac regions.
- https://cdn.elifesciences.org/articles/71591/elife-71591-fig3-data3-v1.xlsx
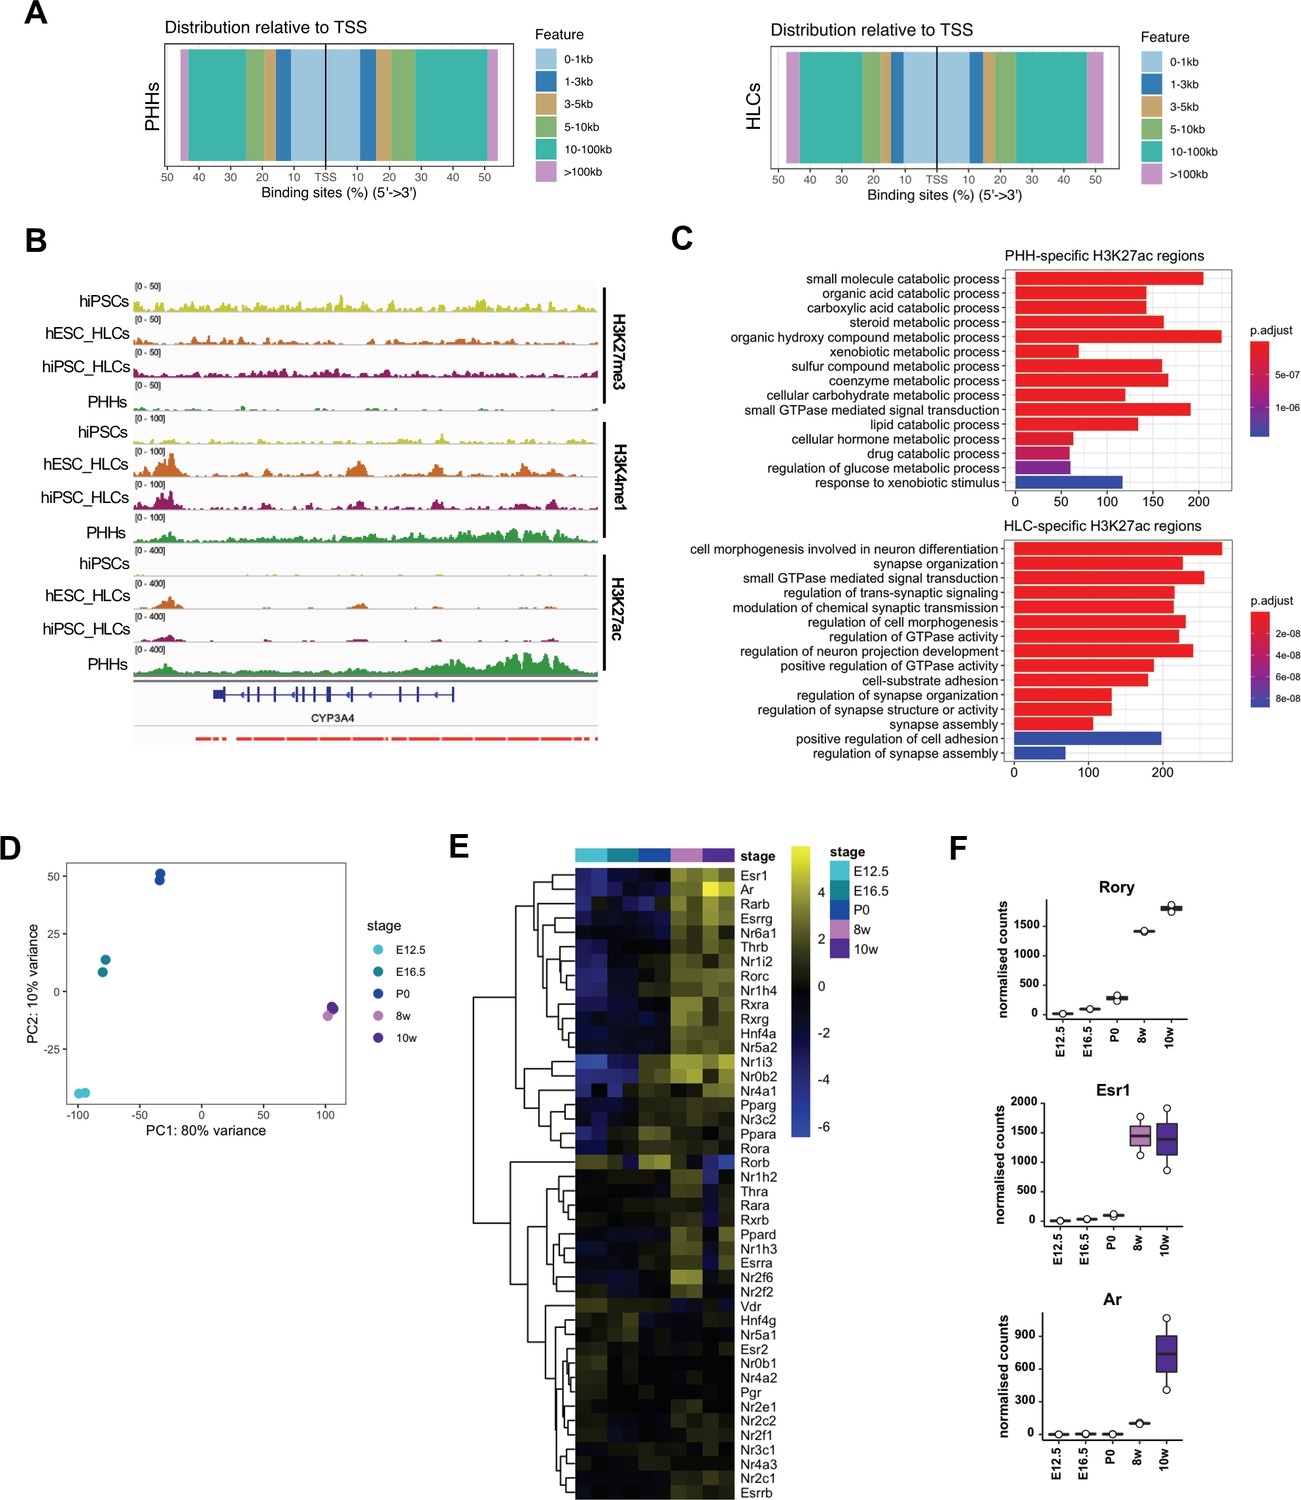
Figure 3—figure supplement 1
Comparison of the epigenetic profile of hepatocyte-like cells (HLCs) and primary human hepatocytes (PHHs).
(A) Distance to TSS of H3K27ac peaks identified in the PHH and HLC datasets. (B) Enrichment profiles of H3K27ac, H3K4me1, and H3K27me3 across the CYP3A4 locus. Profiles are shown for one replicate of undifferentiated human induced pluripotent stem cells (hiPSCs), human embryonic stem cell (hESC) and hiPSC-derived HLCs, and PHHs. Red bars represent PHH-unique H3K27ac peaks. (C) Bar plot showing the top 15 hits on gene ontology enrichment analysis on genes annotated to PHH or HLC-unique H3K27ac positive regions. The colour gradient represents the adjusted p-value. (D) Principal component analysis (PCA) of the expression profiles in mouse livers harvested at E12.5, E16.5, P0, and adult stages (8 and 10 weeks). Two biological replicates of each timepoint are shown. (E) Heatmap showing the relative expression of genes annotated as nuclear receptors across different stages of liver development, ordered left to right. Hierarchical clustering on gene expression levels was generated by Euclidean distance. Top clusters represent genes with highest expression changes between foetal and adult stages. (F) Normalised counts for three nuclear receptors (Rory, Esr1, and Ar) across different stages of liver development, showing expression increasing in the adult stage.
Figure 4 with 2 supplements
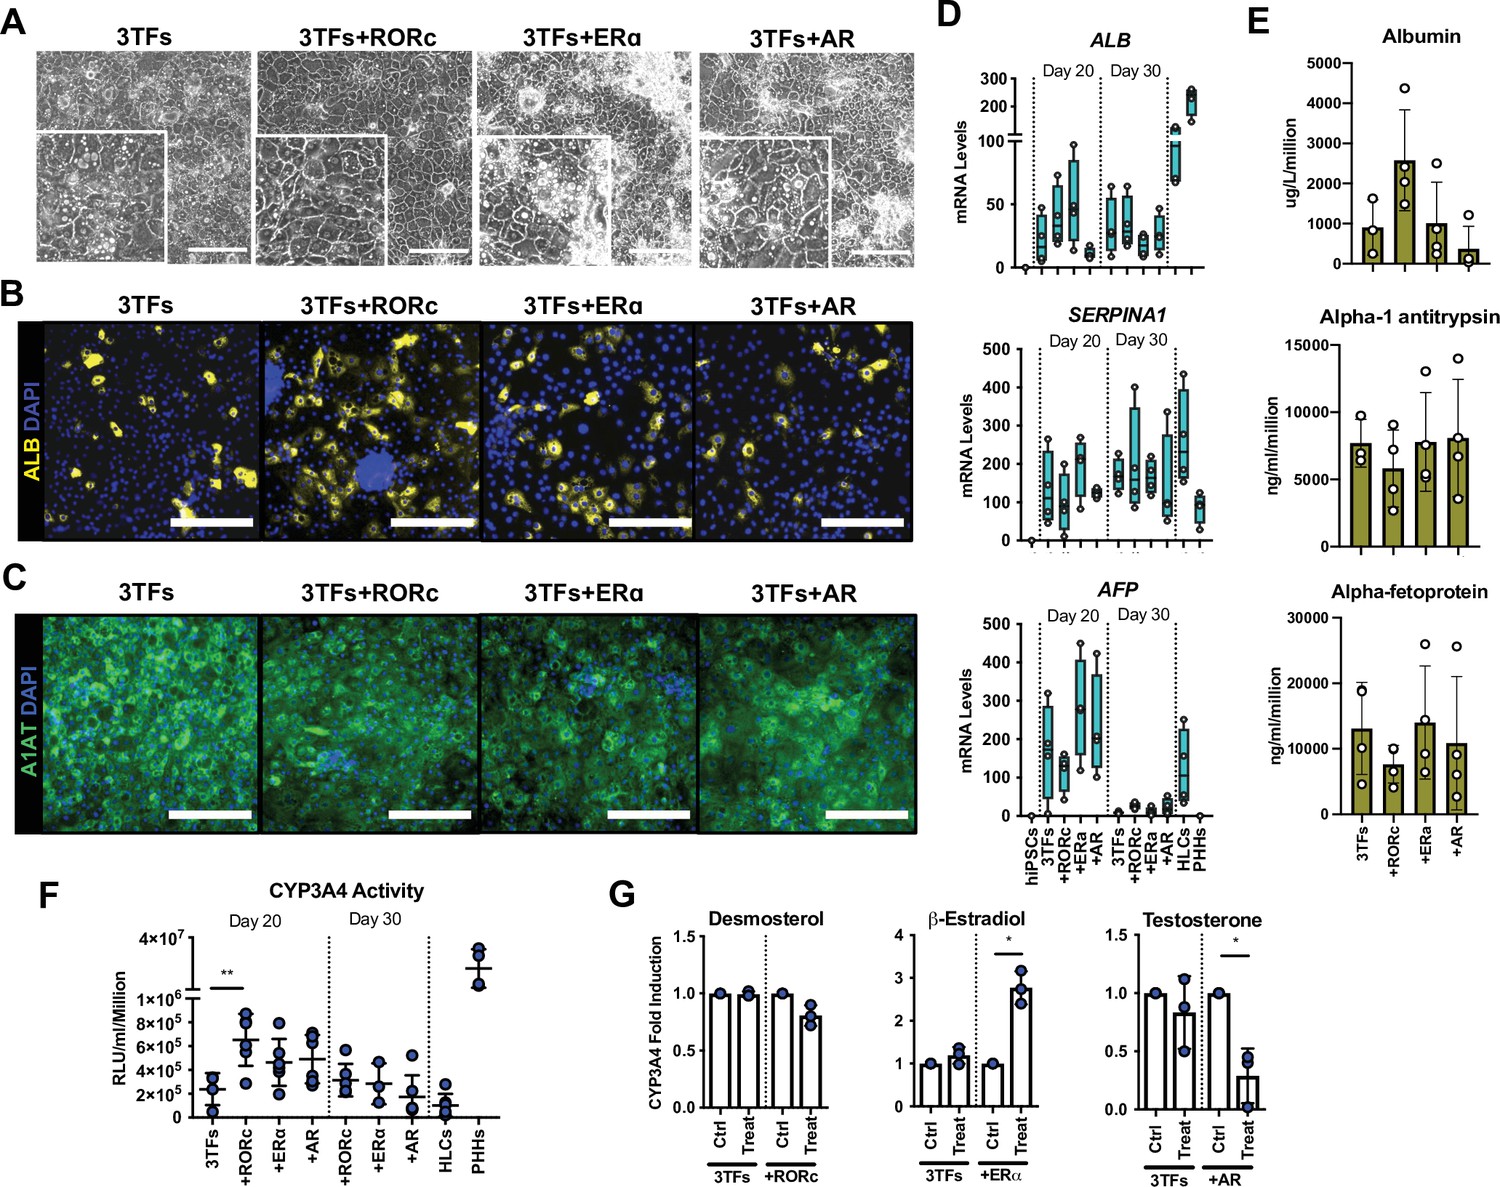
Forward programming of human embryonic stem cells (hESCs) into hepatocytes with nuclear receptors.
(A) Phase contrast images and (B) immunofluorescence staining for Albumin (yellow) and (C) A1AT (green) in hESCs forward programmed for 20 days with 3TFs alone or in combination with the nuclear receptors RORc, ERɑ, and AR. Nuclei were counterstained with DAPI (blue). Scale bars, 200 µm. (D) mRNA levels of hepatocyte markers (ALB, SERPINA1, and AFP) in FoP-Heps generated with 3TFs alone or in combination with nuclear receptors for 20 and 30 days (n=4). Expression data was normalised to the average of two housekeeping genes (PBGD and RPLP0). (E) Protein secretion levels of Albumin, A1AT, and AFP in hESC-derived FoP-Heps generated with 3TFs alone or in combination with nuclear receptors for 20 days (n=4). Data was normalised per total cell number (millions). (F) CYP3A4 activity levels normalised per cell number (millions) in FoP-Heps targeted with 3TFs with or without nuclear receptors, after 20 and 30 days of forward programming (n=3–6). Statistical differences were calculated with one-way ANOVA, corrected for multiple comparisons compared to 3TFs (day 20). (G) CYP3A4 fold induction levels in FoP-Heps treated with 100 nM of the ligands as indicated from day 2. Data is normalised to untreated control at day 20 of forward programming (n=3). Statistical differences were calculated with paired t-test. In all plots, bars represent mean with SD, and individual datapoints are shown for all biological replicates. Hepatocyte-like cells (HLCs) generated by direct differentiation and primary human hepatocytes (PHHs) where plotted as controls for CYP3A4 activity and expression data. Significant p-values are shown at each comparison and indicated as *p<0.05, **p<0.01, ***p<0.001, ****p<0.0001.
-
Figure 4—source data 1
Individual measurements and statistical tests related to Figure 4 and supplements.
- https://cdn.elifesciences.org/articles/71591/elife-71591-fig4-data1-v1.xlsx
Figure 4—figure supplement 1

Validation of inducible overexpression (iOX) of combinations of 3TFs and nuclear receptors.
(A) Schematic representation of the combinations of factors cloned into the AAVS1 locus. (B) Immunofluorescence staining of the 3TFs and nuclear receptors in human embryonic stem cells (hESCs) targeted with the constructs shown in (A) after 24 hr of iOX with doxycycline (dox) confirming transgene induction. (C) Immunofluorescence staining of nuclear receptors in hESCs targeted with 3TFs alone, as negative control. Scale bars, 200 µm. (D) Zoomed images of immunofluorescence staining of nuclear receptors showing nuclear localisation. Scale bars, 50 µm. Nuclei were counterstained with DAPI (blue). (E) Immunofluorescence staining for AFP (cyan) in hESCs forward programmed for 20 days with 3TFs alone or in combination with the nuclear receptors RORc, ERɑ, and AR. Nuclei were counterstained with DAPI (blue). Scale bars, 200 µm.
Figure 4—figure supplement 2
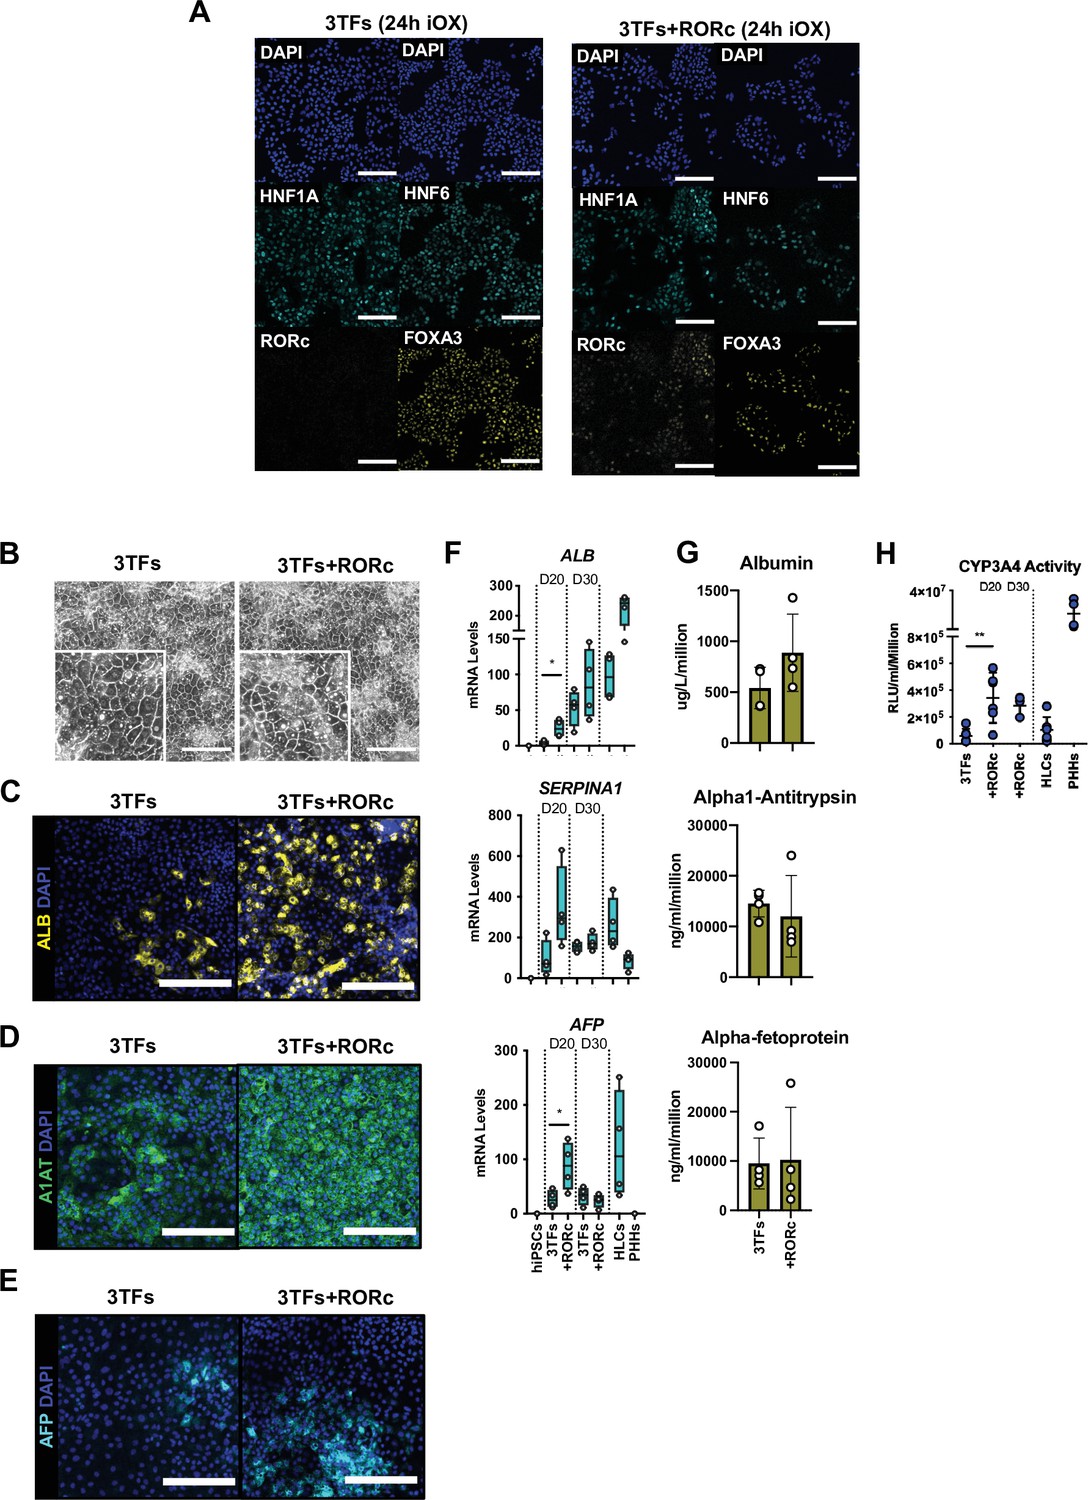
Forward programming of human induced pluripotent stem cells (hiPSCs) into hepatocytes with 4TFs.
(A) Immunofluorescence staining of the 3TFs in hiPSCs targeted with 3TFs alone or with RORc after 24 hr of inducible overexpression (iOX) with doxycycline (dox) confirming transgene induction. Scale bars, 200 µm. (B) Phase contrast images and (C) immunofluorescence staining for Albumin (yellow), (D) A1AT (green), and (E) AFP (cyan) in hiPSCs forward programmed for 20 days with 3TFs alone or with RORc. Nuclei were counterstained with DAPI (blue). Scale bars, 200 µm. (F) mRNA levels of hepatocyte markers (ALB, SERPINA1, and AFP) in hiPSC-derived FoP-Heps generated with 3TFs alone or with RORc for 20 and 30 days (n=4). Statistical differences were calculated with unpaired t-test. All expression data was normalised to the average of two housekeeping genes (PBGD and RPLP0). (G) Protein secretion levels of Albumin, A1AT, and AFP in hiPSC-derived FoP-Heps generated with 3TFs alone or with RORc for 20 days (n=4). Data was normalised per total cell number (millions). (H) CYP3A4 activity levels normalised per cell number (millions) in hiPSC FoP-Heps targeted with 3TFs with or without RORc after 20 days of forward programming (n=6). Statistical differences were calculated with one-way ANOVA, corrected for multiple comparisons compared to 3TFs (day 20). In all plots, bars represent mean with SD, and individual datapoints are shown for all biological replicates. Hepatocyte-like cells (HLCs) generated by direct differentiation and primary human hepatocytes (PHHs) where plotted as controls for CYP3A4 activity and expression data. Significant p-values are shown at each comparison and indicated as *p<0.05, **p<0.01, ***p<0.001, ****p<0.0001.
Figure 5 with 2 supplements

4TF FoP-Heps are transcriptionally equivalent to hepatocyte-like cells (HLCs).
(A) CYP3A4 activity levels in eFoP-Heps at day 20 (n=6) and day 30 (n=6), iFoP-Heps at day 0 (n=6) and day 30 (n=3), against direct differentiation HLCs (n=6) and primary human hepatocytes (PHHs) (n=4). Statistical differences were tested with one-way ANOVA, corrected for multiple comparisons, between eFoP-Heps group and HLCs. (Statistical test of HLC vs. PHHs can be found in Figure 2B) (B) mRNA levels of phase I (CYP3A4, CYP2A6, and CYP2C8) and phase II (UGT1A6) biotransformation enzymes in 4TF FoP-Heps, HLCs, and PHHs (n=4). (C) mRNA level of ALB, gluconeogenesis (G6PC and PCK1), and lipid (PPARγ) metabolism in FoP-Heps, HLCs, and PHHs (n=4). Statistical differences were calculated with one-way ANOVA, corrected for multiple comparisons, and all samples compared to HLCs. p-Values are indicated as *p<0.05, **p<0.01, ***p<0.001, ****p<0.0001. (D) Principal component analysis (PCA) of undifferentiated human induced pluripotent stem cells (hiPSCs), HLCs derived from human embryonic stem cell (hESC) (hESC_HLCs) and hiPSC (hiPSC_HLCs), freshly harvested PHHs (fPHHs) or plated PHHs (pPHHs), foetal livers (FL), and 4TF hESC-derived FoP-Heps (eFoP_Heps). (E) Dotplot showing the top 15 hits on gene ontology enrichment analysis on genes associated to genes differentially expressed between eFoP-Heps and undifferentiated hiPSCs. The size of each dot represents number of genes associated to each term and the colours represents the adjusted p-values. (F) Heatmap showing expression of genes associated with adult hepatocyte functions found to be expressed in hiPSC-derived HLCs (hiPSC_HLCs) and 4TF hESC-derived FoP-Heps (eFoP_Heps), as compared to undifferentiated hiPSCs. Two clusters were separated as genes expressed (bottom) and not expressed (top) in foetal liver samples (Foetal_Liver).
-
Figure 5—source data 1
Individual measurements and statistical tests related to Figure 5 and corresponding supplements.
- https://cdn.elifesciences.org/articles/71591/elife-71591-fig5-data1-v1.xlsx
Figure 5—figure supplement 1

Characterisation of 4TF FoP-Heps.
(A) mRNA levels of phase II (UGT1A1) biotransformation enzymes, lipid (APOA1, FASN, PPARα) and bile acid metabolism (NR1H4), and (B) 4TFs (HNF1A, FOXA3, HNF6 RORγ) in human embryonic stem cell (hESC) (eFoP) and human induced pluripotent stem cell (hiPSC) (iFoP)-derived FoP-Heps targeted with the 4TFs and forward programmed for 20 days (n=4), HLCs and PHHs (n=4). Statistical differences were calculated with one-way ANOVA, corrected for multiple comparisons, compared to HLCs. p-Values are indicated as *p<0.05, **p<0.01, ***p<0.001, ****p<0.0001.
Figure 5—figure supplement 2

Characterisation of the transcriptome of 4TF eFoP-Heps.
Dotplot showing the top 15 hits on gene ontology enrichment analysis on genes differentially expressed between eFoP and foetal liver (A, B), adult primary human hepatocytes (PHHs) (C, D), human embryonic stem cell (hESC)-derived hepatocyte-like cells (HLCs) (E, F), and human induced pluripotent stem cell (hiPSC)-derived HLCs (G, H). Differential gene expression was calculated with log2(fold change) higher than 2 and adjusted p-value < 0.05.
Figure 6
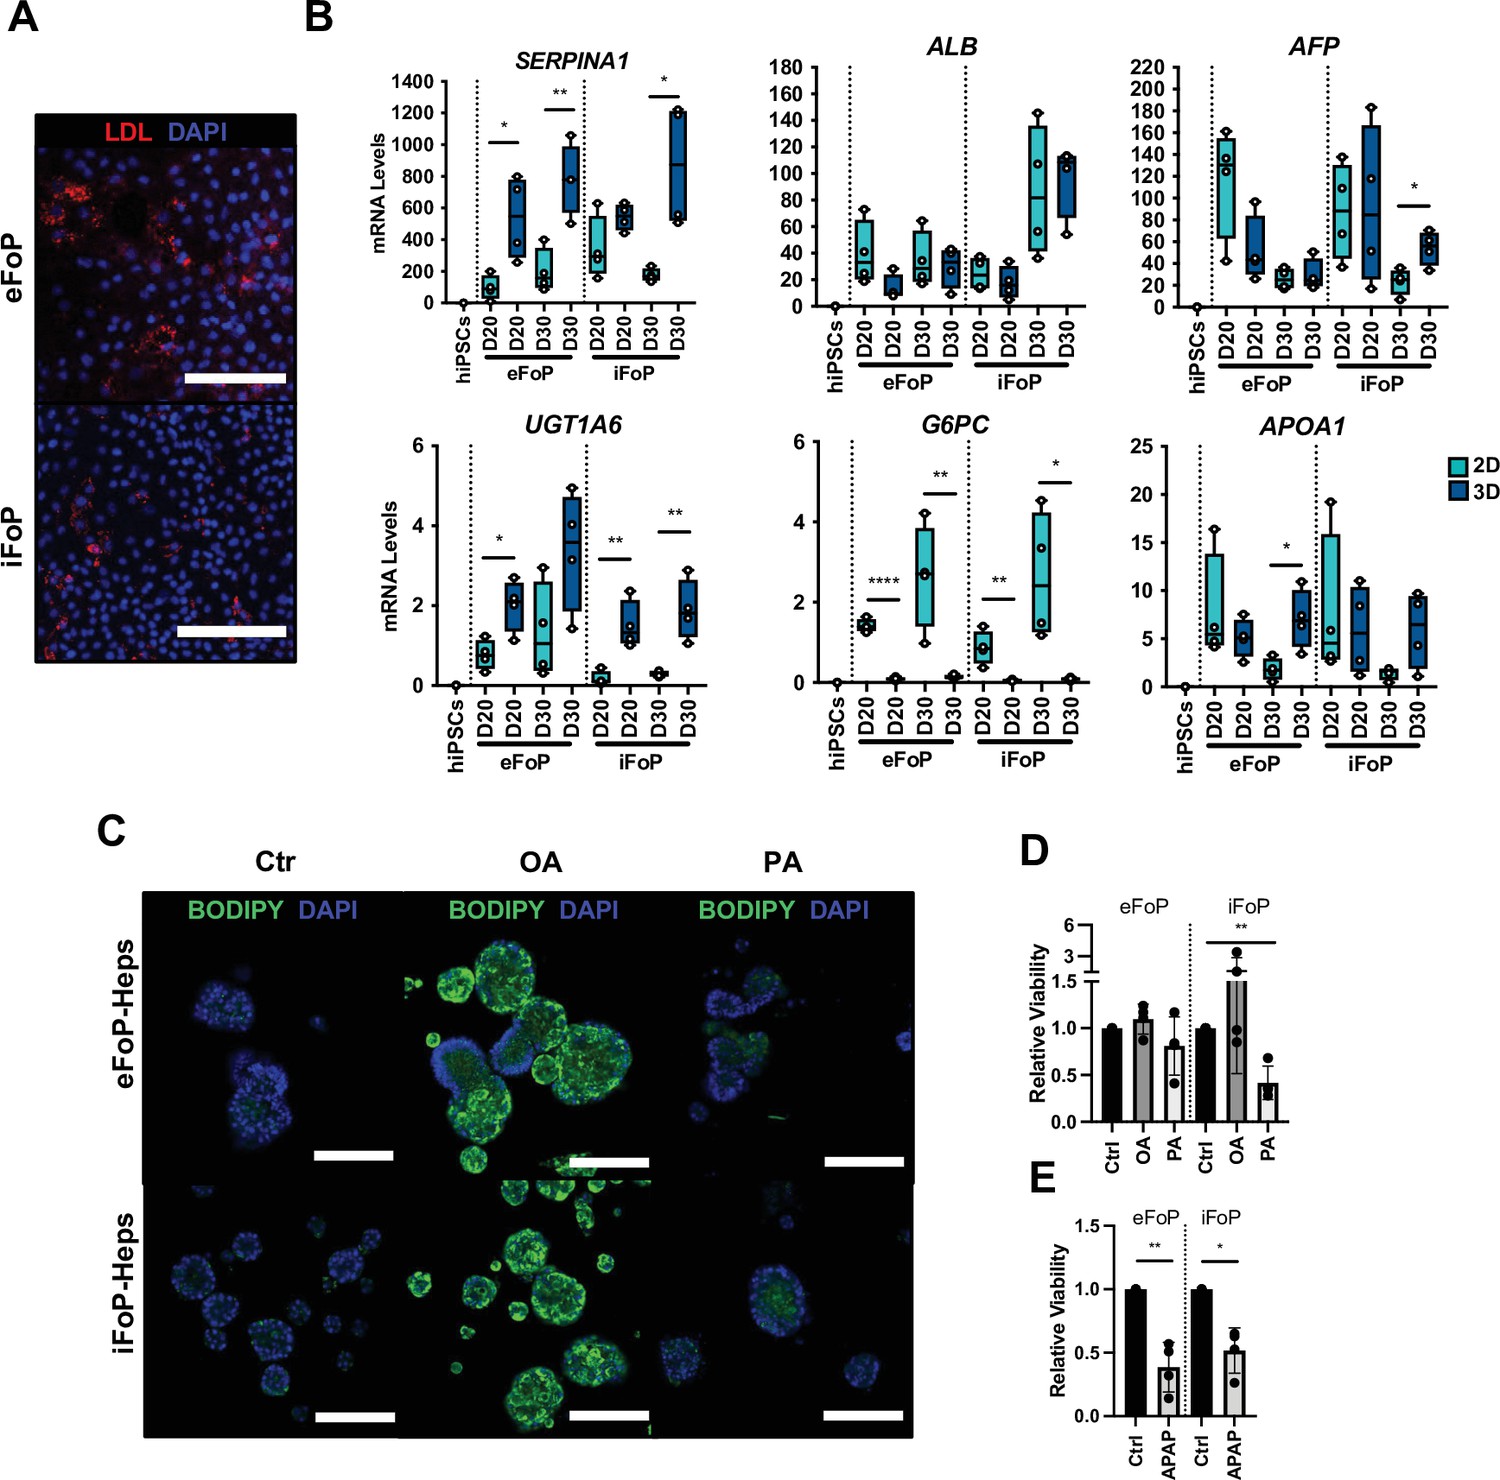
RORc promotes functionality of 4TF FoP-Heps.
(A) Immunofluorescence staining for LDL in FoP-Heps at day 20 of forward programming. Scale bars, 200 µm. Nuclei were counterstained with DAPI (blue). (B) Comparison of mRNA levels of SERPINA1, ALB, AFP, UGT1A6, G6PC, and APOA1 in FoP-Heps cultured in 2D and 3D for up to 20 or 30 days of forward programming (n=4). Statistical difference between 2D and 3D were calculated with unpaired t-test. All expression data was normalised to the average of two housekeeping genes (PBGD and RPLP0). In all plots, bars represent mean with SD, and individual datapoints are shown for all biological replicates. p-Values are indicated as *p<0.05, **p<0.01, ***p<0.001, ****p<0.0001. (C) BODIPY staining of FoP-Heps cultured in 3D from day 20 of forward programming and treated with fatty acids (oleic acid [OA], palmitic acid [PA], or BSA [Ctr]) as indicated for 7 days. Scale bars, 200 µm. Nuclei were counterstained with DAPI (blue). (D) Cell viability in FoP-Heps treated with the fatty acids as indicated, normalised against FoP-Heps treated with BSA as control (n=4). (E) Cell viability in FoP-Heps treated with 25 mM of acetaminophen (APAP) for 48 hr in 3D cultures, normalised against untreated FoP-Heps (n=4). Significant differences were determined with paired t-test. In all plots, bars represent mean with SD, and individual datapoints are shown for all biological replicates. p-Values are indicated as *p<0.05, **p<0.01, ***p<0.001, ****p<0.0001.
-
Figure 6—source data 1
Individual measurements and statistical tests related to Figure 6.
- https://cdn.elifesciences.org/articles/71591/elife-71591-fig6-data1-v1.xlsx
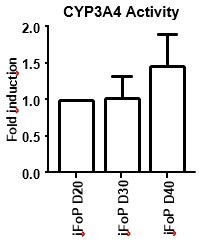
Author response image 1

CYP3A4 Activity in long-term cultures.
hiPSCs expressing the 4TF combination were induced to differentiate for up to 40 days, with CYP3A4 activity measure at days 20, 30 and 40 (left panel). HLCs where differentiated by directed differentiation up to 40 days, with CYP3A4 activity measured at days 30, 35 and 40 (right panel). Data is represented as fold induction over day 20 (iFoP) or day 30 (HLCs).
Author response image 2
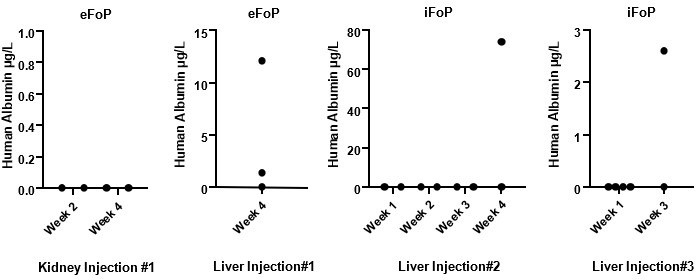
Human Albumin secretion in mice sera.
eFoP (hESC-derived) or iFoP (hIPSC-derived) cells differentiated up to 20 days were dissociated into small clusters, and 1 million cells mixed with growth-factor reduced Matrigel and injected (per mouse) into the kidney or liver capsules of healthy mice. Blood samples were collected at the timepoints indicated post-injection.
Author response image 3
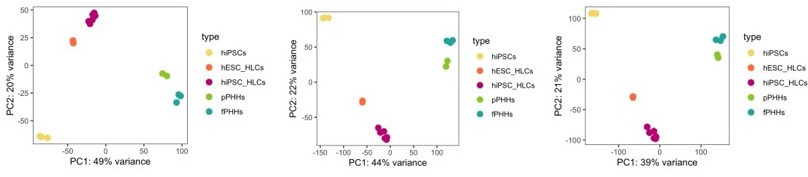
PCA plot.
PCA of undifferentiated hiPSCs, HLCs derived from hESC (hESC_HLCs) and hiPSC (hiPSC_HLCs), freshly harvested PHHs (fPHHs) or plated PHHs (pPHHs), where generated with the top 1000 (left panel), 5000 (middle panel) and 20.000 (right panel) most variable genes.
Author response image 4

Expression of nuclear receptors in PHHs.
mRNA levels of AR and ESR1 (ERa) genes in primary human hepatocytes from 4 donors including 1 female (F) and 3 males (M1, M2, M3). Data were normalised to the average of 2 housekeeping genes (PBGD and RPLP0).
Author response image 5
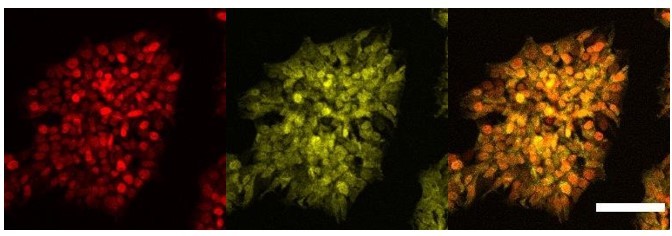
Cellular localisation of AR.
Immunofluorescence staining of HNF1A an AR in hESCs targeted with 3TFs+AR after 24h of iOX with dox. Scale bar, 100µm.
Author response image 6
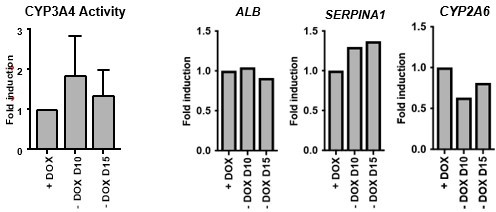
Dox removal during forward programming.
hiPSCs overexpressing the 4TF combination were induced to differentiate for 20 days. Dox was removed from 10 and from day 15. iFoP-Heps where assessed for CYP3A4 activity levels (left panel). Expression levels of ALB, SERPINA1 and CYP2A6 were also quantified and normalised to the average of 2 housekeeping genes (PBGD and RPLP0). Data is represented as fold induction over control (continuous dox over 20 days).
Author response image 7
CYP3A4 Activity in long term cultures.
hiPSCs expressing the 4TF combination were induced to differentiate for up to 40 days, with CYP3A4 activity measured at days 20, 30 and 40.
Tables
Table 1
Sequences of primers used for cloning.
| Gene | Primer | Sequence 5'–3' (GSG linker sequence underlined) |
|---|---|---|
| HNF1A | Start_F | CAC TTT TGT CTT ATA CTT ACT AGT GCC ACC ATG GTT TCT AAA CTG AGC CAG CTG CAG |
| HNF1A | P2A_R | TTC CAC GTC TCC TGC TTG CTT TAA CAG AGA GAA GTT CGT GGC TCC GGA GCC CTG GGA GGA AGA GGC CAT CTG G |
| HNF4A | E2A_F | TAT GCT CTC TTG AAA TTG GCT GGA GAT GTT GAG AGC AAC CCT GGA CCT GTC AGC GTG AAC GCG CCC CT |
| HNF4A | Stop_R | AGA GGA TCC CCG GGT ACC GAG CTC GAA TTC CTA GAT AAC TTC CTG CTT GGT GAT GGT CG |
| HNF4A | P2A_F | TCT CTG TTA AAG CAA GCA GGA GAC GTG GAA GAA AAC CCC GGT CCT GTC AGC GTG AAC GCG CCC CT |
| HNF4A | T2A_R | CTC CTC CAC GTC ACC GCA TGT TAG AAG ACT TCC TCT GCC CTC TCC GGA GCC GAT AAC TTC CTG CTT GGT GAT GGT CG |
| HNF4A | Start_F | CAC TTT TGT CTT ATA CTT ACT AGT GCC ACC ATG GTC AGC GTG AAC GCG CCC |
| HNF4A | P2A_R | TTC CAC GTC TCC TGC TTG CTT TAA CAG AGA GAA GTT CGT GGC TCC GGA GCC GAT AAC TTC CTG CTT GGT GAT GGT CG |
| FOXA3 | T2A_F | AGT CTT CTA ACA TGC GGT GAC GTG GAG GAG AAT CCC GGC CCT CTG GGC TCA GTG AAG ATG GAG GC |
| FOXA3 | E2A_R | CTC AAC ATC TCC AGC CAA TTT CAA GAG AGC ATA ATT AGT ACA CTG TCC GGA GCC GGA TGC ATT AAG CAA AGA GCG GGA ATA G |
| FOXA3 | P2A_F | TCT CTG TTA AAG CAA GCA GGA GAC GTG GAA GAA AAC CCC GGT CCT CTG GGC TCA GTG AAG ATG GAG GC |
| FOXA3 | T2A_R | CTC CTC CAC GTC ACC GCA TGT TAG AAG ACT TCC TCT GCC CTC TCC GGA GCC GGA TGC ATT AAG CAA AGA GCG GGA ATA G |
| FOXA3 | T2A_F | AGT CTT CTA ACA TGC GGT GAC GTG GAG GAG AAT CCC GGC CCT CTG GGC TCA GTG AAG ATG GAG GC |
| FOXA3 | Stop_R | AGA GGA TCC CCG GGT ACC GAG CTC GAA TTC CTA GGA TGC ATT AAG CAA AGA GCG GGA ATA G |
| HNF6 | P2A_F | TCT CTG TTA AAG CAA GCA GGA GAC GTG GAA GAA AAC CCC GGT CCT AAC GCG CAG CTG ACC ATG GAA GC |
| HNF6 | T2A_R | CTC CTC CAC GTC ACC GCA TGT TAG AAG ACT TCC TCT GCC CTC TCC GGA GCC TGC TTT GGT ACA AGT GCT TGA TGA AGA AGA T |
| HNF6 | T2A_F | AGT CTT CTA ACA TGC GGT GAC GTG GAG GAG AAT CCC GGC CCT AAC GCG CAG CTG ACC ATG GAA GC |
| HNF6 | Stop_R | AGA GGA TCC CCG GGT ACC GAG CTC GAA TTC CTA TGC TTT GGT ACA AGT GCT TGA TGA AGA AGA T |
| RORy | E2A_F | TAT GCT CTC TTG AAA TTG GCT GGA GAT GTT GAG AGC AAC CCT GGA CCT GAC AGG GCC CCA CAG AGA CAG |
| RORy | Stop_R | AGA GGA TCC CCG GGT ACC GAG CTC GAA TTC CTA CTT GGA CAG CCC CAC AGG TGA C |
| ESR1 | E2A_F | TAT GCT CTC TTG AAA TTG GCT GGA GAT GTT GAG AGC AAC CCT GGA CCT ACC ATG ACC CTC CAC ACC AAA GCA |
| ESR1 | Stop_R | AGA GGA TCC CCG GGT ACC GAG CTC GAA TTC CTA GAC CGT GGC AGG GAA ACC CTC |
| AR | E2A_F | TAT GCT CTC TTG AAA TTG GCT GGA GAT GTT GAG AGC AAC CCT GGA CCT GAA GTG CAG TTA GGG CTG GGA AG |
| AR | Stop_R | AGA GGA TCC CCG GGT ACC GAG CTC GAA TTC CTA CTG GGT GTG GAA ATA GAT GGG CTT G |
Table 2
Sequences of primers used for qPCR.
| Gene | Forward | Reverse |
|---|---|---|
| AFP | TGCGGCCTCTTCCAGAAACT | TAATGTCAGCCGCTCCCTCG |
| ALB | CCTTTGGCACAATGAAGTGGGTAACC | CAGCAGTCAGCCATTTCACCATAG |
| APOA1 | AGACAGCGGCAGAGACTATG | CCAGTTGTCAAGGAGCTTTAGG |
| CYP2A6 | CAGCACTTCCTGAATGAG | AGGTGACTGGGAGGACTTGAGGC |
| CYP2C8 | CATTACTGACTTCCGTGCTACAT | CTCCTGCACAAATTCGTTTTCC |
| CYP2C9 | GCCGGCATGGAGCTGTTTTTAT | GCCAGGCCATCTGCTCTTCTT |
| CYP3A4 | TGTGCCTGAGAACACCAGAG | GTGGTGGAAATAGTCCCGTG |
| FASN | GCAAGCTGAAGGACCTGTCT | AATCTGGGTTGATGCCTCCG |
| FOXA3 | TGGGCTCAGTGAAGATGGAG | GGGGATAGGGAGAGCTTAGAG |
| G6PC | GTGTCCGTGATCGCAGACC | GACGAGGTTGAGCCAGTCTC |
| HHEX | GCCCTTTTACATCGAGGACA | AGGGCGAACATTGAGAGCTA |
| HNF1A | TGGCCATGGACACGTACAG | GCTGCTTGAGGGTACTTCTG |
| HNF4A | CATGGCCAAGATTGACAACCT | TTCCCATATGTTCCTGCATCAG |
| HNF6 | GTGTTGCCTCTATCCTTCCCAT | CGCTCCGCTTAGCAGCAT |
| NANOG | CATGAGTGTGGATCCAGCTTG | CCTGAATAAGCAGATCCATGG |
| NR1H4 | ACTGAACTCACCCCAGATCAA | TGGTTGCCATTTCCGTCAAA |
| PBGD | GGAGCCATGTCTGGTAACGG | CCACGCGAATCACTCTCATCT |
| PCK1 | ACACAGTGCCCATCCCCAAA | GGTGCGACCTTTCATGCACC |
| POU5F1 | AGTGAGAGGCAACCTGGAGA | ACACTCGGACCACATCCTTC |
| PPARa | CCCTCCTCGGTGACTTATCC | CGGTCGCACTTGTCATACAC |
| PPARy | GAGCCTGCATCTCCACCTTAT | AGAAACCCTTGCATCCTTCACA |
| RORy | CTACGGCAGCCCCAGTTT | GCTGGCATGTCTCCCTGTA |
| RPLP0 | GGCGTCCTCGTGGAAGTGAC | GCCTTGCGCATCATGGTGTT |
| SERPINA1 | CCACCGCCATCTTCTTCCTGCCTGA | GAGCTTCAGGGGTGCCTCCTCTG |
| SOX17 | CGCACGGAATTTGAACAGTA | GGA TCAGGGACCTGTCACAC |
| TBX3 | TGGAGCCCGAAGAAGAGGTG | TTCGCCTTCCCGACTTGGTA |
| UGT1A1 | TGATCCCAGTGGATGGCAGC | CAACGAGGCGTCAGGTGCTA |
| UGT1A6 | GGAGCCCTGTGATTTGGAGAGT | GACCCCGGTCACTGAGAACC |
Table 3
Lisf of primary antibodies.
| Protein | Supplier | Catalog number | Host | Concentration |
|---|---|---|---|---|
| Albumin | Bethyl Laboratories | A80-229A | goat | 1:100 |
| Alpha-1 Antitrypsin | Dako | A0012 | rabbit | 1:100 |
| Alpha-Fetoprotein | Dako | A0008 | rabbit | 1:100 |
| HNF4A | Abcam | ab92378 | rabbit | 1:100 |
| HNF1A | Santa cruz | sc-135939 | mouse | 1:50 |
| HNF6 | Santa cruz | sc-13050 | rabbit | 1:100 |
| FOXA3 | Santa cruz | sc-166703 | mouse | 1:50 |
| RORc | Abcam | ab221359 | rabbit | 1:100 |
| ERɑ | Abcam | ab32063 | rabbit | 1:100 |
| AR | Abcam | ab108341 | rabbit | 1:100 |
Additional files
Download links
A two-part list of links to download the article, or parts of the article, in various formats.
Downloads (link to download the article as PDF)
Open citations (links to open the citations from this article in various online reference manager services)
Cite this article (links to download the citations from this article in formats compatible with various reference manager tools)
Generation of functional hepatocytes by forward programming with nuclear receptors
eLife 11:e71591.
https://doi.org/10.7554/eLife.71591


