Functional diversification gave rise to allelic specialization in a rice NLR immune receptor pair
- Gregor Mendel Institute of Molecular Plant Biology, Austrian Academy of Sciences, Austria
- Department of Biological Chemistry and Metabolism, John Innes Centre, United Kingdom
- Servicio de Bioquímica-Análisis clínicos, Hospital Universitario Puerta de Hierro, Spain
- The Sainsbury Laboratory, University of East Anglia, United Kingdom
- Division of Genomics and Breeding, Iwate Biotechnology Research Center, Japan
- Laboratory of Crop Evolution, Graduate School of Agriculture, Japan
Figures
Figure 1 with 3 supplements
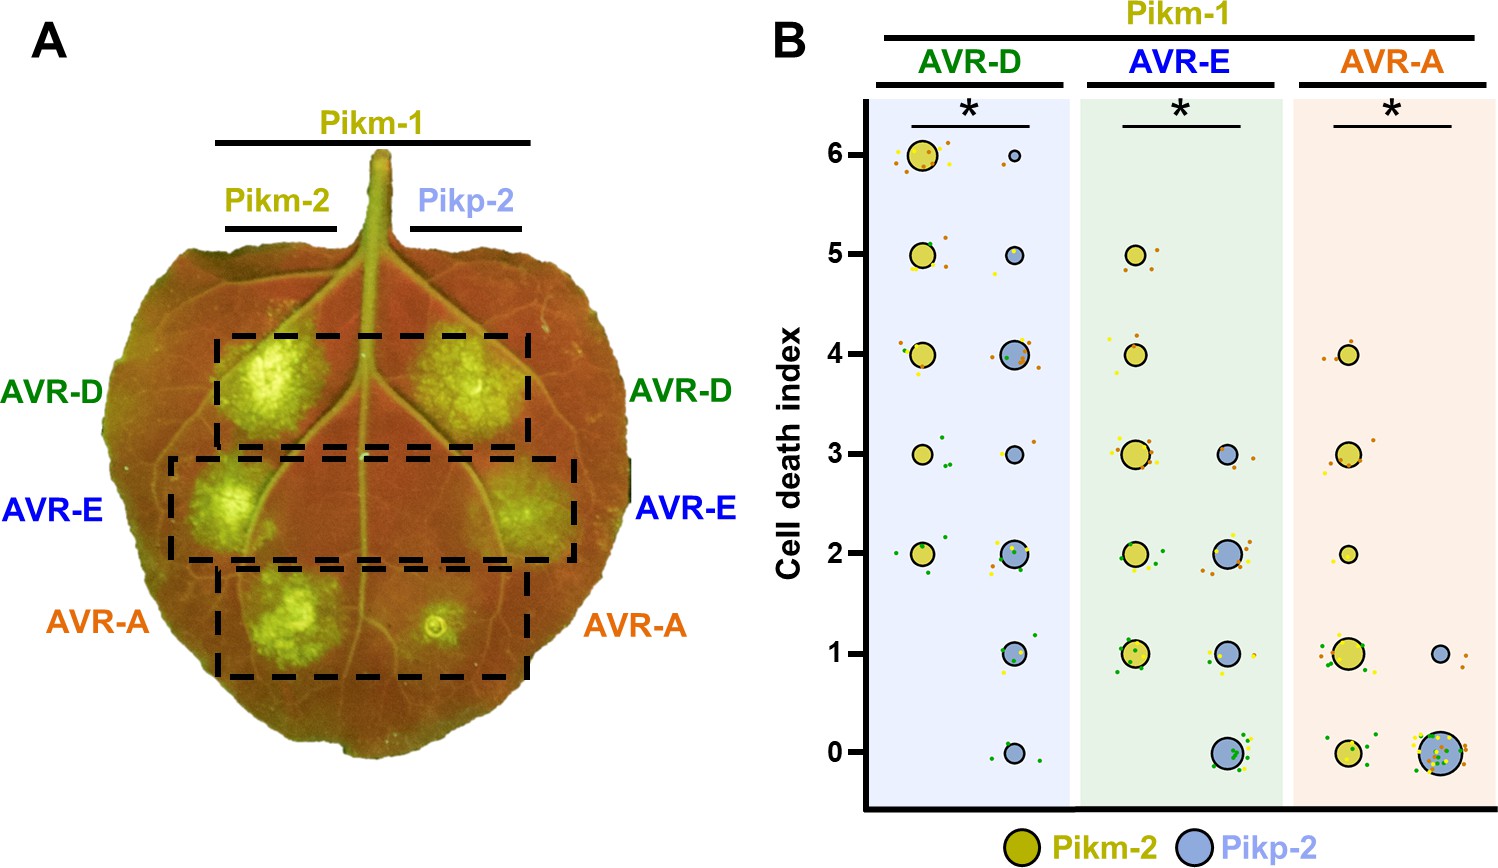
Pikm-1 elicits a stronger response to the AVR-Pik effectors when it is paired with Pikm-2 than with Pikp-2.
(A) Representative N. benthamiana leaf depicting Pik-mediated cell death as autofluorescence under UV light. Pikm-1 was co-expressed with either Pikm-2 or Pikp-2 and the AVR-Pik effector alleles recognized by Pikm. Side-by-side infiltrations are highlighted with dashed boxes. (B) Scoring of cell death triggered by Pikp-2 or Pikm-2 with each AVR-PikD (AVR-D), AVR-PikE (AVR-E), and AVR-PikA (AVR-A) is represented as dot plots. The total number of repeats was 30. For each sample, all the data points are represented as dots with a distinct colour for each of the three biological replicates; these dots are jittered around the cell death score for visualization purposes. The size of the central dot at each cell death value is proportional to the number of replicates of the sample with that score. Significant differences between relevant conditions are marked with an asterisk, and the details of the statistical analysis are summarized in Figure 1—figure supplement 2.
-
Figure 1—source data 1
HR scores used for dot plots and statistics.
- https://cdn.elifesciences.org/articles/71662/elife-71662-fig1-data1-v2.csv
Figure 1—figure supplement 1
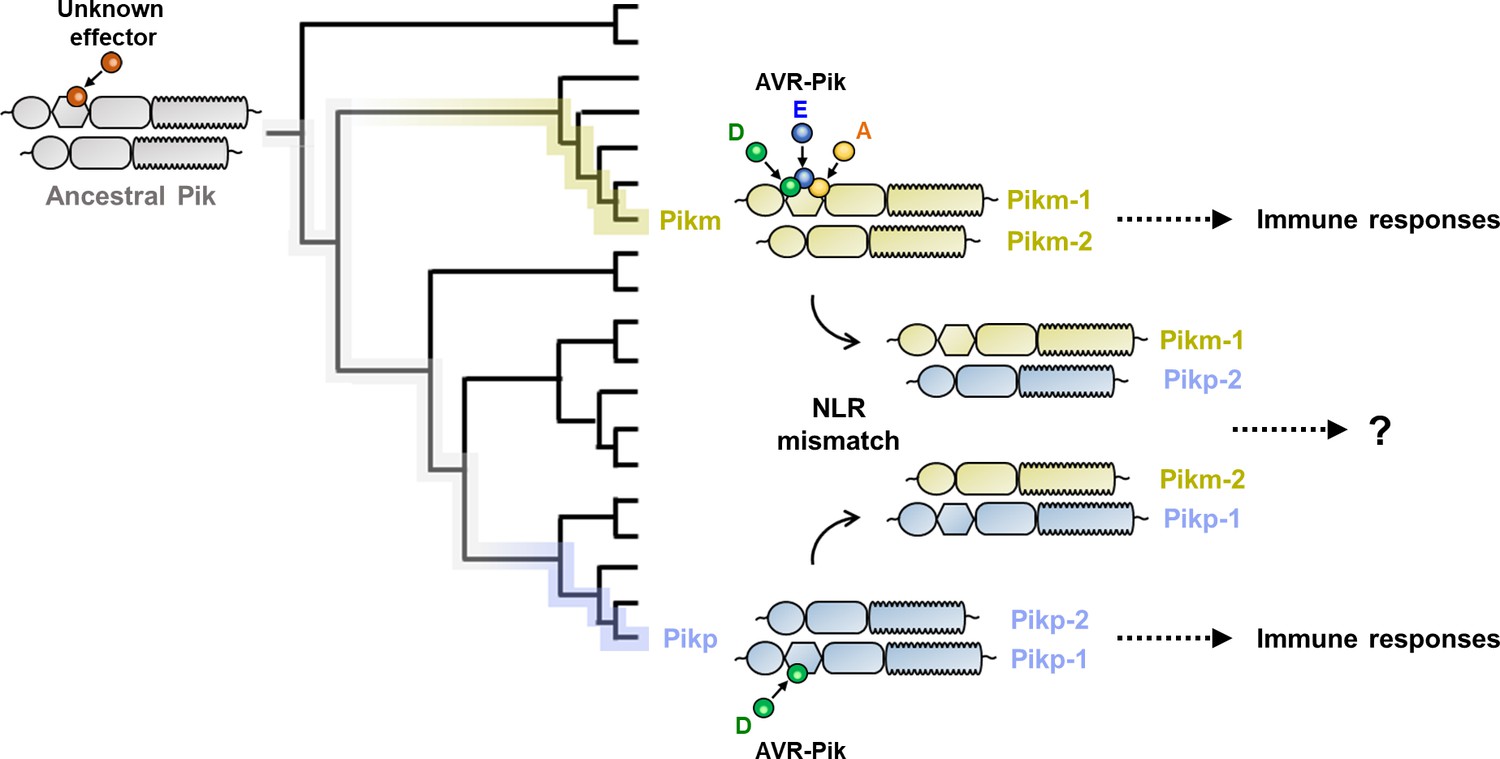
Schematic representation of the hypothesis tested in this study.
Sensor NLR alleles Pikp-1 and Pikm-1 convergently evolved to bind M. oryzae AVR-Pik effectors, triggering immune responses together with their corresponding NLR pair. We tested sensor/helper specificity in Pikp and Pikm pairs by mismatching allelic receptor and measuring immune response outcomes.
Figure 1—figure supplement 2
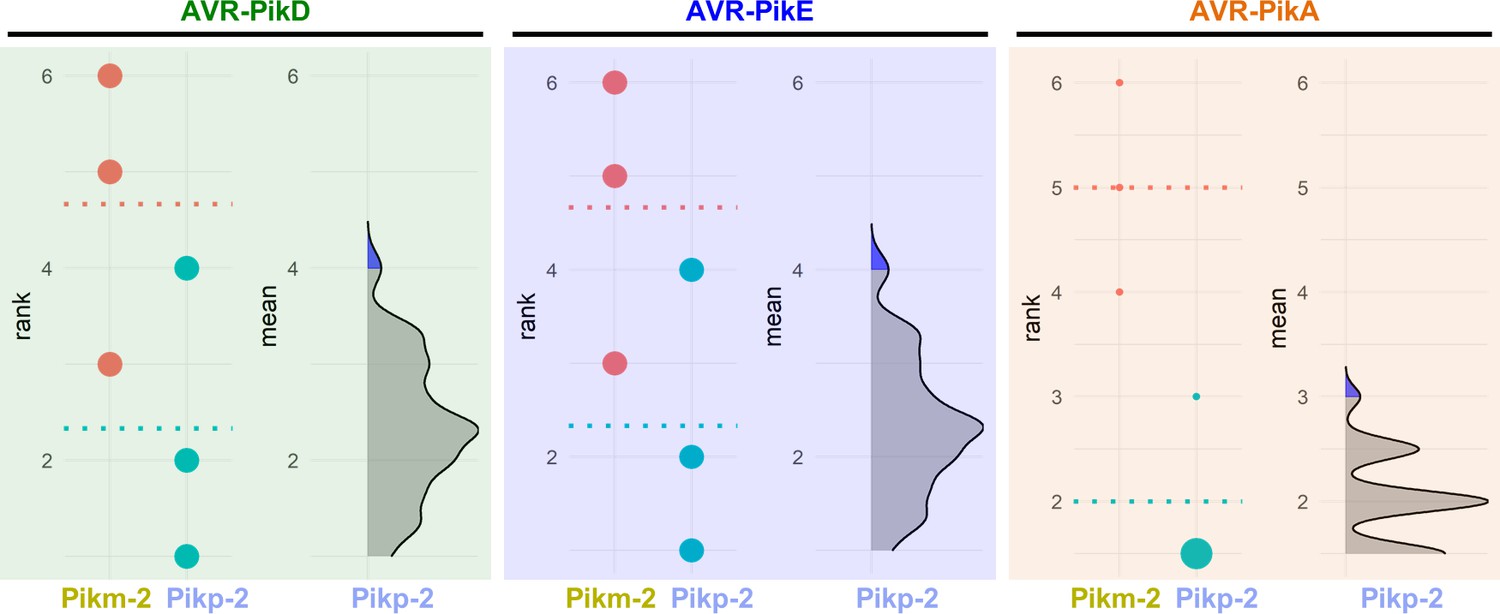
Estimation graphics for comparison of cell death mediated by Pikm-1 when co-expressed with Pikm-2 or Pikp-2.
Statistical analysis by estimation methods of the cell death assay for Pikm-1 co-expressed with Pikm-2 or Pikp-2 and AVR-PikD, AVR-PikE, or AVR-PikA. For each effector, the panel on the left represents the ranked data (dots) for each NLR and their corresponding mean (dotted line). The size of the dots is proportional to the number of observations with that specific value. The panel on the right shows the distribution of 1000 bootstrap sample rank means for Pikm-1 paired with Pikp-2. The blue areas represent the 0.025 and 0.975 percentiles of the distribution. Pikm-1-mediated responses with Pikm-2 or Pikp-2 are considered significantly different if the Pikm-2 rank mean (dotted line, left panel) falls beyond the blue regions of the Pikp-2 mean distribution.
Figure 1—figure supplement 3
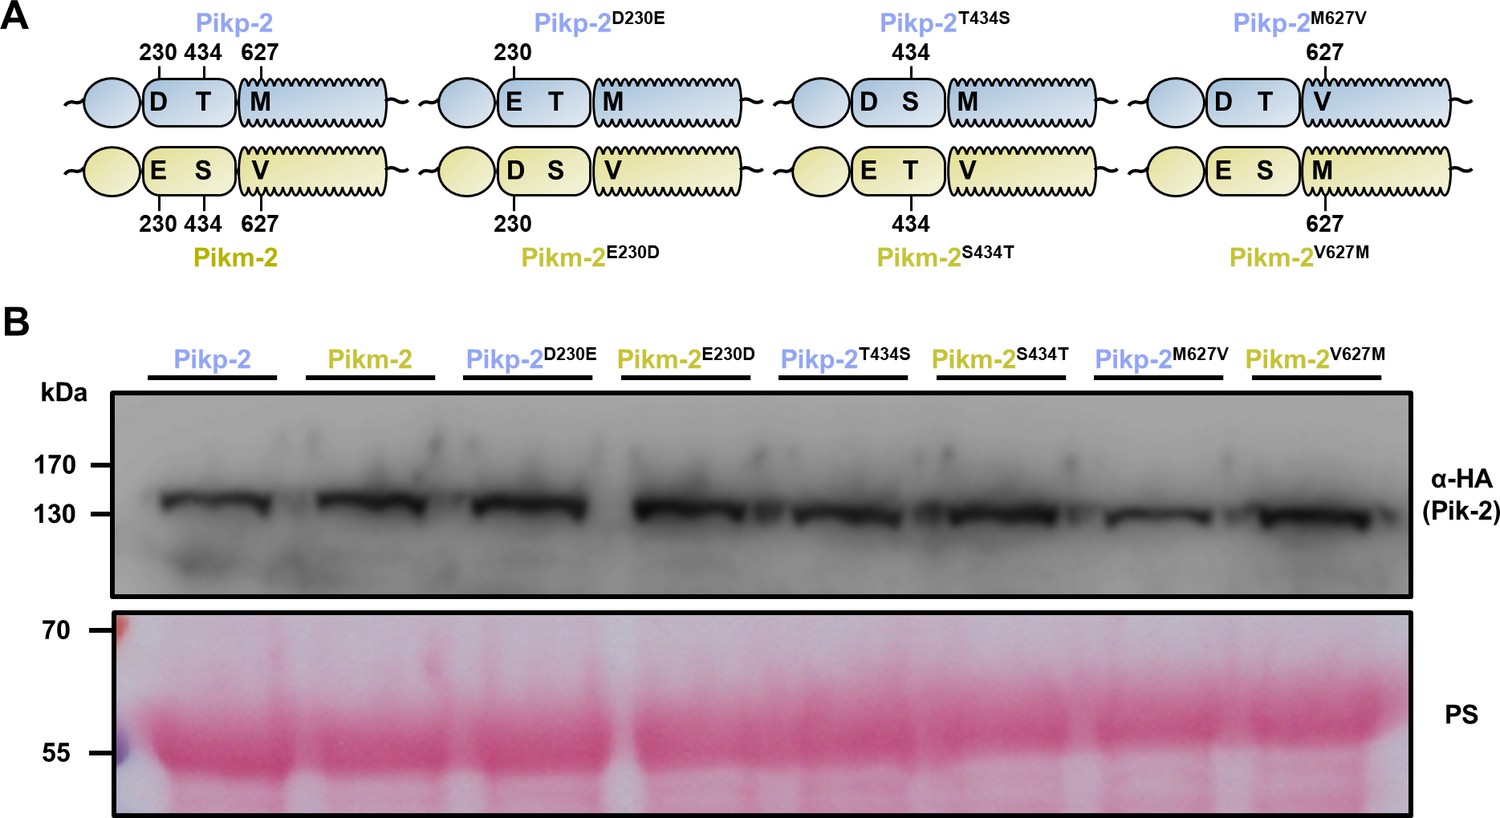
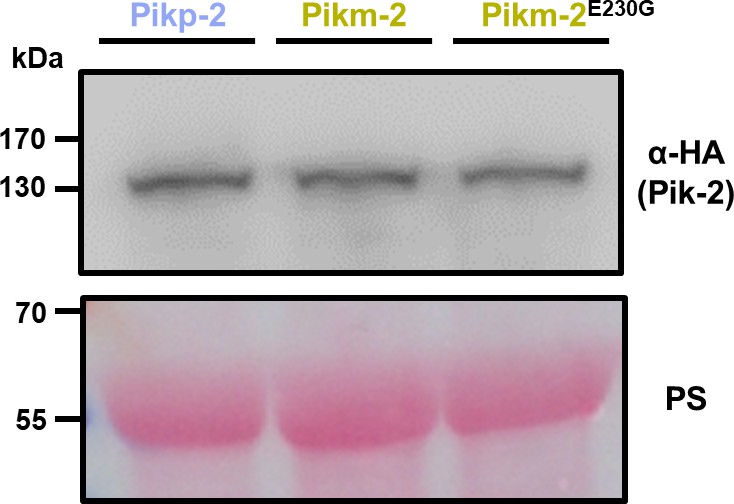
The Pik-2 alleles and mutants have similar levels of protein accumulation in planta.
(A) Schematic representations of polymorphism distribution in the Pik-2 allelic NLRs and their mutants. Polymorphic sites are numbered. (B) Western blots showing accumulation of wild-type Pikp-2 and Pikm-2 and point mutants. C-terminally 6×HA tagged Pik-2 proteins were transiently expressed in N. benthamiana. Total protein extracts were probed with α-HA antisera. Total protein loading is shown by Ponceau staining (PS).
Figure 2 with 4 supplements

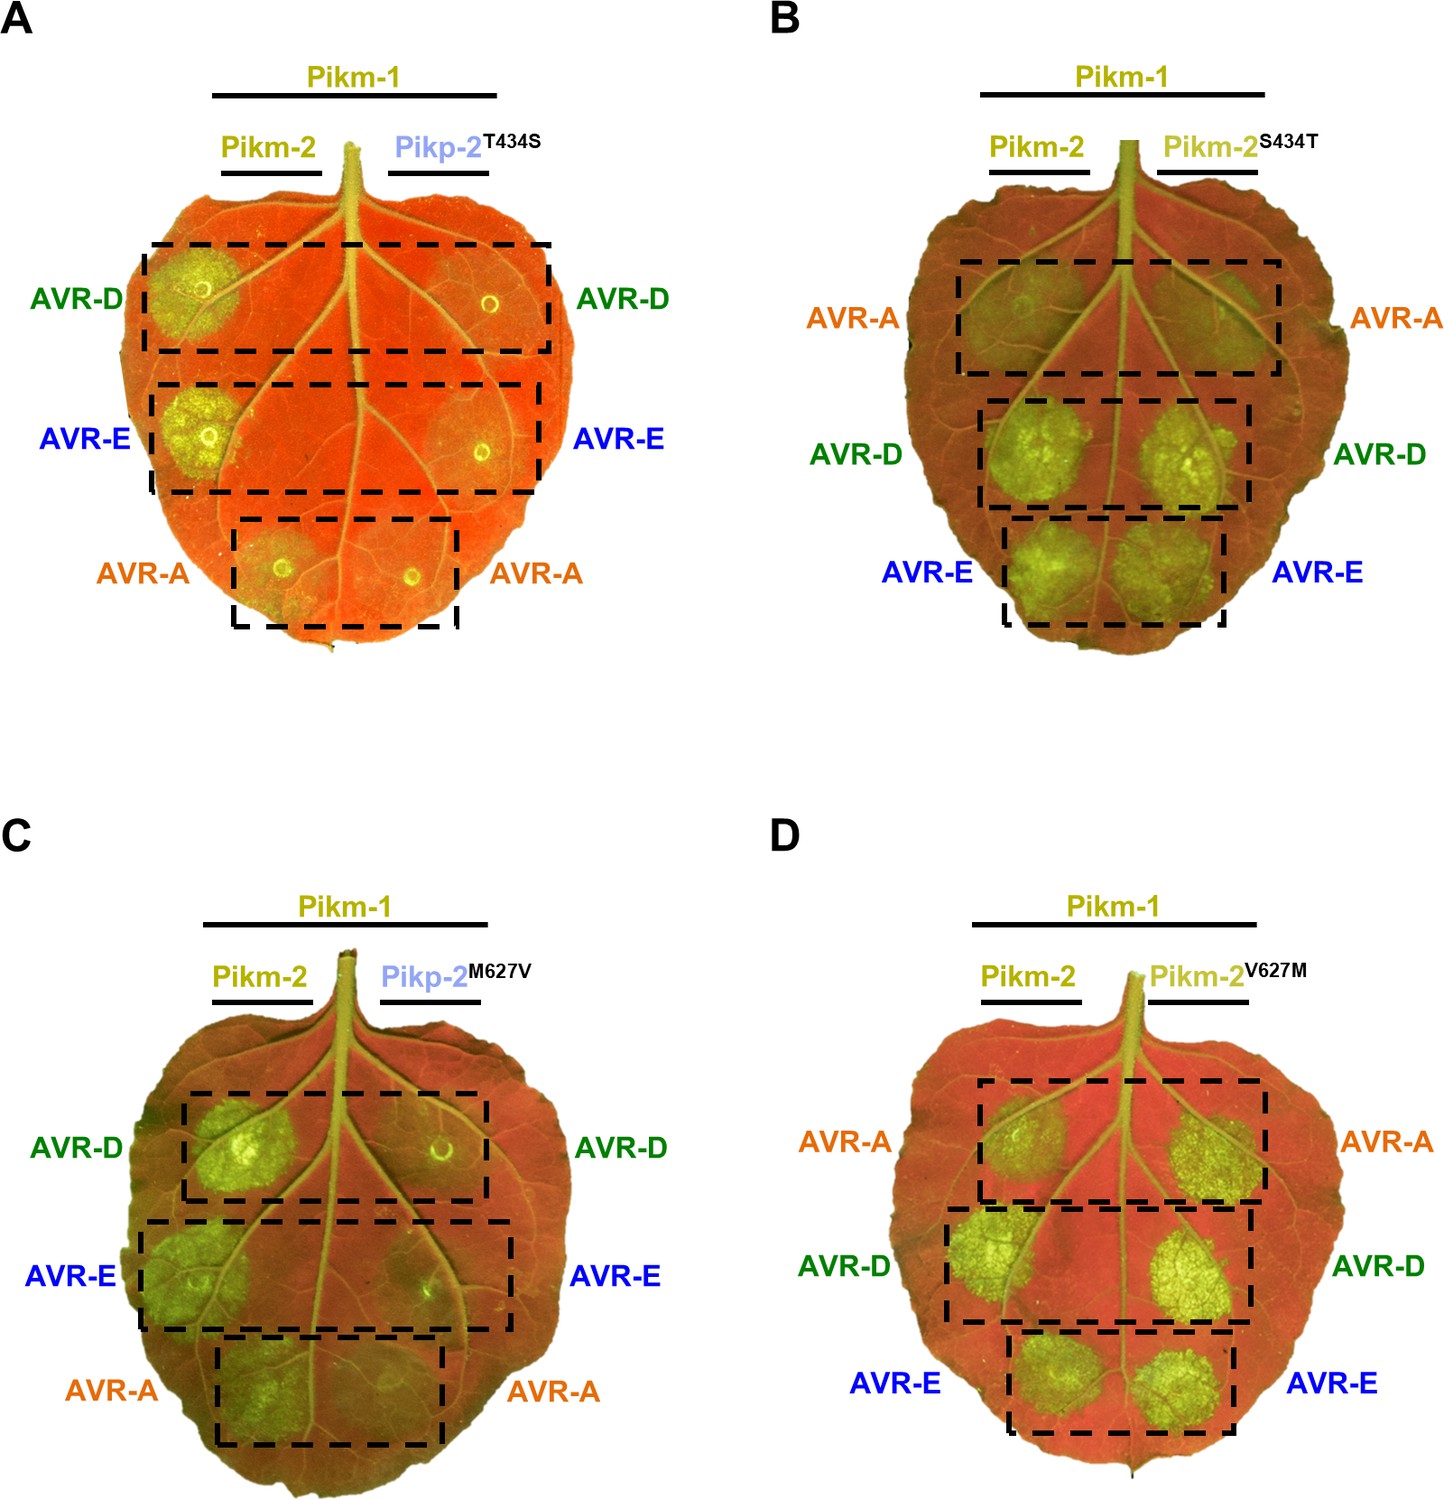
A single Pik-2 polymorphism modulates the cell death response to the AVR-Pik effectors.
Representative leaves depicting cell death mediated by Pik-2 mutants as autofluorescence under UV light. Pikm-1 was co-expressed with either (A) Pikp-2 Asp230Glu or (B) Pikm-2 Glu230Asp and AVR-PikD (AVR-D), AVR-PikE (AVR-E), or AVR-PikA (AVR-A). Side-by-side infiltrations with Pikm NLR pair are highlighted with dashed boxes for comparison. Cell death scoring is represented as dot plots. The number of repeats was 30. For each sample, all the data points are represented as dots with a distinct colour for each of the three biological replicates; these dots are jittered about the cell death score for visualization purposes. The size of the central dot at each cell death value is proportional to the number of replicates of the sample with that score. Significant differences between relevant conditions are marked with an asterisk, and the details of the statistical analysis are summarized in Figure 2—figure supplement 1.
-
Figure 2—source data 1
HR scores used for dot plots and statistics (Pikm2 E230D).
- https://cdn.elifesciences.org/articles/71662/elife-71662-fig2-data1-v2.csv
-
Figure 2—source data 2
HR scores used for dot plots and statistics (Pikm2 D230E).
- https://cdn.elifesciences.org/articles/71662/elife-71662-fig2-data2-v2.csv
Figure 2—figure supplement 1
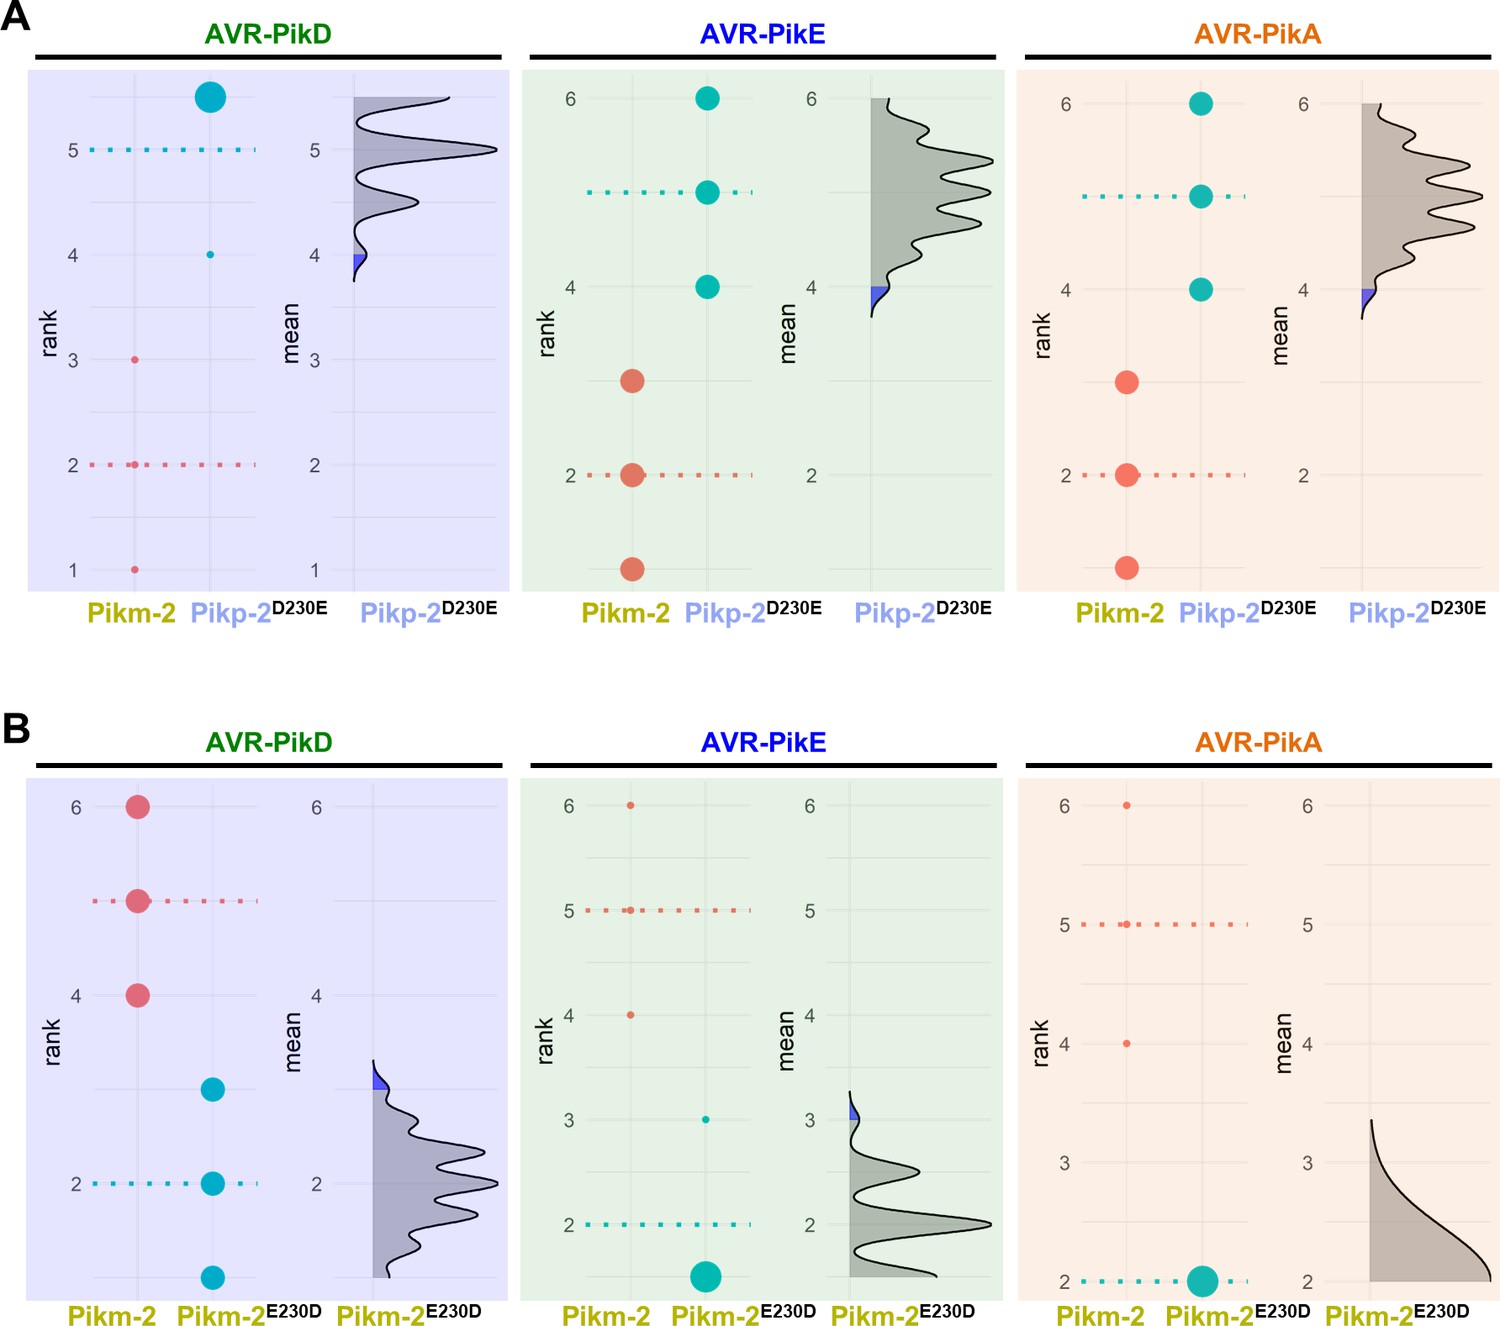
Estimation graphics for comparison of cell death mediated by Pikm-1 when co-expressed with the Pikm-2 or Pik-2 mutants in the polymorphic position 230.
Statistical analysis by estimation methods of the cell death assay for Pikm-1 co-expressed with (A) Pikp-2 Asp230Glu or (B) Pikm-2 Glu230Asp and AVR-PikD, AVR-PikE, or AVR-PikA compared with wild-type Pikm-2. For each effector, the panel on the left represents the ranked data (dots) for each NLR and their corresponding mean (dotted line). The size of the dots is proportional to the number of observations with that specific value. The panel on the right shows the distribution of 1000 bootstrap sample rank means for Pikm-1 paired with a Pik-2 mutant. The blue areas represent the 0.025 and 0.975 percentiles of the distribution. Pikm-1-mediated responses with Pikm-2 or Pik-2 mutants are considered significantly different if the Pikm-2 rank mean (dotted line, left panel) falls beyond the blue regions in the mean distribution of the Pik-2 mutants.
Figure 2—figure supplement 2
Representative images of cell death mediated by the Pik-2 mutants in response to the AVR-Pik effectors.
Representative leaves depicting cell death mediated by Pik-2 mutants as autofluorescence under UV light. Pikm-1 was co-expressed with either (A) Pikp-2 Asp230Glu, (B) Pikm-2 Glu230Asp, (C) Pikp-2 Asp230Glu, and (D) Pikm-2 Glu230Asp and AVR-PikD (AVR-D), AVR-PikE (AVR-E), or AVR-PikA (AVR-A). Side-by-side infiltrations with the Pikm NLR pair are highlighted with dashed boxes for comparison.
Figure 2—figure supplement 3
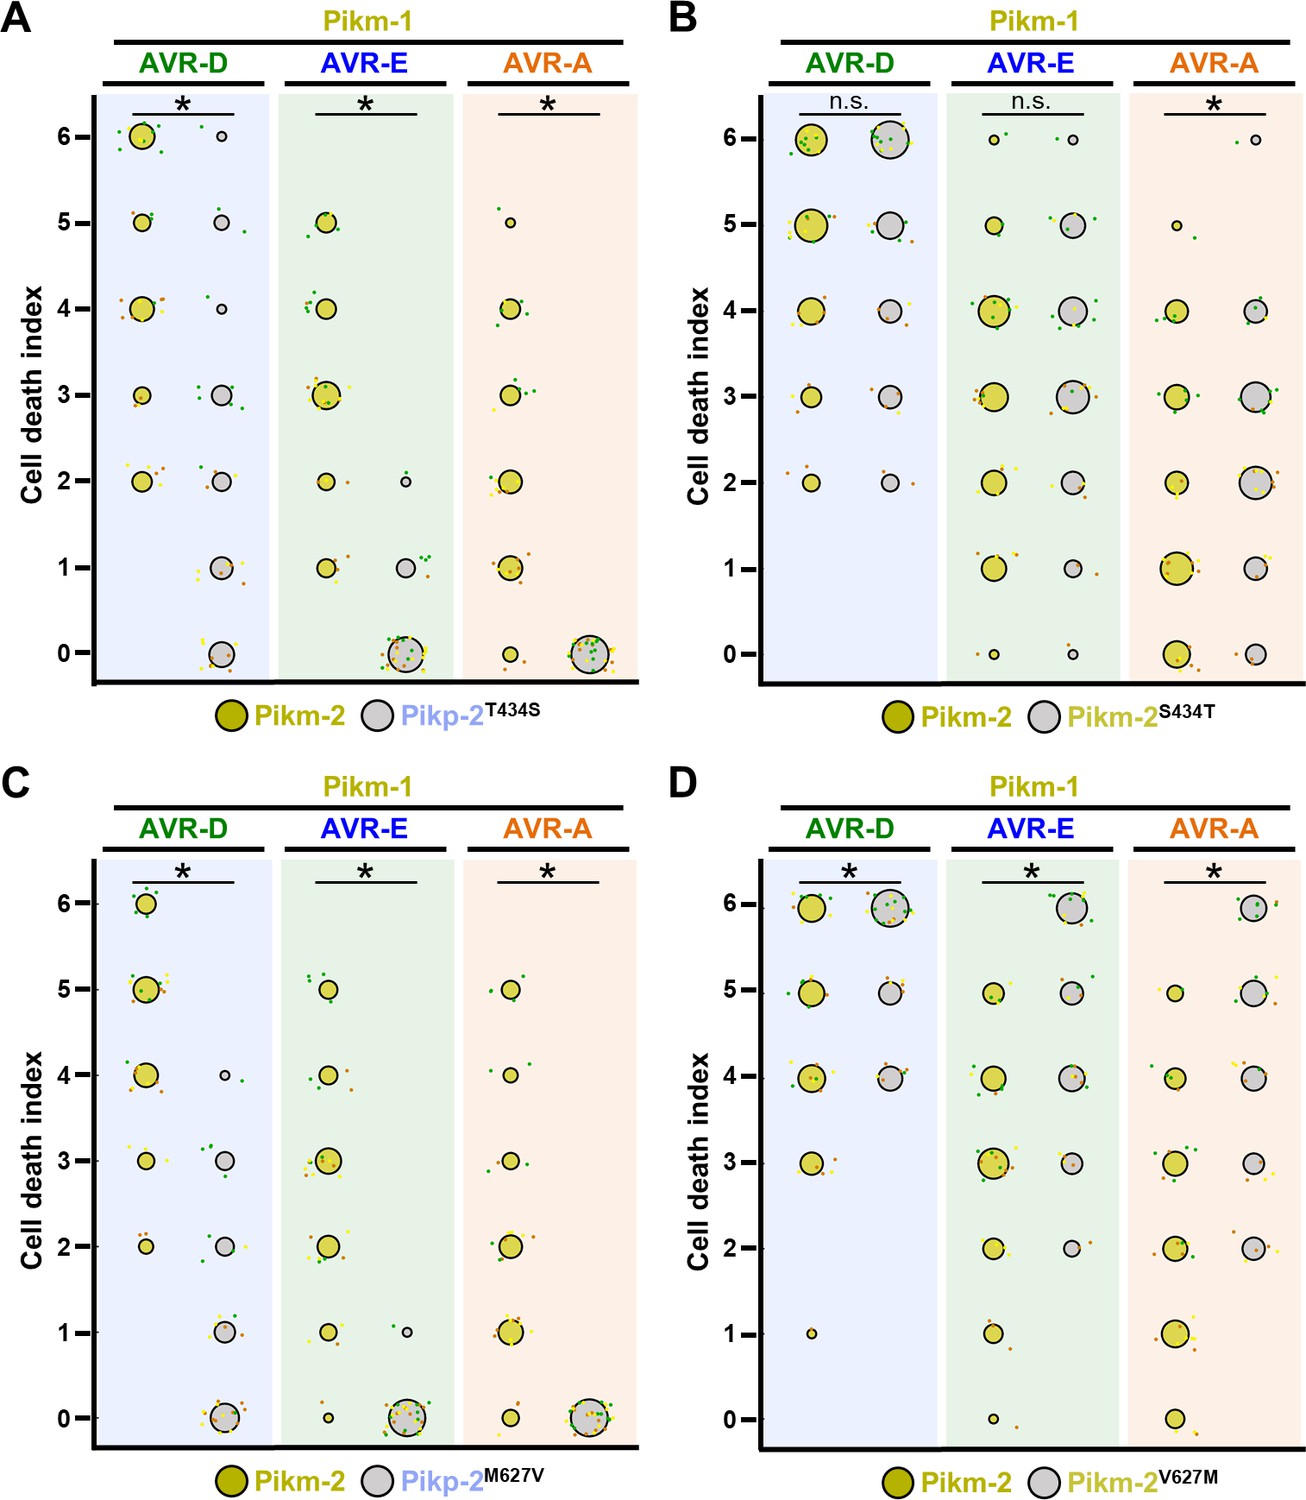
Quantification of cell death mediated by the Pik-2 mutants in response to AVR-Pik effectors.
Cell death scoring is represented as dot plots comparing cell death triggered by the Pik-2 mutants (A) Pikp-2 Thr434Ser, (B) Pikm-2 Ser434Thr, (C) Pikp-2 Met627Val, and (D) Pikm-2 Val627Met. The mutants were co-expressed with Pikm-1 and AVR-PikD, AVR-PikE, or AVR-PikA. Pikm NLR pair was co-infiltrated for side-by-side comparison. The number of repeats was 30. For each sample, all the data points are represented as dots with a distinct colour for each of the three biological replicates; these dots are jittered about the cell death score for visualization purposes. The size of the central dot at each cell death value is proportional to the number of replicates of the sample with that score. Significant differences between relevant conditions are marked with an asterisk, and the details of the statistical analysis are summarized in Figure 2—figure supplement 4.
-
Figure 2—figure supplement 3—source data 1
HR scores used for dot plots and statistics (Pikm2 S434T).
- https://cdn.elifesciences.org/articles/71662/elife-71662-fig2-figsupp3-data1-v2.csv
-
Figure 2—figure supplement 3—source data 2
HR scores used for dot plots and statistics (Pikm2 V627M).
- https://cdn.elifesciences.org/articles/71662/elife-71662-fig2-figsupp3-data2-v2.csv
-
Figure 2—figure supplement 3—source data 3
HR scores used for dot plots and statistics (Pikp2 M627V).
- https://cdn.elifesciences.org/articles/71662/elife-71662-fig2-figsupp3-data3-v2.csv
-
Figure 2—figure supplement 3—source data 4
HR scores used for dot plots and statistics (Pikp2 T434S).
- https://cdn.elifesciences.org/articles/71662/elife-71662-fig2-figsupp3-data4-v2.csv
Figure 2—figure supplement 4
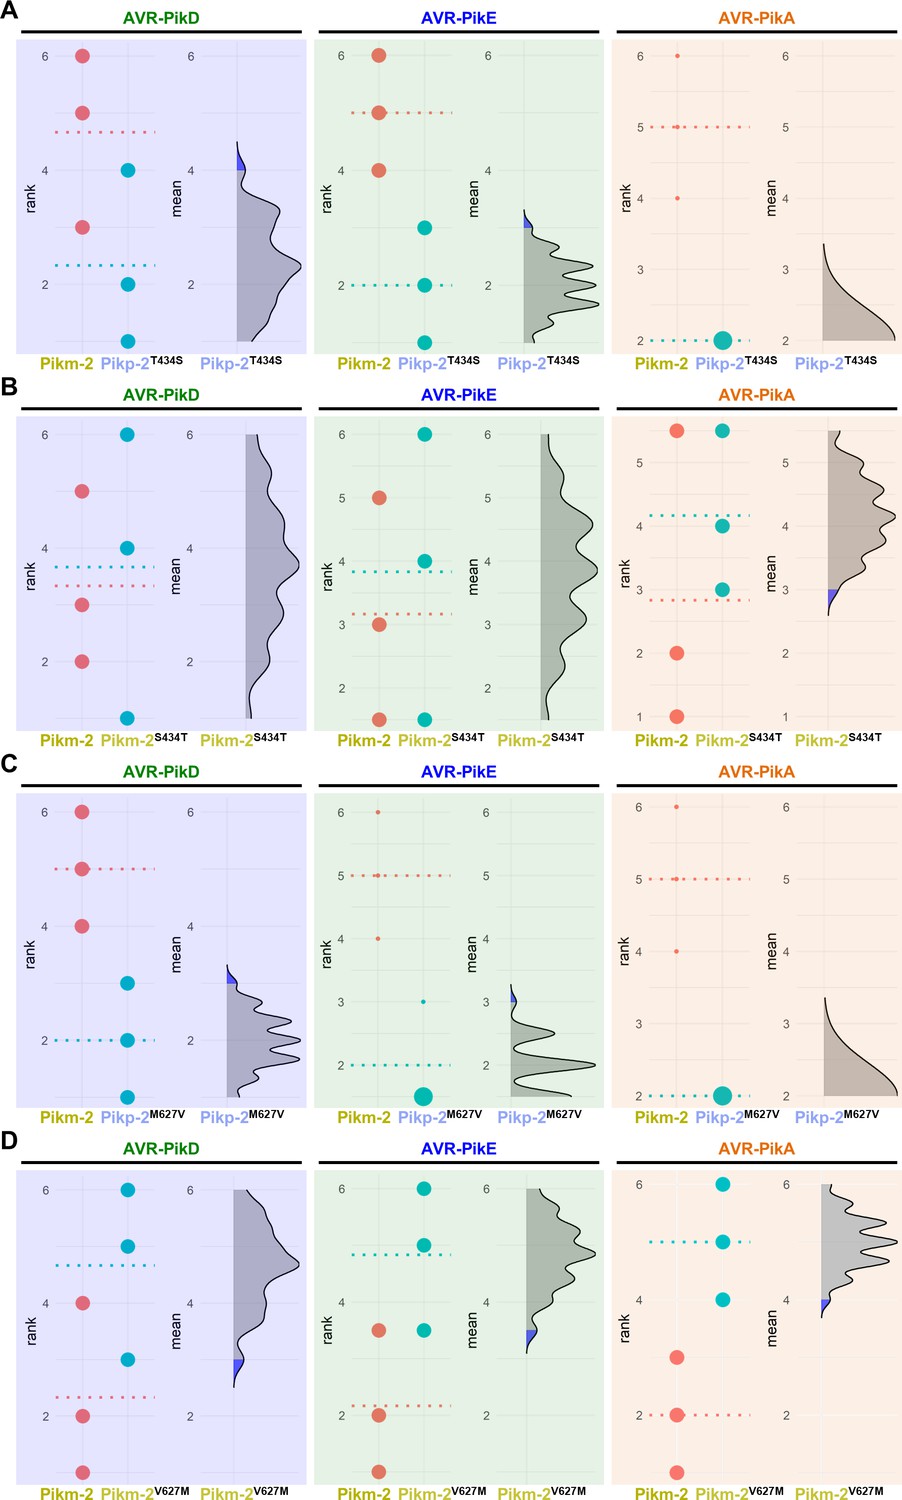
Estimation graphics for comparison of cell death mediated by Pikm-1 when co-expressed with Pikm-2 or Pik-2 mutants in polymorphic position 434 and 627.
Statistical analysis by estimation methods of the cell death assay for Pikm-1 co-expressed with (A) Pikp-2 Thr434Ser, (B) Pikm-2 Ser434Thr, (C) Pikp-2 Met627Val, or (D) Pikm-2 Val627Met and AVR-PikD, AVR-PikE, or AVR-PikA compared with wild-type Pikm-2. For each effector, the panel on the left represents the ranked data (dots) for each NLR and their corresponding mean (dotted line). The size of the dots is proportional to the number of observations with that specific value. The panel on the right shows the distribution of 1000 bootstrap sample rank means for Pikm-1 paired with a Pik-2 mutant. The blue areas represent the 0.025 and 0.975 percentiles of the distribution. Pikm-1-mediated responses with Pikm-2 or Pik-2 mutants are considered significantly different if the Pikm-2 rank mean (dotted line, left panel) falls beyond the blue regions in the mean distribution of the Pik-2 mutants.
Figure 3
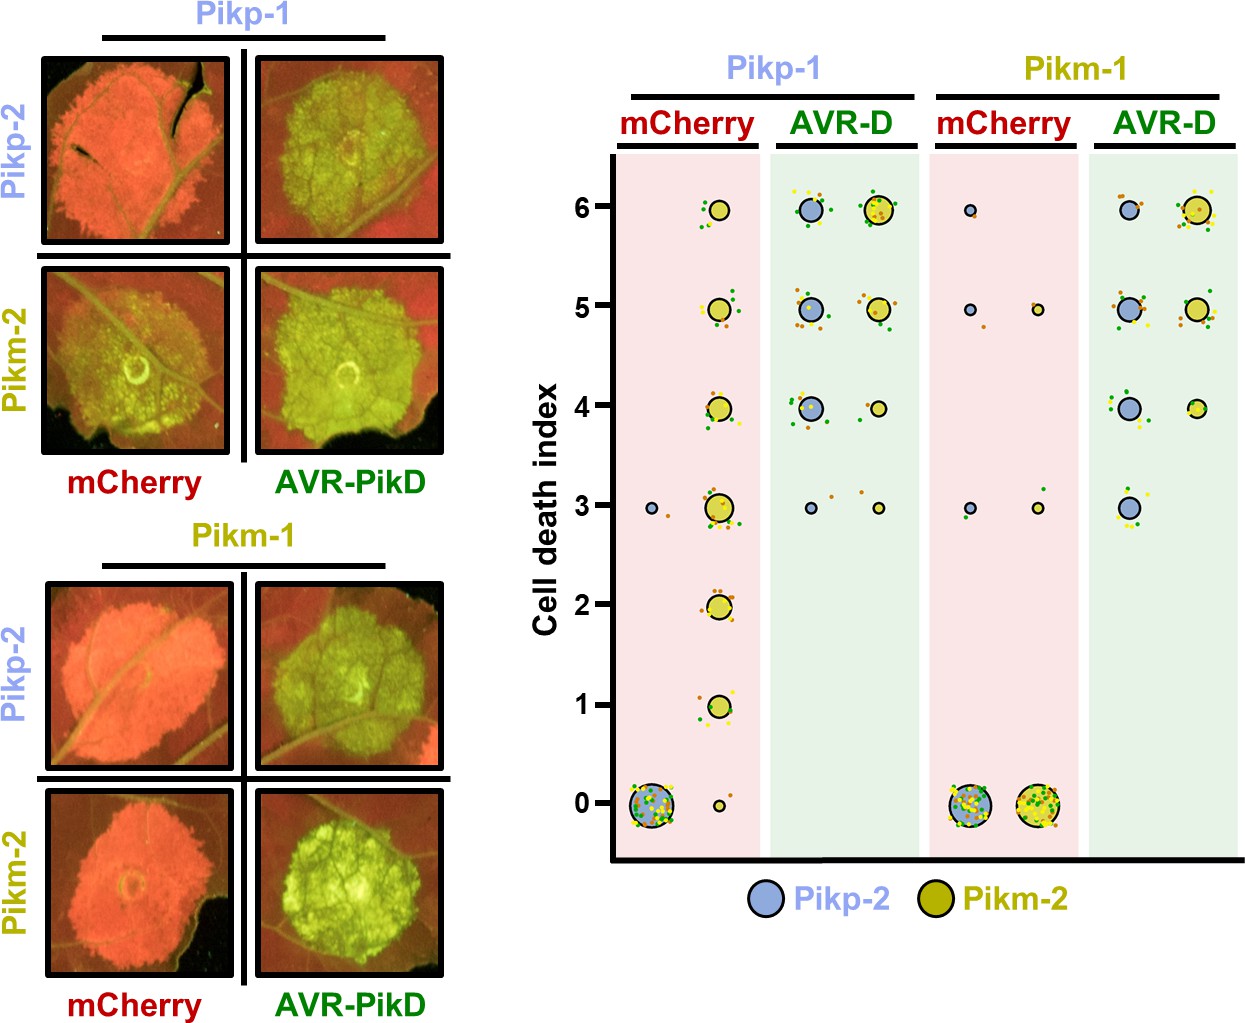
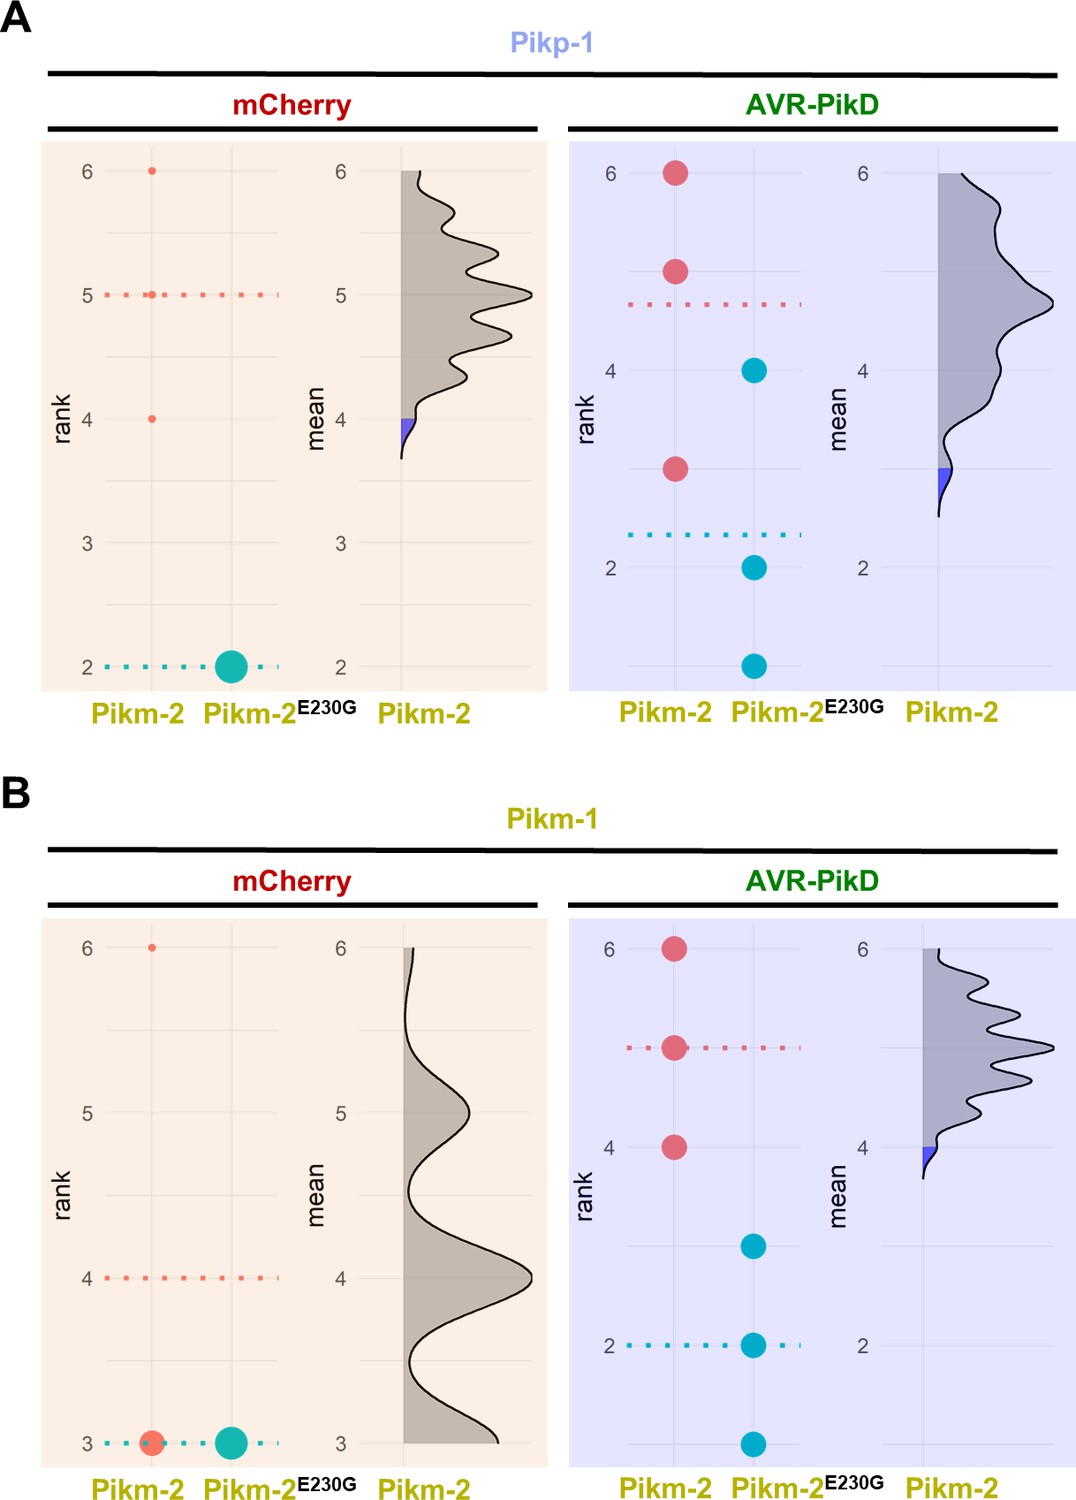
Pikm-2 triggers constitutive cell death in the presence of Pikp-1.
Representative leaf spot images and scoring of Pik-mediated cell death as autofluorescence under UV light in the presence or absence of AVR-PikD. Cell death assay scoring represented as dot plots comparing cell death triggered by Pikp-2 and Pikm-2 when co-expressed with Pikp-1 or Pikm-1. The number of repeats was 60 and 30 for the spots co-infiltrated with mCherry and AVR-PikD, respectively. For each sample, all the data points are represented as dots with a distinct colour for each of the three biological replicates; these dots are jittered about the cell death score for visualization purposes. The size of the central dot at each cell death value is proportional to the number of replicates of the sample with that score.
-
Figure 3—source data 1
HR scores used for dot plots.
- https://cdn.elifesciences.org/articles/71662/elife-71662-fig3-data1-v2.csv
Figure 4
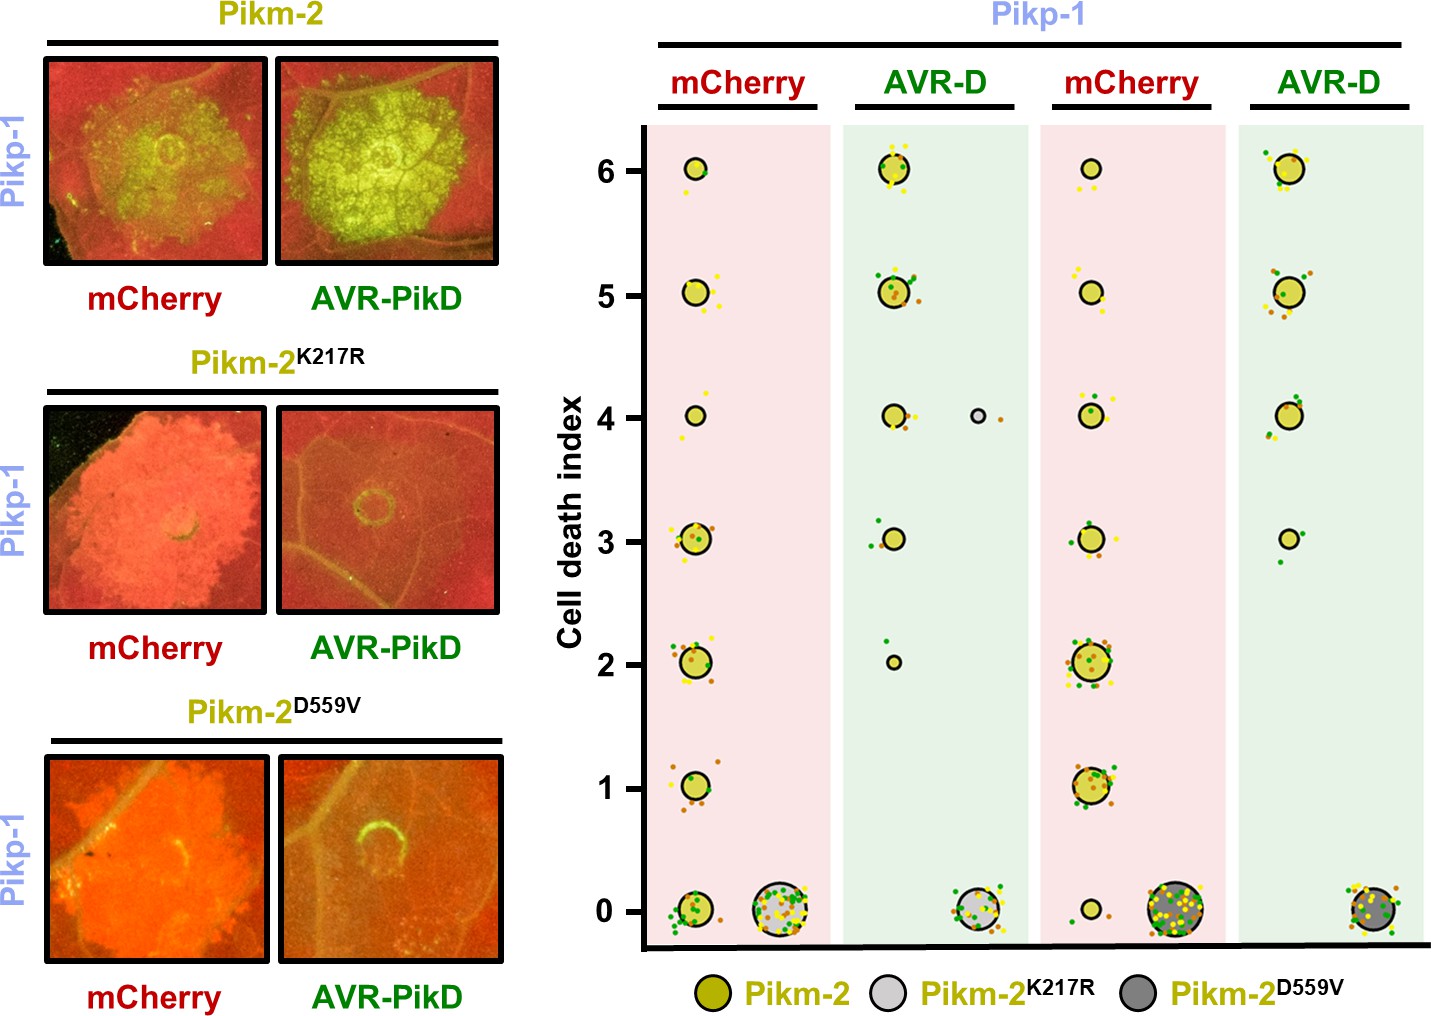
Constitutive cell death in mismatched Pik pairs is dependent on P-loop and MHD motifs.
Representative leaf spot images and scoring of Pikm-2-mediated cell death as autofluorescence under UV light. Cell death scoring is represented as dot plots comparing cell death triggered by Pikm-2 mutant in P-loop (Lys217Arg) and MHD (Asp559Val) motifs and wild-type Pikm-2. Mutants and wild-type proteins were co-expressed with Pikp-1 and mCherry (red panel) or AVR-PikD (green panel). The number of repeats was 60 and 30 for the spots co-infiltrated with mCherry and AVR-PikD, respectively. For each sample, all the data points are represented as dots with a distinct colour for each of the three biological replicates; these dots are jittered about the cell death score for visualization purposes. The size of the central dot at each cell death value is proportional to the number of replicates of the sample with that score.
-
Figure 4—source data 1
HR scores used for dot plots (P-loop).
- https://cdn.elifesciences.org/articles/71662/elife-71662-fig4-data1-v2.csv
-
Figure 4—source data 2
HR scores used for dot plots (MHD).
- https://cdn.elifesciences.org/articles/71662/elife-71662-fig4-data2-v2.csv
Figure 5 with 4 supplements
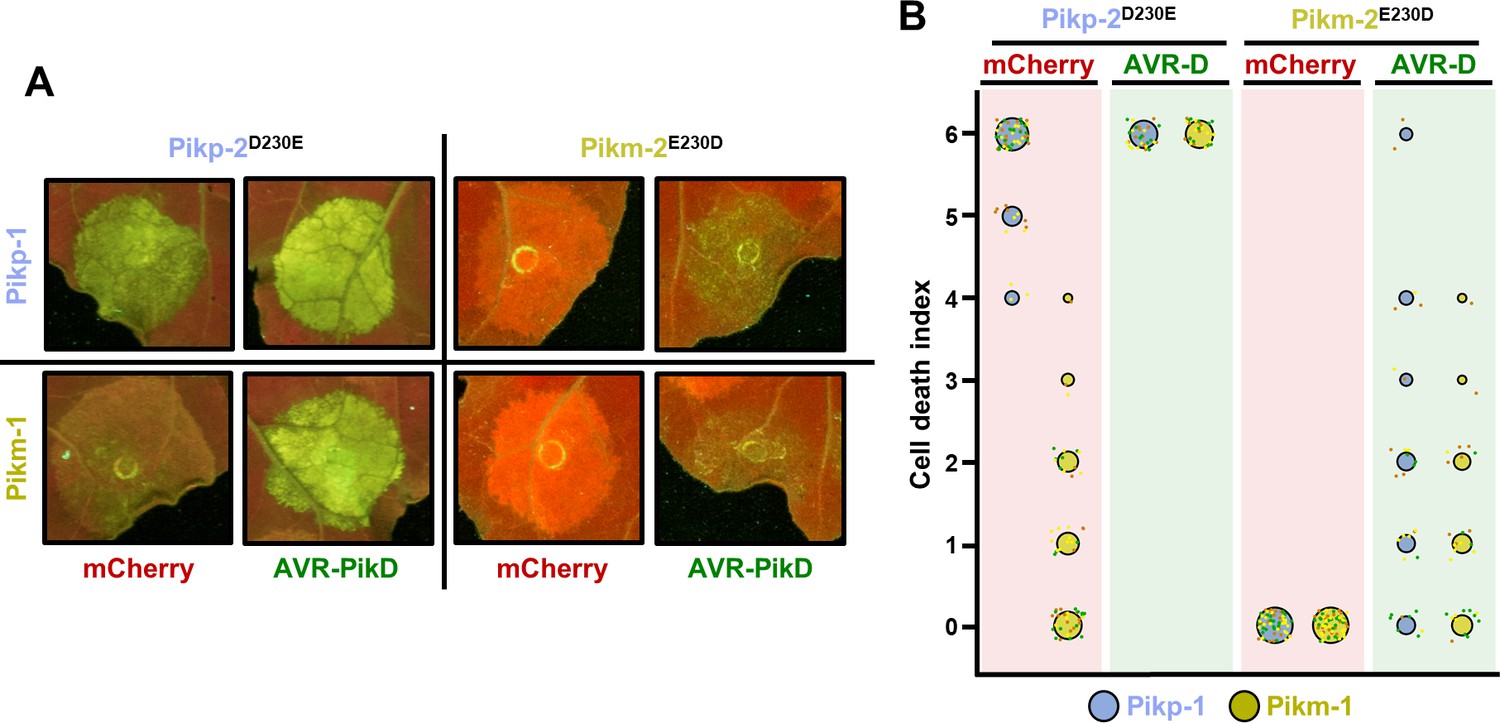
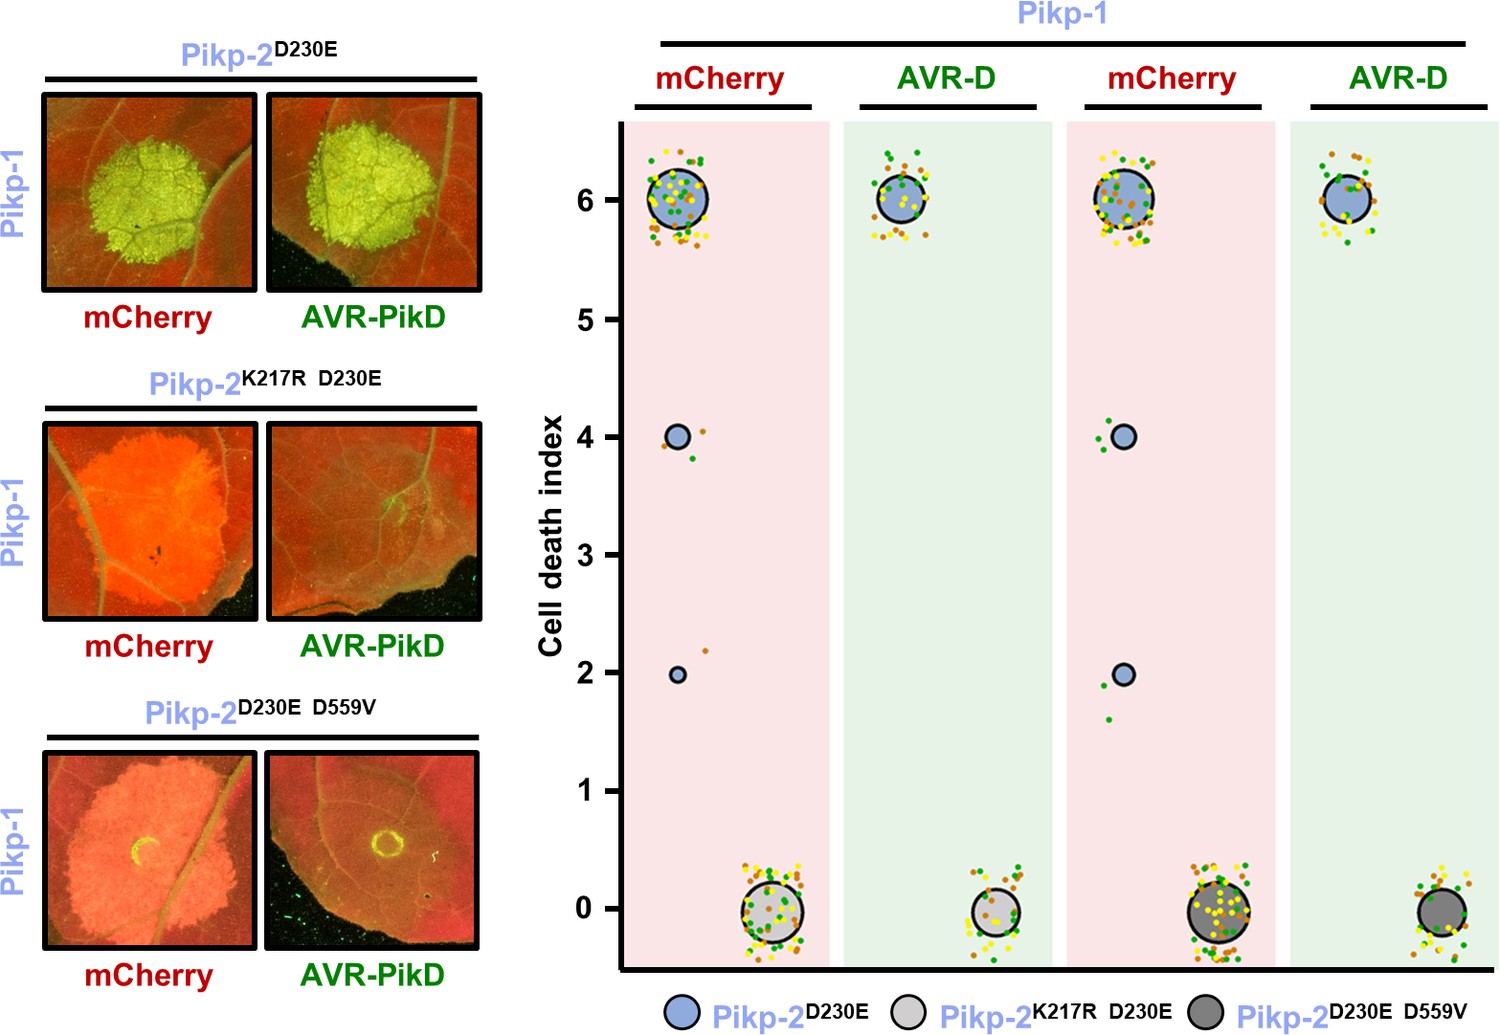
Polymorphism at position 230 in the NB-ARC domain is a Pik-2 determinant for constitutive cell death.
(A) Representative leaf spot images and scoring of cell death mediated by Pik-2 as autofluorescence under UV light. (B) Cell death scoring is represented as dot plots comparing cell death triggered by Pik-2 mutants at polymorphic positions 230. Pik-2 mutants were co-expressed with Pikp-1 (blue dots) or Pikm-1 (yellow dots) together with mCherry (red panel) or AVR-PikD (green panel). The number of repeats was 60 and 30 for the spots co-infiltrated with mCherry and AVR-PikD, respectively. For each sample, all the data points are represented as dots with a distinct colour for each of the three biological replicates; these dots are jittered about the cell death score for visualization purposes. The size of the central dot at each cell death value is proportional to the number of replicates of the sample with that score.
-
Figure 5—source data 1
HR scores used for dot plots.
- https://cdn.elifesciences.org/articles/71662/elife-71662-fig5-data1-v2.csv
Figure 5—figure supplement 1
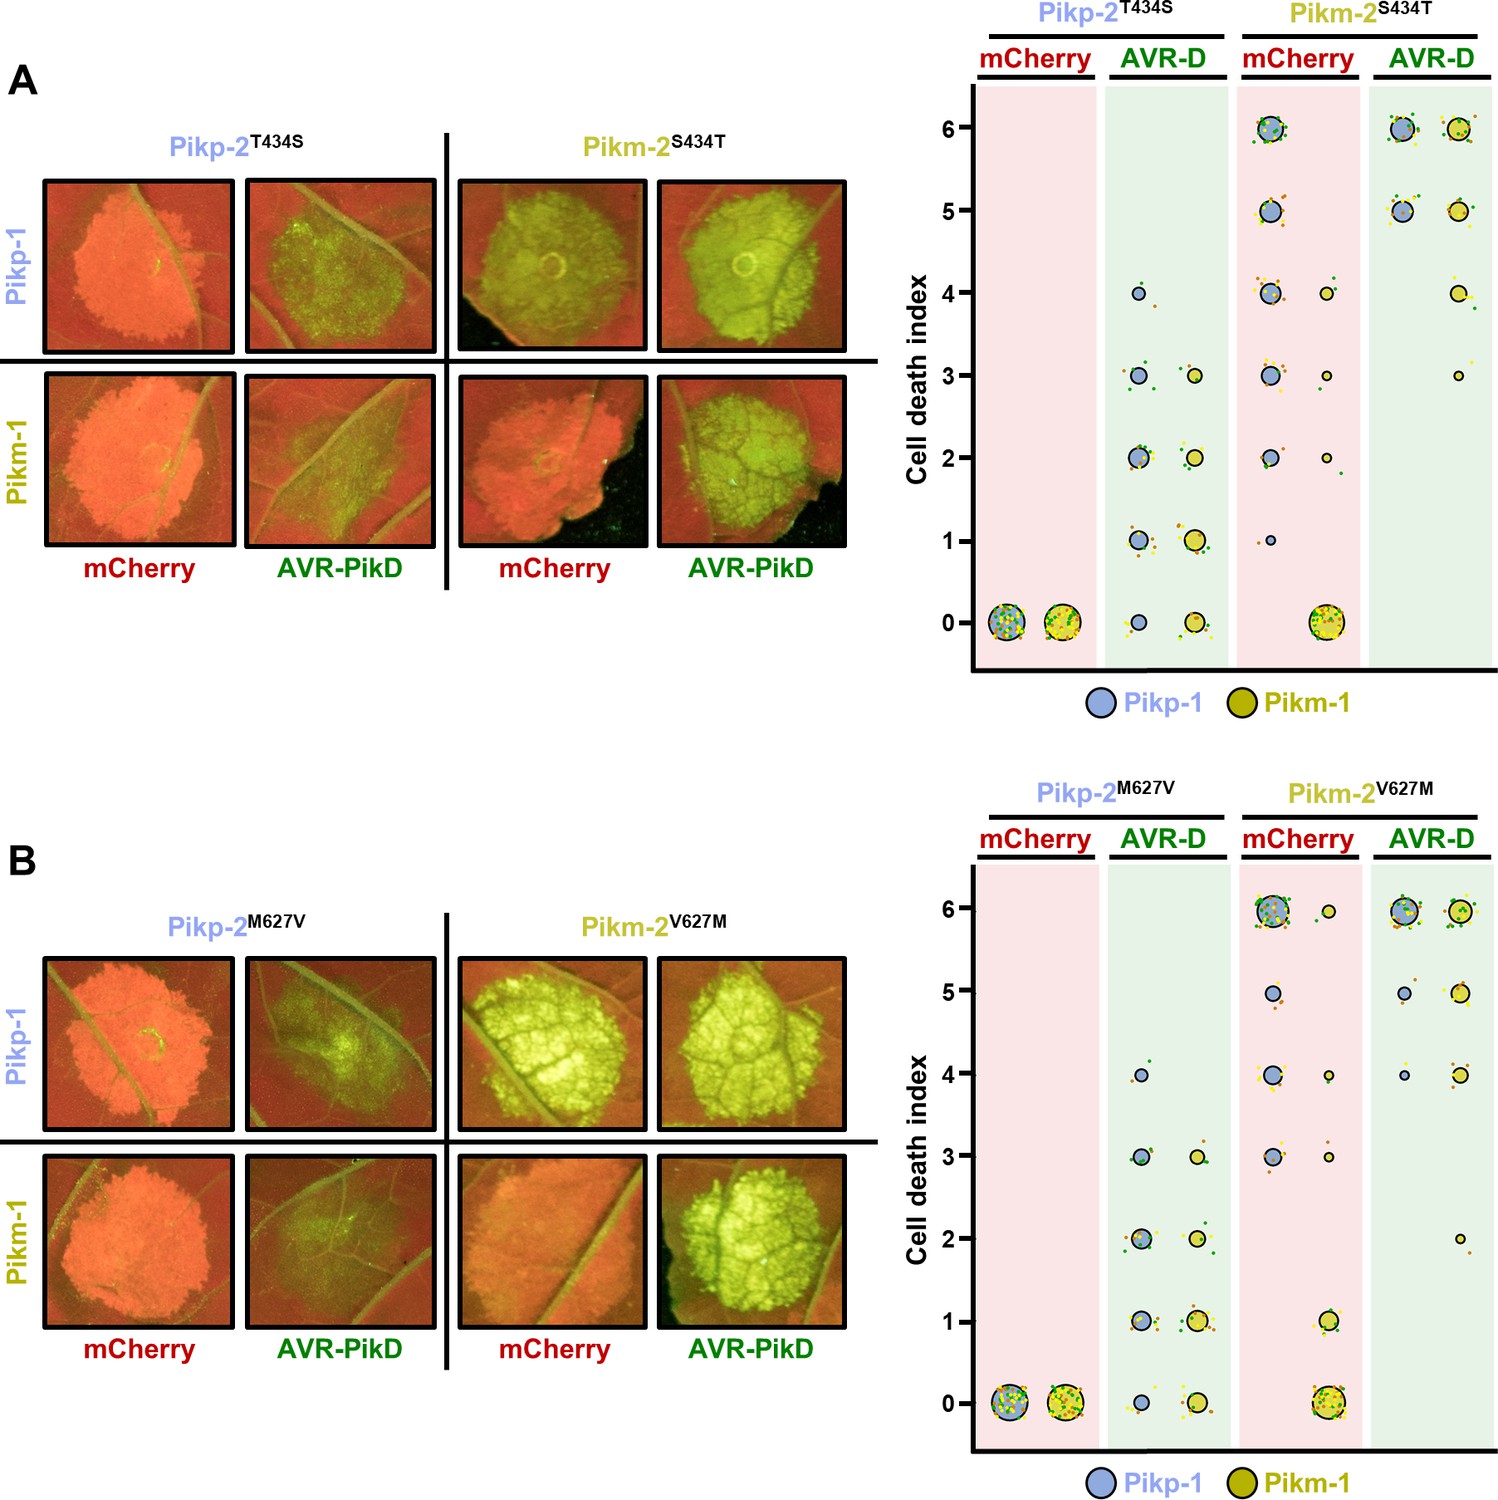
The Pik-2 polymorphisms at positions 434 and 627 do not alter constitutive cell death.
Representative leaf spot images and scoring of cell death mediated by Pik-2 as autofluorescence under UV light. Cell death scoring is represented as dot plots comparing cell death triggered by Pik-2 mutants at polymorphic positions (A) 434 and (B) 627. Pik-2 mutants were co-expressed with Pikp-1 (blue dots) or Pikm-1 (yellow dots) together with mCherry (red panel) or AVR-PikD (green panel). The number of repeats was 60 and 30 for the spots co-infiltrated with mCherry and AVR-PikD, respectively. For each sample, all the data points are represented as dots with a distinct colour for each of the three biological replicates; these dots are jittered about the cell death score for visualization purposes. The size of the central dot at each cell death value is proportional to the number of replicates of the sample with that score.
-
Figure 5—figure supplement 1—source data 1
HR scores used for dot plots.
- https://cdn.elifesciences.org/articles/71662/elife-71662-fig5-figsupp1-data1-v2.csv
-
Figure 5—figure supplement 1—source data 2
HR scores used for dot plots.
- https://cdn.elifesciences.org/articles/71662/elife-71662-fig5-figsupp1-data2-v2.csv
Figure 5—figure supplement 2
Pikp-2 Asp230Glu autoactivation is dependent on P-loop and MHD motifs.
Representative leaf spot images and scoring of Pikm-2-mediated cell death as autofluorescence under UV light. Cell death scoring is represented as dot plots comparing cell death triggered by Pikp-2 Asp230Glu mutant and its versions mutated in P-loop (Lys217Arg) and MHD (Asp559Val) motifs. Pik-2 mutants were co-expressed with Pikp-1 and mCherry (red panel) or AVR-PikD (green panel). The number of repeats was 60 and 30 for the spots co-infiltrated with mCherry and AVR-PikD, respectively. For each sample, all the data points are represented as dots with a distinct colour for each of the three biological replicates; these dots are jittered about the cell death score for visualization purposes. The size of the central dot at each cell death value is proportional to the number of replicates of the sample with that score.
-
Figure 5—figure supplement 2—source data 1
HR scores used for dot plots.
- https://cdn.elifesciences.org/articles/71662/elife-71662-fig5-figsupp2-data1-v2.csv
Figure 5—figure supplement 3
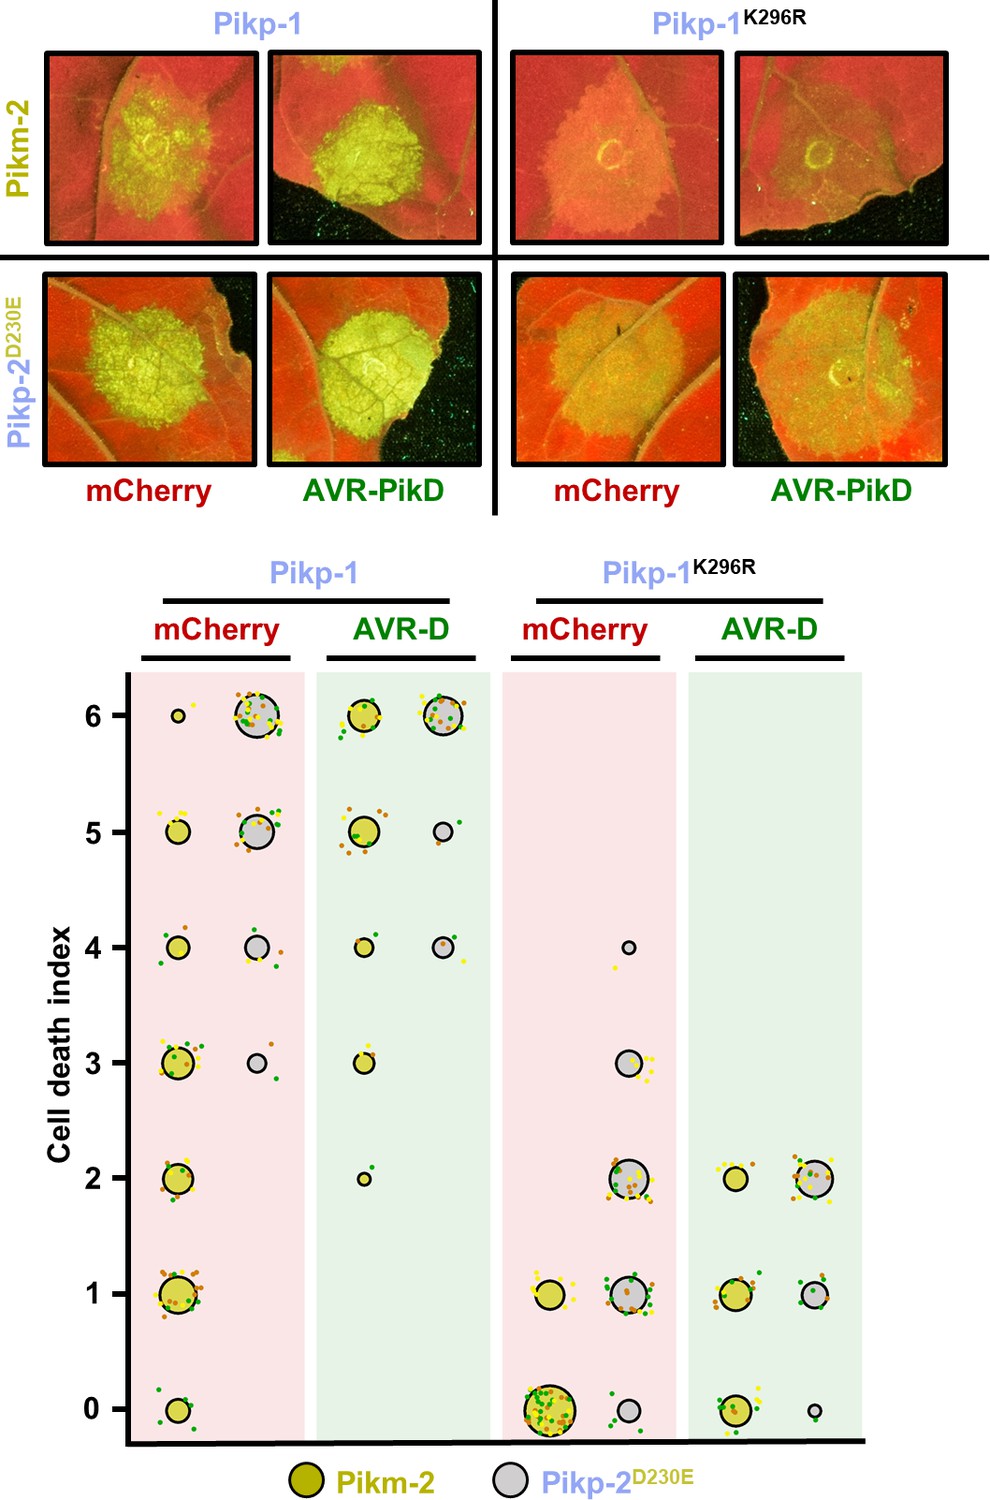
The Pik-1 P-loop motif is important but not essential for Pik-mediated cell death.
Representative leaf spot images and scoring of Pik-mediated cell death as autofluorescence under UV light. Cell death scoring is represented as dot plots comparing cell death triggered by Pikm-2 or Pikp-2 Asp230Glu in the presence of wild-type Pikp-1 or a version mutated in the P-loop motif (Lys296Arg). The different NLR pair combinations were co-infiltrated with mCherry (red panel) or AVR-PikD (green panel). The number of repeats was 60 and 30 for the spots co-infiltrated with mCherry and AVR-PikD, respectively. For each sample, all the data points are represented as dots with a distinct colour for each of the three biological replicates; these dots are jittered about the cell death score for visualization purposes. The size of the central dot at each cell death value is proportional to the number of replicates of the sample with that score.
-
Figure 5—figure supplement 3—source data 1
HR scores used for dot plots.
- https://cdn.elifesciences.org/articles/71662/elife-71662-fig5-figsupp3-data1-v2.csv
Figure 5—figure supplement 4
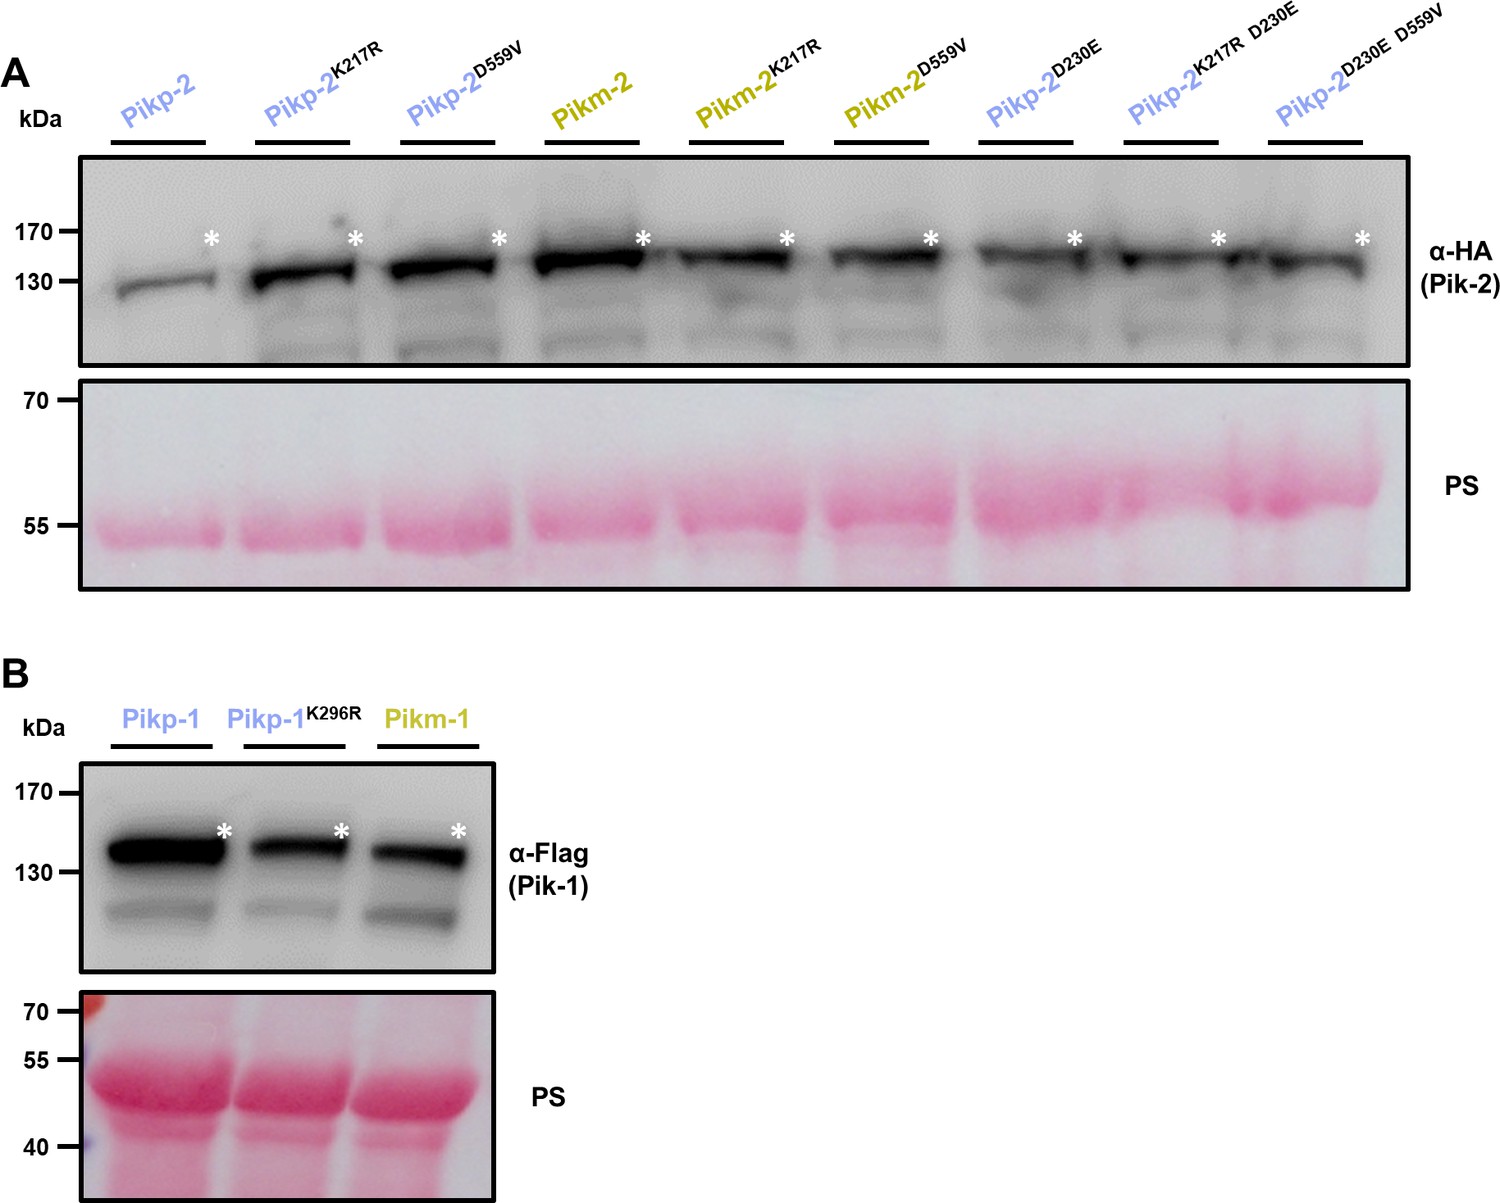
Mutations in P-loop and MHD motifs do not affect protein accumulation.
Western blots showing accumulation of (A) P-loop (Lys217R) and MHD (Asp559Val) mutants in the background of Pikp-2, Pikm-2, and Pikp-2 Asp230Glu. C-terminally 6×HA tagged Pik-2 mutants were transiently expressed in N. benthamiana. C-terminally 6×HA tagged Pikp-2, Pikm-2, and Pikp-2 Asp230Glu are included as controls in each case. (B) Pikp-1 P-loop (Lys296R) mutant. C-terminally 6×His/3×FLAG tagged Pikp-1 Lys296Arg mutant was transiently expressed in N. benthamiana. C-terminally 6×His/3×FLAG tagged wild-type Pikp-1 and Pikm-1 are included as controls (left and right, respectively). Total protein extracts were probed α-HA and α-FLAG antisera for (A) and (B), respectively. Asterisks mark the band corresponding to the relevant protein. Total protein loading is shown by Ponceau staining (PS).
Figure 6 with 2 supplements
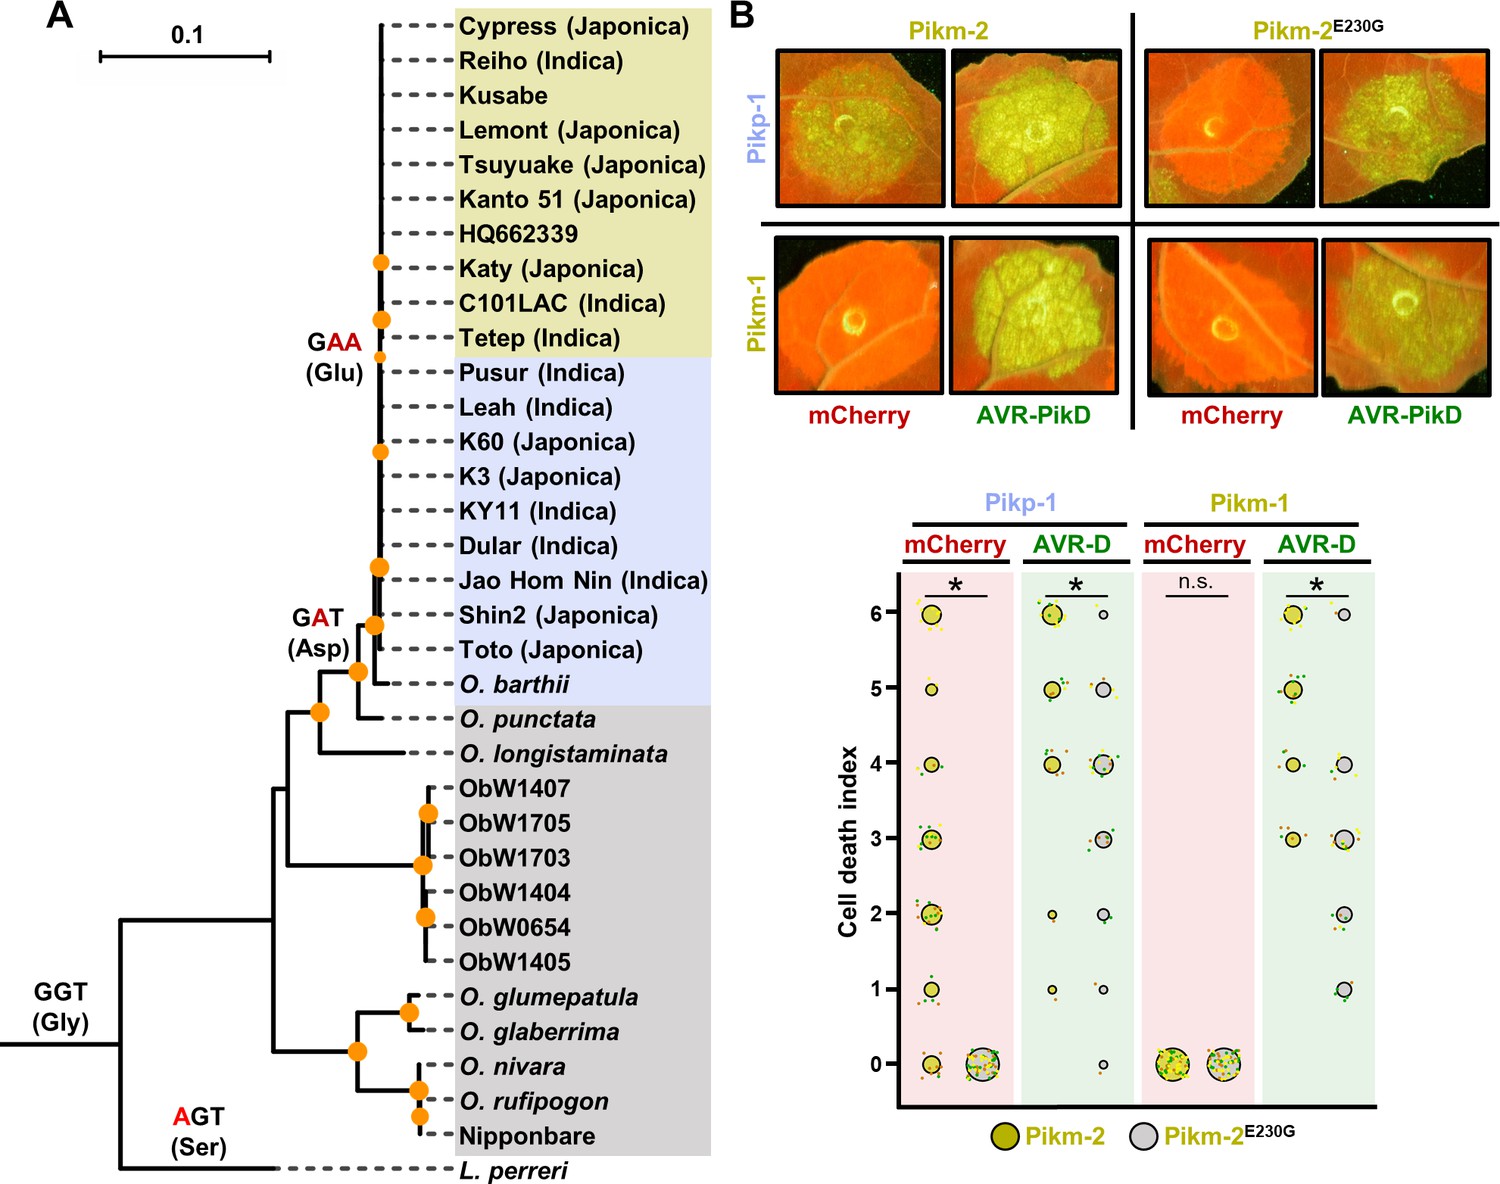
The Glu230 amino acid polymorphism has evolved in modern rice.
(A) Reconstruction of the evolutionary history of Pik-2 polymorphism at position 230.Maximum likelihood (ML) phylogenetic tree of Pik-2 coding sequences from cultivated rice and wild rice species. The tree was calculated from a 3066-nt-long alignment using RAxML v8.2.11 (Stamatakis, 2014), 1000 bootstrap method (Felsenstein, 1985) and GTRGAMMA substitution model (Tavaré, 1986). Best-scoring ML tree was manually rooted using the Pik-2 sequence from Leersia perreri as an outgroup. The bootstrap values above 80 are indicated with orange circles at the base of respective clades; the support values for the relevant nodes are depicted by the size of the circle. The scale bar indicates the evolutionary distance based on the nucleotide substitution rate. The tree is represented using Interactive Tree Of Life (iTOL) v4 (Letunic and Bork, 2019). The tree shows a set of inferred nucleotides (states) at the Pik-2 polymorphic position 230 based on their predicted likelihood at sites 709–711 of the sequence alignment. Non-synonymous changes at the codon are depicted in red next to their corresponding node. For visualization, rice species and cultivars names are shaded in gold, light blue, or grey according to their residue in Pik-2 polymorphic position 230 (Glu, Asp, or Gly, respectively). For modern rice cultivars, it is indicated in brackets whether they are Japonica or Indica variety (when known). Ob: Oryza brachyantha. (B) Reversion to ancestral state of Pikm-2 Glu230 abolishes autoimmunity. Representative leaf spot images depicting Pik-mediated cell death as autofluorescence under UV light in the presence or absence of AVR-Pik effector. Scoring of the cell death triggered by Pikm-2 or Pikm-2 Glu230Gly mutant when co-expressed with Pikp-1 or Pikm-1 is represented as dot plots. The number of repeats was 60 and 30 for the spots co-infiltrated with mCherry and AVR-PikD, respectively. For each sample, all the data points are represented as dots with a distinct colour for each of the three biological replicates; these dots are jittered about the cell death score for visualization purposes. The size of the central dot at each cell death value is proportional to the number of replicates of the sample with that score. Significant differences between relevant conditions are marked with an asterisk, and the details of the statistical analysis are summarized in Figure 6—figure supplement 1.
Figure 6—figure supplement 1
Estimation graphics for comparison of cell death mediated by Pikm-2 or Pikm-2 Glu230Gly.
Statistical analysis by estimation methods of the cell death assay for (A) Pikp-1 or (B) Pikm-1 co-expressed with Pikm-2 Glu230Gly and mCherry or AVR-PikD compared with wild-type Pikm-2. The panel on the left represents the ranked data (dots) for each NLR and their corresponding mean (dotted line). The size of the dots is proportional to the number of observations with that specific value. The panel on the right shows the distribution of 1000 bootstrap sample rank means for Pik-1 paired with Pikm-2. The blue areas represent the 0.025 and 0.975 percentiles of the distribution. Pikm-2 Glu230Gly-mediated responses are considered significantly different if the Pikm-2 rank mean (dotted line, left panel) falls beyond the blue regions of the Pikm-2 Glu230Gly mean distribution.
-
Figure 6—figure supplement 1—source data 1
HR scores used for dot plots and statistics.
- https://cdn.elifesciences.org/articles/71662/elife-71662-fig6-figsupp1-data1-v2.csv
Figure 6—figure supplement 2
Glu230Gly mutation does not affect Pik-2 protein accumulation.
Western blots showing accumulation of Pikm-2 Glu230Gly. C-terminally 6×HA tagged Pikm-2 Glu230Gly mutant was transiently expressed in N. benthamiana. C-terminally 6×HA tagged Pikp-2 and Pikm-2 alleles are included as controls. Total protein extracts were probed with α-HA antisera. Total protein loading is shown by Ponceau staining (PS).
Figure 7 with 2 supplements
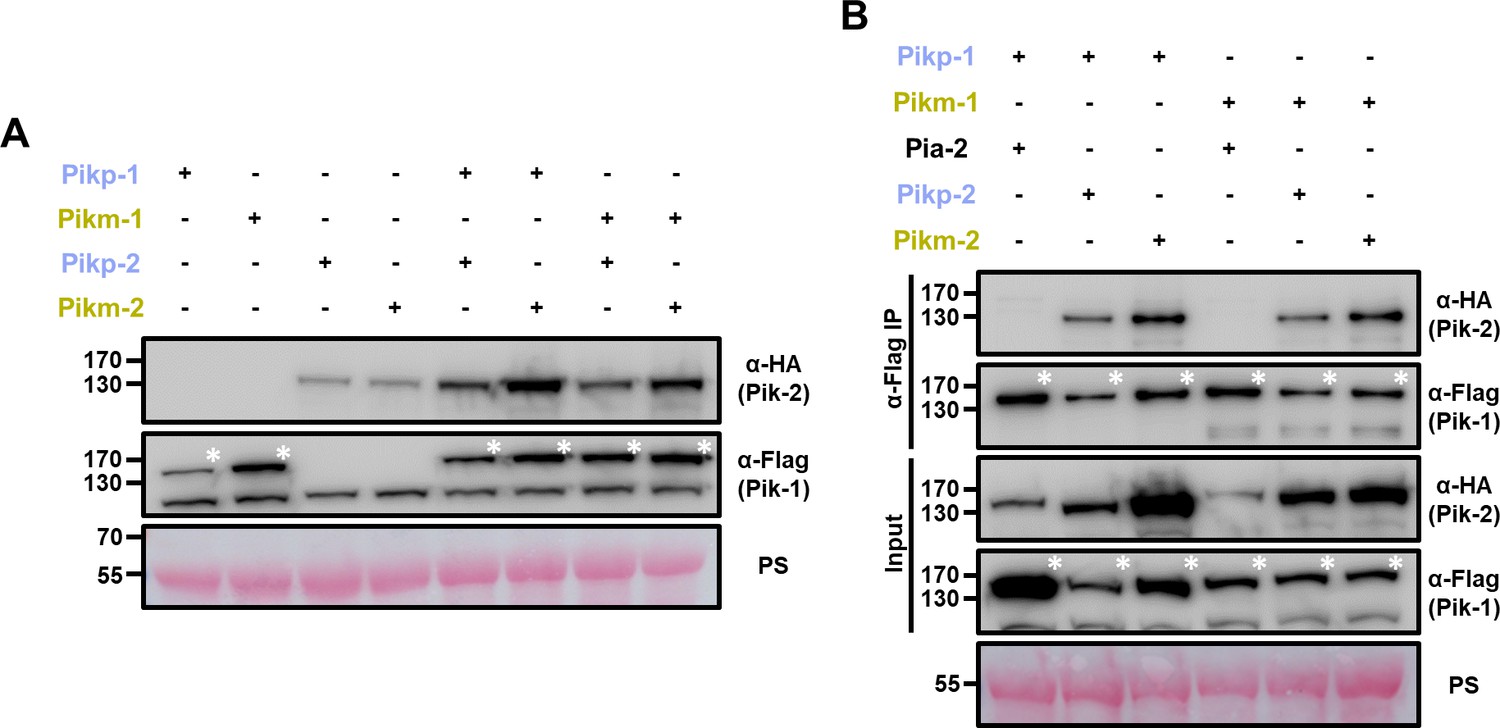
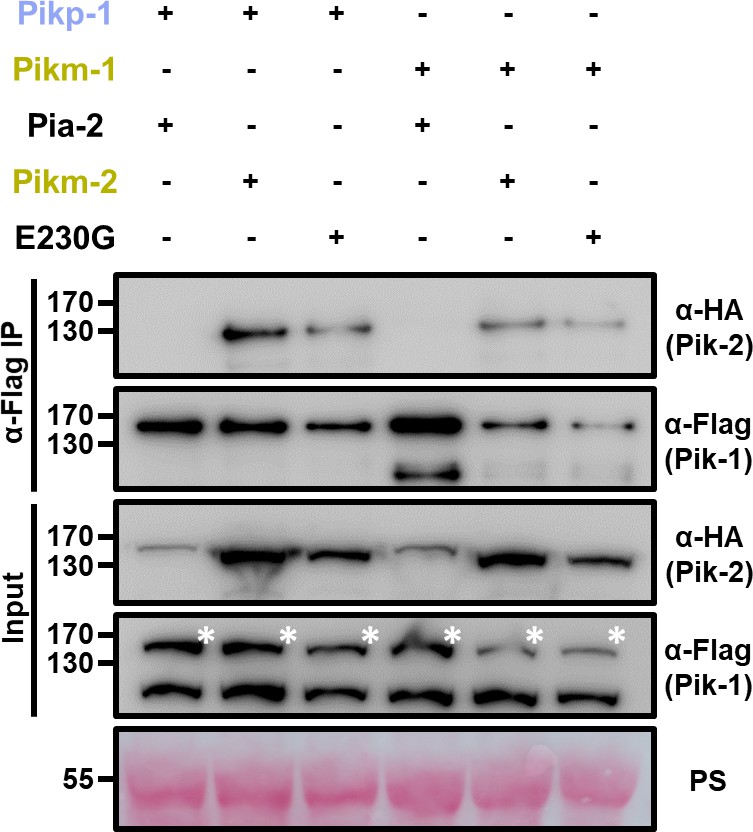
Coevolved and mismatched Pik pairs form heterocomplexes.
(A) Increased protein accumulation of paired Pik proteins when co-expressed together in planta. Western blots showing protein accumulation of Pik-1 and Pik-2 alleles in different combinations. C-terminally 6×His/3×FLAG tagged Pik-1 alleles were transiently co-expressed with empty vector (EV) or C-terminally 6×HA tagged Pik-2 alleles in N. benthamiana. Total protein extracts were probed with α-FLAG and α-HA antisera for Pik-1 and Pik-2, respectively. Asterisks mark the band corresponding to Pik-1. (B) Mismatched Pik NLR pairs associate in planta. Co-immunoprecipitation of full-length Pikp-1 and Pikm-1 alleles in combination with either Pikp-2 or Pikm-2 helper NLRs. C-terminally 6×HA tagged Pia-2, Pikp-2, or Pikm-2 NLRs were transiently co-expressed with Pikp-1: 6×His/3×FLAG or Pikm-1:6×His/3×FLAG in N. benthamiana. Immunoprecipitates obtained with anti-FLAG antiserum, and total protein extracts, were probed with appropriate antisera. Asterisks mark the band corresponding to Pik-1. Total protein loading is shown by Ponceau staining (PS).
Figure 7—figure supplement 1
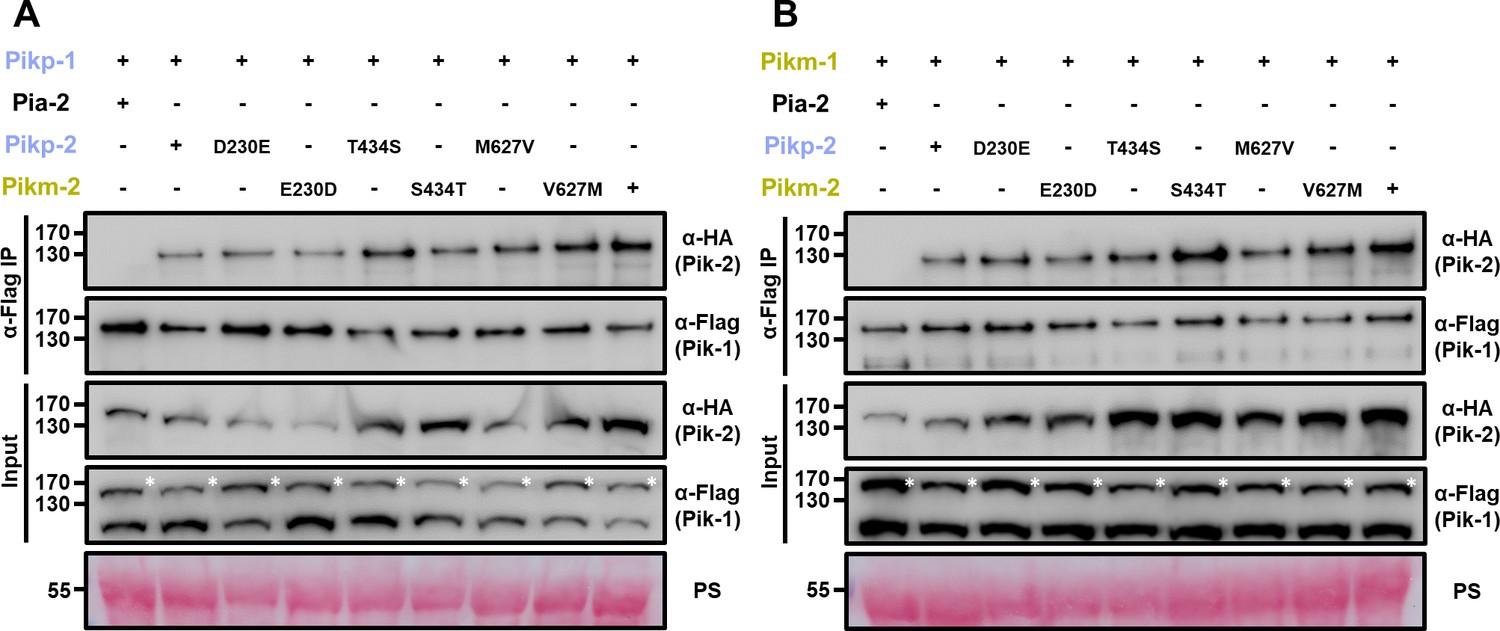
Pik-2 mutants associate with Pik-1 in planta.
Co-immunoprecipitation of full-length Pikp-1 (A) or Pikm-1 (B) with each Pik-2 mutant in polymorphic sites. C-terminally 6×HA tagged Pik-2 NLR mutants were transiently co-expressed with Pik-1:6×His/3×FLAG in N. benthamiana. Immunoprecipitates obtained with anti-FLAG antiserum, and total protein extracts, were probed with appropriate antisera. Co-expression with C-terminally tagged 6×HA Pia-2 NLR is included as negative control. Asterisks mark the band corresponding to Pikp-1. Total protein loading is shown by Ponceau staining (PS).
Figure 7—figure supplement 2
Reversion to ancestral state in polymorphism 230 does not abrogate association with Pik-1 alleles.
Co-immunoprecipitation of Pikm-2 Glu230Gly mutant with full-length Pikp-1 and Pikm-1 alleles. C-terminally 6×HA tagged Pikm-2 Glu230Gly was transiently co-expressed with either Pikp-1: 6×His/3×FLAG or Pikm-1:6×His/3×FLAG in N. benthamiana. Immunoprecipitates obtained with anti-FLAG antiserum, and total protein extracts, were probed with appropriate antisera. Co-expression with C-terminally tagged 6×HA Pia-2 NLR and wild-type Pikm-2 is included as negative and positive control, respectively. Asterisks mark the band corresponding to Pik-1. Total protein loading is shown by Ponceau staining (PS).
Figure 8 with 1 supplement
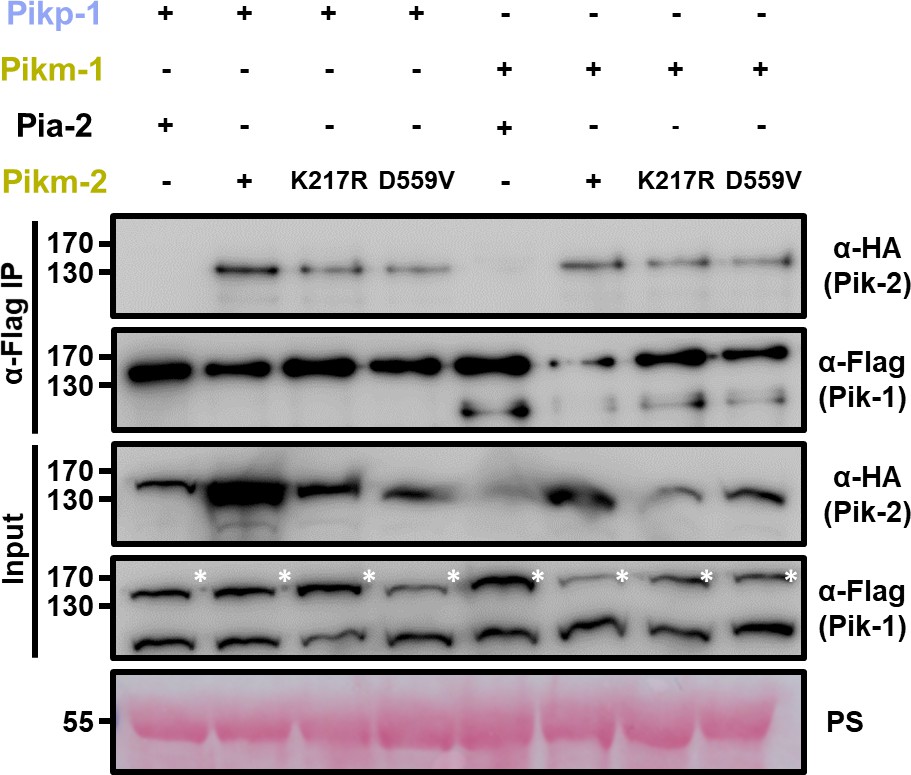
Mutations in Pik-2 P-loop and MHD motifs do not affect in planta association of Pik-1.
Co-immunoprecipitation of Pikm-2 P-loop and MHD mutants with full-length Pikp-1 and Pikm-1 alleles. C-terminally 6×HA tagged Pikm-2 mutants in P-loop (Lys217Arg) and MHD (Asp559Val) motifs were transiently co-expressed with either Pikp-1: 6×His/3×FLAG or Pikm-1:6×His/3×FLAG in N. benthamiana. Immunoprecipitates obtained with anti-FLAG antiserum, and total protein extracts, were probed with appropriate antisera. Co-expression with C-terminally tagged 6×HA Pia-2 NLR and wild-type Pikm-2 is included as negative and positive control, respectively. Asterisks mark the band corresponding to Pik-1. Total protein loading is shown by Ponceau staining (PS).
Figure 8—figure supplement 1
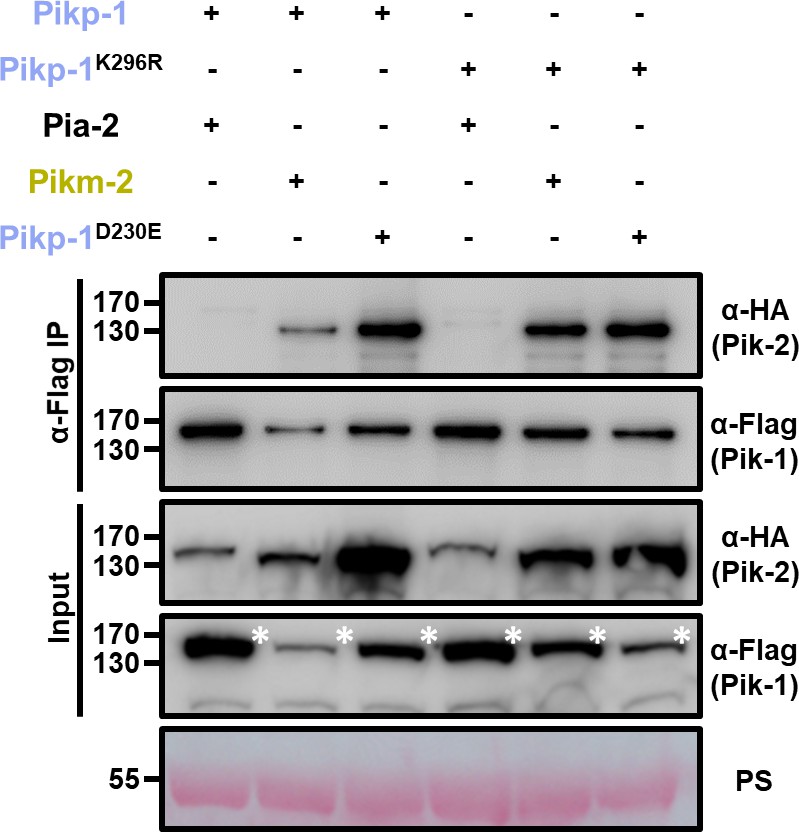
P-loop mutations do not affect Pik-1 association to Pik-2.
Co-immunoprecipitation of Pikm-2 and Pikp-2 Asp230Glu with wild-type Pikp-1 and Pikp-1 P-loop mutant (Lys296Arg). C-terminally 6×HA tagged Pikm-2 and Pikp-2 Asp230Glu were transiently co-expressed with C-terminally 6×His/3×FLAG tagged wild-type Pikp-1 or Pikp-1 Lys296Arg in N. benthamiana. Immunoprecipitates obtained with anti-FLAG antiserum, and total protein extracts, were probed with appropriate antisera. Co-expression with C-terminally tagged 6×HA Pia-2 NLR is included as negative control, respectively. Asterisks mark the band corresponding to Pik-1. Total protein loading is shown by Ponceau staining (PS).
Figure 9 with 2 supplements

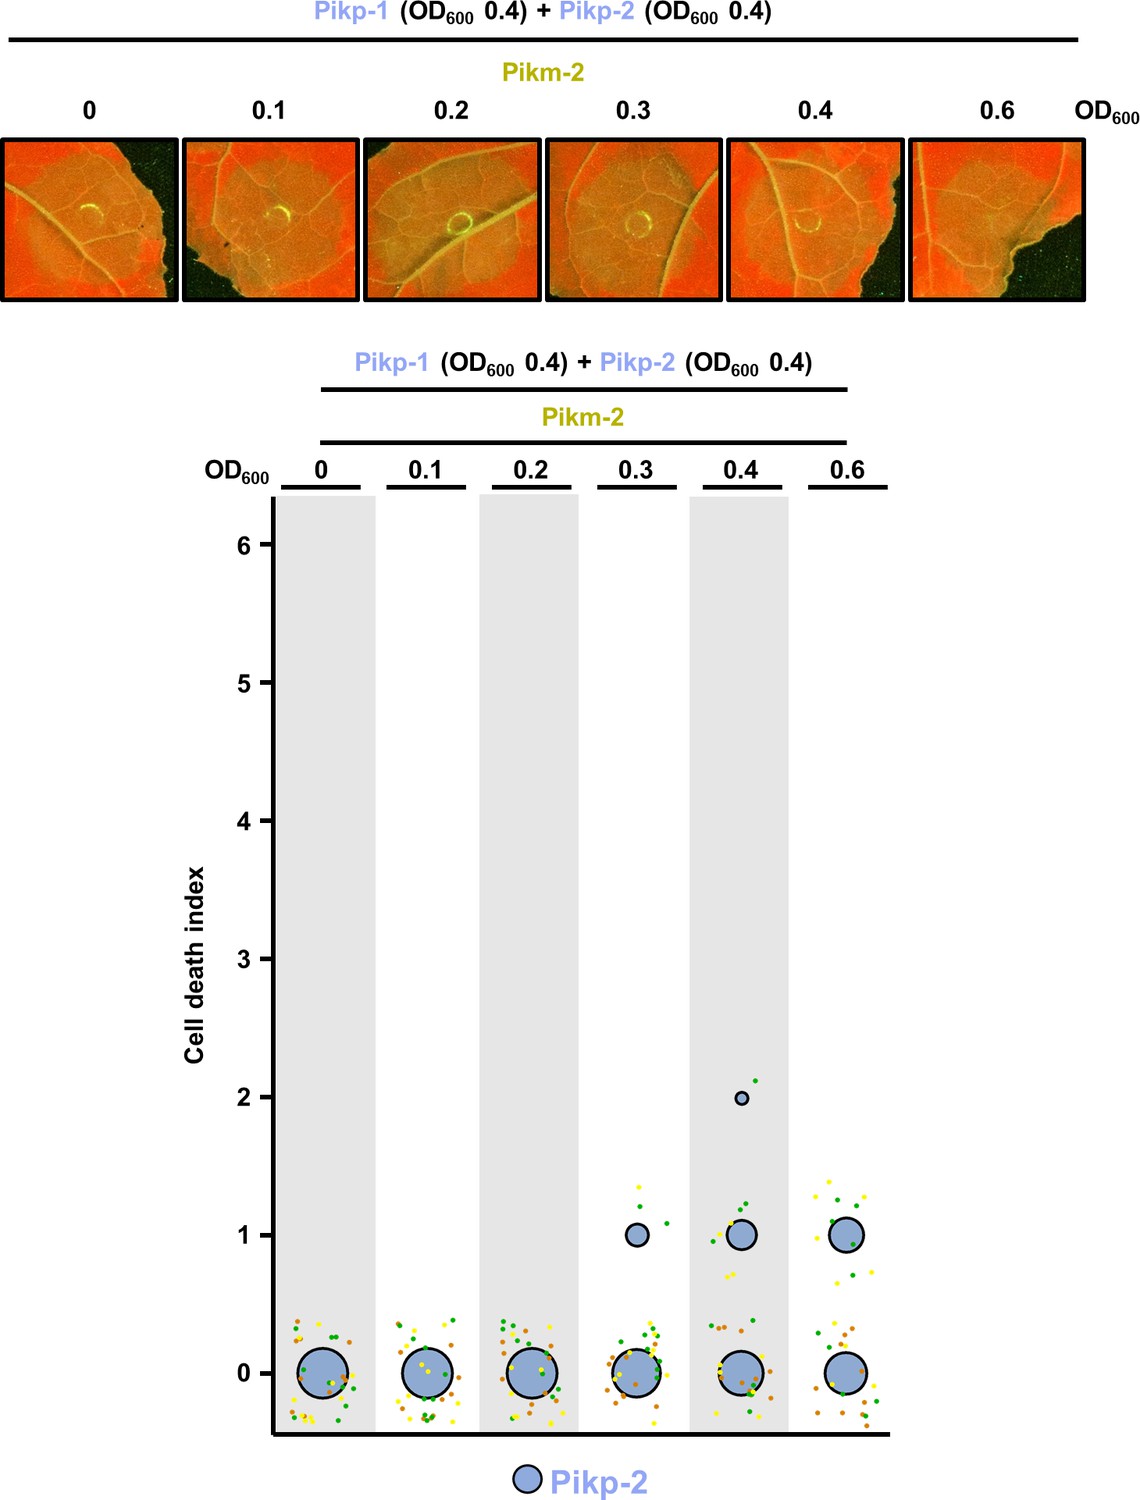
Pikp-2 supresses constitutive cell death mediated by Pikm-2.
(A) Representative leaf spot images depicting Pikm-2-mediated cell death in the presence of Pikp-1 and increasing concentration of Pikp-2 as autofluorescence under UV light. For each experiment, Pikp-1 and Pikm-2 were co-infiltrated at OD600 0.4 each. Increasing concentrations of Pikp-2 were added to each experiment (from left to right: OD600 0, 0.1, 0.2, 0.3, 0.4, and 0.6). (B) Scoring of the cell death assay is represented as dot plots. A total of three biological replicates with 10 internal repeats each were performed for each experiment. For each sample, all the data points are represented as dots with a distinct colour for each of the biological replicates; these dots are jittered about the cell death score for visualization purposes. The size of the central dot at each cell death value is proportional to the number of replicates of the sample with that score. (C) Pikp-2 outcompetes Pikm-2 association to Pikp-1. Co-immunoprecipitation of Pikm-2 and Pikp-1 in the presence of increasing concentrations on Pikp-2. C-terminally V5 tagged Pikm-2 and C-terminally 6×His/3×FLAG tagged Pikp-1 were transiently co-expressed in N. benthamiana alongside with increasing concentrations of C-terminally 6×HA tagged Pikp-2 (from left to right: 0, 0.1, 0.2, 0.3, 0.4, and 0.6 OD600). Immunoprecipitates obtained with anti-FLAG antiserum, and total protein extracts, were probed with appropriate antisera. Asterisks mark the band corresponding to Pikp-1. Total protein loading is shown by Ponceau staining (PS).
-
Figure 9—source data 1
HR scores used for dot plots.
- https://cdn.elifesciences.org/articles/71662/elife-71662-fig9-data1-v2.csv
Figure 9—figure supplement 1
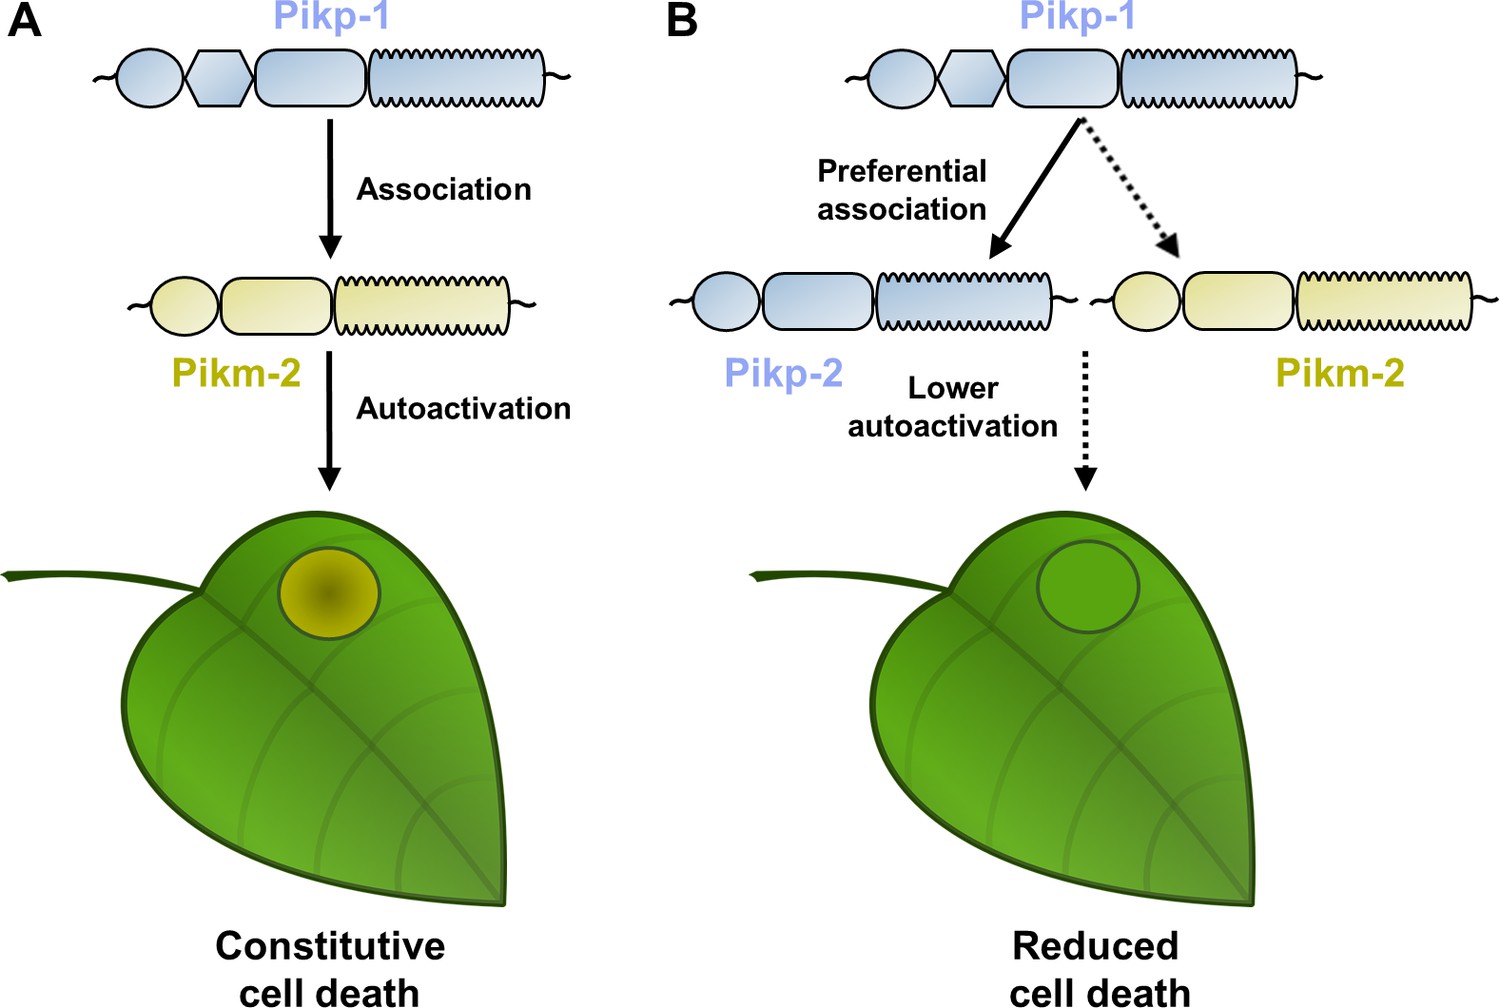
Schematic representations of Pik NLR competition assays.
(A) When Pikp-1 (coloured in ice blue) is co-expressed with Pikm-2 (coloured in gold), both NLRs associate and trigger NLR activation that leads to constitutive cell death in N. benthamiana, depicted by the development of chlorotic and necrotic leaf tissue. (B) In a preferential association scenario, with both Pikp-2 and Pikm-2 present, Pikp-1 would associate with coevolved Pikp-2 instead of to Pikm-2 (depicted by the solid and dashed lines, respectively). This would reduce constitutive immune signalling and cell death.
Figure 9—figure supplement 2
Pikp-2 suppresses constitutive cell death mediated by Pikm-2.
Representative leaf spot images depicting Pikm-2-mediated cell death in the presence of Pikp-1 and Pikp-2 and increasing concentration of Pikm-2 as autofluorescence under UV light. Scoring of the cell death assay is represented as dot plots. For each experiment, Pikp-1 and Pikp-2 were co-infiltrated at OD600 0.4 each. Increasing concentrations of Pikm-2 were added to each experiment (from left to right: OD600 0, 0.1, 0.2, 0.3, 0.4, and 0.6). A total of three biological replicates with 10 internal repeats each were performed for each experiment. For each sample, all the data points are represented as dots with a distinct colour for each of the three biological replicates; these dots are jittered about the cell death score for visualization purposes. The size of the central dot at each cell death value is proportional to the number of replicates of the sample with that score.
-
Figure 9—figure supplement 2—source data 1
HR scores used for dot plots.
- https://cdn.elifesciences.org/articles/71662/elife-71662-fig9-figsupp2-data1-v2.csv
Figure 10
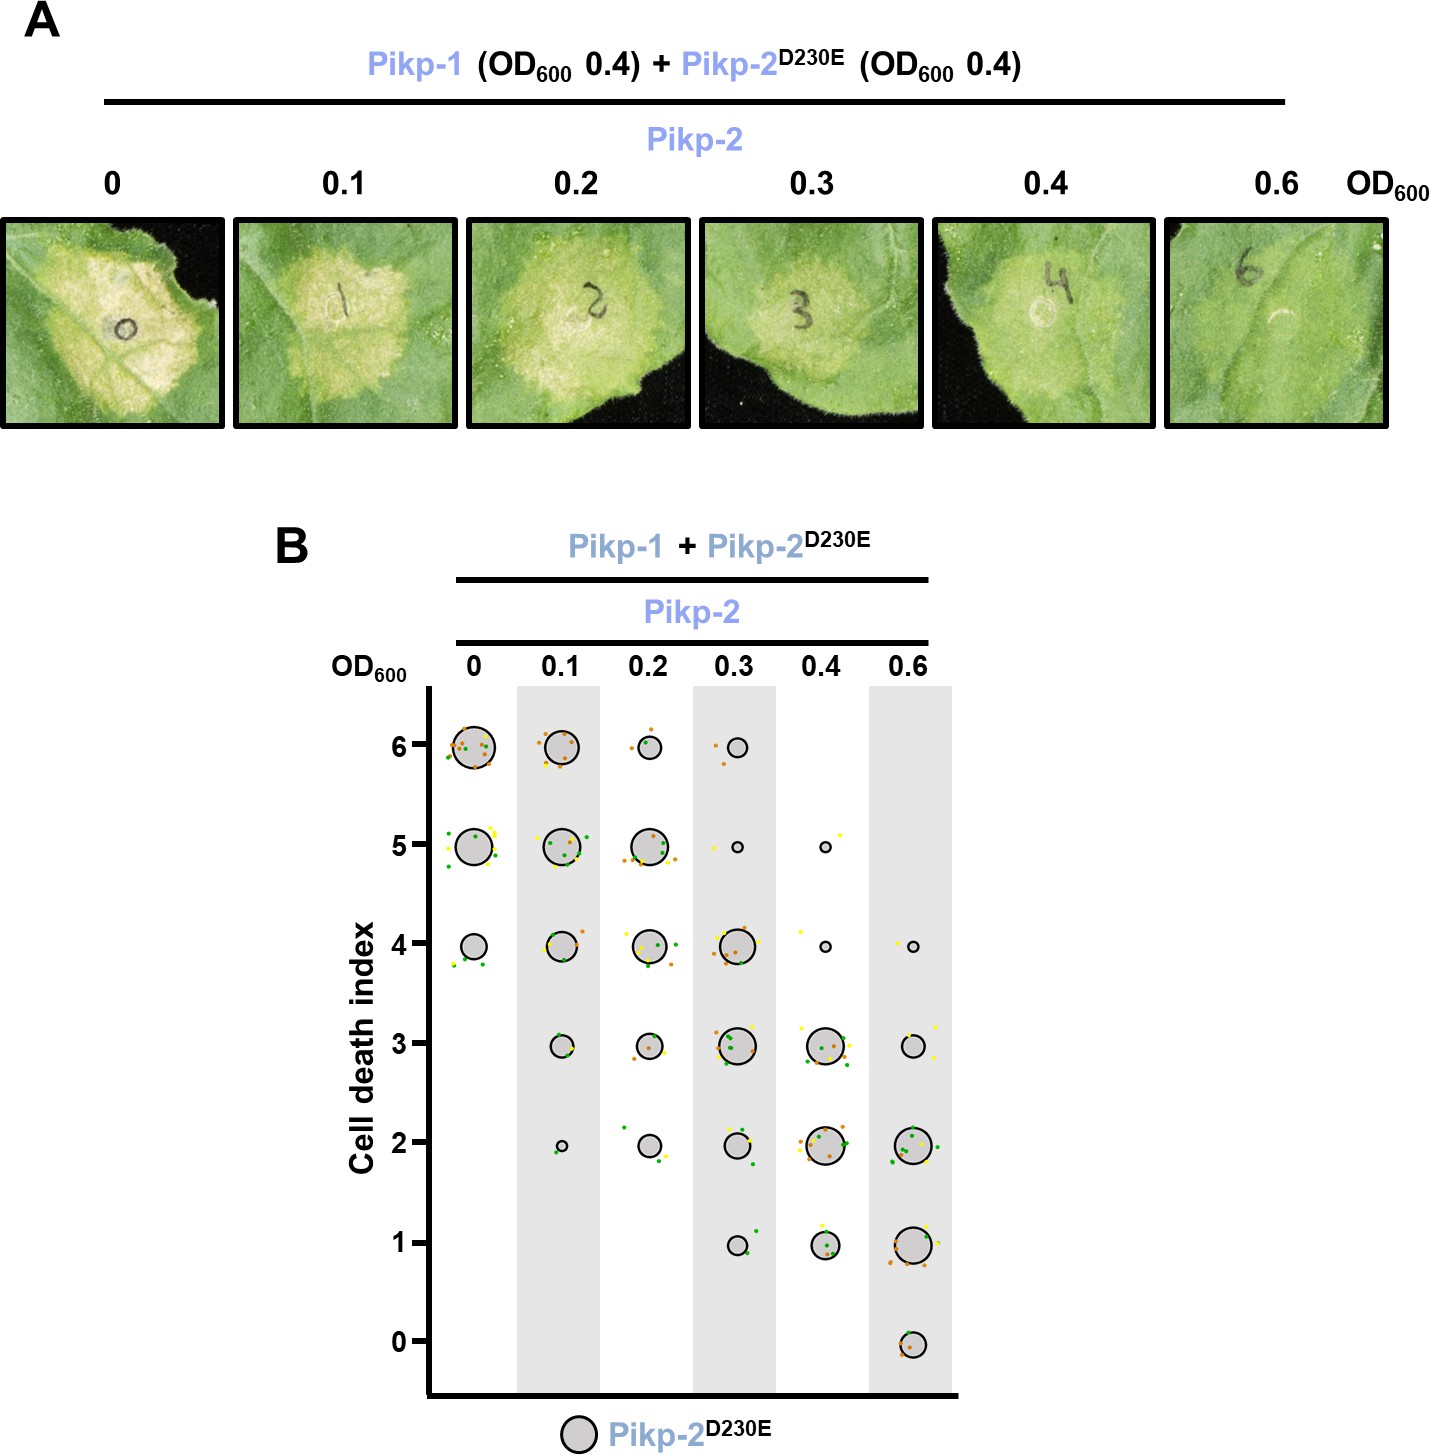
Wild-type Pikp-2 supresses constitutive cell death mediated by Pikp-2 Asp230Glu mutant.
(A) Representative leaf spot images depicting Pikp-2 Asp230Glu-mediated cell death in the presence of Pikp-1 and increasing concentration of Pikp-2. For each experiment, Pikp-1 and Pikp-2 Asp230Glu were co-infiltrated at OD600 0.4 each. Increasing concentrations of Pikp-2 were added to each experiment (from left to right: OD600 0, 0.1, 0.2, 0.3, 0.4, and 0.6). (B) Scoring of the cell death mediated by Pikp-2 Asp230Glu in the presence of Pikp-1 and increasing concentration of Pikp-2 assay represented as dot plots. For each experiment, Pikp-1 and Pikp-2 Asp230Glu were co-infiltrated at OD600 0.4 each. Increased concentration of Pikp-2 was added to each experiment (from left to right: OD600 0, 0.1, 0.2, 0.3, 0.4, and 0.6). A total of three biological replicates with 10 internal repeats each were performed for each experiment. For each sample, all the data points are represented as dots with a distinct colour for each of the three biological replicates; these dots are jittered about the cell death score for visualization purposes. The size of the central dot at each cell death value is proportional to the number of replicates of the sample with that score.
-
Figure 10—source data 1
HR scores used for dot plots.
- https://cdn.elifesciences.org/articles/71662/elife-71662-fig10-data1-v2.csv
Figure 11
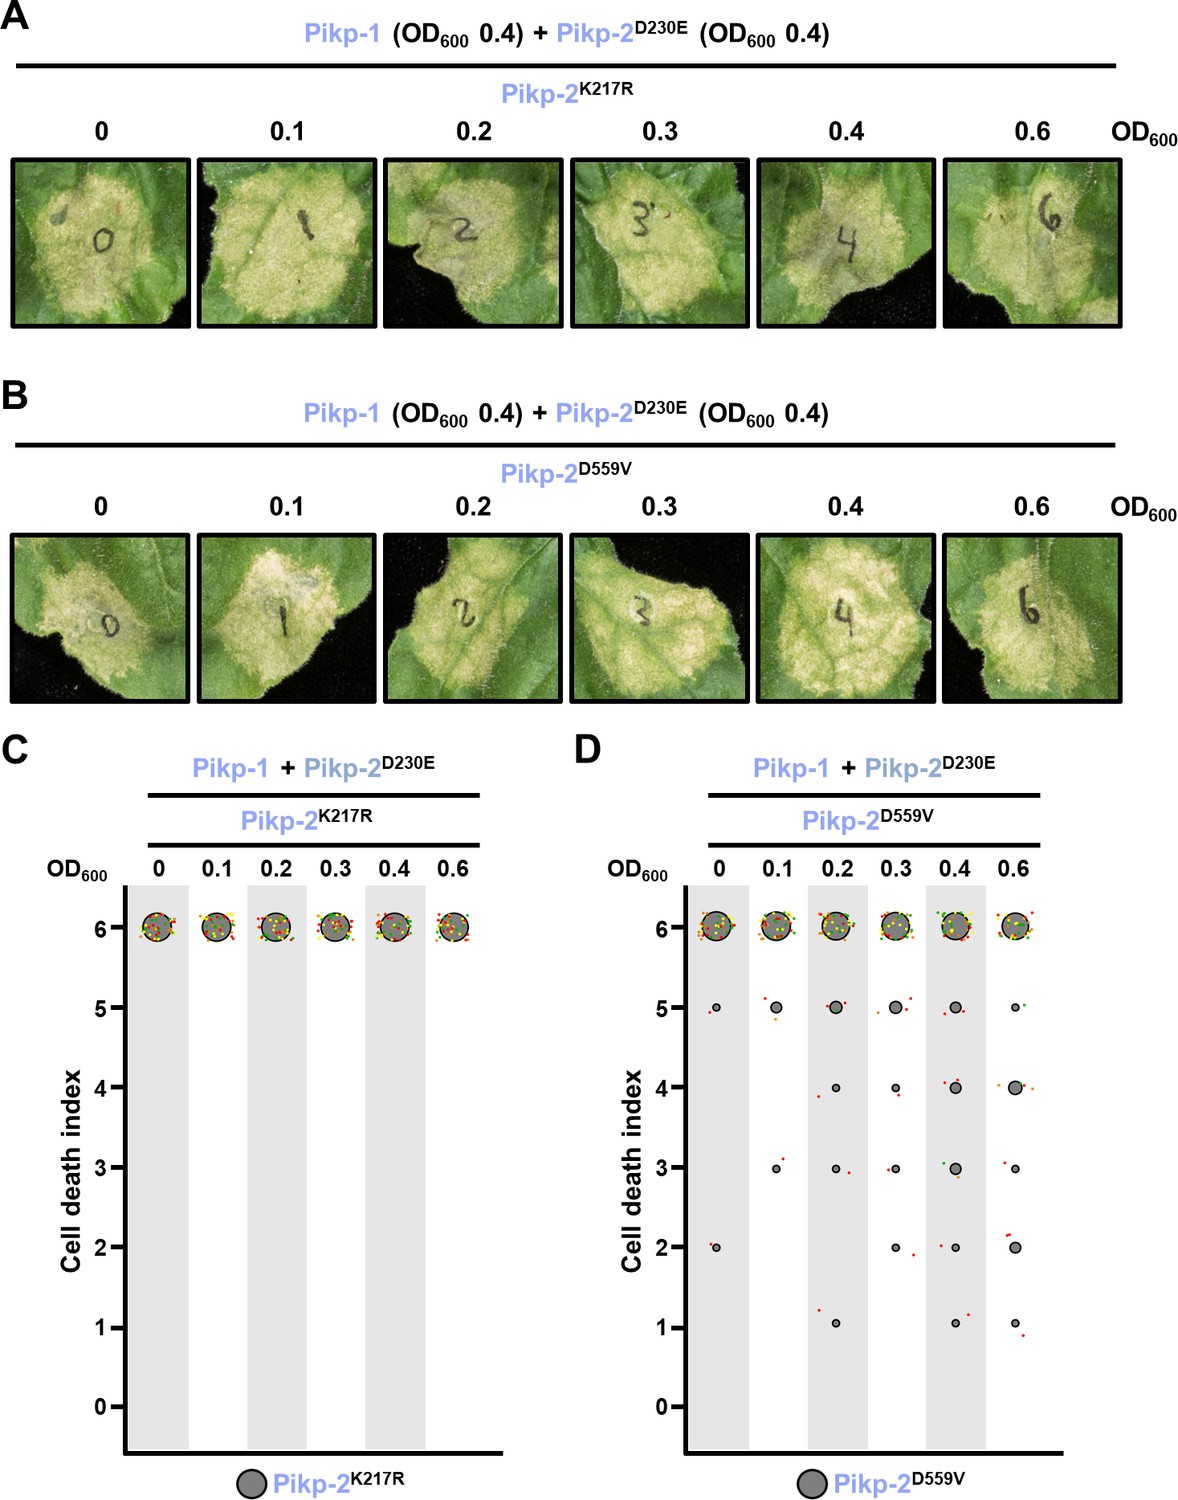
Suppression of constitutive cell death mediated by Pikp-2 Asp230Glu requires an active Pikp-2.
Representative leaf spot images depicting Pikp-2 Asp230Glu-mediated cell death in the presence of Pikp-1 and increasing concentration of Pikp-2. For each experiment, Pikp-1 and Pikp-2 Asp230Glu were co-infiltrated at OD600 0.4 each. Increasing concentrations of (A) Pikp-2 Lys217Arg or (B) Pikp-2 Asp559Val were added to each experiment (from left to right: OD600 0, 0.1, 0.2, 0.3, 0.4, and 0.6). Scoring of the cell death mediated by Pikp-2 Asp230Glu in the presence of Pikp-1 and increasing concentration of (C) Pikp-2 Lys217Arg or (D) Pikp-2 Asp559Val represented as dot plots. For each experiment, Pikp-1 and Pikp-2 Asp230Glu were co-infiltrated at OD600 0.4 each. Increased concentration of Pikp-2 mutants was added to each experiment (from left to right: OD600 0, 0.1, 0.2, 0.3, 0.4, and 0.6). A total of four biological replicates with 10 internal repeats each were performed for each experiment. For each sample, all the data points are represented as dots with a distinct colour for each of the four biological replicates; these dots are jittered about the cell death score for visualization purposes. The size of the central dot at each cell death value is proportional to the number of replicates of the sample with that score.
-
Figure 11—source data 1
HR scores used for dot plots (Figure 11C).
- https://cdn.elifesciences.org/articles/71662/elife-71662-fig11-data1-v2.csv
-
Figure 11—source data 2
HR scores used for dot plots (Figure 11D).
- https://cdn.elifesciences.org/articles/71662/elife-71662-fig11-data2-v2.csv
Figure 12
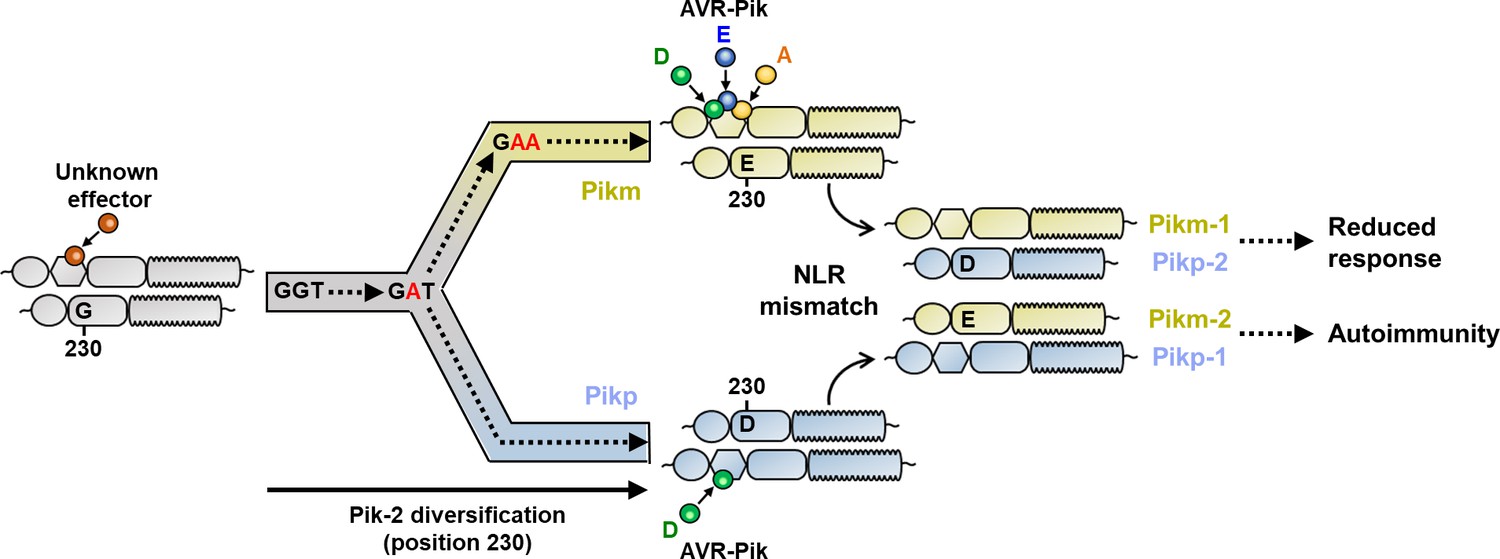
Schematic representation of the proposed evolutionary model of the Pik pairing.
Pikp (coloured in ice blue) and Pikm (coloured in gold) have evolved and specialized from an ancestral NLR pair (coloured in grey), functionally diversifying and gaining recognition to a different subset of allelic AVR-Pik effectors. Residues at Pik-2 polymorphic position 230 are indicated, and mutations predicted to have occurred during this transition are indicated in red. As a consequence of diversification, mismatch of Pikp and Pikm impairs immune responses and leads to NLR autoactivation and constitutive cell death in N. benthamiana.
Tables
Key resources table
| Reagent type (species) or resource | Designation | Source or reference | Identifiers | Additional information |
|---|---|---|---|---|
| Recombinant DNA reagent | pICH47742 | Addgene | ||
| Recombinant DNA reagent | pICH47751 | Addgene | ||
| Commercial assay or kit | pCR8/GW/TOPO TA Cloning Kit | Thermo Fisher | K250020 | |
| Commercial assay or kit | ANTI-FLAG M2 Affinity Agarose Gel | Sigma (Merck) | A2220 | |
| Antibody | ANTI-FLAG M2 antibody(mouse monoclonal) | Sigma (Merck) | Cat. # F1804; lot # SLBT7654 | Used diluted (1:3000) |
| Antibody | Anti-HA high-affinity antibody 3F10(rat monoclonal) | Roche | Cat. # 11867423001; lot # 14553800 | Used diluted (1:3000) |
| Antibody | V5 Tag Antibody (E10/V4RR), HRP conjugated(mouse monoclonal) | Invitrogen | MA5-15253-HRP | Used diluted (1:3000) |
| Antibody | Anti-Rat IgG-Peroxidase antibody produced in goat | Sigma (Merck) | Cat. # A9307 | Used diluted (1:10,000) |
| Antibody | Anti-mouse IgG, HRP conjugate | Promega | Cat. # W4021 | Used diluted (1:10,000) |
| Commercial assay or kit | ECL extreme Lumiblue Western Blotting Substrate | Abcam | Ab270517 | |
| Software, algorithm | besthr | De la Concepcion et al., 2019 | ||
| Software, algorithm | iTOL v5.5.1 | Letunic and Bork, 2019 | ||
| Software, algorithm | RAxML v8.2.11 | Stamatakis, 2014 | ||
| Software, algorithm | ggplot2 R package | |||
| Software, algorithm | QKphylogeny | https://github.com/matthewmoscou/QKphylogeny |
Additional files
-
Transparent reporting form
- https://cdn.elifesciences.org/articles/71662/elife-71662-transrepform1-v2.docx
-
Source data 1
Raw uncropped images and uncropped labelled images for all western blots.
- https://cdn.elifesciences.org/articles/71662/elife-71662-supp1-v2.zip
Download links
A two-part list of links to download the article, or parts of the article, in various formats.
Downloads (link to download the article as PDF)
Open citations (links to open the citations from this article in various online reference manager services)
Cite this article (links to download the citations from this article in formats compatible with various reference manager tools)
Functional diversification gave rise to allelic specialization in a rice NLR immune receptor pair
eLife 10:e71662.
https://doi.org/10.7554/eLife.71662


