Neuronal activity in dorsal anterior cingulate cortex during economic choices under variable action costs
- Department of Neuroscience, Washington University in St Louis, United States
- NYU Shanghai, China
- Shanghai Key Laboratory of Brain Functional Genomics (Ministry of Education), School of Psychology and Cognitive Science, East China Normal University, China
- NYU-ECNU Institute of Brain and Cognitive Science at NYU Shanghai, China
- Departments of Economics, Washington University in St Louis, China
- Biomedical Engineering, Washington University in St Louis, China
Figures
Figure 1
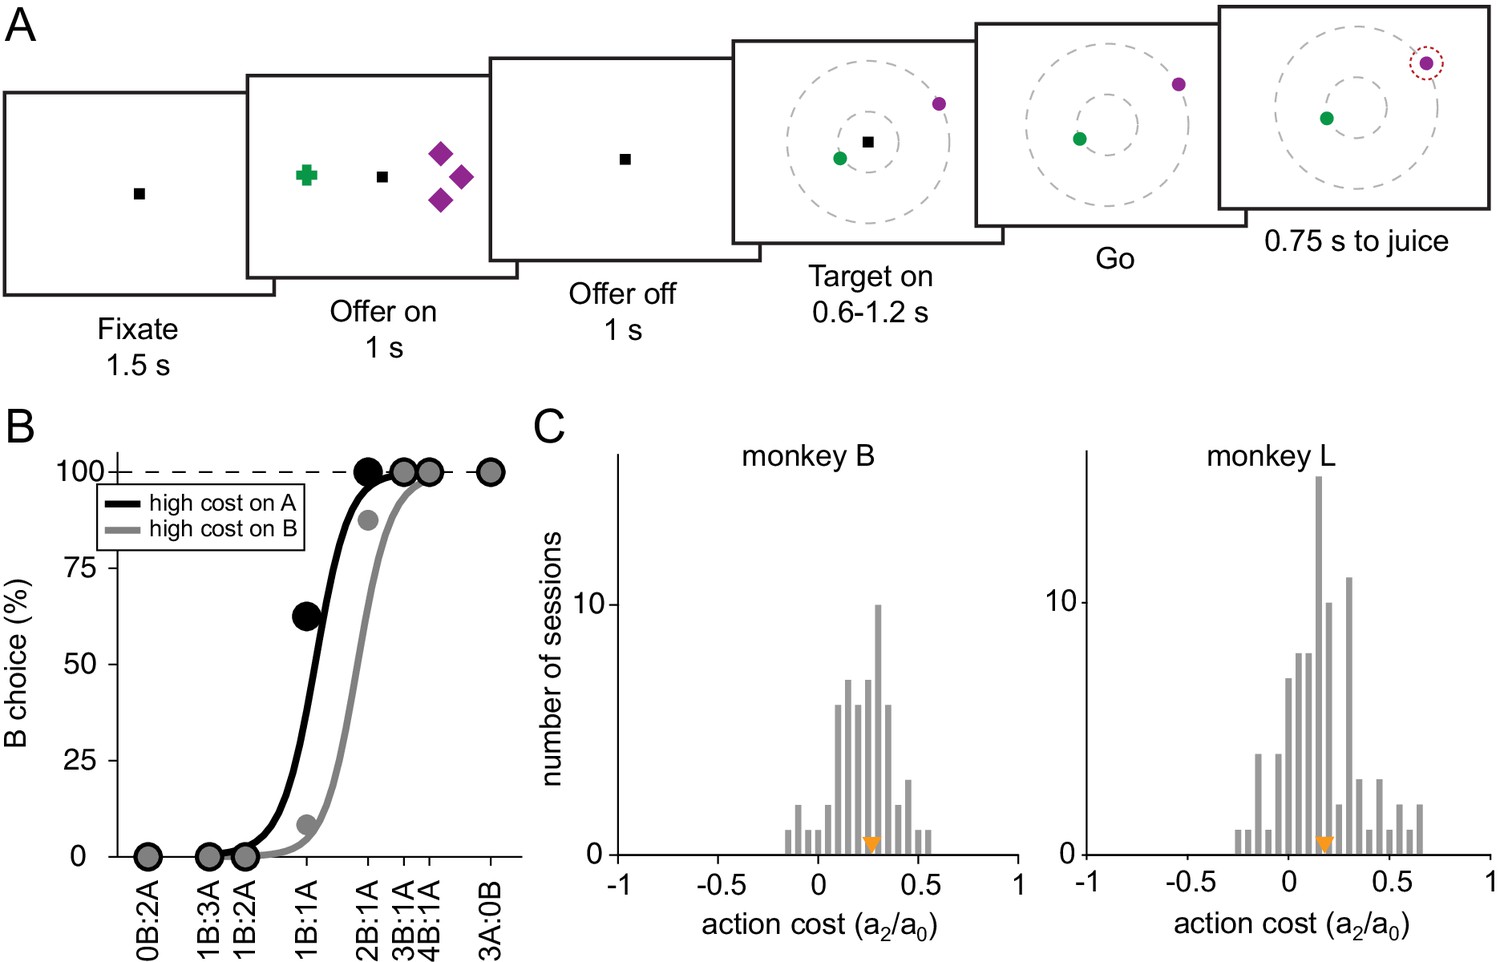
Experimental design and behavioral analysis.
(A) At the beginning of the trial, the monkey fixated a center point on the monitor. After 1.5 s, two offers appeared to the left and right of the fixation point. The offers were represented by sets of color symbols, with the color indicating the juice type, the number of symbols indicating juice amount and the shape of the symbols indicating the action cost associated with the offer (crosses, low cost; diamonds high cost). The offers remained on the monitor for 1 s, then they disappeared. The monkey continued fixating the center point for another 1 s. At the end of this delay, two saccade targets (two color dots) appeared. The two saccade targets were located on two (invisible) concentric rings centered on the fixation point. The animal maintained fixation for a randomly variable delay (0.6–1.2 s) before the center fixation point was extinguished (‘go’ signal), at which point the monkey indicated its choice with a saccade. (B) Choice patterns, one session. The percentage of B choices is plotted against the ratio qB:qA, where qA and qB are quantities of juice A and juice B, respectively. Trials were separated in two groups depending on the level of action cost for juice A. The choice pattern obtained when juice A had a high cost (black) was displaced to the left (lower indifference point) compared to the choice pattern obtained when juice A had a low cost (gray). The regression lines were obtained with a simplified version of Equation (1) in which terms a3 to a6 were removed. The action cost can be measured as ξ = a2/a0 (Equation 1). (C) Histogram of action costs across 56 sessions for monkey B (median(ξ) = 0.27, p < 10–9, Wilcoxon signed-rank test) and 85 sessions for monkey L (median(ξ) = 0.18, p < 10–11, Wilcoxon signed-rank test). Orange triangles indicate median values.
-
Figure 1—source data 1
Source data for Figure 1c.
- https://cdn.elifesciences.org/articles/71695/elife-71695-fig1-data1-v2.zip
Figure 2
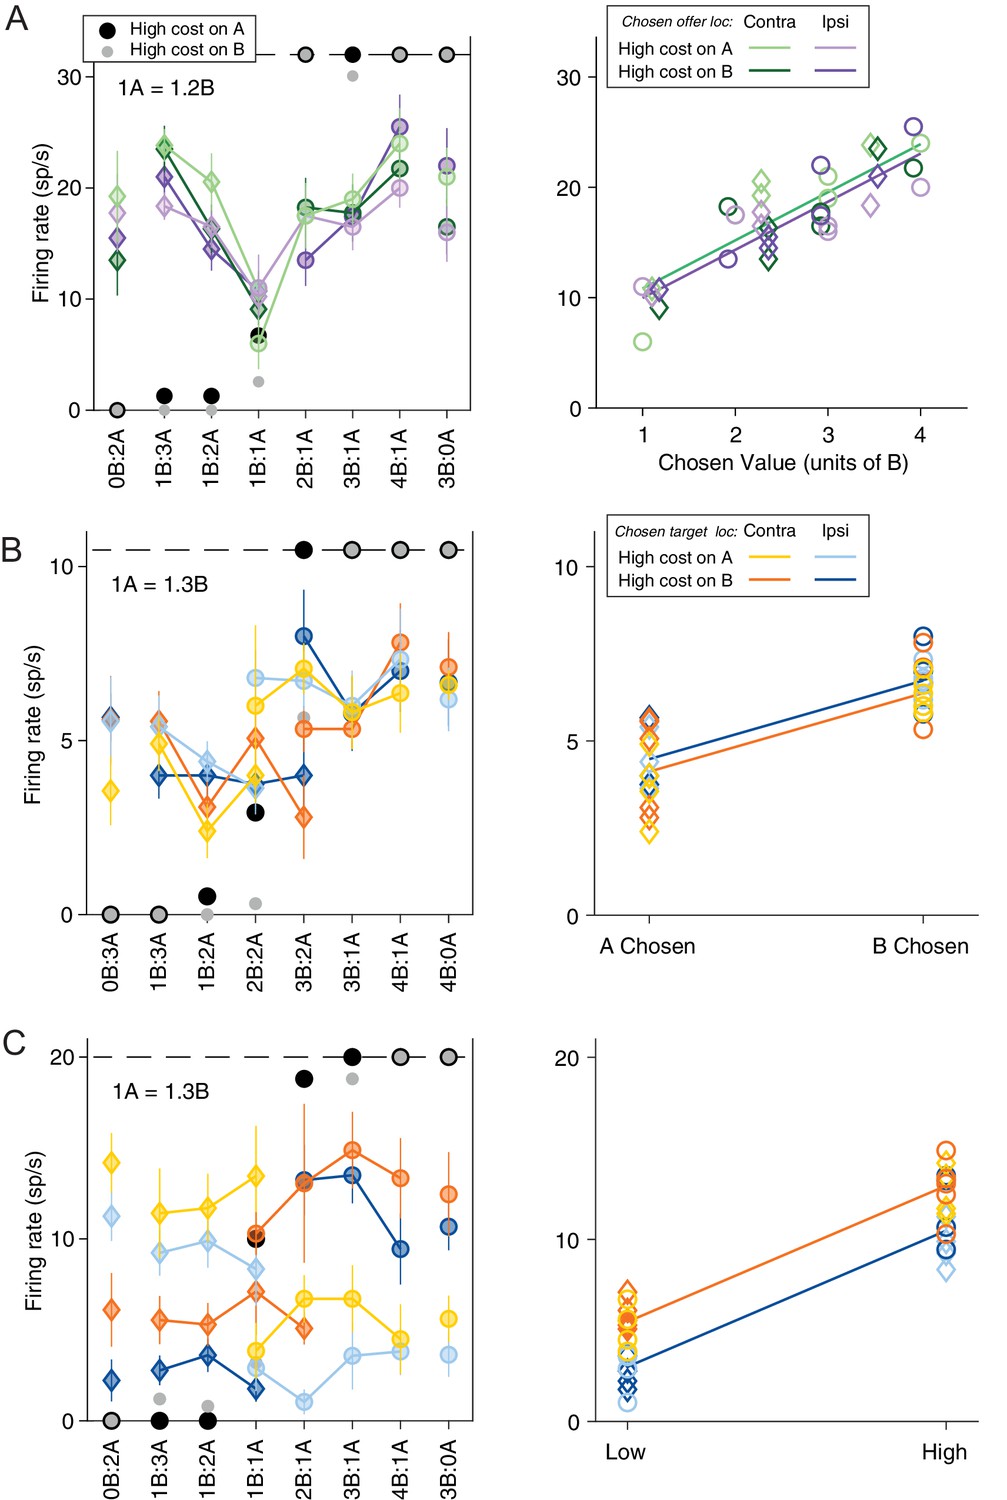
Neuronal encoding of variables in commodity and cost-based reference frames.
(A) Response encoding the chosen value (late-delay time window). In the left panel, the x-axis represents different offer types ranked by ratio qB:qA. Black and gray symbols represent the percentage of ‘B’ choices for A− and A+ trials, respectively. Color symbols represent the neuronal firing rate, with diamonds and circles indicating trials in which the monkey chose juice A and juice B, respectively. Green and purple indicate the chosen offer located on the contralateral or ipsilateral hemifield and light and dark shade indicate A+ and A− trials, respectively. Error bars indicate SEM. In the right panel, the same neuronal response is plotted against the variable chosen value and chosen offer location. The parallel green and purple lines are derived from an analysis of covariance (ANCOVA) using the location of the chosen offer as a covariate (parallel lines). This response encoded the variable chosen value (R2 = 0.75, pchosen value <10–10) but was not modulated by the chosen offer location (pchosen offer loc = 0.30). (B) Response encoding the chosen juice (post-juice time window). All conventions are as in (A) except that the blue and orange color indicate chosen target location. In the right panel, the response is plotted against the variable chosen juice and chosen target location. The parallel blue and orange lines are derived from ANCOVA (R2 = 0.64, pchosen value <10–7, pchosen target loc = 0.24). (C) Response conjunctively encoding the chosen cost and chosen target location (pre-go time window). All conventions are as in (C). In the right panel, the response is plotted against the variable chosen cost and chosen target location. The parallel blue and orange lines are derived from an ANCOVA (R2 = 0.90, pchosen cost <10–16, pchosen target loc <10–5).
Figure 3
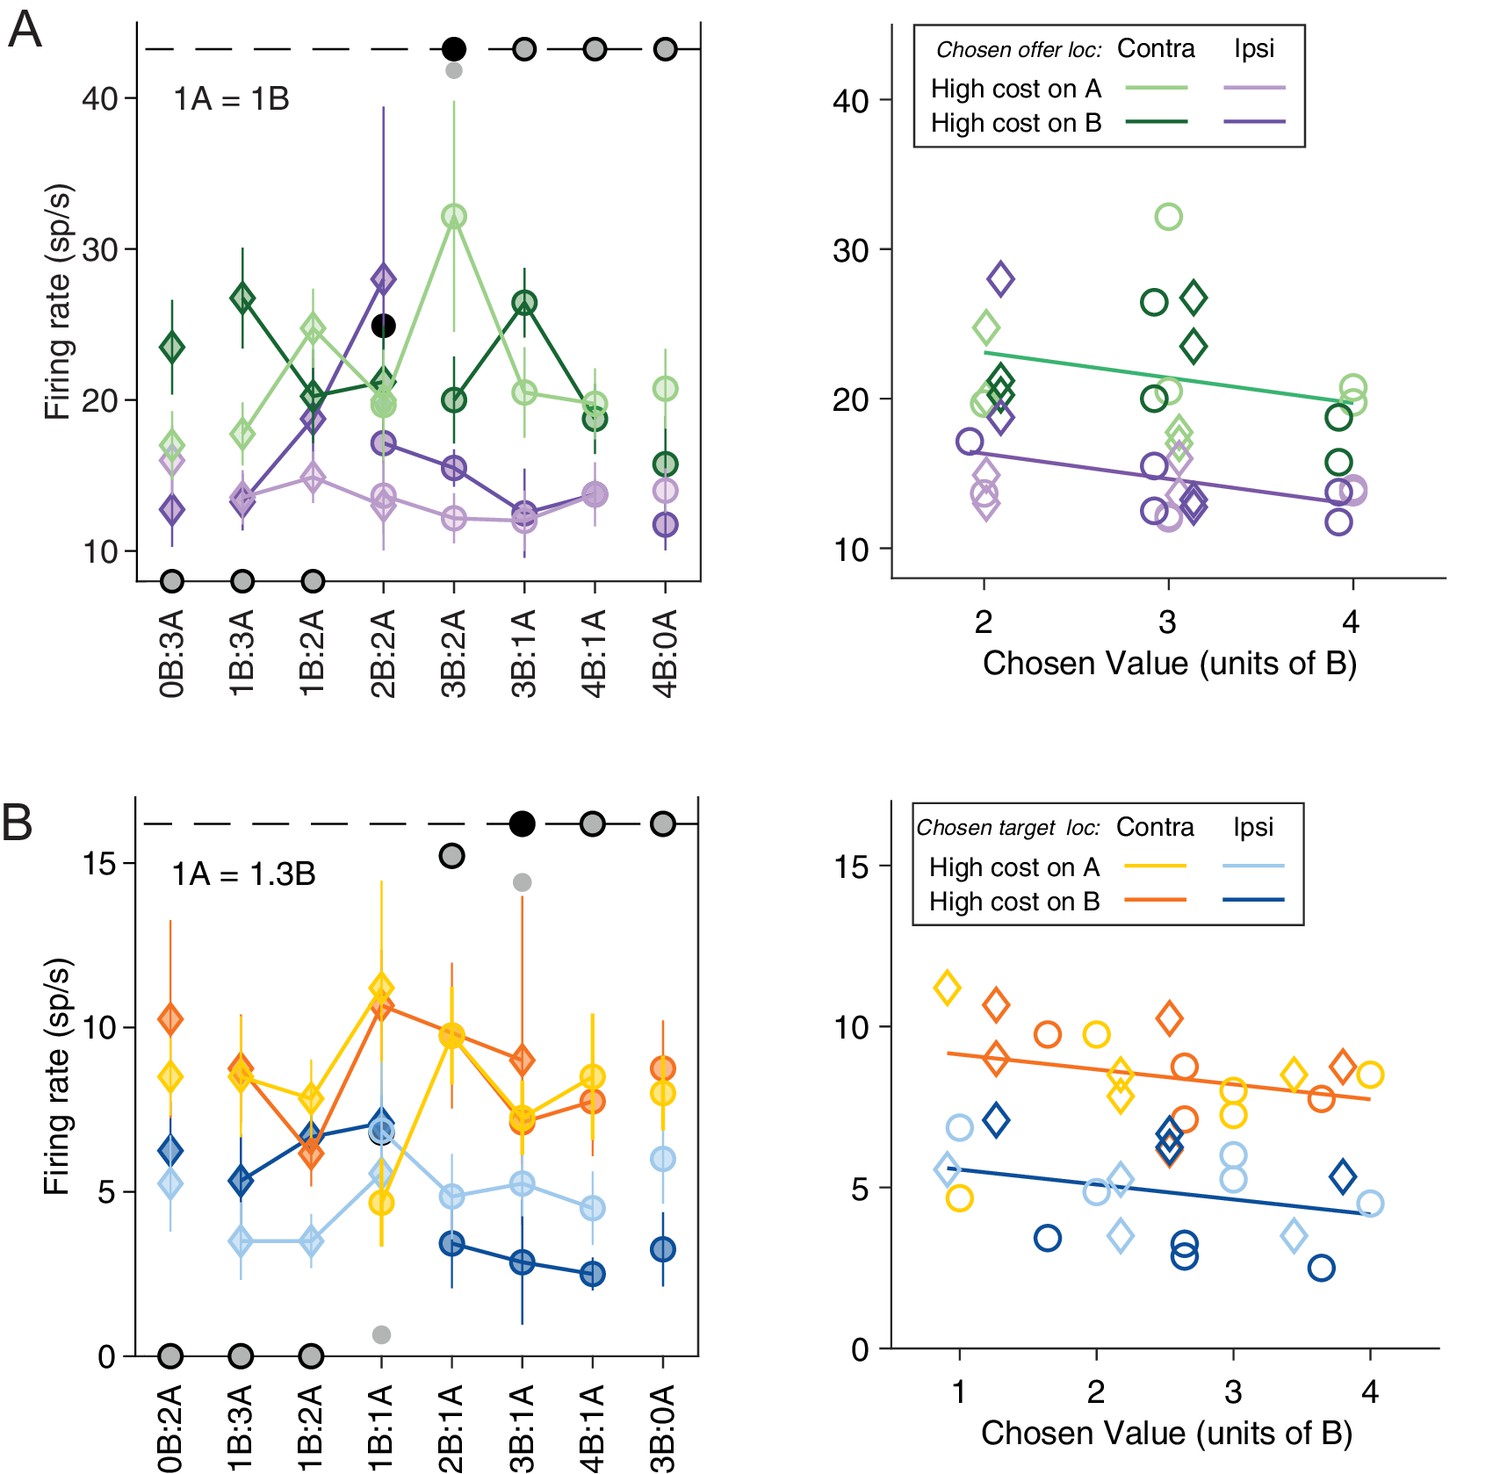
Neuronal encoding of variables in spatial and action-based reference frames.
(A) Response encoding the variable chosen offer location only (late-delay time window). All conventions are as in Figure 2A. In the right panel, the neuronal response is plotted against the chosen value and chosen offer location. The parallel green and purple lines are derived from an analysis of covariance (ANCOVA) (R2 = 0.49, pchosen value = 0.070, pchosen offer loc <10–5). (B) Response encoding the variable chosen target location only (pre-go time window). All conventions are as in (A) except that the blue and orange color indicate chosen target location. In the right panel, the response is plotted against chosen value and chosen target location. The parallel blue and orange lines are derived from an ANCOVA (R2 = 0.62, pchosen value = 0.10, pchosen target loc <10–7).
Figure 4
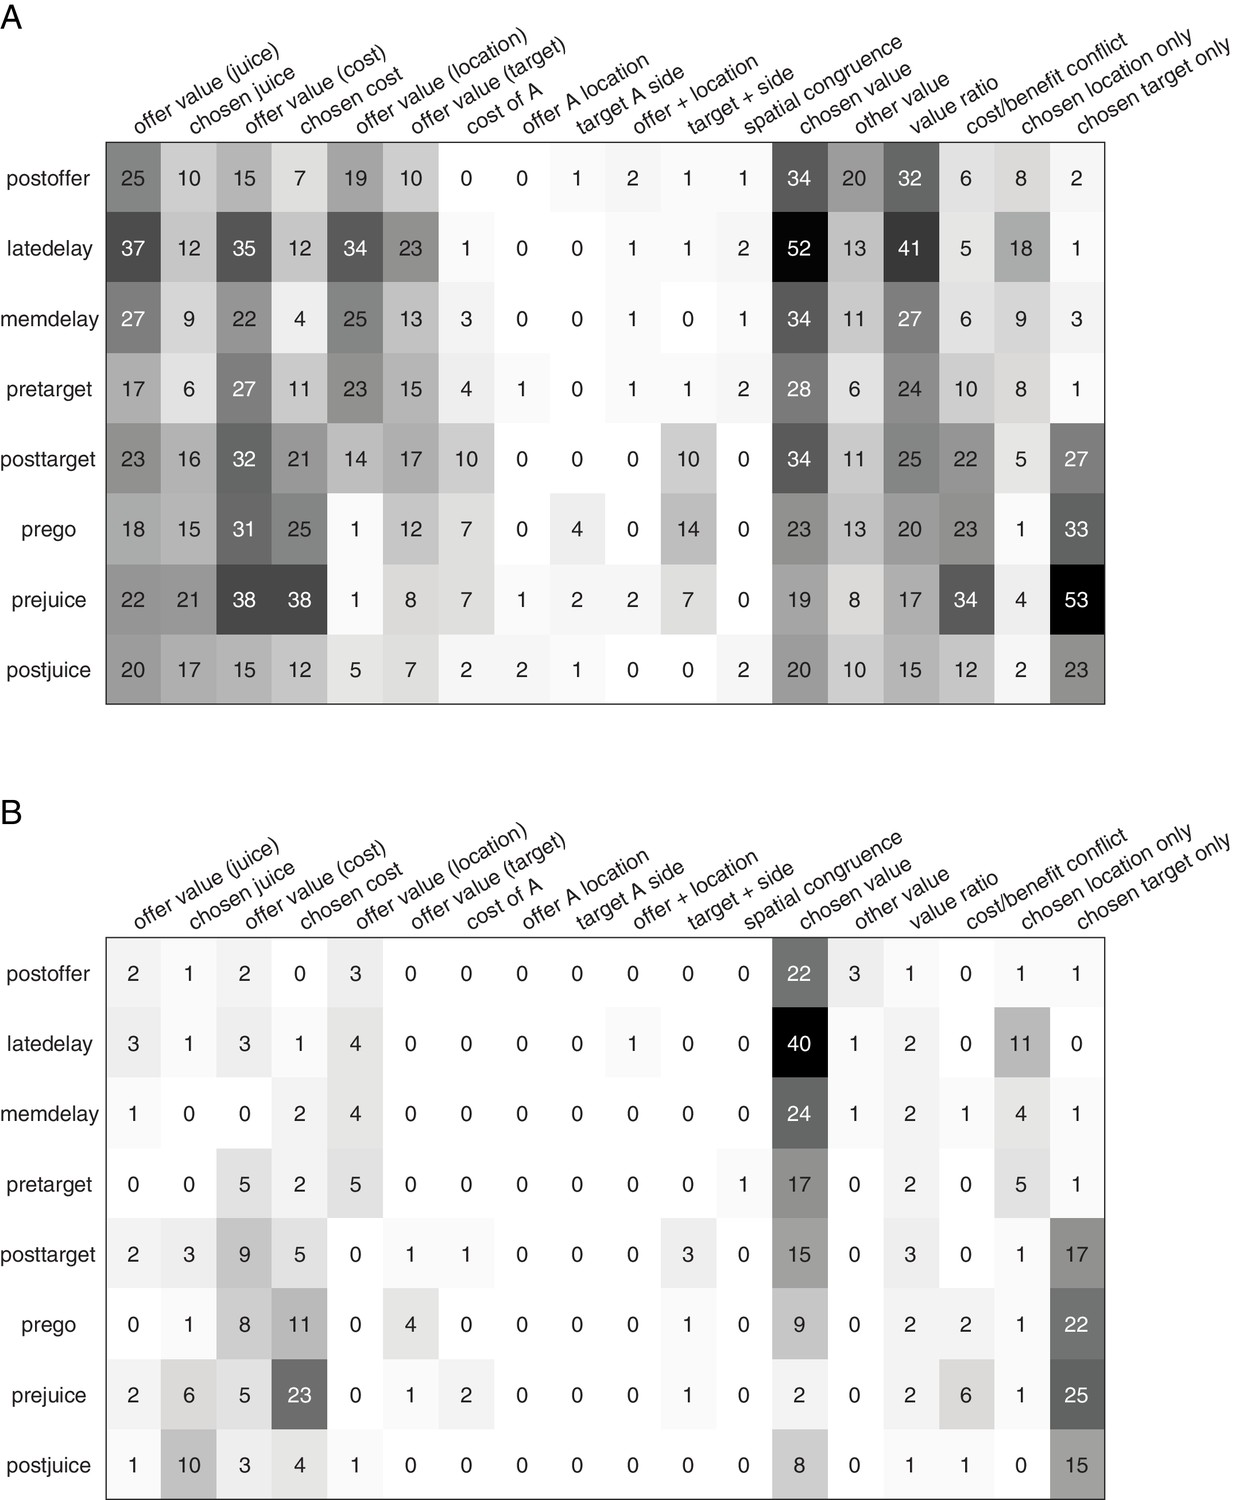
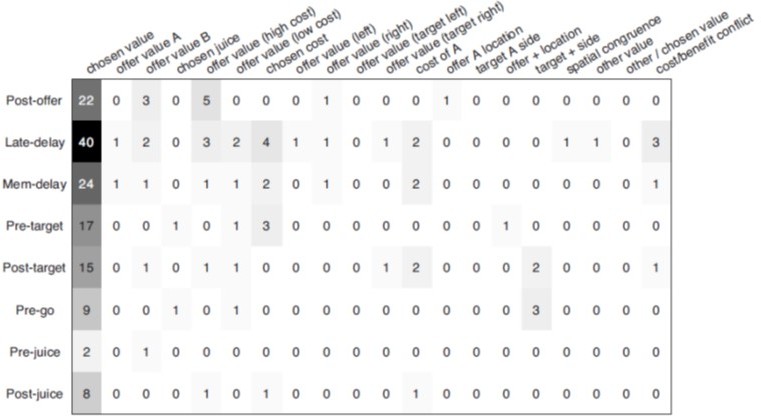
Population summary of analysis of covariance (ANCOVA) (all time windows).
(A) Explained responses. Row and columns represent, respectively, time windows and variables. In each location, the number indicates the number of responses explained by the corresponding variable in that time window. For example, chosen value (juice) explained 34 responses in the post-offer time window. The same numbers are also represented in gray scale. Note that each response could be explained by more than one variable and thus could contribute to multiple bins in this panel. (B) Best fit. In each location, the number indicates the number of responses for which the corresponding variable provided the best fit (highest R2) in that time window. For example, chosen value (juice) provided the best fit for 41 responses in the late-delay time window. The numerical values are also represented in gray scale. In this plot, each response contributes to at most one bin.
-
Figure 4—source data 1
Source data for Figure 4.
- https://cdn.elifesciences.org/articles/71695/elife-71695-fig4-data1-v2.zip
Figure 5
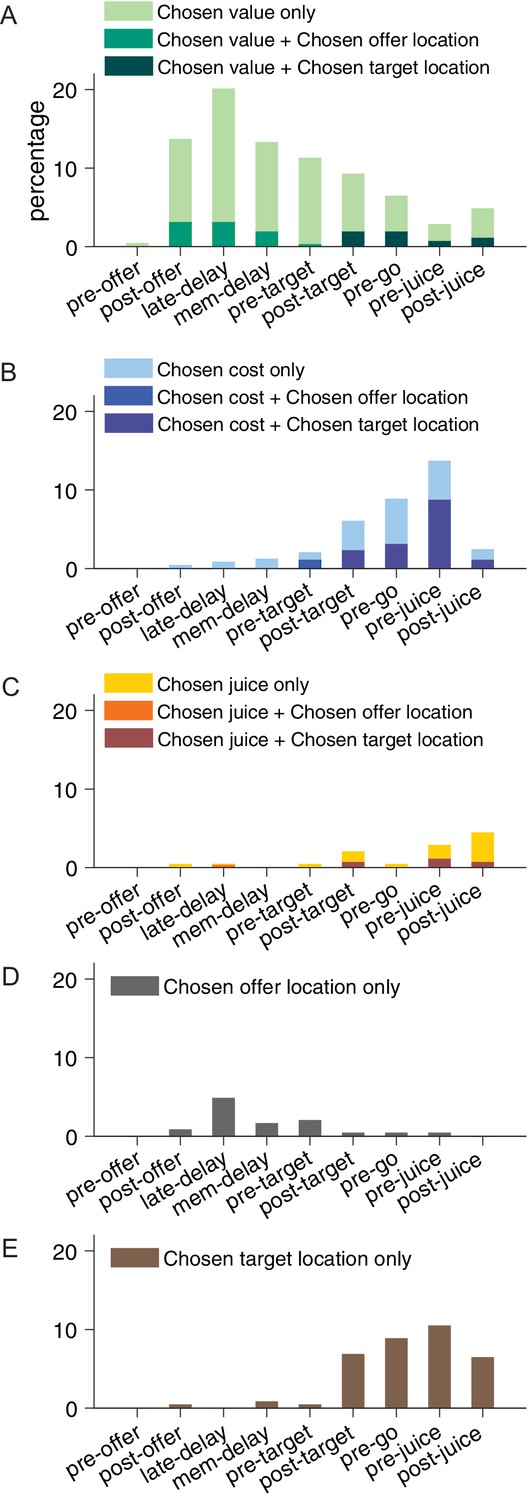
Percentage of encoded variables across task time windows.
(A) Variable chosen value. (B) Variable chosen cost. (C) Variable chosen juice. Light shade indicates the percentage of neurons encoding the covariate but not the categorical variable (chosen offer location in time windows before target presentation or chosen target location in time windows after target presentation, analysis of covariance [ANCOVA], parallel model). Dark shade indicates the percentage of neurons encoding both the covariate and the categorical variable. (D) Variable chosen offer location only. (E) Variable chosen target location only. The same set of variables were selected by stepwise and best-subset variable selection analysis.
Figure 6
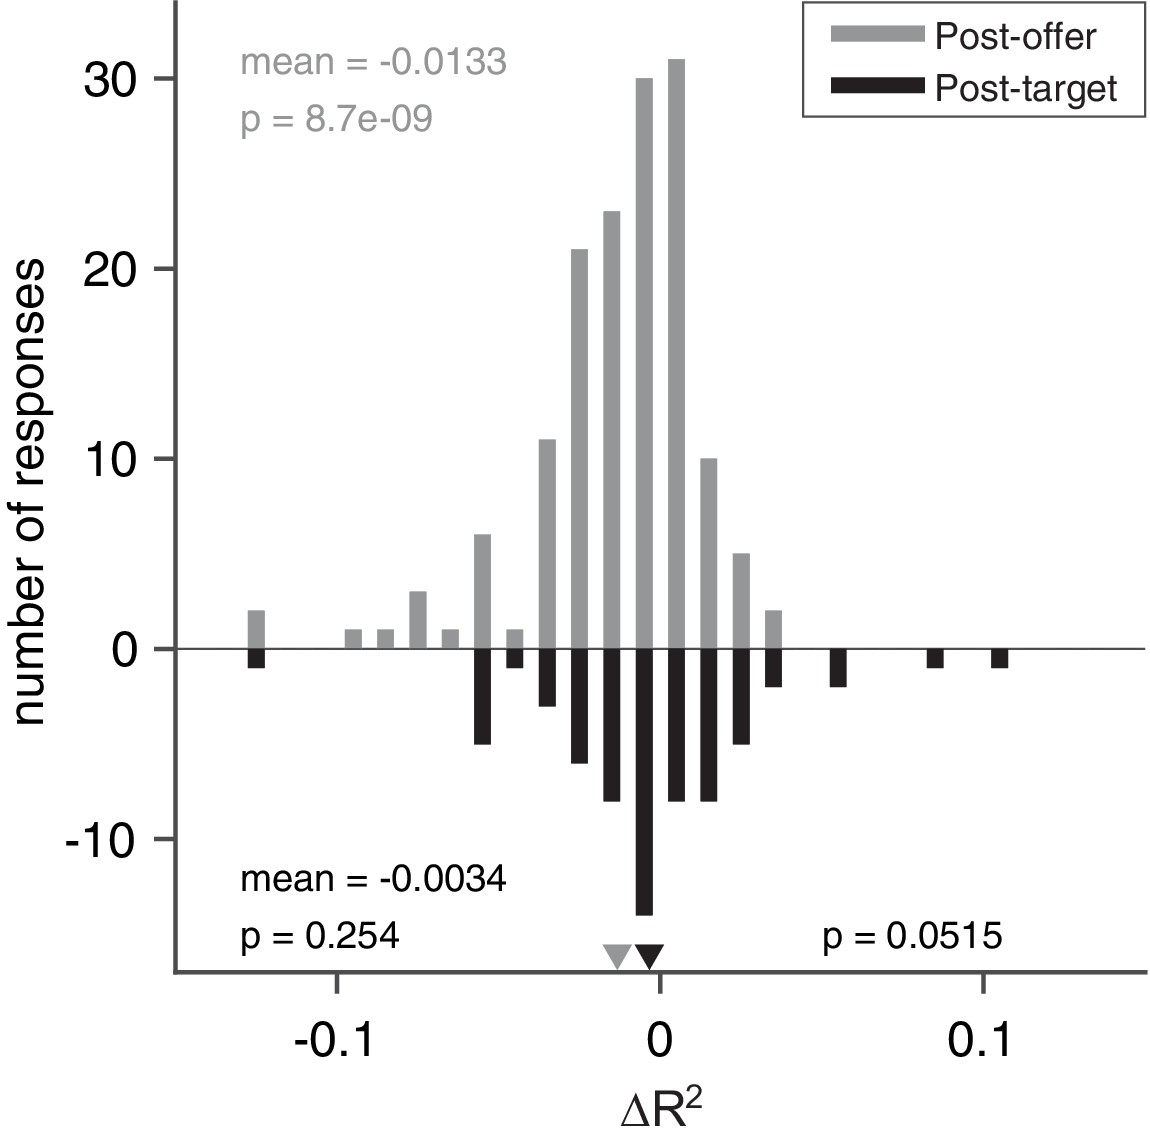
Model comparisons for chosen value responses.
The x-axis represents the difference ΔR2. In this case, we examined separately early time windows (post-offer to pre-target windows, top, N = 148 responses) and late time windows (post-target to post-juice windows, bottom, N = 65 responses). In the early time windows, mean(ΔR2) = –0.013 (p < 10–8, Wilcoxon signed-rank test). In the late time windows, mean(ΔR2) = –0.0034 (p = 0.25, Wilcoxon signed-rank test). The difference between the two measures was marginally significant (p = 0.052, Wilcoxon rank-sum test).
-
Figure 6—source data 1
Source data for Figure 6.
- https://cdn.elifesciences.org/articles/71695/elife-71695-fig6-data1-v2.zip
Figure 7
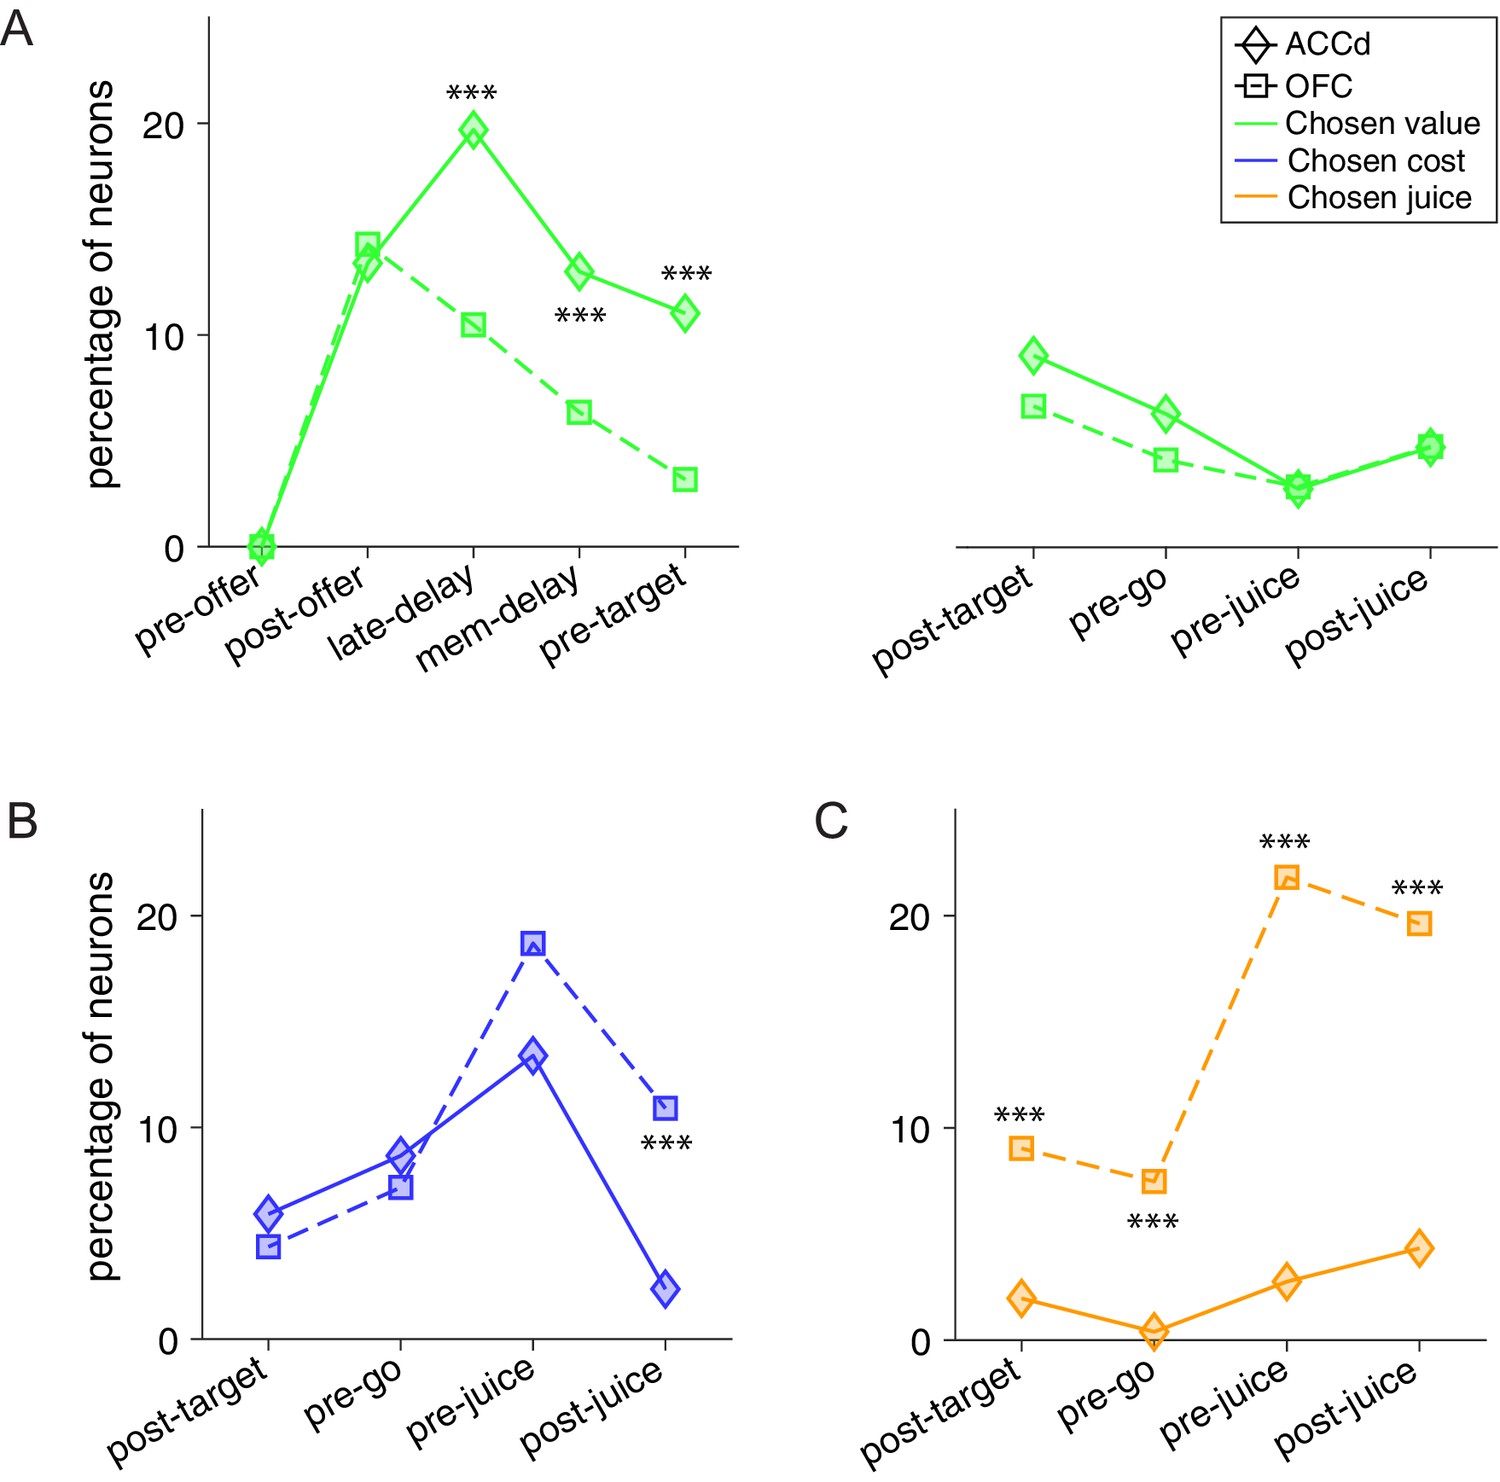
Contrasting the encoding of chosen cost and chosen juice in the dorsal anterior cingulate cortex (ACCd) and orbitofrontal cortex (OFC).
(A) Comparison of the percentage of neurons encoding chosen value in ACCd and OFC (***, p < 0.001, χ2-test). (B) Comparison of the percentage of neurons encoding chosen cost in ACCd and OFC (***, p < 0.001, χ2-test). (C) Comparison of the percentage of neurons encoding chosen juice in ACCd and OFC (***, p < 0.001, χ2-test).
Author response image 1
Author response image 2
Author response image 3
Tables
Table 1
A total of 688 cells were recorded from dorsal anterior cingulate cortex (ACCd) and included in this analysis.
| Trial type | Offer A location | Target A location | Chosen offer location | Chosen target location | |
|---|---|---|---|---|---|
| Pre-offer | 1 | 0 | 0 | 1 | 1 |
| Post-offer | 37 | 1 | 1 | 6 | 1 |
| Late-delay | 55 | 0 | 1 | 17 | 0 |
| Mem-delay | 38 | 1 | 0 | 8 | 1 |
| Pre-target | 34 | 0 | 0 | 7 | 1 |
| Post-target | 42 | 0 | 10 | 0 | 28 |
| Pre-go | 35 | 1 | 6 | 1 | 37 |
| Pre-juice | 39 | 0 | 8 | 2 | 61 |
| Post-juice | 29 | 2 | 1 | 1 | 21 |
| At least 1 | 172 | 5 | 25 | 38 | 108 |
-
Table 1—source data 1
Source data for Table 1.
- https://cdn.elifesciences.org/articles/71695/elife-71695-table1-data1-v2.zip
Table 2
Defined variables.
In any given trial, qA and qB were, respectively, the quantities of juice A and juice B offered to the animal, ρ was the relative value of the two juices, and ξ was the action cost. Parameters ρ and ξ were obtained from the logistic regression (Equation 1). The variable spatial congruence was set = 1 ( = 0) if the offer and the saccade target associated with a given juice (same color) were presented in the same (opposite) hemifield. Variables chosen offer loc only and chosen target loc only provided the best explanation (highest R2) only if it provided the sole explanation (see Materials and methods).
| Collapsed variable | Variable | Definition | Reference frame | |
|---|---|---|---|---|
| 1 | Offer value (juice) | Offer value A | ρ qA + ξ δjuice A,+ | Juice |
| 2 | Offer value B | qB + ξ δjuice B,+ | Juice | |
| 3 | Chosen juice | 1 if juice B is chosen, 0 if juice A is chosen | Juice | |
| 4 | Offer value (cost) | Offer value − | Offer value A if A is high cost, offer value B if B is high cost | Cost |
| 5 | Offer value + | Offer value A if A is low cost, offer value B if B is low cost | Cost | |
| 6 | Chosen cost | 1 if low-cost offer is chosen, 0 if high-cost offer is chosen | Cost | |
| 7 | Offer value (location) | Offer value L | Value of the juice offered on the left | Visual |
| 8 | Offer value R | Value of the juice offered on the right | Visual | |
| 9 | Offer value (target) | Offer value target L | Value of the juice associated with target in the left hemifield | Action |
| 10 | Offer value target R | Value of the juice associated with target in the right hemifield | Action | |
| 11 | Cost of A | 1 if offer A is low cost, 0 if offer A is high cost | ||
| 12 | Offer A location | 1 if juice A is offered on left, 0 if juice A is offered on right | ||
| 13 | Target A location | 1 if target A is in left hemifield, 0 if target A is in right hemifield | ||
| 14 | Offer+ location | 1 if low-cost offer is on the left, 0 if low cost offer is on the right | ||
| 15 | Target+ location | 1 if low-cost target is in the left hemifield, 0 otherwise | ||
| 16 | Spatial congruence | 1 if offers and targets are spatially congruent, 0 otherwise | ||
| 17 | Chosen value | Offer value A if juice A chosen, offer value B if juice B chosen | ||
| 18 | Value ratio | Other/chosen value | ||
| 19 | Cost/benefit conflict | Cost of A × sign(offer value A – offer value B). 1 if there is conflict, 0 otherwise | ||
| 20 | Chosen offer loc only | 1 if the chosen offer is on the left, 0 otherwise | Visual | |
| 21 | Chosen target loc only | 1 if the chosen target is in the left hemifield, 0 otherwise | Action |
Author response table 1
| Offer value (juice) | |||||||
|---|---|---|---|---|---|---|---|
| ACCd | OFC | ||||||
| Number | Percentage | p (binomial test) | Number | Percentage | p (binomial test) | p (chi-square test) | |
| Post-offer | 5 | 2.0 | 0.9953 | 60 | 18.9 | 0 | 0 |
| Late-delay | 4 | 1.6 | 0.9987 | 44 | 13.9 | 0 | 0 |
| Mem-delay | 1 | 0.40 | 1 | 26 | 8.2 | 0.0099 | 0 |
| Pre-target | 0 | 0 | 1 | 17 | 5.4 | 0.4188 | 0.0002 |
Author response table 2
| Offer value (cost) | |||||||
|---|---|---|---|---|---|---|---|
| ACCd | OFC | ||||||
| Number | Percentage | p (binomial test) | Number | Percentage | p (binomial test) | p (chi-square test) | |
| Post-offer | 3 | 1.2 | 0.9997 | 27 | 8.5 | 0.0054 | 0.0001 |
| Late-delay | 4 | 1.6 | 0.9987 | 20 | 6.3 | 0.1719 | 0.0059 |
| Mem-delay | 3 | 1.2 | 0.9997 | 8 | 2.5 | 0.9905 | 0.2592 |
| Pre-target | 6 | 2.4 | 0.9865 | 10 | 3.2 | 0.9573 | 0.5956 |
Additional files
Download links
A two-part list of links to download the article, or parts of the article, in various formats.
Downloads (link to download the article as PDF)
Open citations (links to open the citations from this article in various online reference manager services)
Cite this article (links to download the citations from this article in formats compatible with various reference manager tools)
Neuronal activity in dorsal anterior cingulate cortex during economic choices under variable action costs
eLife 10:e71695.
https://doi.org/10.7554/eLife.71695


