Inequalities in the distribution of National Institutes of Health research project grant funding
- National Institutes of Health, Office of the Director, United States
- NIH Office of Extramural Research, United States
Figures
Figure 1
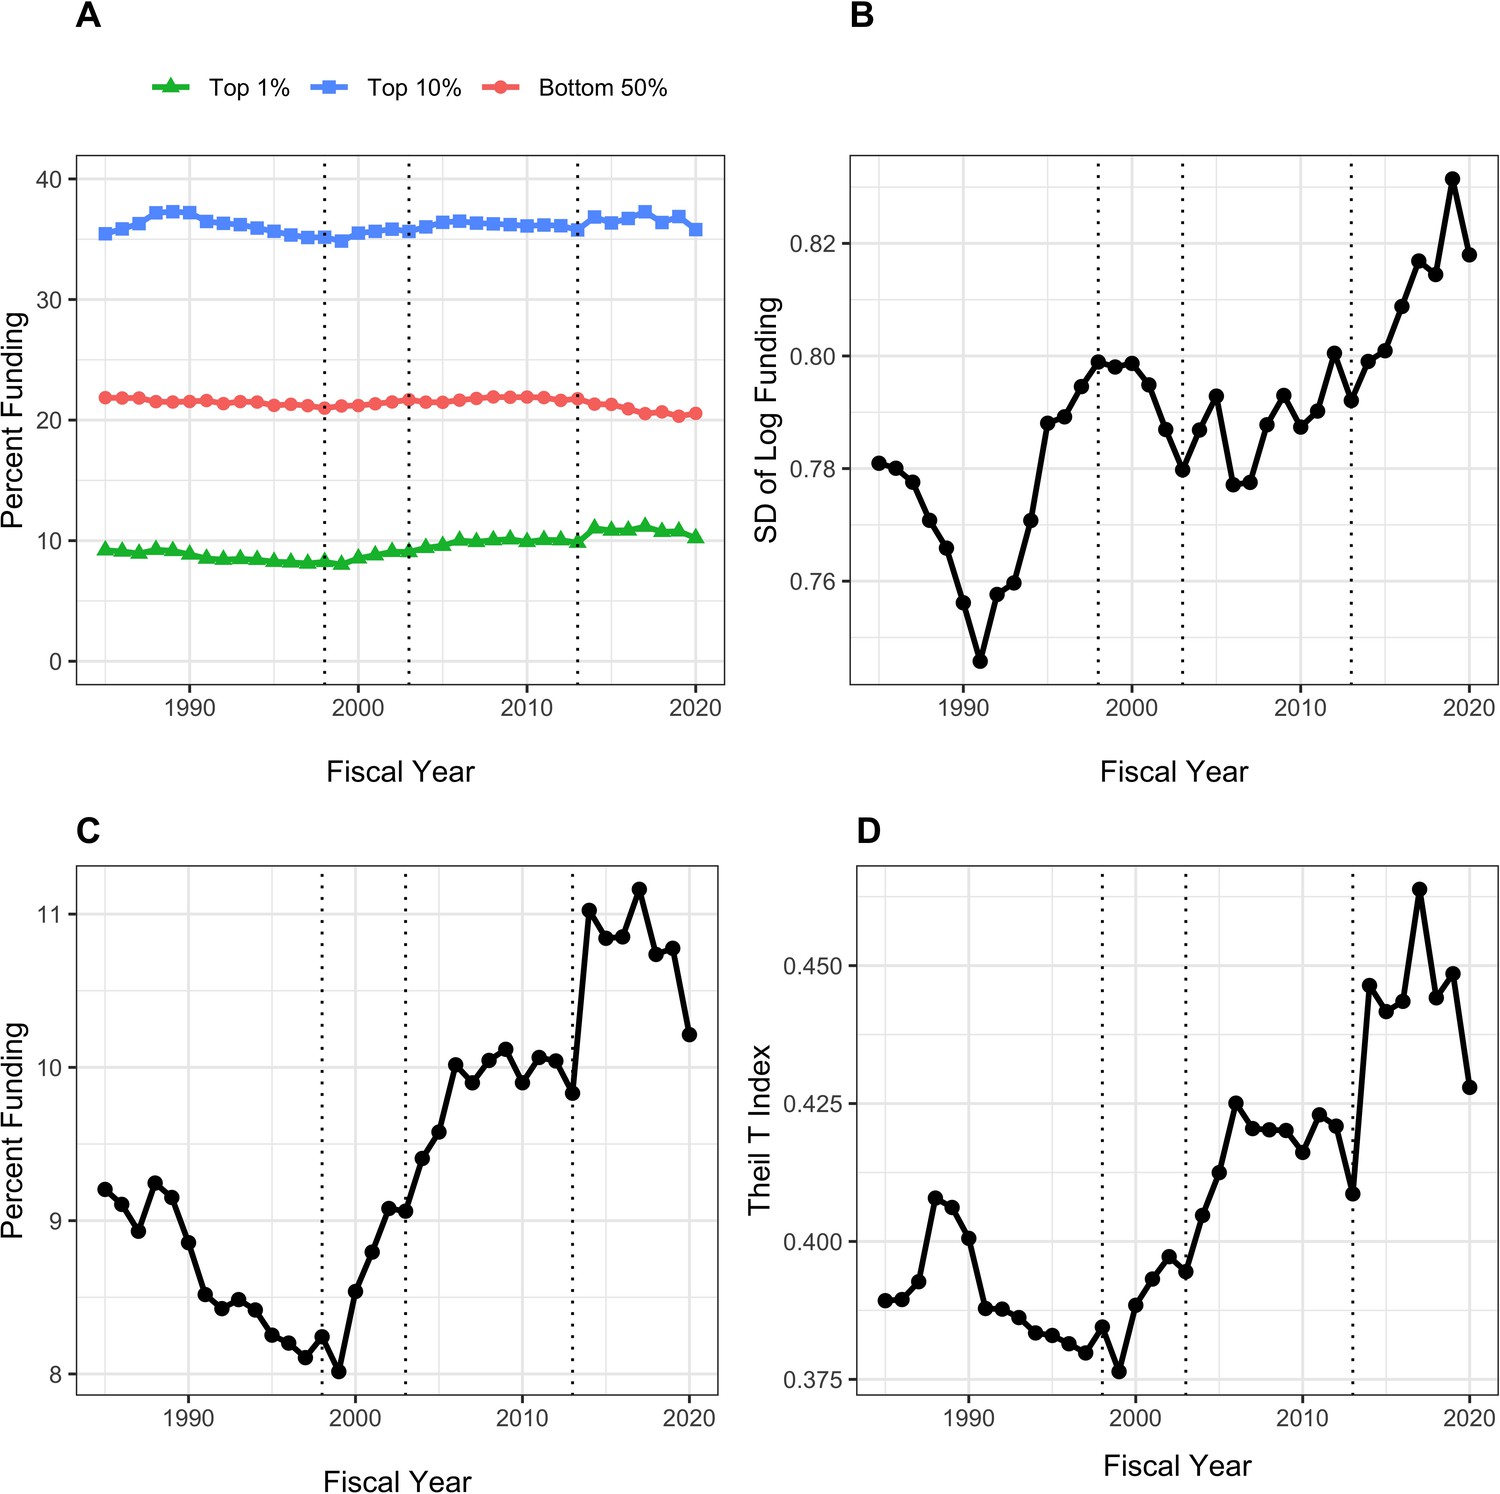
Distribution of Research Project Grant (RPG) Principal Investigator (PI) Funding, Fiscal Years 1985–2020.
Panel A: Percent of RPG funds distributed to the top centile, top decile, and bottom half of investigators. Panel B: Standard deviation of the log of funding, a measure that focuses primarily on lower and intermediate levels of funding. Panel C: Percent of RPG funds distributed solely to the top centile of investigators. Panel D: Theil T index, a measure more sensitive to the highest funding levels, and hence has a similar appearance to percent of funds distributed to the top centile. The vertical dotted lines refer to the beginning and end of the NIH doubling and the year of budget sequestration (2013).
Figure 2
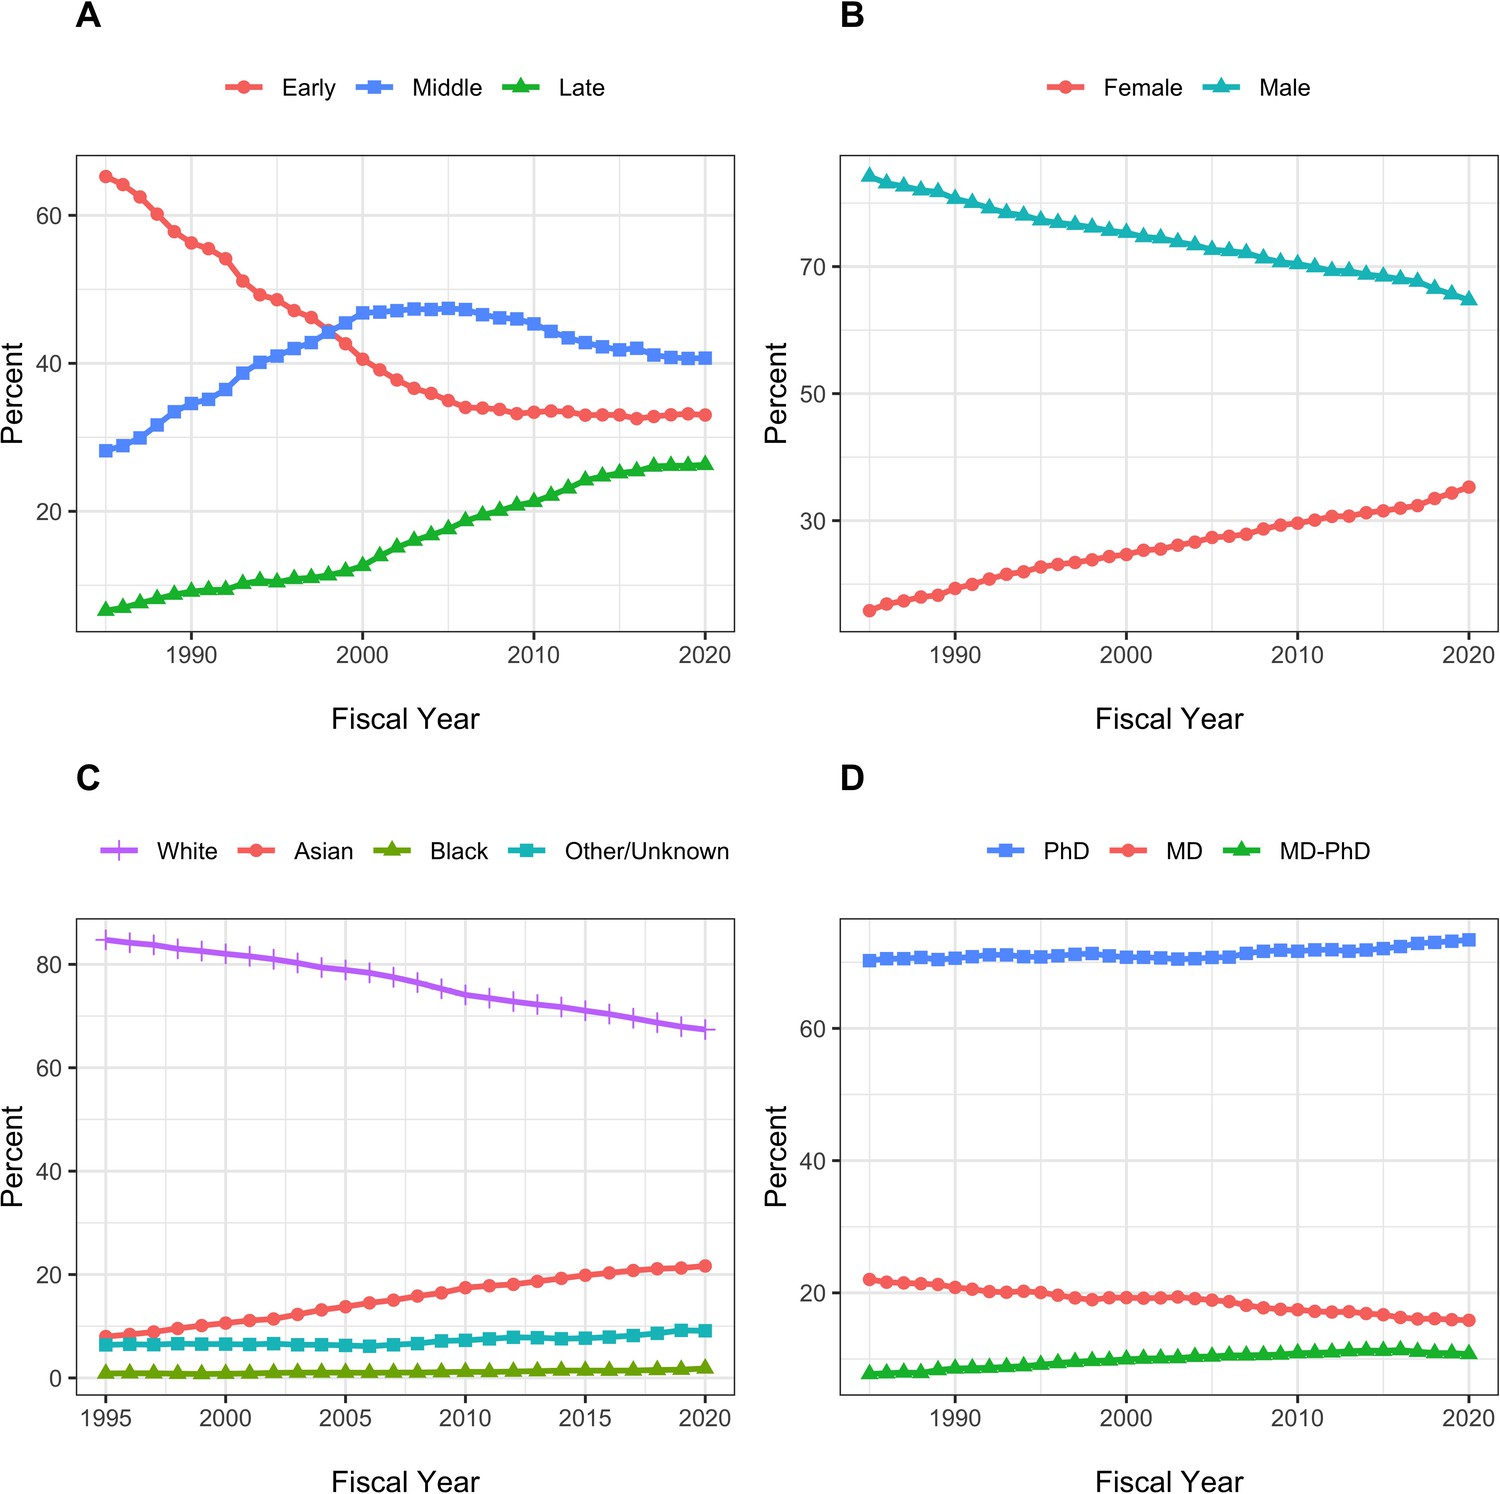
Secular changes in the composition of the RPG PI Workforce from fiscal year 1985 to fiscal year 2020.
Race data are shown from 1995 on due to high proportions of unknown values beforehand. Each plot shows the percentage of RPG PIs according to different groupings. All percentages add up to 100. Panel A: Career Stage. Panel B: Gender. Panel C: Race. Panel D: Degree.
Figure 3
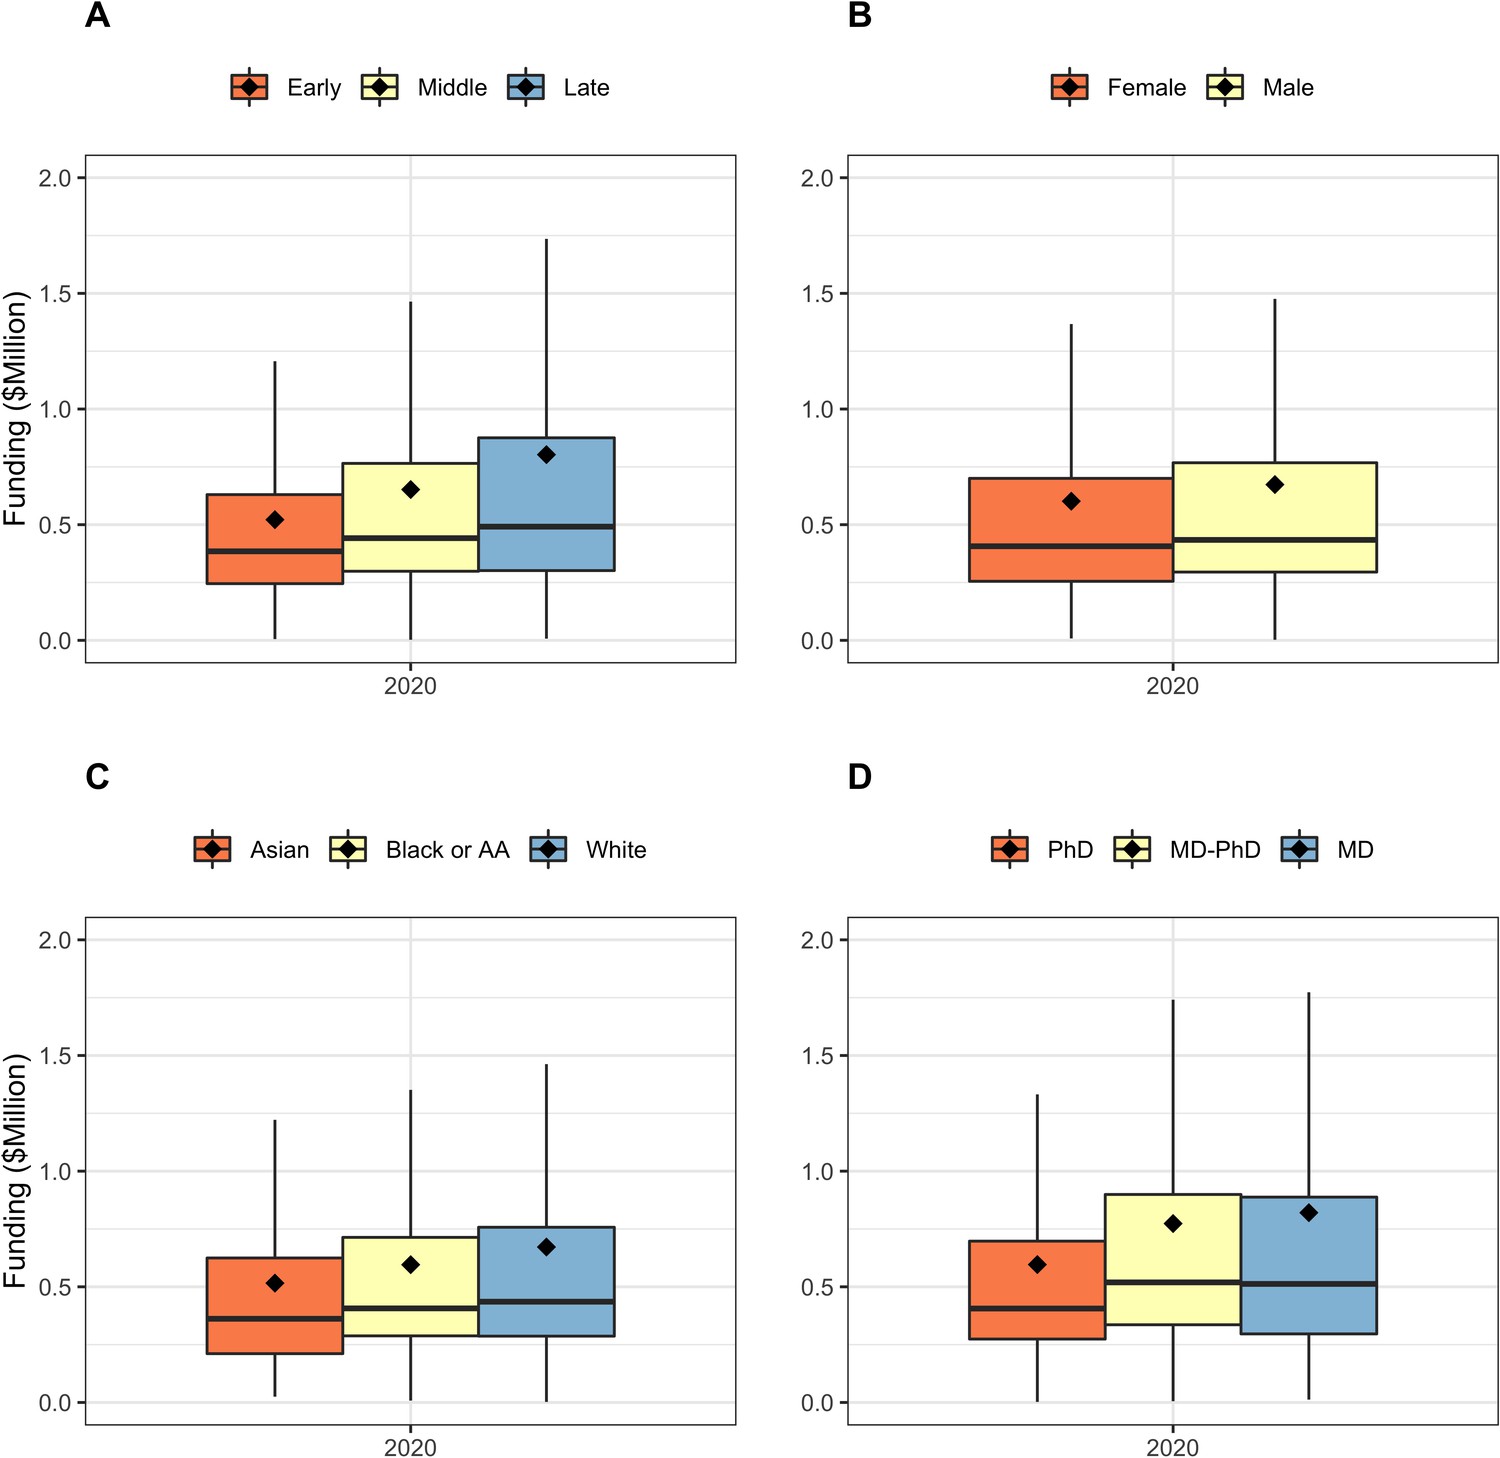
Box plots showing the distribution of funding in FY2020 according to PI groups.
Diamonds refer to means; the higher means compared to medians reflect highly skewed distributions. Outliers are not displayed Panel A: Career Stage. Panel B: Gender. Panel C: Race. Panel D: Degree. For all groups, variability appears to be greater within groups than between groups. AA = African-American.
Figure 4

Components of Theil index, showing between-group and within-group contributions to overall inequality over time.
Panel A: Career Stage. Panel B: Gender. Panel C: Race. Panel D: Degree. For all groups, within-group differences contribute more to inequality than between-group differences.
Figure 5
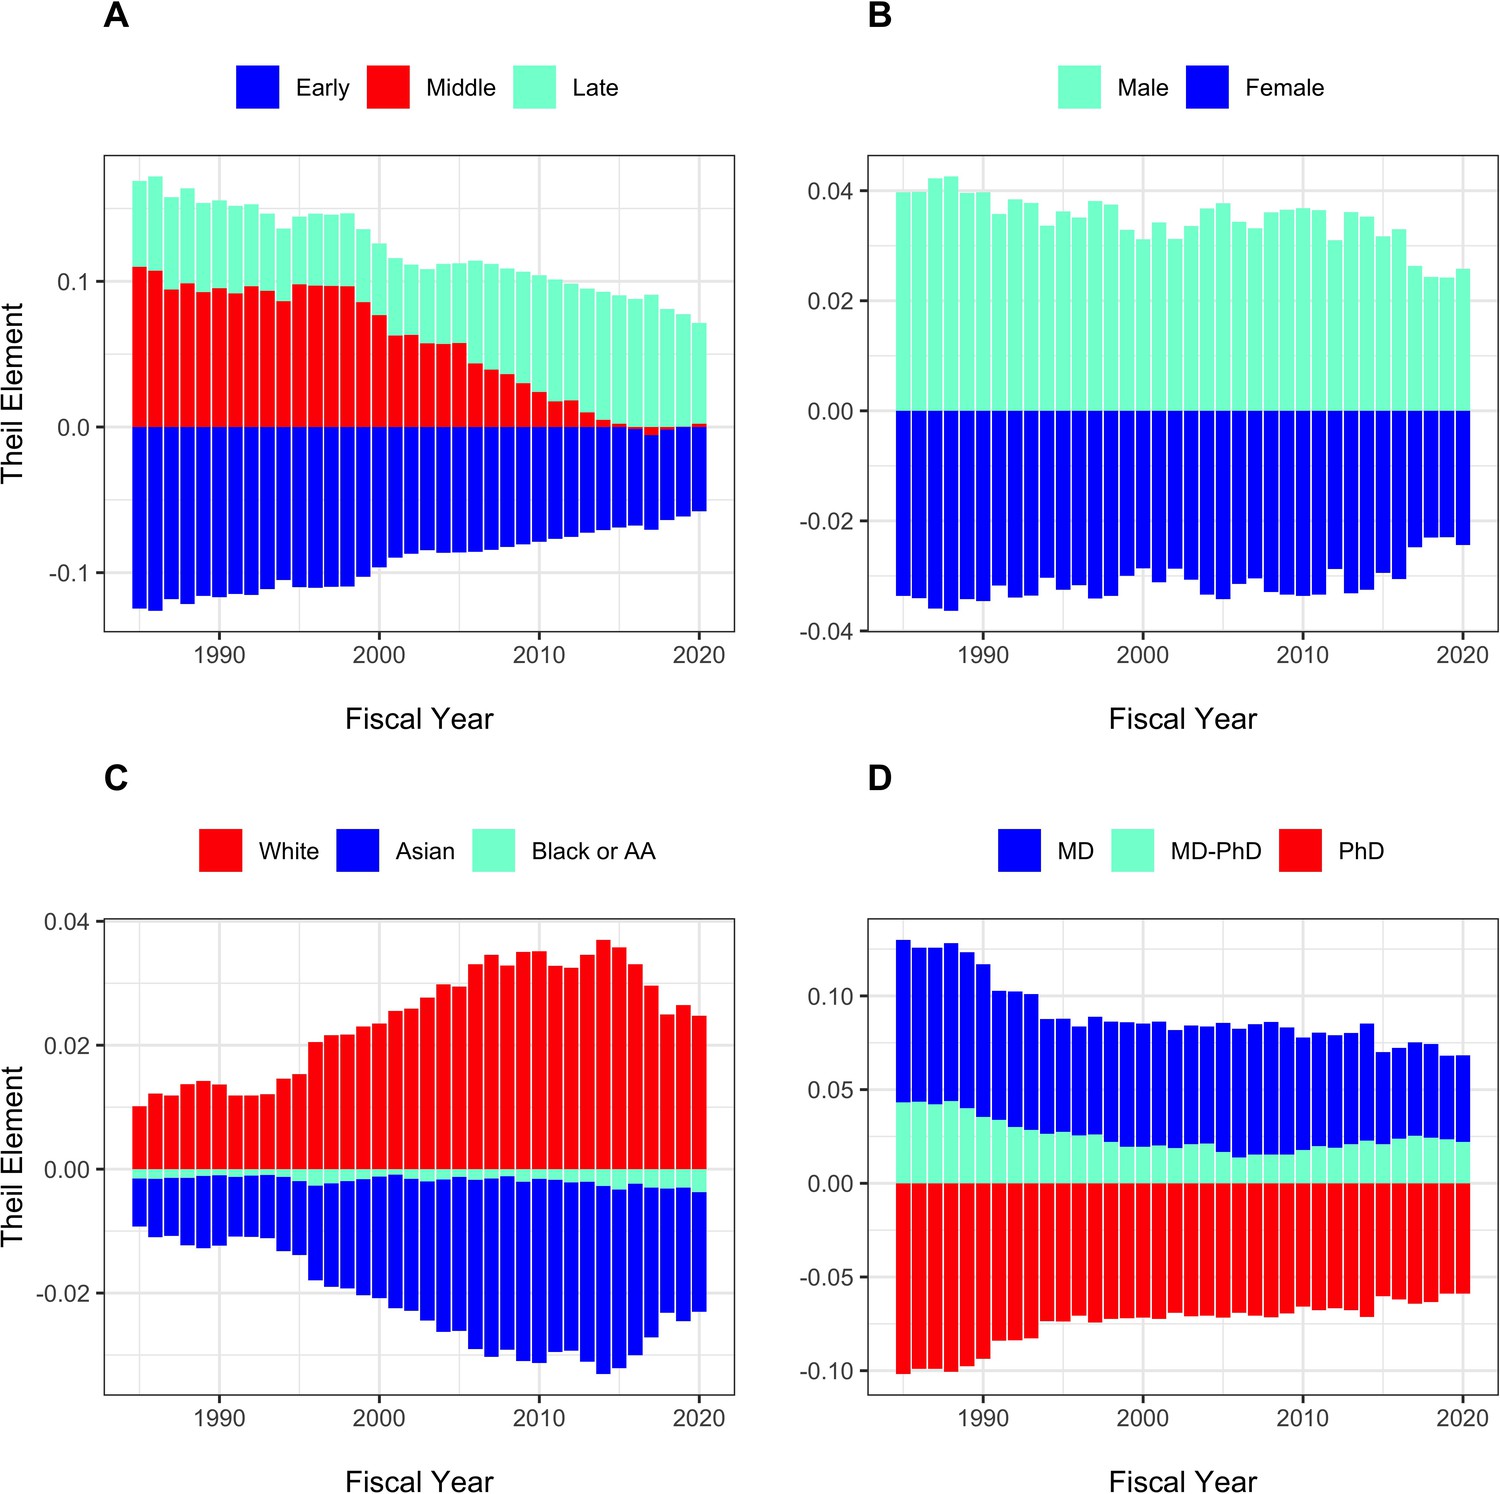
Theil Elements in different groups over time.
Panel A: Career stage. Panel B: Gender. Panel C: Race. Panel D: Degree. Values above the zero line indicate that groups received above average funding, while values below zero indicate below average funding. Thus, as in Panel A, late stage investigators received above average funding and early stage investigators received below average funding. Middle career investigators initially received above average funding, but in recent years have received funding close to average, contributing little to inequality. AA = African-American.
Figure 6
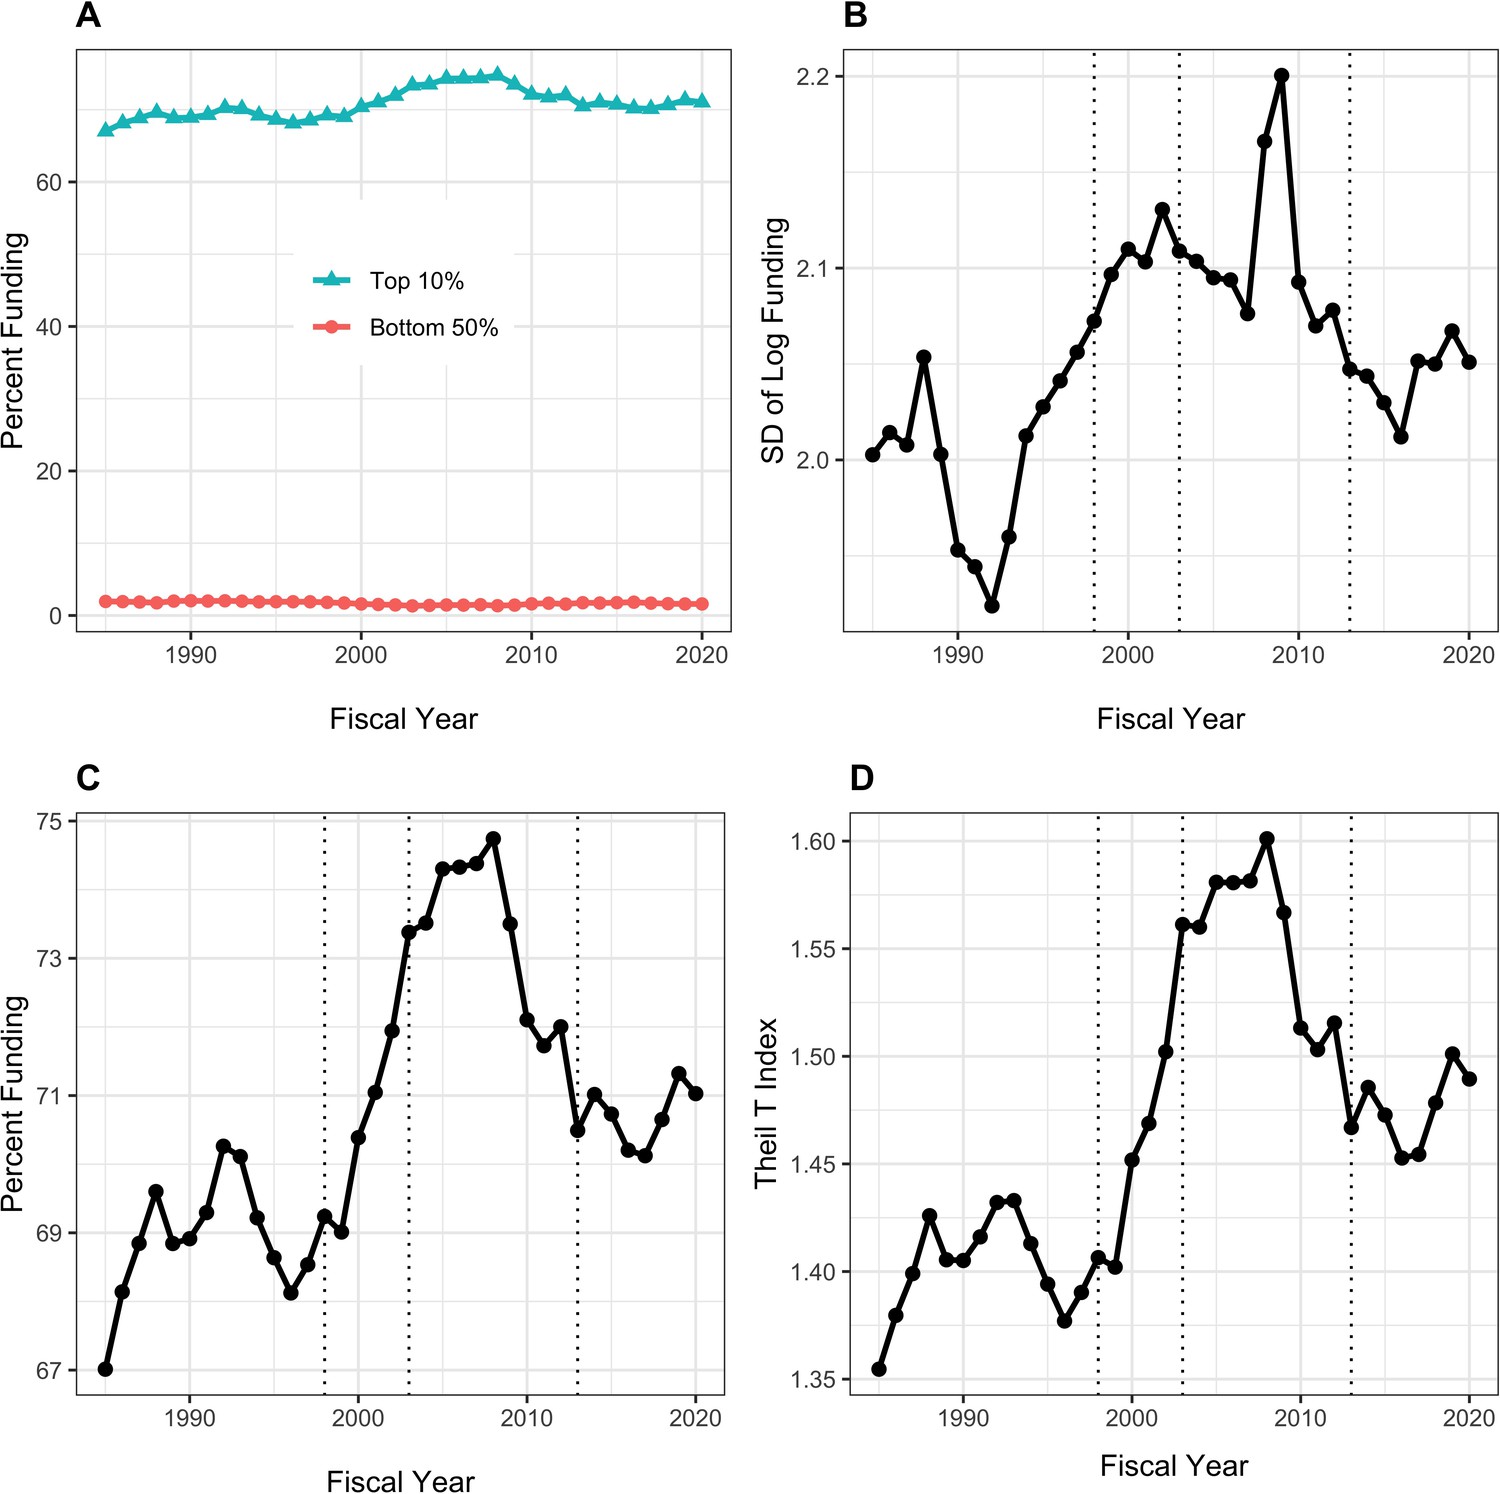
Distribution of Research Project Grant (RPG) Organization Funding, Fiscal Years 1985–2020.
Panel A: Percent of RPG funds distributed to the top decile and bottom half of organizations. Panel B: Standard deviation of the log of funding, a measure that focuses primarily on lower and intermediate levels. Panel C: Percent of RPG funds distributed solely to the top decile of organizations. Panel D: Theil T index, a measure more sensitive to the highest funding levels, and hence has a similar appearance to percent of funds distributed to the top centile. The vertical dotted lines in Panels B, C, and D refer to the beginning and end of the NIH doubling and the year of budget sequestration (2013).
Figure 7
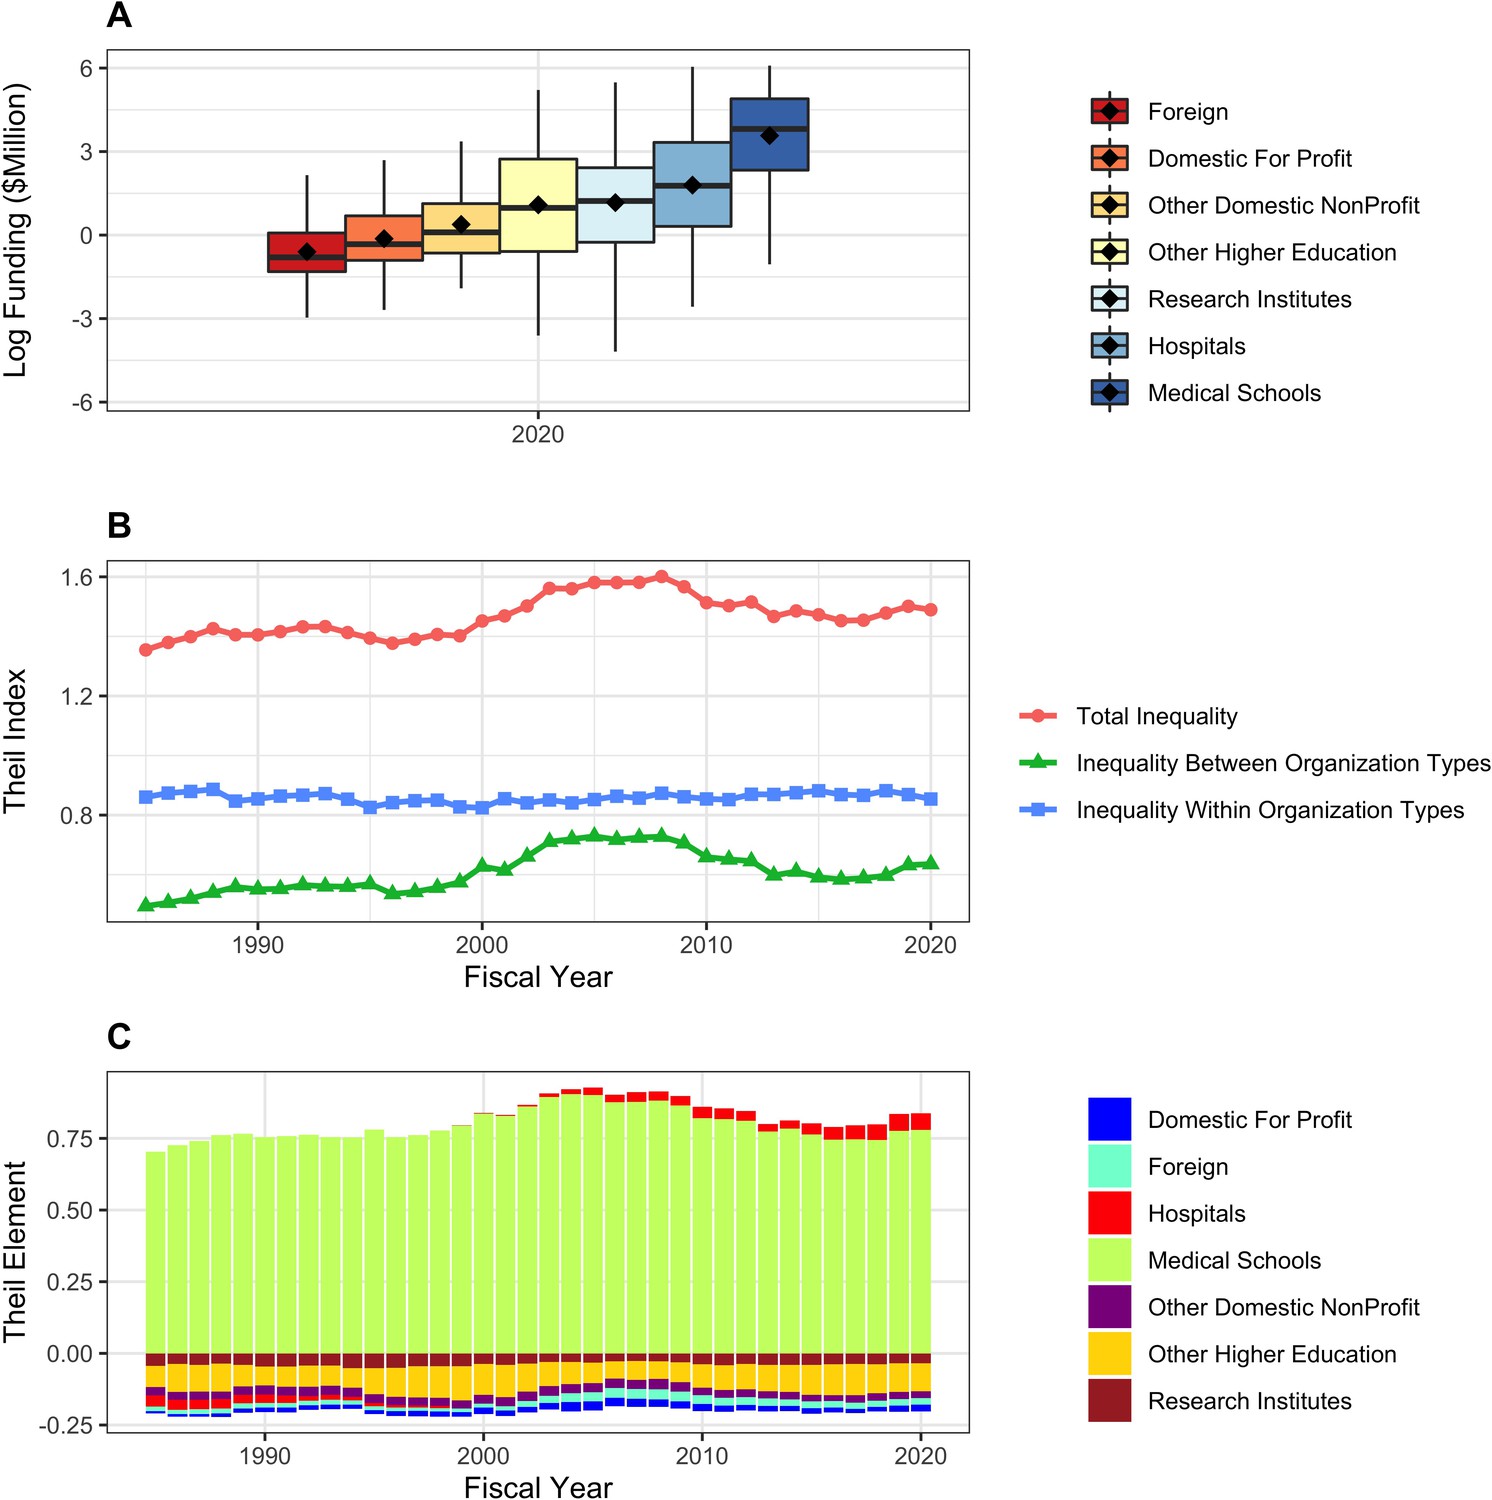
RPG funding distribution and inequalities according to organization type.
Panel A: Box plots showing distributions of log-transformed RPG funding in FY2020. Panel B: Theil index components plot, showing that both between group and within group inequalities contribute to overall inequality. Panel C: Theil elements plot. Values above the zero line indicate that groups received above average fundings, while values below zero indicate below average funding. Medical schools and hospitals received above average funding.
Figure 8

RPG funding distribution and inequalities according to organization region.
Panel A: Box plots showing distributions of log-transformed RPG funding in FY2020. Panel B: Theil index components plot, showing that within group inequalities primarily contribute to overall inequality. Panel C: Theil elements plot. Values above the zero line indicate that groups received above average fundings, while values below zero indicate below average funding. Foreign organizations received below average funding.
Figure 9
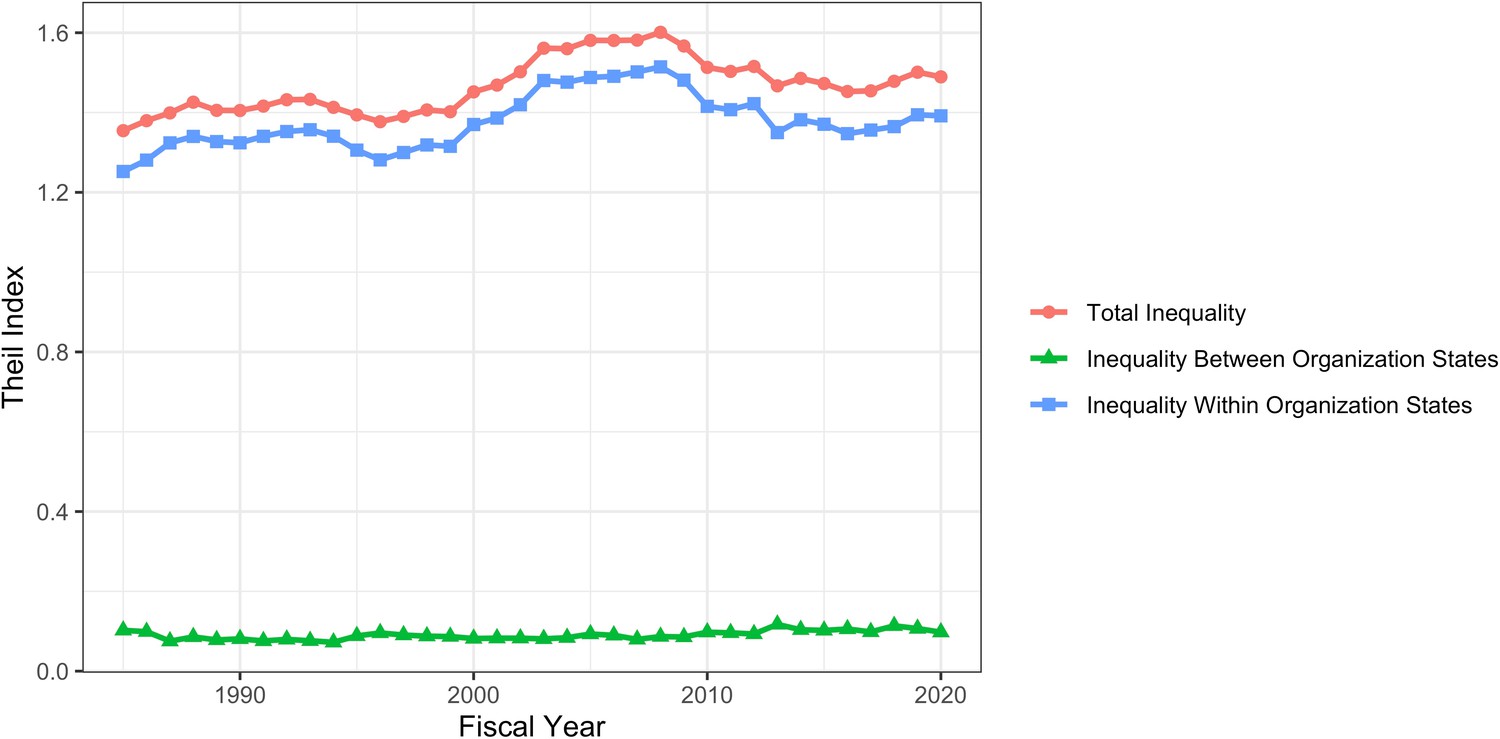
RPG funding distribution and inequalities according to organization state within the United States.
The panel shows a Theil index components plot, showing that within state inequalities contribute more to overall inequality than between-state inequality.
Figure 10
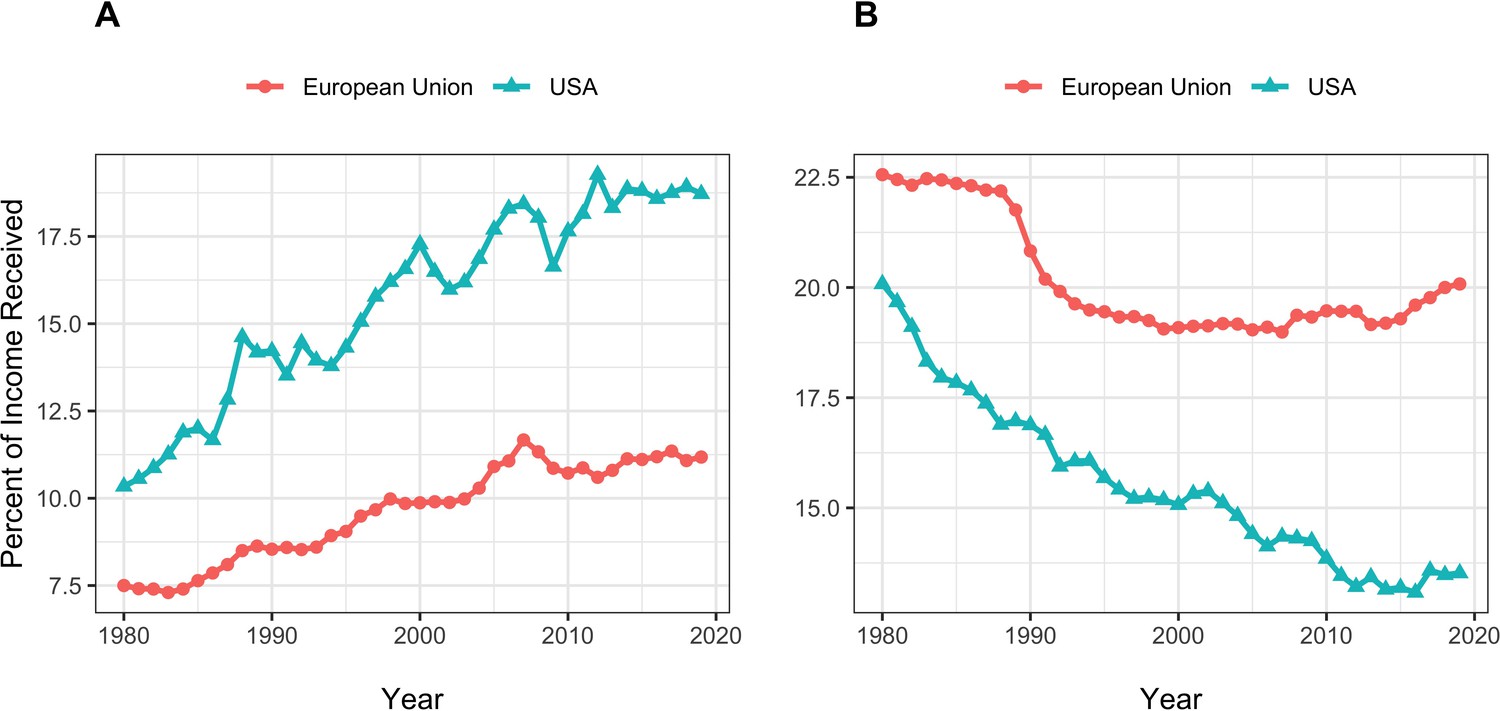
United States and European Union income equality measures from the World Inequality Database.
Panel A: Percent of income going to the top centile of the population. Panel B: Percent of income going to the bottom half.
-
Figure 10—source data 1
Data from the World Inequality Database.
- https://cdn.elifesciences.org/articles/71712/elife-71712-fig10-data1-v2.rdata
Tables
Table 1
Investigator characteristics according to centile of funding in fiscal year 2020.
Values shown in parentheses are percentages for categorical variables and IQR for continuous variables. IQR = inter-quartile range. ND = not displayed due to small cell size.
| Characteristic | Top 1% | Bottom 99% | |
|---|---|---|---|
| Total N (%) | 349 (1.0) | 34587 (99.0) | |
| Career Stage | Early | 30 (8.6) | 10567 (30.6) |
| Middle | 128 (36.7) | 12936 (37.4) | |
| Late | 162 (46.4) | 8273 (23.9) | |
| Gender | Female | 102 (29.2) | 11858 (34.3) |
| Male | 241 (69.1) | 21695 (62.7) | |
| Race | White | 277 (79.4) | 23264 (67.3) |
| Asian | 42 (12.0) | 7523 (21.8) | |
| Black or African-American | ND | 639 (1.8) | |
| More than One Race | ND | 418 (1.2) | |
| Ethnicity | Hispanic | 12 (3.4) | 1622 (4.7) |
| Not Hispanic | 306 (87.7) | 29513 (85.3) | |
| Degree | PhD | 166 (47.6) | 24620 (71.2) |
| MD | 116 (33.2) | 5238 (15.1) | |
| MD-PhD | 60 (17.2) | 3572 (10.3) | |
| Other | ND | 1157 (3.3) | |
| Funding in $Million | Median (IQR) | 4.8 (4.0 to 6.5) | 0.4 (0.3 to 0.7) |
| Number of RPG Awards | One | 69 (19.8) | 23268 (67.3) |
| Two | 86 (24.6) | 7571 (21.9) | |
| Three | 52 (14.9) | 2540 (7.3) | |
| Four | 60 (17.2) | 847 (2.4) | |
| Five or More | 82 (23.5) | 361 (1.0) |
Table 2
Investigator characteristics according to centile of funding in fiscal year 1995.
Data on ethnicity are not provided due to high rates of missingness (more than one-third). Dollar values are inflation-adjusted to a FY2019 reference standard. Values shown in parentheses are percentages for categorical variables and IQR for continuous variables. IQR = inter-quartile range. ND = not displayed due to small cell size.
| Characteristic | Top 1% | Bottom 99% | |
|---|---|---|---|
| Total N (%) | 192 (1.0) | 19029 (99.0) | |
| Career Stage | Early | 37 (19.3) | 8757 (46.0) |
| Middle | 111 (57.8) | 7305 (38.4) | |
| Late | 33 (17.2) | 1852 (9.7) | |
| Gender | Female | 23 (12.0) | 4266 (22.4) |
| Male | 165 (85.9) | 14439 (75.9) | |
| Race | White | 167 (87.0) | 16121 (84.7) |
| Asian | 14 (7.3) | 1525 (8.0) | |
| Black or African-American | ND | 164 (0.9) | |
| More than One Race | ND | 89 (0.5) | |
| Degree | PhD | 72 (37.5) | 13418 (70.5) |
| MD | 81 (42.2) | 3740 (19.7) | |
| MD-PhD | 38 (19.8) | 1703 (8.9) | |
| Other | ND | 168 (0.9) | |
| Funding in $Million | Median (IQR) | 4.5 (4.0 to 5.7) | 0.4 (0.3 to 0.7) |
| Number of RPG Awards | One | 46 (24.0) | 14894 (78.3) |
| Two | 61 (31.8) | 3391 (17.8) | |
| Three | 57 (29.7) | 617 (3.2) | |
| Four | 22 (11.5) | 115 (0.6) | |
| Five or More | ND | 12 (0.1) |
Table 3
Investigator characteristics according to career stage in fiscal year 2020.
Values shown in parentheses are percentages for categorical variables and IQR for continuous variables. IQR = inter-quartile range.
| Characteristic | Early | Middle | Late | |
|---|---|---|---|---|
| Total N (%) | 10597 (30.3) | 13064 (37.4) | 8435 (24.1) | |
| Gender | Female | 4241 (40.0) | 4505 (34.5) | 2267 (26.9) |
| Male | 6145 (58.0) | 8464 (64.8) | 6128 (72.6) | |
| Race | White | 6855 (64.7) | 8509 (65.1) | 6990 (82.9) |
| Asian | 2515 (23.7) | 3440 (26.3) | 955 (11.3) | |
| Black or African-American | 270 (2.5) | 232 (1.8) | 84 (1.0) | |
| More than One Race | 209 (2.0) | 153 (1.2) | 42 (0.5) | |
| Degree | PhD | 8643 (81.6) | 9115 (69.8) | 5355 (63.5) |
| MD | 1067 (10.1) | 2006 (15.4) | 1935 (22.9) | |
| MD-PhD | 651 (6.1) | 1714 (13.1) | 998 (11.8) | |
| Other | 236 (2.2) | 229 (1.8) | 147 (1.7) | |
| Funding in $Million | Median (IQR) | 0.4 (0.2 to 0.6) | 0.4 (0.3 to 0.8) | 0.5 (0.3 to 0.9) |
| Funding Percentile Rank | Median (IQR) | 55.3 (31.7 to 78.2) | 47.2 (23.2 to 72.2) | 42.5 (18.6 to 71.7) |
| Number of RPG Awards | One | 7704 (72.7) | 8149 (62.4) | 5377 (63.7) |
| Two | 2047 (19.3) | 3163 (24.2) | 1957 (23.2) | |
| Three | 584 (5.5) | 1155 (8.8) | 701 (8.3) | |
| Four | 183 (1.7) | 384 (2.9) | 268 (3.2) | |
| Five or More | 79 (0.7) | 213 (1.6) | 132 (1.6) |
Table 4
Investigator characteristics according to gender in fiscal year 2020.
Values shown in parentheses are percentages for categorical variables and IQR for continuous variables. IQR = inter-quartile range.
| Characteristic | Women | Men | |
|---|---|---|---|
| Total N (%) | 11960 (34.2) | 21936 (62.8) | |
| Career Stage | Early | 4241 (35.5) | 6145 (28.0) |
| Middle | 4505 (37.7) | 8464 (38.6) | |
| Late | 2267 (19.0) | 6128 (27.9) | |
| Race | White | 8528 (71.3) | 14876 (67.8) |
| Asian | 2405 (20.1) | 5106 (23.3) | |
| Black or African-American | 296 (2.5) | 342 (1.6) | |
| More than One Race | 189 (1.6) | 230 (1.0) | |
| Degree | PhD | 9093 (76.0) | 15278 (69.6) |
| MD | 1734 (14.5) | 3540 (16.1) | |
| MD-PhD | 867 (7.2) | 2732 (12.5) | |
| Other | 266 (2.2) | 386 (1.8) | |
| Funding in $Million | Median (IQR) | 0.4 (0.3 to 0.7) | 0.4 (0.3 to 0.8) |
| Funding Percentile Rank | Median (IQR) | 51.3 (27.1 to 76.7) | 48.0 (23.1 to 72.7) |
| Number of RPG Awards | One | 8409 (70.3) | 14002 (63.8) |
| Two | 2512 (21.0) | 5066 (23.1) | |
| Three | 732 (6.1) | 1833 (8.4) | |
| Four | 212 (1.8) | 688 (3.1) | |
| Five or More | 95 (0.8) | 347 (1.6) |
Table 5
Investigator characteristics according to race in fiscal year 2020.
Values shown in parentheses are percentages for categorical variables and IQR for continuous variables. IQR = inter-quartile range. ND = not displayed due to small cell size.
| Characteristic | White | Asian | Black or African-American | |
|---|---|---|---|---|
| Total N (%) | 23541 (67.4) | 7565 (21.7) | 643 (1.8) | |
| Career Stage | Early | 6855 (29.1) | 2515 (33.2) | 270 (42.0) |
| Middle | 8509 (36.1) | 3440 (45.5) | 232 (36.1) | |
| Late | 6990 (29.7) | 955 (12.6) | 84 (13.1) | |
| Gender | Female | 8528 (36.2) | 2405 (31.8) | 296 (46.0) |
| Male | 14876 (63.2) | 5106 (67.5) | 342 (53.2) | |
| Degree | PhD | 17086 (72.6) | 5398 (71.4) | 406 (63.1) |
| MD | 3831 (16.3) | 976 (12.9) | 141 (21.9) | |
| MD-PhD | 2211 (9.4) | 1094 (14.5) | 73 (11.4) | |
| Other | 413 (1.8) | 97 (1.3) | 23 (3.6) | |
| Funding in $Million | Median (IQR) | 0.4 (0.3 to 0.8) | 0.4 (0.3 to 0.7) | 0.4 (0.2 to 0.6) |
| Funding Percentile Rank | Median (IQR) | 47.8 (23.6 to 73.6) | 51.3 (26.3 to 73.5) | 60.7 (32.1 to 83.8) |
| Number of RPG Awards | One | 15506 (65.9) | 4914 (65.0) | 504 (78.4) |
| Two | 5344 (22.7) | 1688 (22.3) | 103 (16.0) | |
| Three | 1784 (7.6) | 616 (8.1) | 25 (3.9) | |
| Four | 611 (2.6) | 230 (3.0) | ND | |
| Five or More | 296 (1.3) | 117 (1.5) | ND |
Additional files
-
Source code 1
Source code for entire paper.
- https://cdn.elifesciences.org/articles/71712/elife-71712-code1-v2.zip
-
Source data 1
Anonymized organization data.
- https://cdn.elifesciences.org/articles/71712/elife-71712-data1-v2.rdata
-
Source data 2
Anonymized PI data.
- https://cdn.elifesciences.org/articles/71712/elife-71712-data2-v2.rdata
-
Transparent reporting form
- https://cdn.elifesciences.org/articles/71712/elife-71712-transrepform-v2.docx
Download links
A two-part list of links to download the article, or parts of the article, in various formats.
Downloads (link to download the article as PDF)
Open citations (links to open the citations from this article in various online reference manager services)
Cite this article (links to download the citations from this article in formats compatible with various reference manager tools)
Inequalities in the distribution of National Institutes of Health research project grant funding
eLife 10:e71712.
https://doi.org/10.7554/eLife.71712


