Adverse childhood experiences and resilience among adult women: A population-based study
- Centre of Public Health Sciences, Faculty of Medicine, University of Iceland, Iceland
- Department of Medical Epidemiology & Biostatistics, Karolinska Institutet, Sweden
- Clinical Epidemiology and Biostatistics, School of Medical Sciences, Örebro University, Sweden
- Institute of Environmental Medicine, Karolinska Institutet, Sweden
- Department of Psychiatry, Massachusetts General Hospital, United States
- Harvard T.H. Chan School of Public Health, United States
- Department of Medical Sciences, Molecular Epidemiology and Science for Life Laboratory, Uppsala University, Sweden
- Department of Psychology, Reykjavík University, Iceland
- West China Biomedical Big Data Center, West China Hospital, Sichuan University, China
Figures
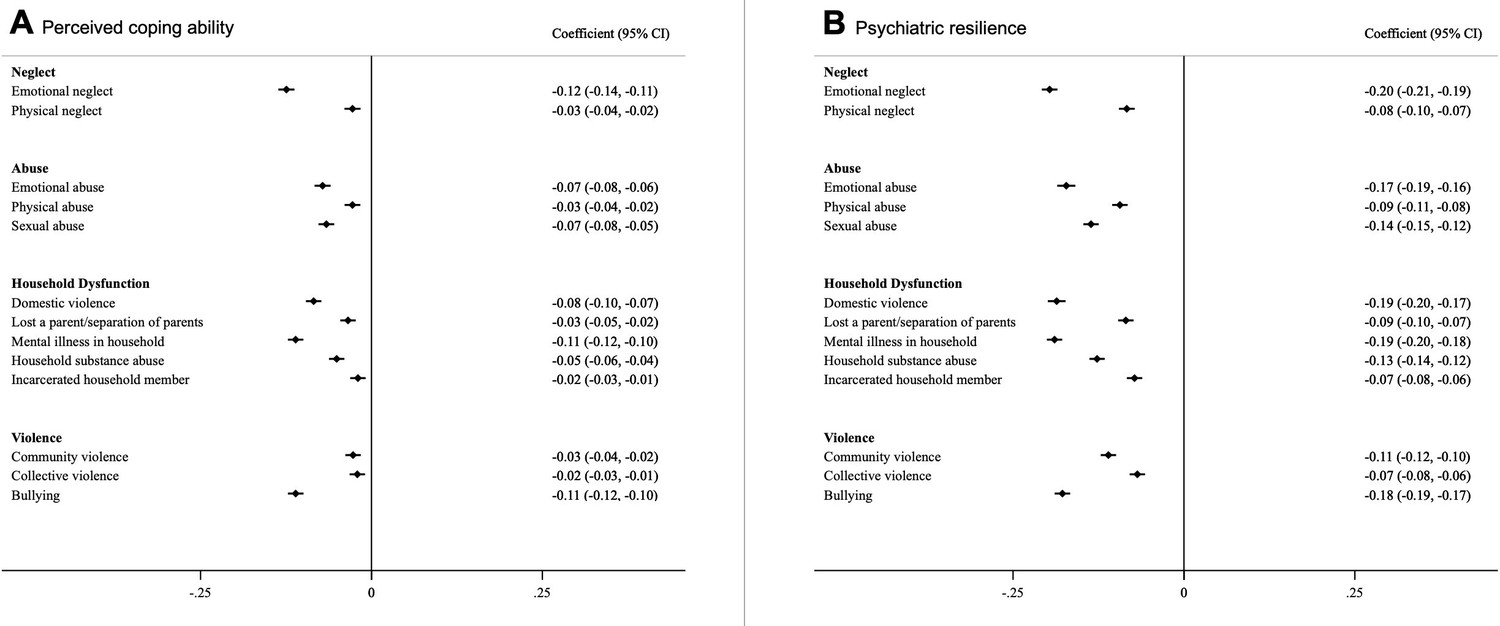
Figure 1
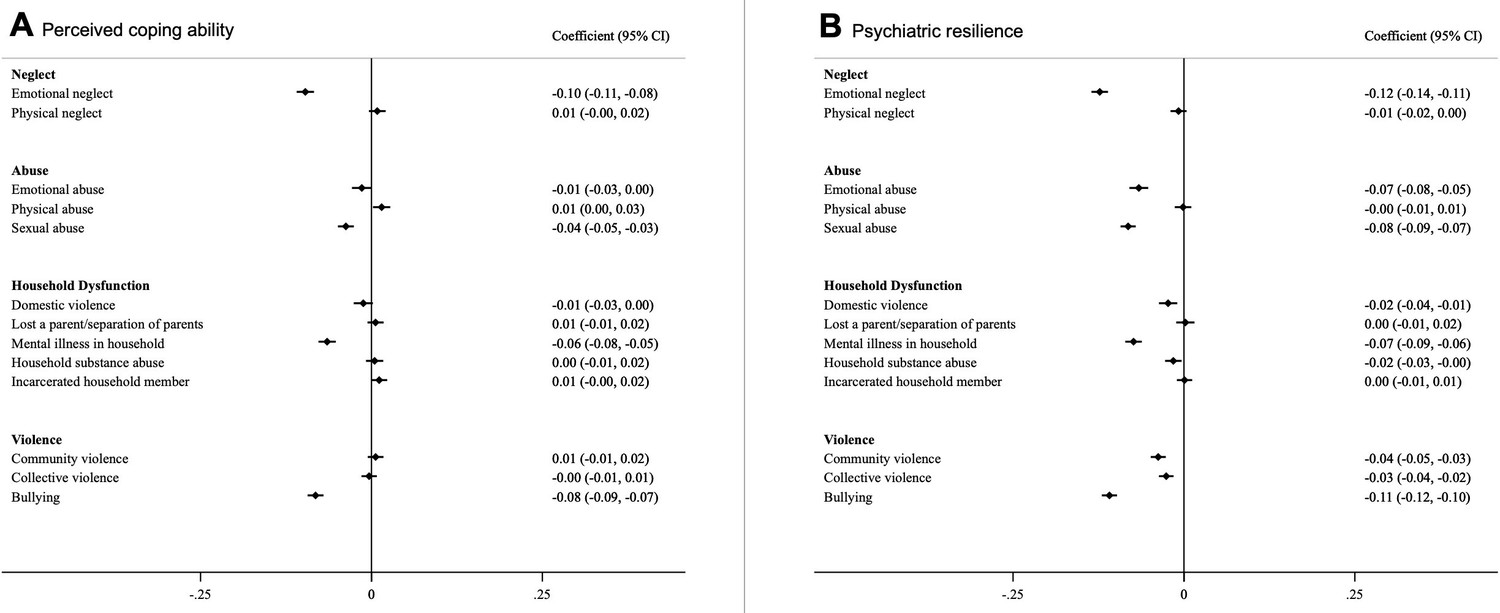
Associations between different types of ACEs and perceived coping ability (A) and psychiatric resilience (B) (β and 95% CI).
Models were corrected for age, childhood deprivation, educational level, civil status, employment status, income and mutually adjusted for other ACEs. *Coefficients are standardized.
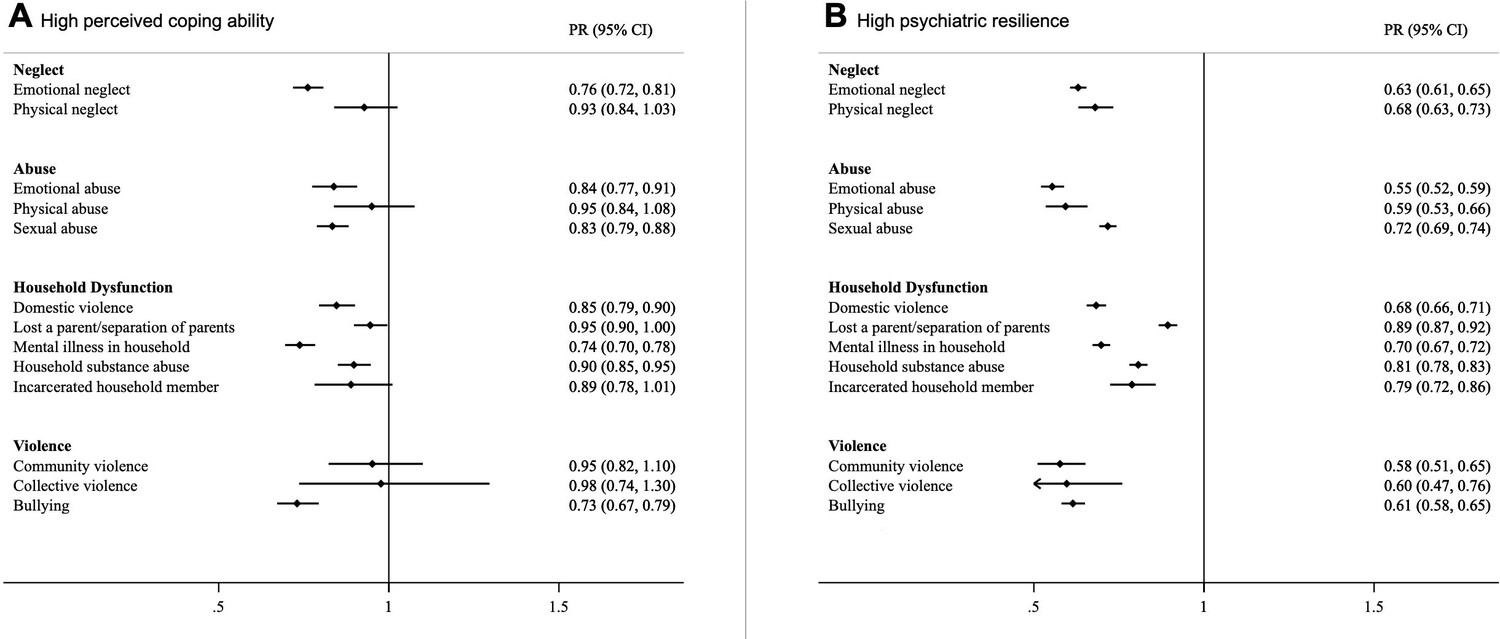
Figure 2

Prevalence Ratios (with 95% CI) of high perceived coping ability (A) and high psychiatric resilience (B) in relation to individual ACEs.
Models were corrected for age, childhood deprivation, educational level, civil status, employment status, income and mutually adjusted for other ACEs.
Appendix 1—figure 1
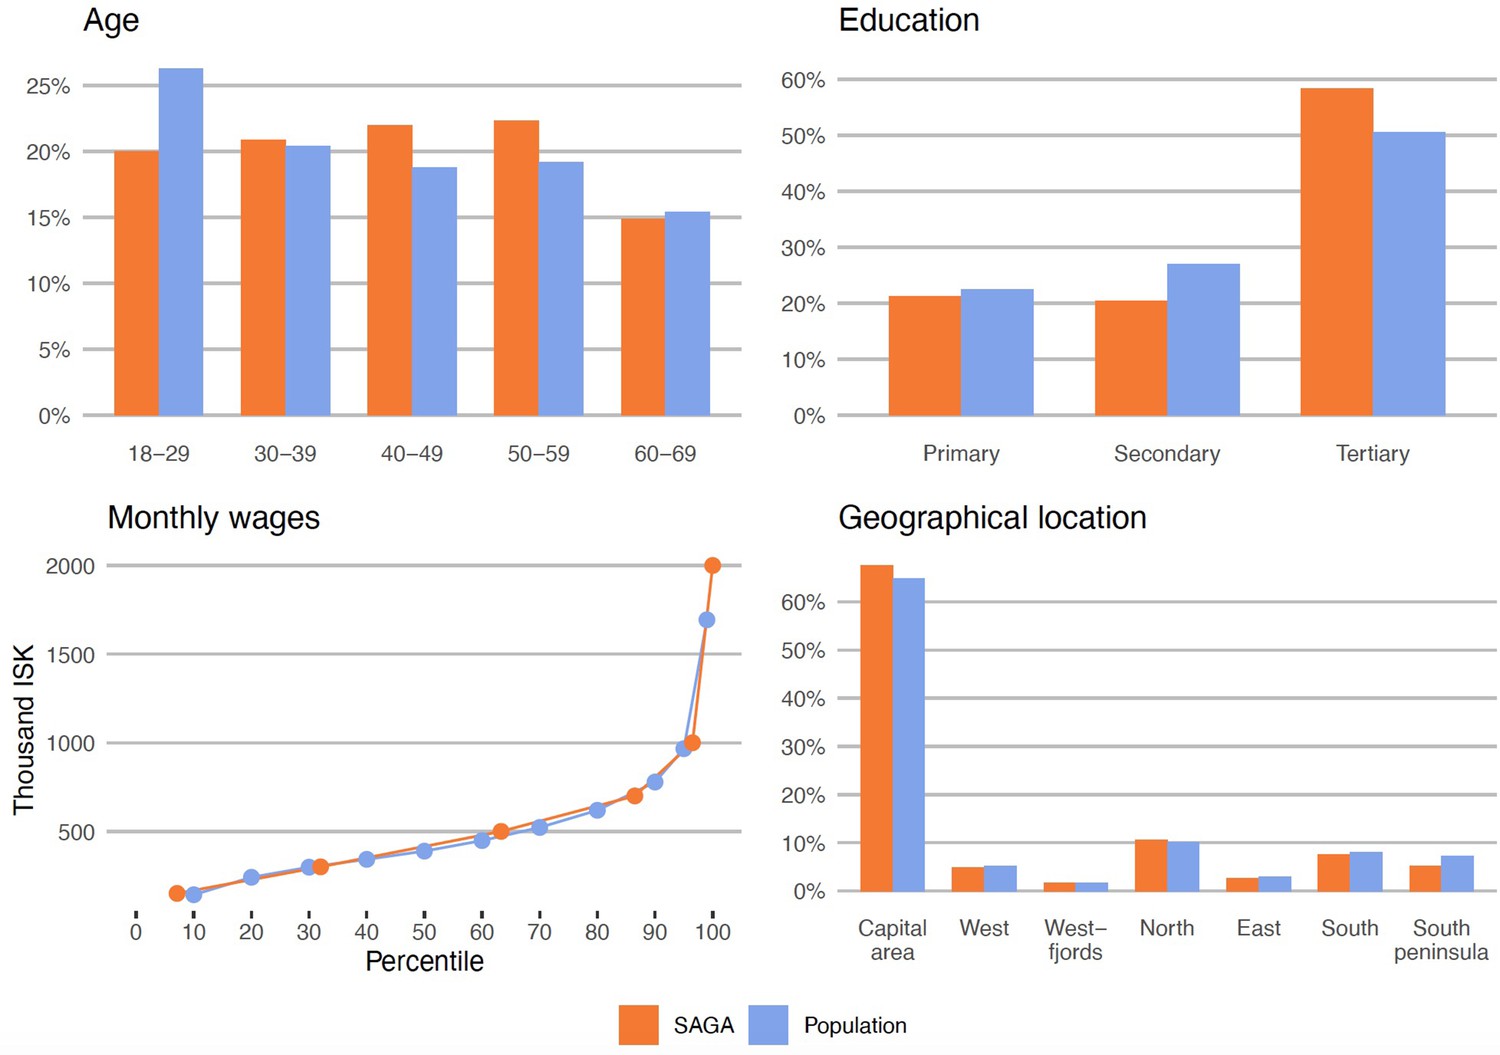
Sociodemographic characteristics of SAGA participants vs. the general female population of Iceland (see further: https://www.afallasaga.is/nidurstodur).
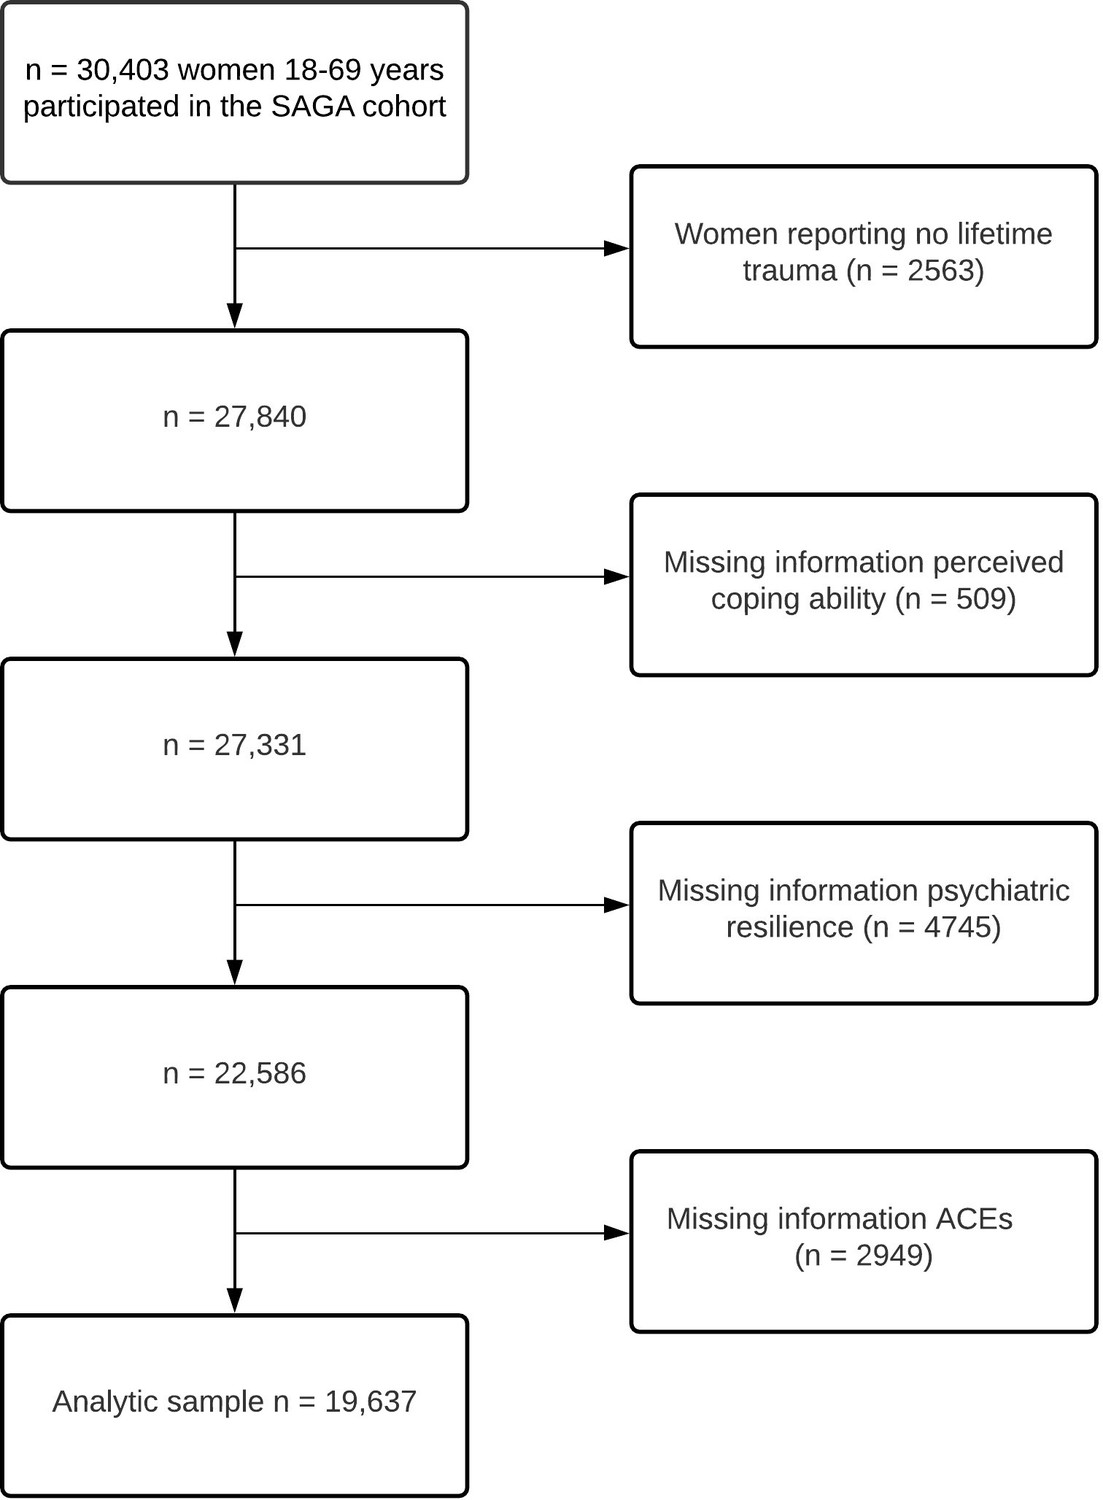
Appendix 1—figure 2
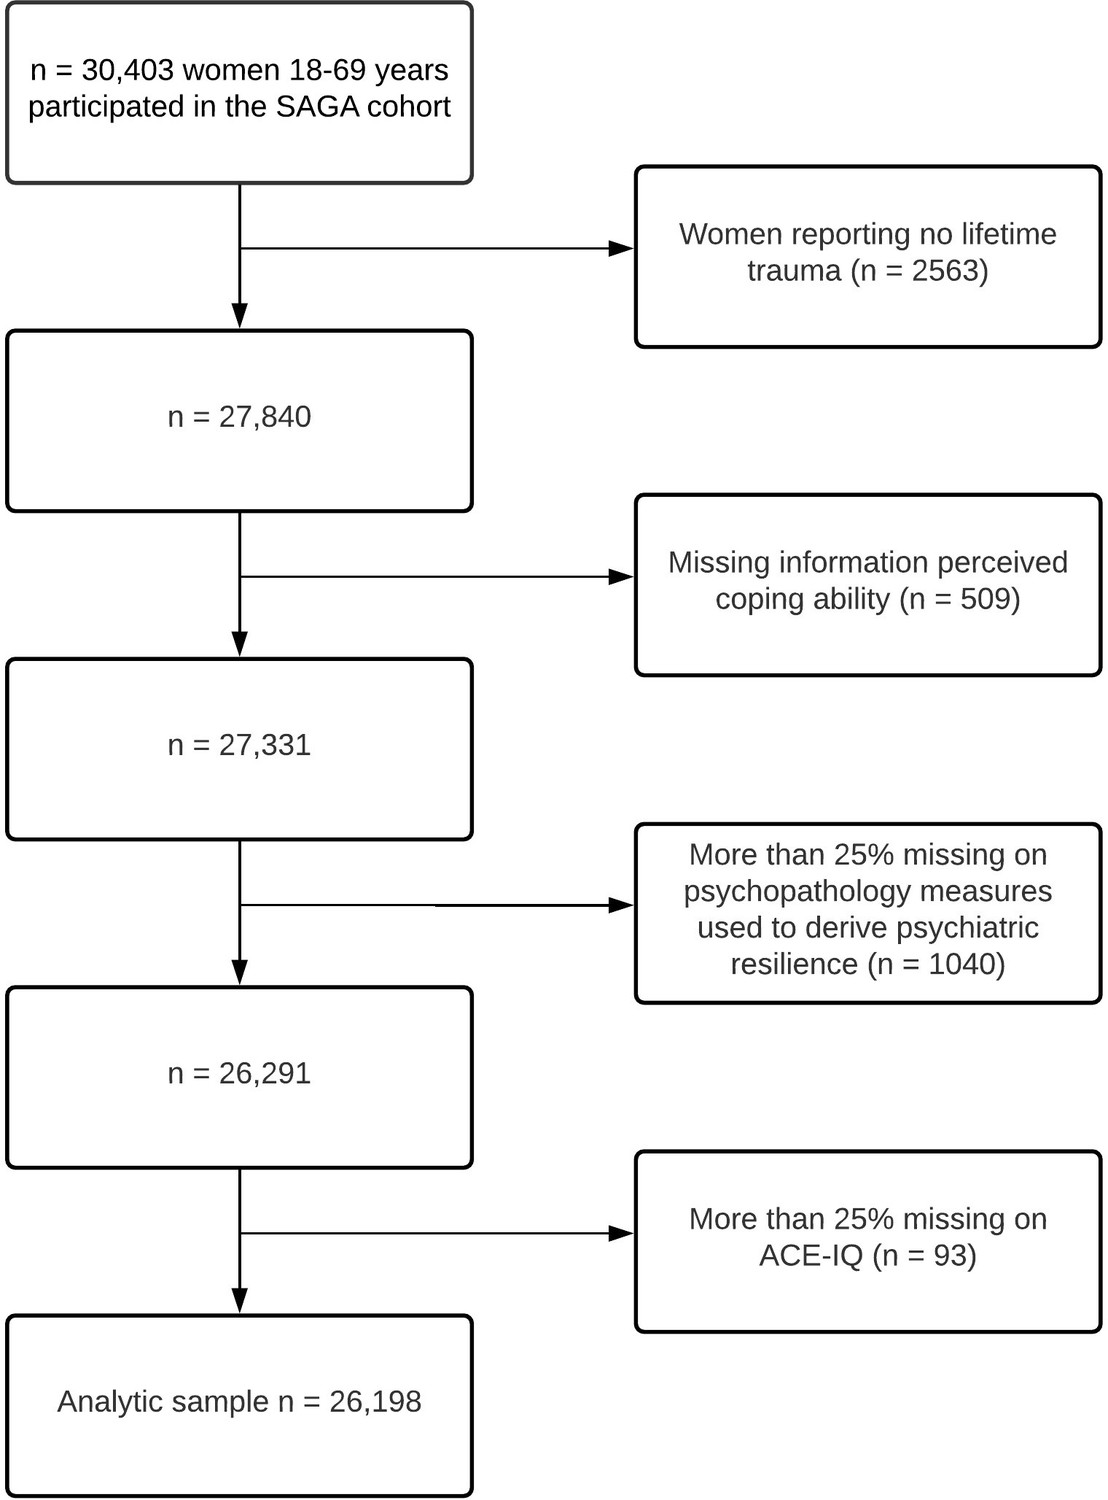
Flow-chart of the analytic sample.
Appendix 1—figure 3
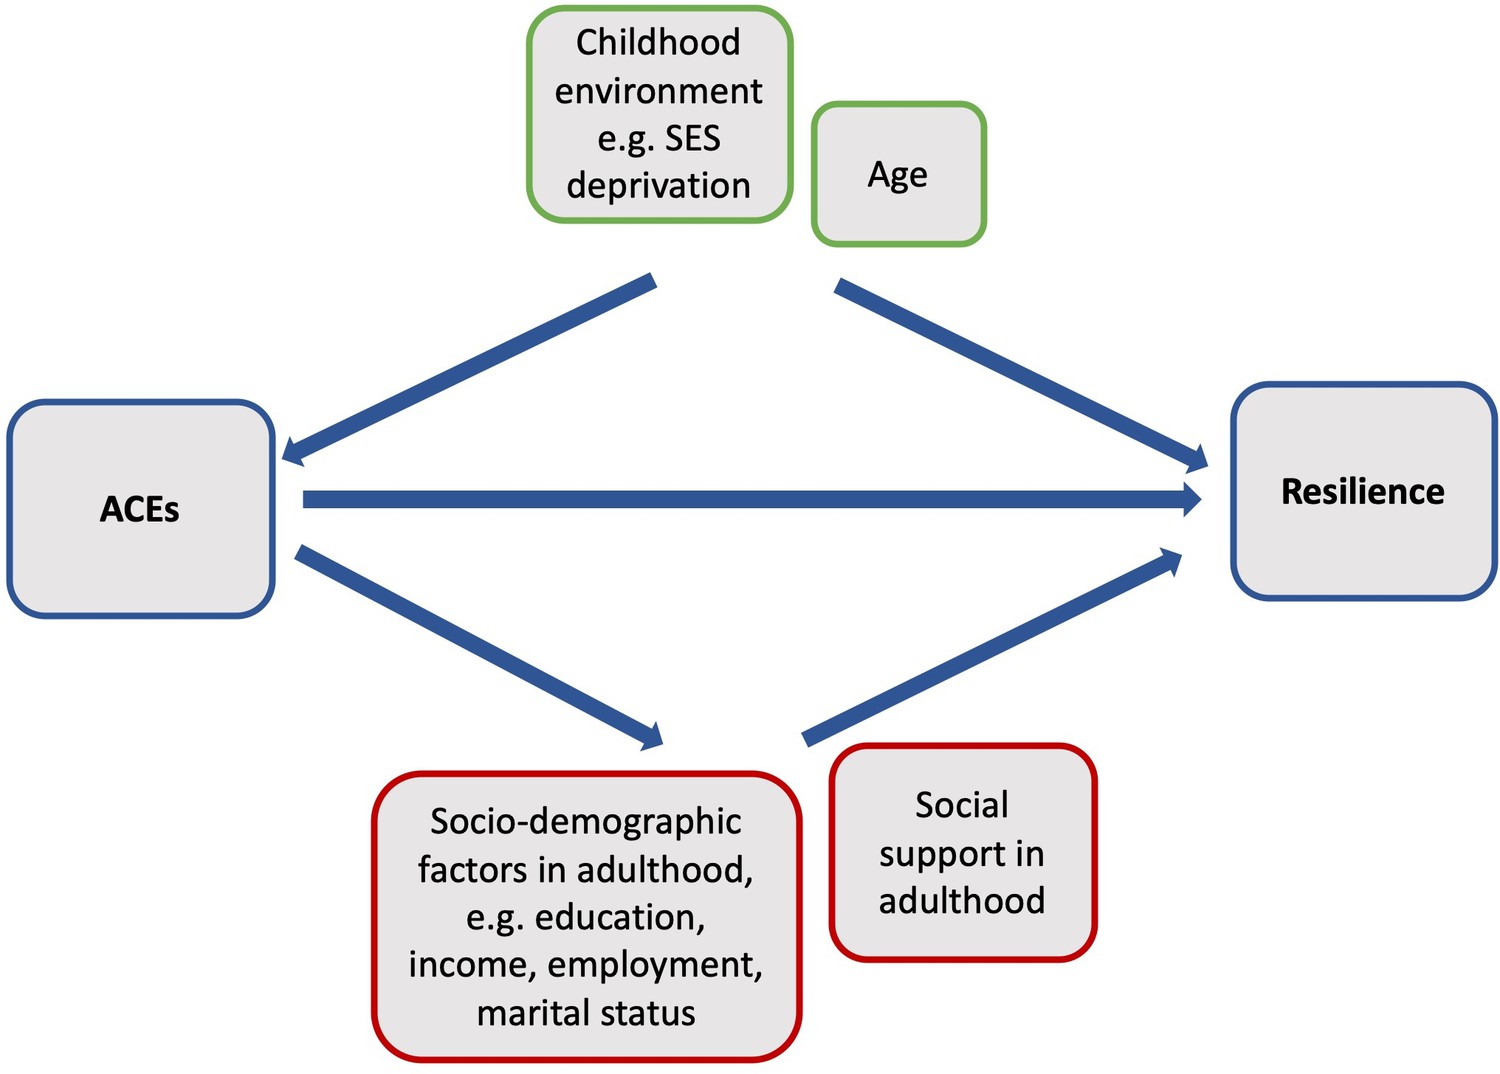
Proposed causal model with alternative pathways of how ACEs could influence resilience in adulthood.
Note: Boxes in green indicate potential confounders of the association between ACEs and adult resilience, whereas boxes in red indicate potential mediators of the association.
Appendix 1—figure 4
Flow-chart of the analytic sample (complete case analysis).
Appendix 1—figure 5
Associations between different types of ACEs and perceived coping ability (A) and psychiatric resilience (B) (β and 95% CI).
Models were corrected for age, childhood deprivation, education level, civil status, employment status and income. *Coefficients are standardized.
Appendix 1—figure 6
Prevalence Ratios (with 95% CI) of high perceived coping ability (A) and high psychiatric resilience (B) in relation to individual ACEs.
Models were corrected for age, childhood deprivation, education level, civil status, employment status and income.
Appendix 1—figure 7

Associations between different types of ACEs and perceived coping ability (A) and psychiatric resilience (B) (β and 95% CI), complete case analyses (n = 19,637).
Models were corrected for age, childhood deprivation, educational level, civil status, employment status, income and mutually adjusted for other ACEs. *Coefficients are standardized.
Appendix 1—figure 8
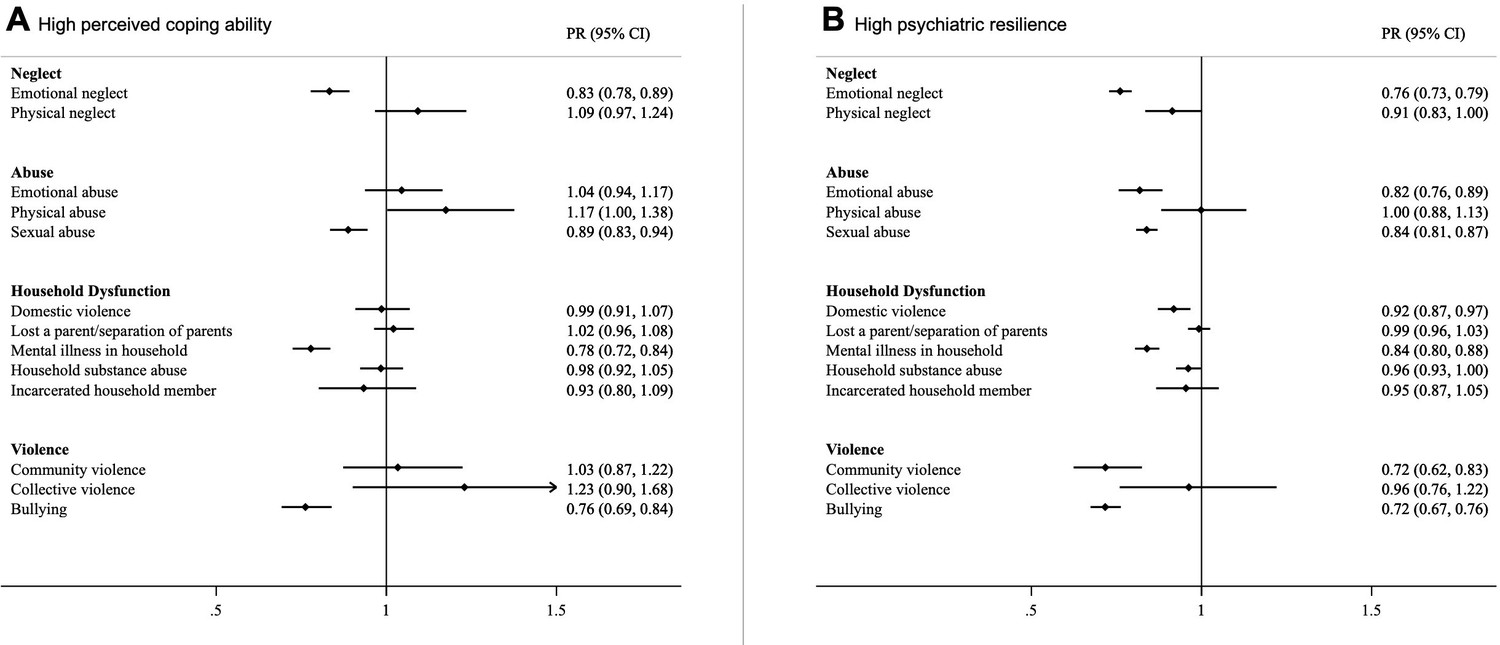
Prevalence Ratios (with 95% CI) of high perceived coping ability (A) and high psychiatric resilience (B) in relation to individual ACEs, complete case analyses (n = 19,637).
Models were corrected for age, childhood deprivation, educational level, civil status, employment status, income and mutually adjusted for other ACEs.
Tables
Table 1
Descriptive characteristics of the study population by number of adverse childhood experiences (ACE-IQ) (n = 26,198).
| Number of ACEs | ACE-IQ sum score | ||||||||
|---|---|---|---|---|---|---|---|---|---|
| Total N (%) | 0 ACE N (%) | 1 ACE N (%) | 2 ACEs N (%) | 3–4 ACEsN (%) | ≥ 5 ACEsN (%) | p-value global* | Mean (SD) | p-value global† | |
| Total | 26,198 | 5,149 (19.7) | 5,567 (21.3) | 4,491 (17.1) | 5,640 (21.5) | 5,351 (20.4) | 2.6 (2.4) | ||
| Age, mean (SD) | 44.0 (13.6) | 43.7 (13.9) | 44.7 (13.9) | 44.6 (13.6) | 44.1 (13.4) | 43.1 (12.8) | < 0.001 | ||
| Age groups | |||||||||
| 18–29 years | 4,881 (18.6) | 1,043 (20.3) | 993 (17.8) | 805 (17.9) | 1,045 (18.5) | 995 (18.6) | < 0.001 | 2.6 (2.5) | < 0.001 |
| 30–39 years | 5,309 (20.3) | 1,074 (20.9) | 1,128 (20.3) | 864 (19.2) | 1,107 (19.6) | 1,136 (21.2) | 2.7 (2.4) | ||
| 40–49 years | 5,923 (22.6) | 1,092 (21.2) | 1,167 (21.0) | 1,003 (22.3) | 1,301 (23.1) | 1,360 (25.4) | 2.8 (2.5) | ||
| 50–59 years | 6,055 (23.1) | 1,091 (21.2) | 1,281 (23.0) | 1,088 (24.2) | 1,356 (24.0) | 1,239 (23.2) | 2.7 (2.4) | ||
| ≥ 60 years | 4,030 (15.4) | 849 (16.5) | 998 (17.9) | 731 (16.3) | 831 (14.7) | 621 (11.6) | 2.3 (2.2) | ||
| Educational level | |||||||||
| Primary education | 3,739 (14.3) | 442 (8.6) | 662 (11.9) | 602 (13.4) | 889 (15.8) | 1,144 (21.4) | < 0.001 | 3.4 (2.61) | < 0.001 |
| Secondary education | 8,013 (30.6) | 1,402 (27.2) | 1,658 (29.8) | 1,360 (30.3) | 1,744 (30.9) | 1,849 (34.6) | 2.8 (2.32) | ||
| Tertiary A (BSc or equivalent) | 8,359 (31.9) | 1,856 (36.0) | 1,872 (33.6) | 1,488 (33.1) | 1,782 (31.6) | 1,361 (25.4) | 2.3 (2.09) | ||
| Tertiary B (MSc or above) | 5,990 (22.9) | 1,437 (27.9) | 1,360 (24.4) | 1,022 (22.8) | 1,210 (21.5) | 961 (18.0) | 2.3 (2.08) | ||
| Unknown | 97 (0.4) | 12 (0.2) | 15 (0.3) | 19 (0.4) | 15 (0.3) | 36 (0.7) | 3.7 (2.59) | ||
| Civil status | |||||||||
| Married/in a relationship | 19,750 (75.4) | 4,061 (78.9) | 4,309 (77.4) | 3,442 (76.6) | 4,173 (74.0) | 3,765 (70.4) | < 0.001 | 2.5 (2.3) | < 0.001 |
| Single/widowed | 6,314 (24.1) | 1,070 (20.8) | 1,241 (22.3) | 1,030 (22.9) | 1,432 (25.4) | 1,541 (28.8) | 2.9 (2.5) | ||
| Unknown | 134 (0.5) | 18 (0.3) | 17 (0.3) | 19 (0.4) | 35 (0.6) | 45 (0.8) | 3.6 (2.8) | ||
| Employment status | |||||||||
| Employed/studying | 22,088 (84.3) | 4,639 (90.1) | 4,826 (86.7) | 3,888 (86.6) | 4,734 (83.9) | 4,001 (74.8) | < 0.001 | 2.5 (2.3) | < 0.001 |
| Retired/disability/sick leave | 3,941 (15.0) | 494 (9.6) | 718 (12.9) | 573 (12.8) | 854 (15.1) | 1,302 (24.3) | 3.5 (2.8) | ||
| Unknown | 169 (0.6) | 16 (0.3) | 23 (0.4) | 30 (0.7) | 52 (0.9) | 48 (0.9) | 3.5 (2.6) | ||
| Income | |||||||||
| Low income | 7,723 (29.5) | 1,206 (23.4) | 1,532 (27.5) | 1,216 (27.1) | 1,750 (31.0) | 2019 (37.7) | < 0.001 | 3.0 (2.6) | < 0.001 |
| Low-medium income | 7,862 (30.0) | 1,478 (28.7) | 1,663 (29.9) | 1,406 (31.3) | 1,717 (30.4) | 1,598 (29.9) | 2.6 (2.4) | ||
| Medium income | 6,050 (23.1) | 1,352 (26.3) | 1,363 (24.5) | 1,081 (24.1) | 1,236 (21.9) | 1,018 (19.0) | 2.3 (2.2) | ||
| High-medium income | 2,636 (10.1) | 654 (12.7) | 567 (10.2) | 466 (10.4) | 534 (9.5) | 415 (7.8) | 2.2 (2.2) | ||
| High income | 929 (3.5) | 250 (4.9) | 226 (4.1) | 141 (3.1) | 196 (3.5) | 116 (2.2) | 2.0 (2.0) | ||
| Unknown | 998 (3.8) | 209 (4.1) | 216 (3.9) | 181 (4.0) | 207 (3.7) | 185 (3.5) | 2.5 (2.4) | ||
| Childhood deprivation | |||||||||
| Never | 19,727 (75.3) | 4,843 (94.1) | 4,919 (88.4) | 3,628 (80.8) | 3,954 (70.1) | 2,383 (44.5) | < 0.001 | 2.0 (2.0) | < 0.001 |
| Rarely | 2,929 (11.2) | 218 (4.2) | 430 (7.7) | 516 (11.5) | 833 (14.8) | 932 (17.4) | 3.5 (2.4) | ||
| Sometimes | 2,320 (8.9) | 71 (1.4) | 193 (3.5) | 278 (6.2) | 627 (11.1) | 1,151 (21.5) | 4.6 (2.5) | ||
| Often | 1,169 (4.5) | 15 (0.3) | 21 (0.4) | 60 (1.3) | 206 (3.7) | 867 (16.2) | 6.3 (2.6) | ||
| Unknown | 53 (0.2) | 2 (0.0) | 4 (0.1) | 9 (0.2) | 20 (0.4) | 18 (0.3) | 3.8 (2.0) | ||
| Perceived social support | |||||||||
| Low | 6,332 (24.2) | 747 (14.5) | 995 (17.9) | 972 (21.6) | 1,582 (28.0) | 2036 (38.0) | < 0.001 | 3.5 (2.7) | < 0.001 |
| Moderate | 12,831 (40.0) | 2,487 (48.3) | 2,833 (50.9) | 2,282 (50.8) | 2,762 (49.0) | 2,467 (46.1) | 2.5 (2.3) | ||
| High | 6,151 (23.5) | 1,790 (34.8) | 1,579 (28.4) | 1,102 (24.5) | 1,075 (19.1) | 605 (11.3) | 1.8 (1.9) | ||
| Unknown | 884 (3.4) | 125 (2.4) | 160 (2.9) | 135 (3.0) | 221 (3.9) | 243 (4.5) | 3.2 (2.5) | ||
-
*
p-values were obtained by χ2 tests, except for mean age which was compared with an ANOVA.
-
†
p-values were obtained by ANOVA.
Table 2
Distribution of perceived coping ability (CD-RISC) and psychiatric resilience scores by sociodemographic characteristics.
| Perceived coping ability | Psychiatric resilience | |||
|---|---|---|---|---|
| Mean (SD) | p-value global* | Mean (SD) | p-value global* | |
| Total | 28.0 (7.5) | 3.6 (1.5) | ||
| Age groups | ||||
| 18–29 years | 24.8 (7.9) | < 0.001 | 3.1 (1.6) | < 0.001 |
| 30–39 years | 26.8 (7.5) | 3.5 (1.6) | ||
| 40–49 years | 27.8 (7.4) | 3.7 (1.5) | ||
| 50–59 years | 28.5 (7.2) | 3.8 (1.4) | ||
| ≥ 60 years | 28.8 (6.9) | 4.0 (1.3) | ||
| Educational level | ||||
| Primary education | 24.2 (8.3) | < 0.001 | 3.1 (1.6) | < 0.001 |
| Secondary education | 26.3 (7.6) | 3.4 (1.5) | ||
| Tertiary A (BSc or equivalent) | 28.0 (7.0) | 3.8 (1.4) | ||
| Tertiary B (MSc or above) | 29.8 (6.5) | 4.0 (1.3) | ||
| Unknown | 23.6 (8.1) | 3.1 (1.7) | ||
| Civil status | ||||
| Married/in a relationship | 27.7 (7.4) | < 0.001 | 3.7 (1.4) | < 0.001 |
| Single/widowed | 26.3 (7.9) | 3.3 (1.6) | ||
| Unknown | 24.7 (8.5) | 2.7 (1.8) | ||
| Employment status | ||||
| Employed/studying | 28.0 (7.2) | < 0.001 | 3.7 (1.4) | < 0.001 |
| Retired/disability/sick leave | 23.9 (8.5) | 3.0 (1.6) | ||
| Unknown | 23.3 (9.0) | 2.8 (1.6) | ||
| Income | ||||
| Low income | 24.5 (8.0) | < 0.001 | 3.1 (1.6) | < 0.001 |
| Low-medium income | 27.0 (7.2) | 3.6 (1.5) | ||
| Medium income | 29.3 (6.5) | 4.0 (1.3) | ||
| High-medium income | 30.9 (6.1) | 4.1 (1.2) | ||
| High income | 31.9 (6.1) | 4.1 (1.2) | ||
| Unknown | 26.6 (7.9) | 3.7 (1.5) | ||
| Childhood deprivation | ||||
| Never | 27.9 (7.3) | < 0.001 | 3.8 (1.4) | < 0.001 |
| Rarely | 26.4 (7.6) | 3.3 (1.6) | ||
| Sometimes | 25.4 (7.9) | 3.1 (1.6) | ||
| Often | 25.0 (8.4) | 2.6 (1.6) | ||
| Unknown | 24.0 (8.9) | 2.6 (1.6) | ||
| Perceived social support | ||||
| Low | 24.5 (8.0) | < 0.001 | 3.1 (1.6) | < 0.001 |
| Moderate | 27.2 (7.1) | 3.7 (1.5) | ||
| High | 30.9 (6.4) | 4.1 (1.2) | ||
| Unknown | 24.7 (8.0) | 3.2 (1.6) | ||
-
*
p-values were obtained by ANOVAs.
Table 3
Associations between the number of ACEs and perceived coping ability (CD-RISC) and psychiatric resilience (β and 95% CI)*.
| Perceived coping ability | Psychiatric resilience | ||||
|---|---|---|---|---|---|
| N (%) | Model 1† | Model 2 ‡ | Model 1† | Model 2 ‡ | |
| ACE-IQ total score ** | 26,198 | –0.19 (-0.20,–0.17) | –0.14 (-0.15,–0.13) | –0.32 (-0.34,–0.31) | –0.28 (-0.29,–0.27) |
| Number of ACEs | |||||
| 0 ACE | 5,149 (19.7) | 0 (ref.) | 0 (ref.) | 0 (ref.) | 0 (ref.) |
| 1 ACE | 5,567 (21.3) | –0.07 (-0.08,–0.05) | –0.05 (-0.07,–0.04) | –0.09 (-0.10,–0.07) | –0.07 (-0.09,–0.06) |
| 2 ACE | 4,491 (17.1) | –0.10 (-0.11,–0.08) | –0.08 (-0.10,–0.07) | –0.13 (-0.15,–0.12) | –0.12 (-0.13,–0.10) |
| 3–4 ACE | 5,640 (21.5) | –0.16 (-0.17,–0.14) | –0.13 (-0.14,–0.11) | –0.22 (-0.23,–0.20) | –0.19 (-0.21,–0.18) |
| ≥ 5 ACEs | 5,351 (20.4) | –0.22 (-0.24,–0.20) | –0.16 (-0.18,–0.15) | –0.36 (-0.37,–0.34) | –0.31 (-0.33,–0.30) |
-
*
Coefficients are standardized; **per 1 SD unit increase in ACE-IQ scores.
-
†
adjusted for age and childhood deprivation.
-
‡
additionally adjusted for education level, civil status, employment status and income.
Table 4
Prevalence Ratios (with 95% CI) of high perceived coping ability (CD-RISC ≥35) and high psychiatric resilience (absence of psychiatric morbidity) in relation to the number of ACEs.
| Perceived coping ability | Psychiatric resilience | ||||
|---|---|---|---|---|---|
| N (%) | Model 1†a | Model 2 ‡ | Model 1† | Model 2 ‡ | |
| ACE-IQ total score* | 26,198 | 0.91 (0.90, 0.92) | 0.93 (0.92, 0.94) | 0.85 (0.84, 0.86) | 0.87 (0.86, 0.87) |
| Number of ACEs | |||||
| 0 ACE | 5,149 (19.7) | 1.00 (ref.) | 1.00 (ref.) | 1.00 (ref.) | 1.00 (ref.) |
| 1 ACE | 5,567 (21.3) | 0.83 (0.77, 0.89) | 0.87 (0.81, 0.93) | 0.82 (0.79, 0.84) | 0.84 (0.81, 0.87) |
| 2 ACE | 4,491 (17.1) | 0.71 (0.66, 0.77) | 0.75 (0.70, 0.81) | 0.73 (0.70, 0.76) | 0.75 (0.72, 0.78) |
| 3–4 ACE | 5,640 (21.5) | 0.61 (0.56, 0.66) | 0.66 (0.61, 0.71) | 0.59 (0.56, 0.61) | 0.62 (0.60, 0.65) |
| ≥ 5 ACEs | 5,351 (20.4) | 0.56 (0.51, 0.61) | 0.64 (0.59, 0.70) | 0.38 (0.35, 0.40) | 0.42 (0.39, 0.45) |
-
*
per 1 SD unit increase in ACE-IQ scores.
-
†
adjusted for age and childhood deprivation.
-
‡
additionally adjusted for education level, civil status, employment status and income.
Appendix 1—table 1
List of the 30 ACE-IQ items used to derive the 13 different ACEs and their response options.
| ACE item | Scoring* |
|---|---|
| Neglect | |
| Emotional neglect | |
| Did your parents/guardians understand your problems and worries? | Always = 0, Most of the time = 1, Sometimes = 2, Rarely = 3, Never = 4 |
| Did your parents/guardians really know what you were doing with your free time when you were not at school or work? | Always = 0, Most of the time = 1, Sometimes = 2, Rarely = 3, Never = 4 |
| Physical neglect | |
| How often did your parents/guardians not give you enough food even when they could easily have done so? | Never = 0, Once = 1, A few times = 2, Many times = 3 |
| Were your parents/guardians too drunk or intoxicated by drugs to take care of you? | Never = 0, Once = 1, A few times = 2, Many times = 3 |
| How often did your parents/guardians not send you to school even when it was available? | Never = 0, Once = 1, A few times = 2, Many times = 3 |
| Abuse | |
| Emotional abuse | |
| Did a parent, guardian or other household member yell, scream or swear at you, insult or humiliate you? | Never = 0, Once = 1, A few times = 2, Many times = 3 |
| Did a parent, guardian or other household member threaten to, or actually, abandon you or throw you out of the house? | Never = 0, Once = 1, A few times = 2, Many times = 3 |
| Physical abuse | |
| Did a parent, guardian or other household member spank, slap, kick, punch or beat you up? | Never = 0, Once = 1, A few times = 2, Many times = 3 |
| Did a parent, guardian or other household member hit or cut you with an object, such as a stick (or cane), bottle, club, knife, whip etc? | Never = 0, Once = 1, A few times = 2, Many times = 3 |
| Sexual abuse | |
| Did someone touch or fondle you in a sexual way when you did not want them to? | Never = 0, Once = 1, A few times = 2, Many times = 3 |
| Did someone make you touch their body in a sexual way when you did not want them to? | Never = 0, Once = 1, A few times = 2, Many times = 3 |
| Did someone attempt oral, anal, or vaginal intercourse with you when you did not want them to? | Never = 0, Once = 1, A few times = 2, Many times = 3 |
| Did someone actually have oral, anal, or vaginal intercourse with you when you did not want them to? | Never = 0, Once = 1, A few times = 2, Many times = 3 |
| Household dysfunction | |
| Domestic violence | |
| Did you see or hear a parent or household member in your home being yelled at, screamed at, sworn at, insulted or humiliated? | Never = 0, Once = 1, A few times = 2, Many times = 3 |
| Did you see or hear a parent or household member in your home being slapped, kicked, punched or beaten up? | Never = 0, Once = 1, A few times = 2, Many times = 3 |
| Did you see or hear a parent or household member in your home being hit or cut with an object, such as a stick (or cane), bottle, club, knife, whip etc.? | Never = 0, Once = 1, A few times = 2, Many times = 3 |
| Lost a parent / separation of parents | |
| Were your parents ever separated or divorced? | No = 0, Yes = 1 |
| Did your mother, father or guardian die? | No = 0, Yes = 1 |
| Mental illness in household | |
| Did you live with a household member who was depressed, mentally ill or suicidal? | No = 0, Yes = 1 |
| Household substance abuse | |
| Did you live with a household member who was a problem drinker or alcoholic, or misused street or prescription drugs? | No = 0, Yes = 1 |
| Incarcerated household member | |
| Did you live with a household member who was ever sent to jail or prison? | No = 0, Yes = 1 |
| Other violence | |
| Community violence | |
| Did you see or hear someone being beaten up in real life? | Never = 0, Once = 1, A few times = 2, Many times = 3 |
| Did you see or hear someone being stabbed or shot in real life? | Never = 0, Once = 1, A few times = 2, Many times = 3 |
| Did you see or hear someone being threatened with a knife or gun in real life? | Never = 0, Once = 1, A few times = 2, Many times = 3 |
| Collective violence | |
| During the first 18 years of your life, were you exposed to war/collective violence (e.g. from gangs or police)?† | No = 0, Yes = 1 |
| Were you forced to go and live in another place due to any of these events? | Never = 0, Once = 1, A few times = 2, Many times = 3 |
| Did you experience the deliberate destruction of your home due to any of these events? | Never = 0, Once = 1, A few times = 2, Many times = 3 |
| Were you beaten up by soldiers, police, militia, or gangs? | Never = 0, Once = 1, A few times = 2, Many times = 3 |
| Was a family member or friend killed or beaten up by soldiers, police, militia, or gangs? | Never = 0, Once = 1, A few times = 2, Many times = 3 |
| Bullying | |
| How often were you bullied? | Never = 0, Once = 1, A few times = 2, Many times = 3 |
-
*
all items also had the option „can‘t/don‘t want to answer“.
-
†
this is a screening question, only participants that responded yes got the following four questions.
Appendix 1—table 2
Rank order correlations for perceived coping (CD-RISC) and different measures of psychopathology used to derive the psychiatric resilience phenotype (n = 26,198).
| CD-RISC | PHQ-9 | GAD-7 | PCL-5 | PSQI-A | Binge drinking | |
|---|---|---|---|---|---|---|
| CD-RISC | 1 | |||||
| PHQ-9 | –0.55 | 1 | ||||
| GAD-7 | –0.51 | 0.76 | 1 | |||
| PCL-5 | –0.48 | 0.70 | 0.66 | 1 | ||
| PSQI-A | –0.41 | 0.62 | 0.62 | 0.63 | 1 | |
| Binge drinking | –0.04 | 0.10 | 0.09 | 0.07 | 0.09 | 1 |
Appendix 1—table 3
Rank order correlations for ACE subtypes (n = 26,198).
| Emotional abuse | Physical abuse | Sexual abuse | Emotional neglect | Physical neglect | Domestic violence | Lost a parent/ separation | Mental illness in household | Household substance abuse | Incarcerated household member | Community violence | Collective violence | Bullying | |
|---|---|---|---|---|---|---|---|---|---|---|---|---|---|
| Emotional abuse | 1 | ||||||||||||
| Physical abuse | 0.46 | 1 | |||||||||||
| Sexual abuse | 0.19 | 0.14 | 1 | ||||||||||
| Emotional neglect | 0.36 | 0.23 | 0.22 | 1 | |||||||||
| Physical neglect | 0.29 | 0.18 | 0.14 | 0.27 | 1 | ||||||||
| Domestic violence | 0.51 | 0.31 | 0.18 | 0.34 | 0.30 | 1 | |||||||
| Lost a parent/separation of parents | 0.16 | 0.09 | 0.12 | 0.19 | 0.19 | 0.21 | 1 | ||||||
| Mental illness in household | 0.33 | 0.18 | 0.14 | 0.26 | 0.23 | 0.37 | 0.19 | 1 | |||||
| Household substance abuse | 0.20 | 0.11 | 0.16 | 0.24 | 0.29 | 0.36 | 0.26 | 0.31 | 1 | ||||
| Incarcerated household member | 0.14 | 0.11 | 0.09 | 0.12 | 0.18 | 0.22 | 0.14 | 0.18 | 0.25 | 1 | |||
| Community violence | 0.20 | 0.20 | 0.10 | 0.13 | 0.14 | 0.18 | 0.08 | 0.12 | 0.11 | 0.11 | 1 | ||
| Collective violence | 0.09 | 0.08 | 0.06 | 0.07 | 0.08 | 0.09 | 0.06 | 0.07 | 0.06 | 0.10 | 0.11 | 1 | |
| Bullying | 0.21 | 0.16 | 0.13 | 0.15 | 0.11 | 0.15 | 0.06 | 0.16 | 0.08 | 0.06 | 0.12 | 0.08 | 1 |
Appendix 1—table 4
Associations between the number of ACEs and perceived coping ability (CD-RISC) and psychiatric resilience stratified by social support (n = 25,314) (β and 95% CI).
| Perceived coping ability | Psychiatric resilience | ||||||
|---|---|---|---|---|---|---|---|
| N (%) | Low support | Moderate support | High support | Low support | Moderate support | High support | |
| Number of ACEs* | |||||||
| 0 ACE | 5,024 (19.8) | 0 (ref.) | 0 (ref.) | 0 (ref.) | 0 (ref.) | 0 (ref.) | 0 (ref.) |
| 1 ACE | 5,407 (21.3) | –0.06 (–0.10,–0.02) | –0.05 (–0.06,–0.03) | –0.02 (–0.05,–0.00) | –0.10 (–0.14,–0.06) | –0.07 (–0.09,–0.05) | –0.05 (–0.07,–0.03) |
| 2 ACE | 4,356 (17.2) | –0.08 (–0.12,–0.05) | –0.06 (–0.08,–0.04) | –0.06 (–0.08,–0.03) | –0.13 (–0.16,–0.09) | –0.11 (–0.13,–0.09) | –0.09 (–0.11,–0.07) |
| 3–4 ACE | 5,419 (21.4) | –0.11 (–0.14,–0.07) | –0.09 (–0.11,–0.07) | –0.08 (–0.11,–0.06) | –0.22 (–0.25,–0.17) | –0.16 (–0.18,–0.14) | –0.13 (–0.16,–0.10) |
| ≥ 5 ACEs | 5,108 (20.2) | –0.14 (–0.17,–0.10) | –0.10 (–0.12,–0.08) | –0.08 (–0.11,–0.05) | –0.32 (–0.36,–0.28) | –0.27 (–0.29,–0.25) | –0.21 (–0.24,–0.1) |
-
*
Coefficients are standardized; adjusted for age, childhood deprivation, education level, civil status, employment status and income.
Appendix 1—table 5
Associations between the number of ACEs (excluding parental divorce/separation) and perceived coping ability (CD-RISC) and psychiatric resilience (β and 95% CI)*.
| N (%) | Perceived coping ability | Psychiatric resilience | |||
|---|---|---|---|---|---|
| Model 1a | Model 2b | Model 1a | Model 2b | ||
| Number of ACEs* | |||||
| 0 ACE | 6,095 (23.3) | 0 (ref.) | 0 (ref.) | 0 (ref.) | 0 (ref.) |
| 1 ACE | 6,201 (23.7) | –0.08 (–0.09,–0.06) | –0.06 (–0.08,–0.05) | –0.10 (–0.11,–0.08) | –0.08 (–0.10,–0.07) |
| 2 ACE | 4,877 (18.6) | –0.12 (–0.13,–0.10) | –0.10 (–0.11,–0.08) | –0.16 (–0.17,–0.14) | –0.14 (–0.16,–0.13) |
| 3–4 ACE | 5,582 (21.3) | –0.18 (–0.19,–0.16) | –0.14 (–0.16,–0.13) | –0.25 (–0.27,–0.24) | –0.23 (–0.24,–0.21) |
| ≥ 5 ACEs | 3,443 (13.1) | –0.20 (–0.21,–0.19) | –0.15 (–0.15,–0.12) | –0.33 (–0.35,–0.32) | –0.29 (–0.30,–0.28) |
-
*
Coefficients are standardized; aadjusted for age and childhood deprivation; badditionally adjusted for education level, civil status, employment status and income.
Appendix 1—table 6
Associations between the number of ACEs and perceived coping ability (CD-RISC) and psychiatric resilience excluding participants with ≈10% lowest and highest happiness values (raw scores 1–5 and 10) (n = 15,449) (β and 95% CI)*.
| Perceived coping ability | Psychiatric resilience | ||||
|---|---|---|---|---|---|
| N (%) | Model 1a | Model 2b | Model 1a | Model 2b | |
| Number of ACEs* | |||||
| 0 ACE | 4,088 (20.38) | 0 (ref.) | 0 (ref.) | 0 (ref.) | 0 (ref.) |
| 1 ACE | 4,384 (21.86) | –0.05 (–0.07,–0.04) | –0.04 (–0.06,–0.02) | –0.09 (–0.10,–0.07) | –0.08 (–0.09,–0.06) |
| 2 ACE | 3,573 (17.82) | –0.08 (–0.09,–0.06) | –0.06 (–0.08,–0.05) | –0.12 (–0.14,–0.11) | –0.11 (–0.13,–0.10) |
| 3–4 ACE | 4,341 (21.65) | –0.12 (–0.14,–0.10) | –0.10 (–0.12,–0.08) | –0.19 (–0.20,–0.17) | –0.17 (–0.19,–0.16) |
| ≥ 5 ACEs | 3,669 (18.29) | –0.15 (–0.17,–0.13) | –0.12 (–0.13,–0.10) | –0.31 (–0.33,–0.29) | –0.28 (–0.30,–0.27) |
-
*
Coefficients are standardized; aadjusted for age and childhood deprivation; badditionally adjusted for education level, civil status, employment status and income.
Appendix 1—table 7
Associations between the number of ACEs and perceived coping ability (CD-RISC) and psychiatric resilience (β and 95% CI)*, complete case analyses.
| Perceived coping ability | Psychiatric resilience | ||||
|---|---|---|---|---|---|
| N (%) | Model 1a | Model 2b | Model 1a | Model 2b | |
| ACE-IQ total score* | 19,637 | –0.18 (-0.19,–0.16) | –0.13 (-0.15,–0.12) | –0.31 (-0.32,–0.30) | –0.28 (-0.29,–0.26) |
| Number of ACEs | |||||
| 0 ACE | 4,377 (22.3) | 0 (ref.) | 0 (ref.) | 0 (ref.) | 0 (ref.) |
| 1 ACE | 4,496 (22.9) | –0.07 (-0.09,–0.05) | –0.06 (-0.07,–0.04) | –0.08 (-0.10,–0.06) | –0.07 (-0.09,–0.05) |
| 2 ACE | 3,437 (17.5) | –0.10 (-0.11,–0.08) | –0.08 (-0.10,–0.06) | –0.13 (-0.14,–0.11) | –0.11 (-0.13,–0.10) |
| 3–4 ACE | 3,985 (20.3) | –0.14 (-0.16,–0.13) | –0.12 (-0.14,–0.10) | –0.20 (-0.21,–0.18) | –0.18 (-0.19,–0.16) |
| ≥ 5 ACEs | 3,342 (17.0) | –0.20 (-0.22,–0.18) | –0.15 (-0.17,–0.14) | –0.33 (-0.35,–0.31) | –0.29 (-0.31,–0.27) |
-
*
Coefficients are standardized; **per 1 SD unit increase in ACE-IQ scores; aadjusted for age and childhood deprivation; badditionally adjusted for education level, civil status, employment status and income.
Appendix 1—table 8
Prevalence Ratios (with 95% CI) of high perceived coping ability (CD-RISC ≥35) and high psychiatric resilience (absence of psychiatric morbidity) in relation to the number of ACEs, complete case analyses.
| High perceived coping ability | High psychiatric resilience | ||||
|---|---|---|---|---|---|
| N (%) | Model 1* | Model 2b | Model 1* | Model 2b | |
| ACE-IQ total score* | 19,637 | 0.92 (0.90, 0.93) | 0.94 (0.92, 0.95) | 0.86 (0.85, 0.87) | 0.87 (0.87, 0.88) |
| Number of ACEs | |||||
| 0 ACE | 4,377 (22.3) | 1.00 (ref.) | 1.00 (ref.) | 1.00 (ref.) | 1.00 (ref.) |
| 1 ACE | 4,496 (22.9) | 0.83 (0.77, 0.89) | 0.87 (0.81, 0.93) | 0.84 (0.81, 0.87) | 0.86 (0.83, 0.89) |
| 2 ACE | 3,437 (17.5) | 0.73 (0.67, 0.79) | 0.77 (0.71, 0.83) | 0.74 (0.71, 0.78) | 0.76 (0.73, 0.80) |
| 3–4 ACE | 3,985 (20.3) | 0.66 (0.60, 0.71) | 0.70 (0.65, 0.76) | 0.62 (0.59, 0.65) | 0.65 (0.62, 0.68) |
| ≥ 5 ACEs | 3,342 (17.0) | 0.59 (0.53, 0.65) | 0.67 (0.60, 0.74) | 0.41 (0.38, 0.44) | 0.44 (0.41, 0.48) |
-
*
adjusted for age and childhood deprivation; badditionally adjusted for education level, civil status, employment status and income.
Author response table 1
Associations between the number of ACEs and perceived coping ability (CD-RISC) and psychiatric resilience (β and 95% CI)* Analytic sample is not restricted to women exposed to lifetime trauma.
| Perceived coping ability | Psychiatric resilience | ||||
|---|---|---|---|---|---|
| N (%) | Model 1a | Model 2b | Model 1a | Model 2b | |
| Number of ACEs | |||||
| 0 ACE | 4650 (23.09) | 0 (ref.) | 0 (ref.) | 0 (ref.) | 0 (ref.) |
| 1 ACE | 4628 (22.98) | -0.07 (-0.09, -0.05) | -0.05 (-0.07, -0.04) | -0.08 (-0.10, -0.07) | -0.07 (-0.09, -0.06) |
| 2 ACE | 3486 (17.31) | -0.10 (-0.11, -0.08) | -0.08 (-0.10, -0.07) | -0.13 (-0.15, -0.12) | -0.12 (-0.13, -0.10) |
| 3-4 ACE | 4021 (19.97) | -0.15 (-0.16, -0.13) | -0.12 (-0.14, -0.11) | -0.20 (-0.22, -0.19) | -0.18 (-0.20, -0.17) |
| ≥ 5 ACEs | 3350 (16.64) | -0.20 (-0.22, -0.18) | -0.15 (-0.17, -0.14) | -0.33 (-0.35, -0.32) | -0.30 (-0.31, -0.28) |
Additional files
-
Transparent reporting form
- https://cdn.elifesciences.org/articles/71770/elife-71770-transrepform1-v1.docx
-
Reporting standard 1
Strobe Checklist.
- https://cdn.elifesciences.org/articles/71770/elife-71770-repstand1-v1.docx
-
Source code 1
R scripts for the main analyses.
- https://cdn.elifesciences.org/articles/71770/elife-71770-supp1-v1.zip
Download links
A two-part list of links to download the article, or parts of the article, in various formats.
Downloads (link to download the article as PDF)
Open citations (links to open the citations from this article in various online reference manager services)
Cite this article (links to download the citations from this article in formats compatible with various reference manager tools)
Adverse childhood experiences and resilience among adult women: A population-based study
eLife 11:e71770.
https://doi.org/10.7554/eLife.71770


