Gated recurrence enables simple and accurate sequence prediction in stochastic, changing, and structured environments
- Cognitive Neuroimaging Unit, INSERM, CEA, Université Paris-Saclay, NeuroSpin center, France
- Sorbonne Université, Collège Doctoral, France
Figures
Figure 1 with 1 supplement
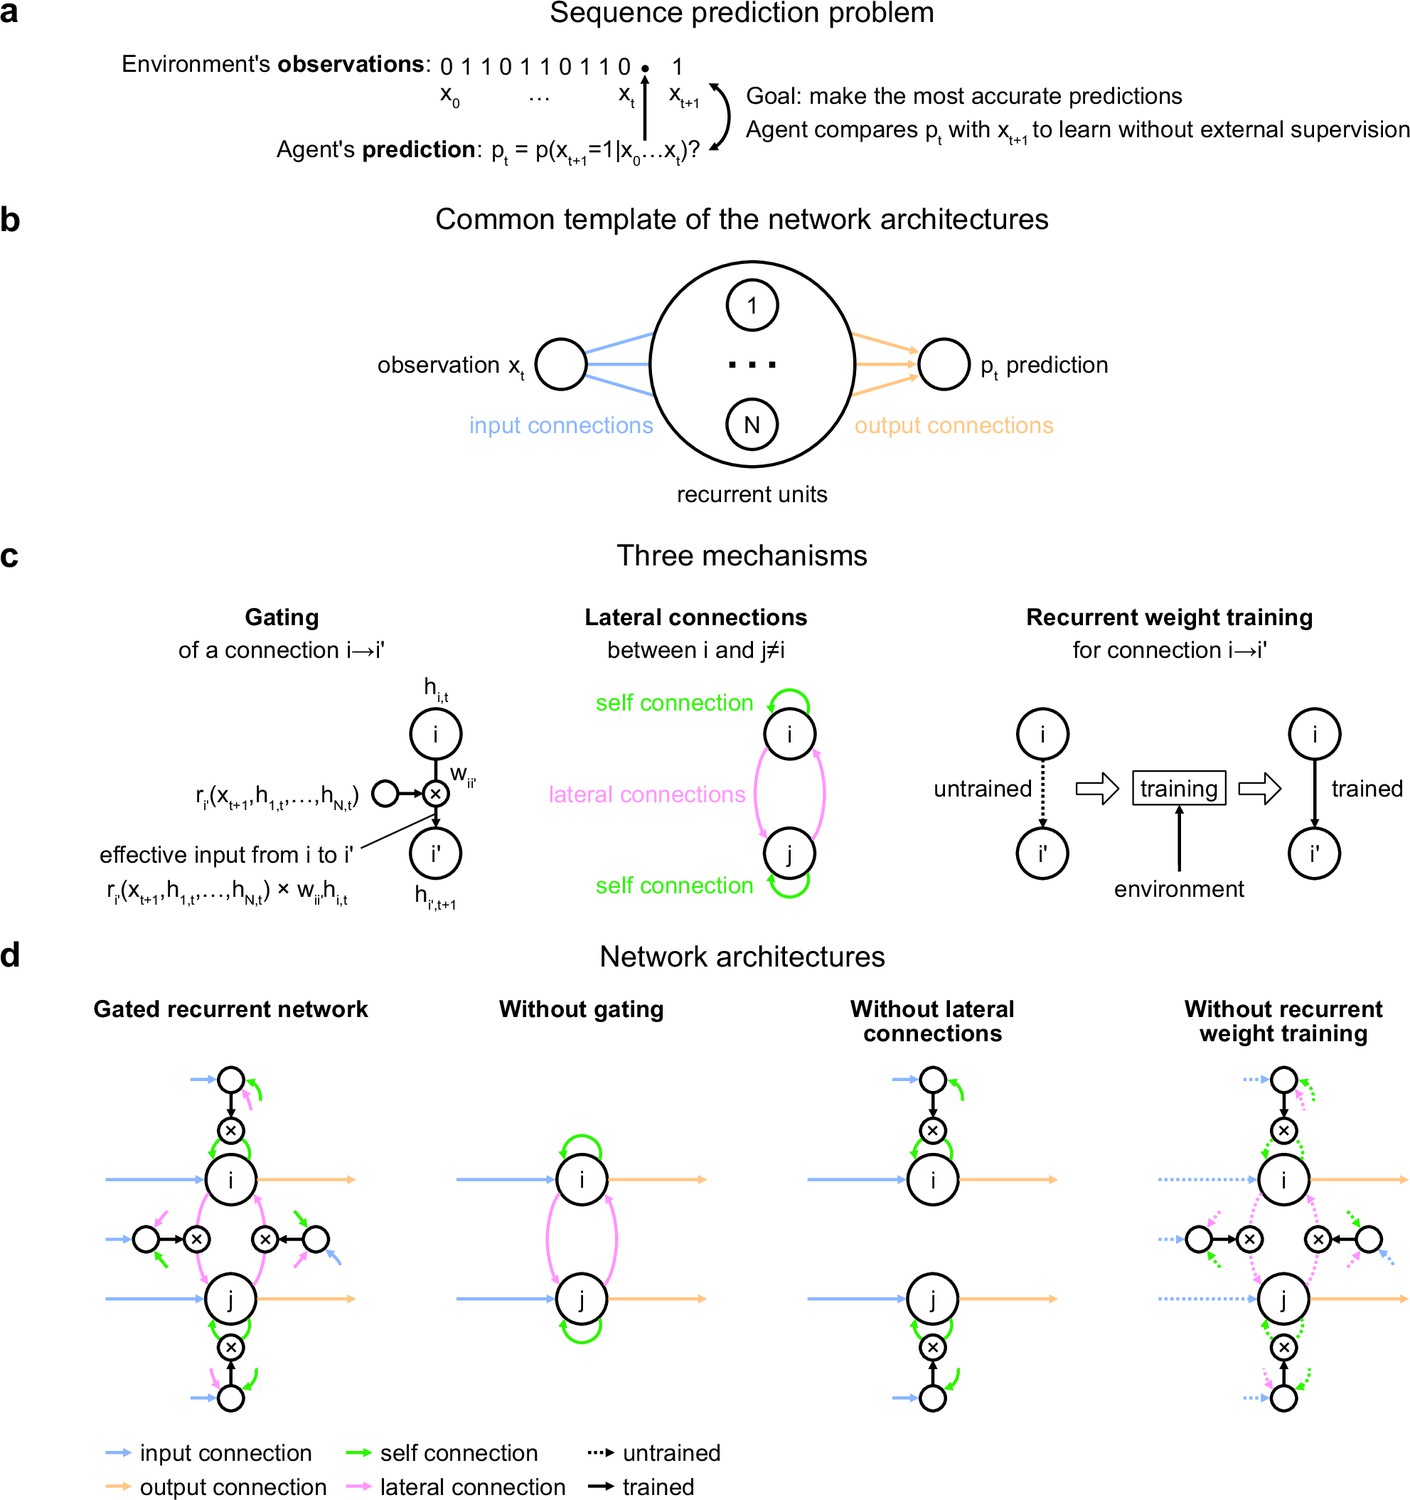
Problem to solve and network architectures.
(a) Sequence prediction problem. At each time step t, the environment generates one binary observation xt. The agent receives it and returns a prediction pt: its estimate of the probability that the next observation will be one given the observations collected so far. The agent’s goal is to make the most accurate predictions possible. The agent can measure its accuracy by comparing its prediction pt with the actual value observed at the next time step xt+1, allowing it to learn from the observations without any external supervision. (b) Common three-layer template of the recurrent neural network architectures. Input connections transmit the observation to the recurrent units and output connections allow the prediction to be read from the recurrent units. (c) Three key mechanisms of recurrent neural network architectures. Gating allows for multiplicative interaction between activities. Lateral connections allow the activities of different recurrent units i and j to interact. Recurrent weight training allows the connection weights of recurrent units to be adjusted to the training environment. i’ may be equal to i. (d) The gated recurrent architecture includes all three mechanisms: gating, lateral connections, and recurrent weight training. Each alternative architecture includes all but one of the three mechanisms.
Figure 1—figure supplement 1
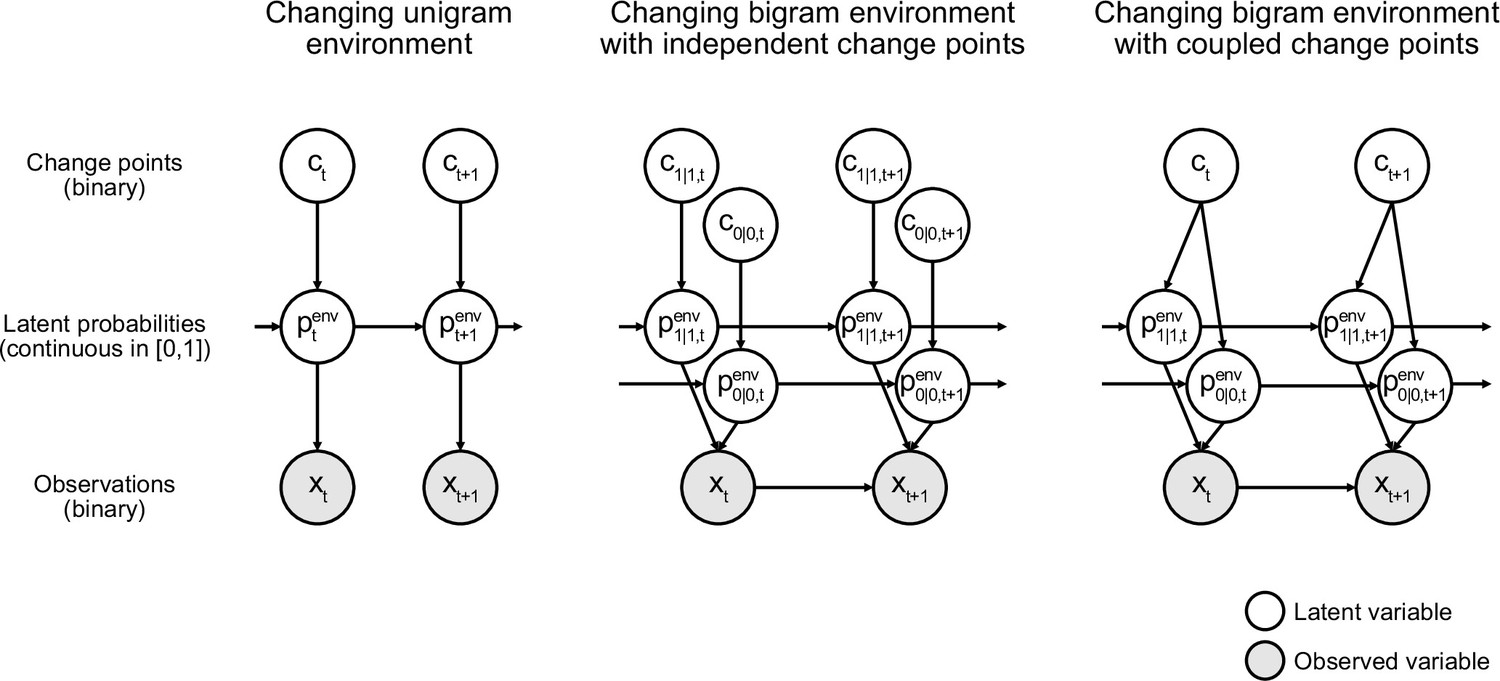
Graphical model of the generative process of each environment.
Nodes encode the variables and edges the conditional dependencies between variables. Each graph represents a factorization of the joint probability distribution of all variables in the generative process: this joint distribution is the product of the conditional probability distributions of each variable given its parents in the graph. For further details on the generative processes, see Materials and methods. In all environments, inferring the next observation from previous observations using such a graph is computationally difficult because it requires computing and marginalizing over the continuous probability distribution of the latent probabilities. This distribution is not easy to compute because it incorporates the likelihoods of the observations (for any latent probability value) and the change point probabilities from all previous time steps, and requires normalization. Notice also the increasingly complex conditional structures of the graphs from left to right. In the unigram environment, observations are conditionally independent given the latent probabilities, but in the bigram environments, they interact. In the bigram environment with coupled change points, the hierarchical structure implies that the two latent bigram probabilities are no longer conditionally independent of each other given their values at the previous time step, since they are connected by a common parent (the change point).
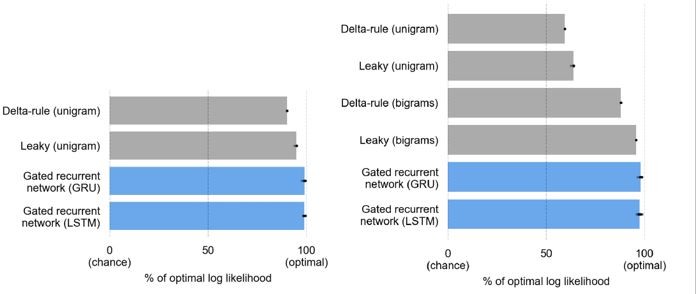
Figure 2
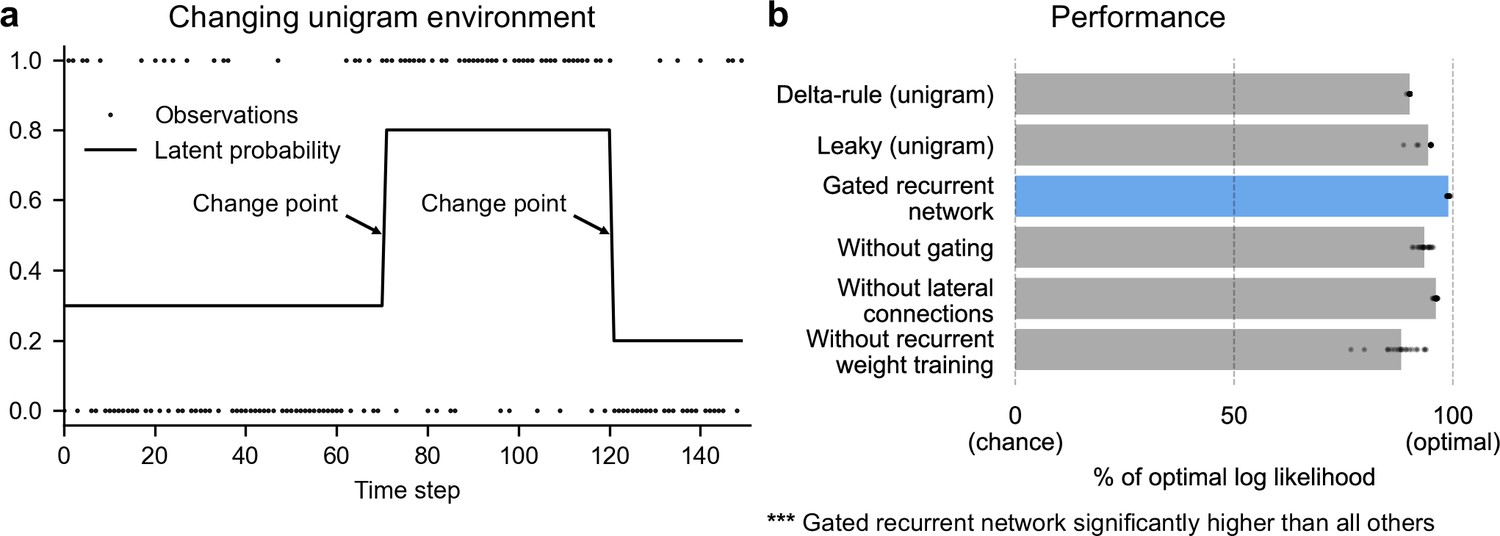
Gated recurrent networks perform quasi-optimally in the face of changes in latent probabilities.
(a) Sample sequence of observations (dots) and latent unigram probability (line) generated in the changing unigram environment. At each time step, a binary observation is randomly generated based on the latent unigram probability, and a change point can occur with a fixed probability, suddenly changing the unigram probability to a new value uniformly drawn in [0,1]. (b) Prediction performance in the changing unigram environment. For each type of agent, 20 trained agents (trained with different random seeds) were tested (dots: agents; bars: average). Their prediction performance was measured as the % of optimal log likelihood (0% being chance performance and 100 % optimal performance, see Equation 1 for the log likelihood) and averaged over observations and sequences. The gated recurrent network significantly outperformed every other type of agent (p < 0.001, two-tailed two independent samples t-test with Welch’s correction for unequal variances).
Figure 3 with 1 supplement
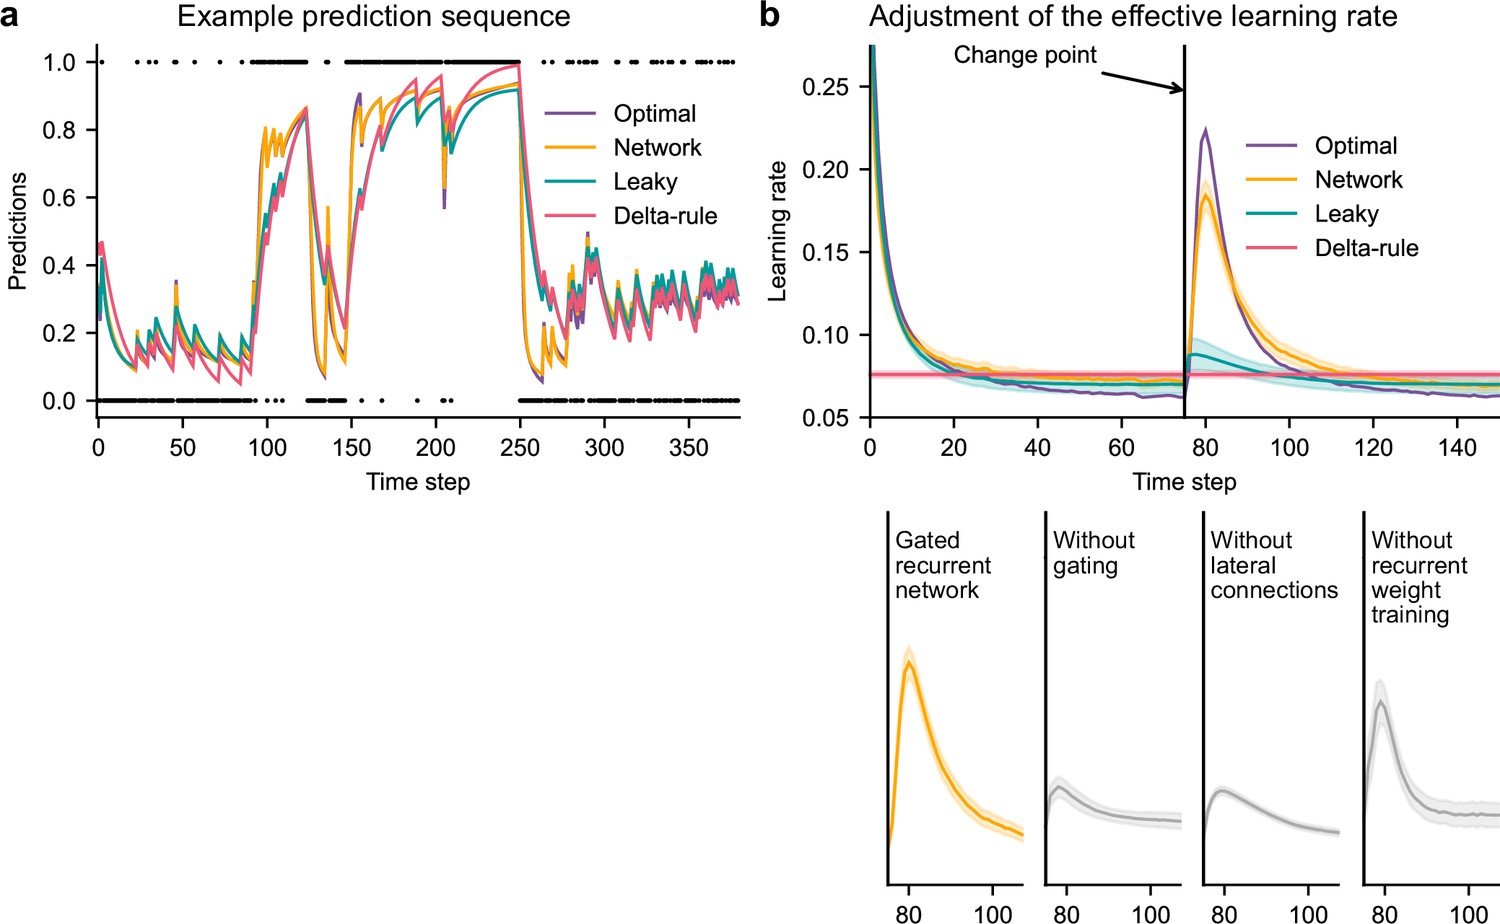
Gated recurrent but not alternative networks adjust their moment-by-moment effective learning rate around changes like the optimal agent.
(a) Example prediction sequence illustrating the prediction updates of different types of agents. Within each type of agent, the agent (out of 20) yielding median performance in Figure 2b was selected for illustration purposes. Dots are observations, lines are predictions. (b) Moment-by-moment effective learning rate of each type of agent. 20 trained agents of each type were tested on 10,000 sequences whose change points were locked at the same time steps, for illustration purposes. The moment-by-moment effective learning rate was measured as the ratio of prediction update to prediction error (see Materials and methods, Equation 2), and averaged over sequences. Lines and bands show the mean and the 95 % confidence interval of the mean.
Figure 3—figure supplement 1
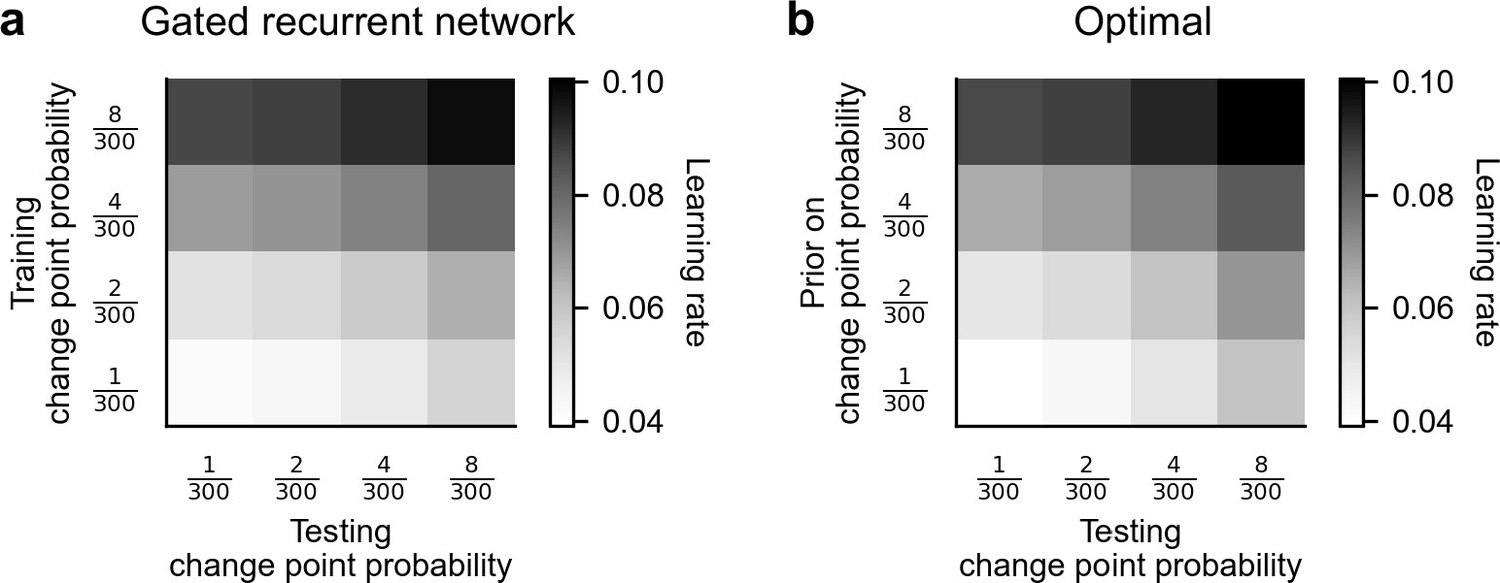
Attunement of the effective learning rate to the change point probabilities.
(a) Average effective learning rate of the gated recurrent networks as a function of the change point probability used during testing (columns) and during training (rows). Each row corresponds to a different set of 20 networks trained in the changing unigram environment with the indicated change point probability. Each column corresponds to a different test set with the indicated change point probability, each of 1000 out-of-sample sequences. The networks’ effective learning rate was measured and averaged over time, sequences, and networks. (b) Average effective learning rate of the optimal agent as a function of the change point probability used during testing (columns) and the prior on the change point probability assumed by the model (rows). The optimal agent was tested on the same sets of sequences as the gated recurrent networks and its effective learning rate was averaged over time and sequences.
Figure 4
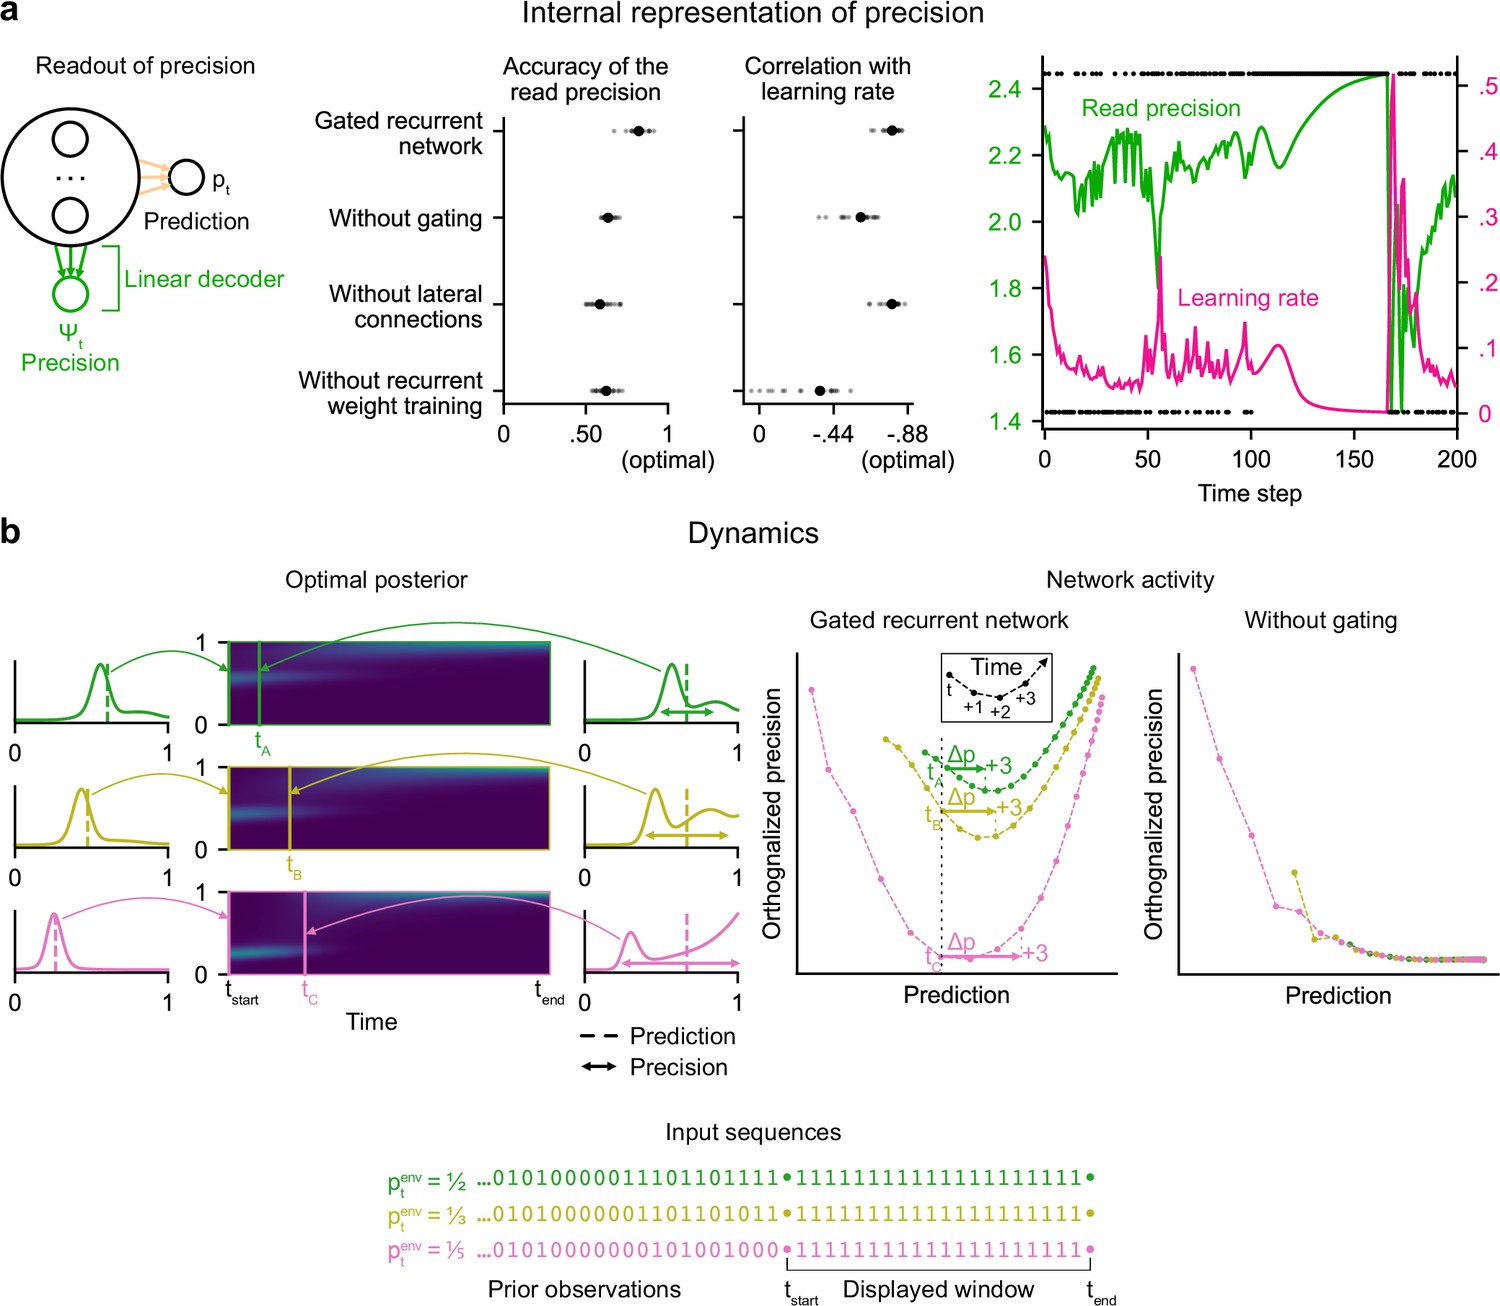
Gated recurrent networks have an internal representation of the precision of their estimate that dynamically interacts with the prediction following the precision-weighting principle.
(a) Left to right: Schematic of the readout of precision from the recurrent activity of a network (obtained by fitting a multiple linear regression from the recurrent activity to the log precision of the optimal posterior distribution); Accuracy of the read precision (calculated as its Pearson correlation with the optimal precision); Pearson correlation between the read precision and the network’s subsequent effective learning rate (the optimal value was calculated from the optimal agent’s own precision and learning rate); Example sequence illustrating their anti-correlation in the gated recurrent network. In both dot plots, large and small dots show the median and individual values, respectively. (b) Dynamics of the optimal posterior (left) and the network activity (right) in three sequences (green, yellow, and pink). The displayed dynamics are responses to a streak of 1 s after different sequences of observations (with different generative probabilities as shown at the bottom). The optimal posterior distribution is plotted as a color map over time (dark blue and light green correspond to low and high probability densities, respectively) and as a line plot at two times: on the left, the time tstart just before the streak of 1s, and on the right, a time tA/tB/tC when the prediction (i.e. mean) is approximately equal in all three cases; note that the precision differs. The network activity was projected onto the two-dimensional subspace spanned by the prediction and precision vectors (for the visualization, the precision axis was orthogonalized with respect to the prediction axis). In the gated recurrent network, the arrow Δp shows the update to the prediction performed in the next three time steps starting at the time tA/tB/tC defined from the optimal posterior. Like the optimal posterior and unlike the network without gating, the gated recurrent network represents different levels of precision at an equal prediction, and the lower the precision, the higher the subsequent update to the prediction—a principle called precision-weighting. In all example plots (a–b), the displayed network is the one of the 20 that yielded the median read precision accuracy.
Figure 5
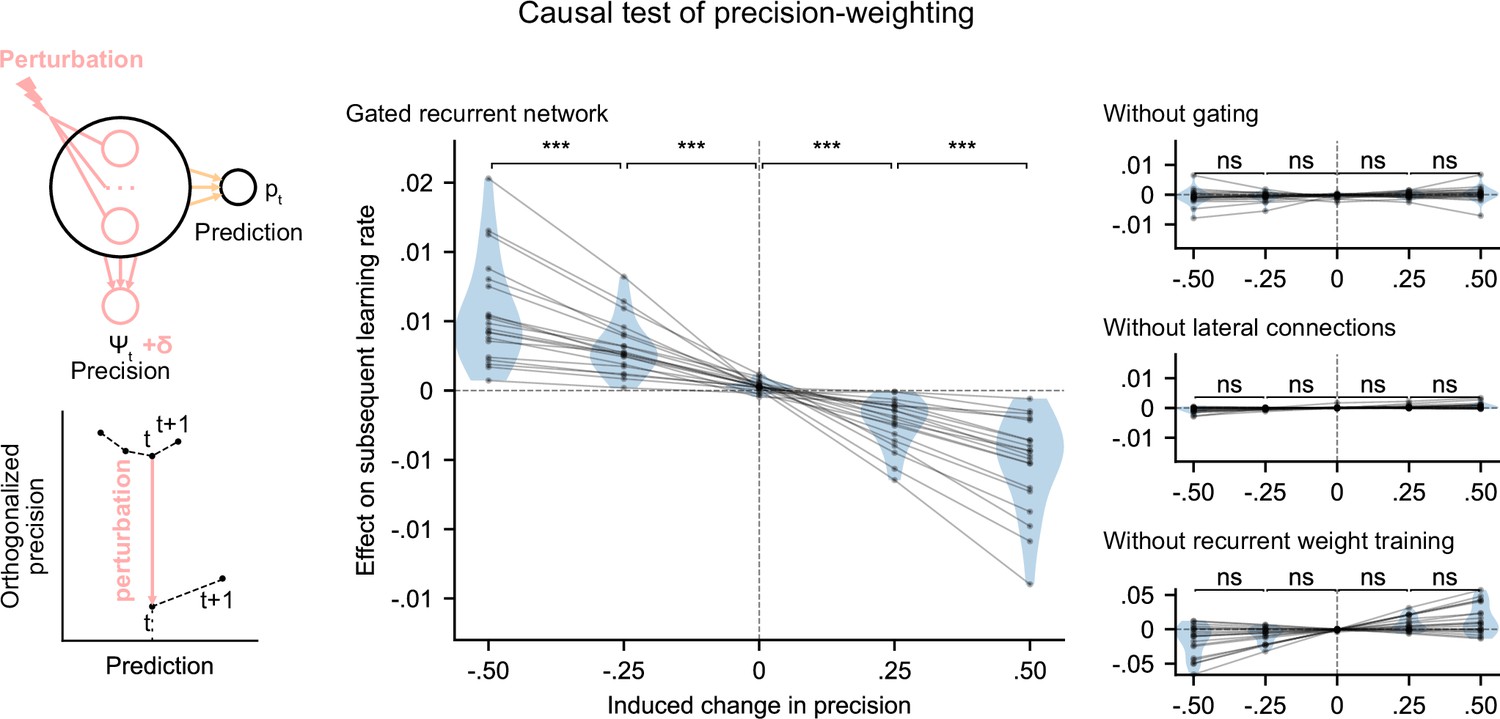
Precision-weighting causally determines the adjustment of the effective learning rate in gated recurrent networks only.
Causal test of a network’s precision on its effective learning rate. The recurrent activity was perturbed to induce a controlled change δ in the read precision, while keeping the prediction at the current time step—and thus the prediction error at the next time step—constant. This was done by making the perturbation vector orthogonal to the prediction vector and making its projection onto the precision vector equal to δ (bottom left diagram). We measured the perturbation’s effect on the subsequent effective learning rate as the difference in learning rate ‘with perturbation’ minus ‘without perturbation’ at the next time step (four plots on the right). Each dot (and joining line) corresponds to one network. ***: p < 0.001, n.s.: p > 0.05 (one-tailed paired t-test).
Figure 6 with 1 supplement
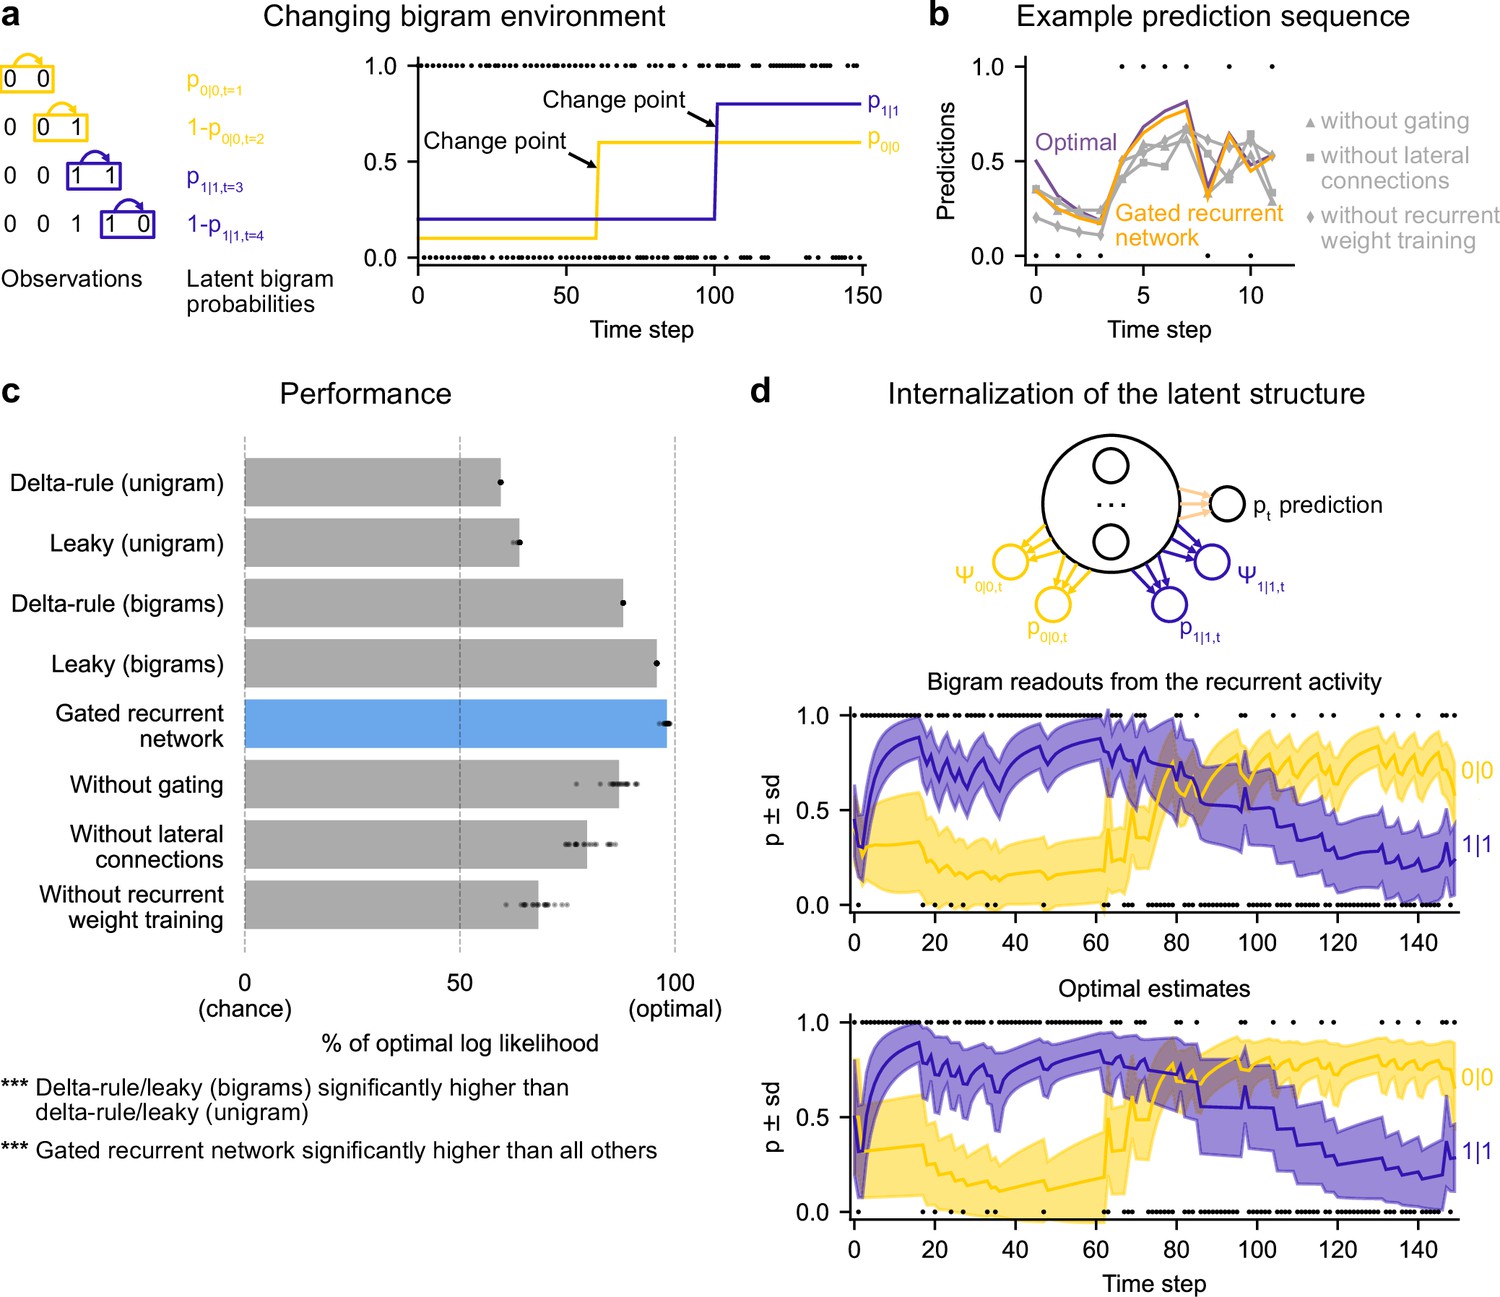
Gated recurrent networks correctly leverage and internalize the latent bigram structure.
(a) Schematic of the changing bigram environment’s latent probabilities (left) and sample generated sequence (right, dots: observations, lines: latent bigram probabilities). At each time step, a binary observation is randomly generated according to the relevant latent bigram probability, p0|0 or p1|1 depending on the previous observation. p0|0 denotes the probability of occurrence of a 0 after a 0 and p1|1 that of a 1 after a 1 (note that p1|0=1-p0|0 and p0|1=1-p1|1). At any time step, each of the two bigram probabilities can suddenly change to a new value uniformly drawn in [0,1], randomly with a fixed probability and independently from each other. (b) Example prediction sequence illustrating each network’s ability or inability to change prediction according to the local context, compared to the optimal prediction (dots: observations, lines: predictions). (c) Prediction performance of each type of agent in the changing bigram environment. 20 new agents of each type were trained and tested as in Figure 2b but now in the changing bigram environment (dots: agents; bars: average). The gated recurrent network significantly outperformed every other type of agent (p < 0.001, two-tailed two independent samples t-test with Welch’s correction for unequal variances). (d) Internalization of the latent structure as shown on an out-of-sample sequence: the two bigram probabilities are simultaneously represented in the gated recurrent network (top), and closely follow the optimal estimates (bottom). The readouts were obtained through linear regression from the recurrent activity to four estimates separately: the log odds of the mean and the log precision of the optimal posterior distribution on p0|0 and p1|1. In (b) and (d), the networks (out of 20) yielding median performance were selected for illustration purposes.
Figure 6—figure supplement 1
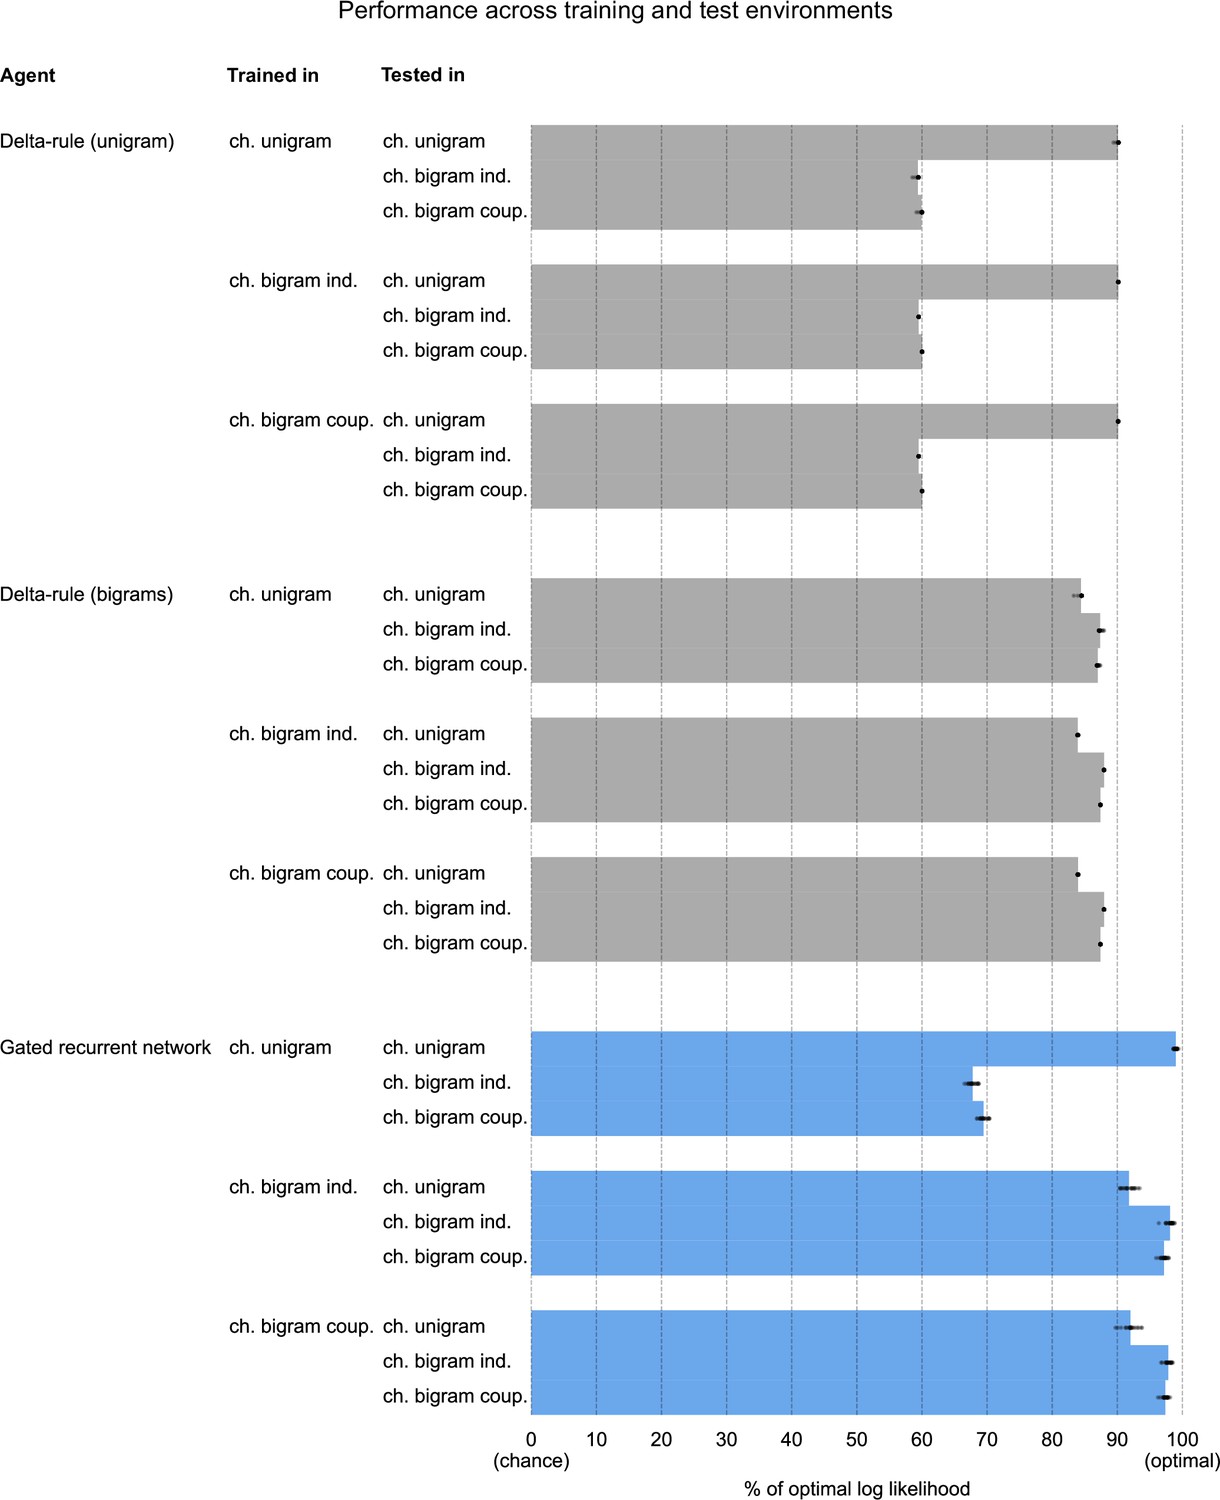
Performance across training and test environments.
For each type of agent and each environment, a set of 20 agents was trained in the given environment as in Figures 2, 5 and 6. The performance of each set of trained agents was then evaluated in each test environment, using 1,000 new sequences per environment and the same performance measure as in Figures 2 and 5. ch.: changing; ind.: independent change points; coup: coupled change points.
Figure 7
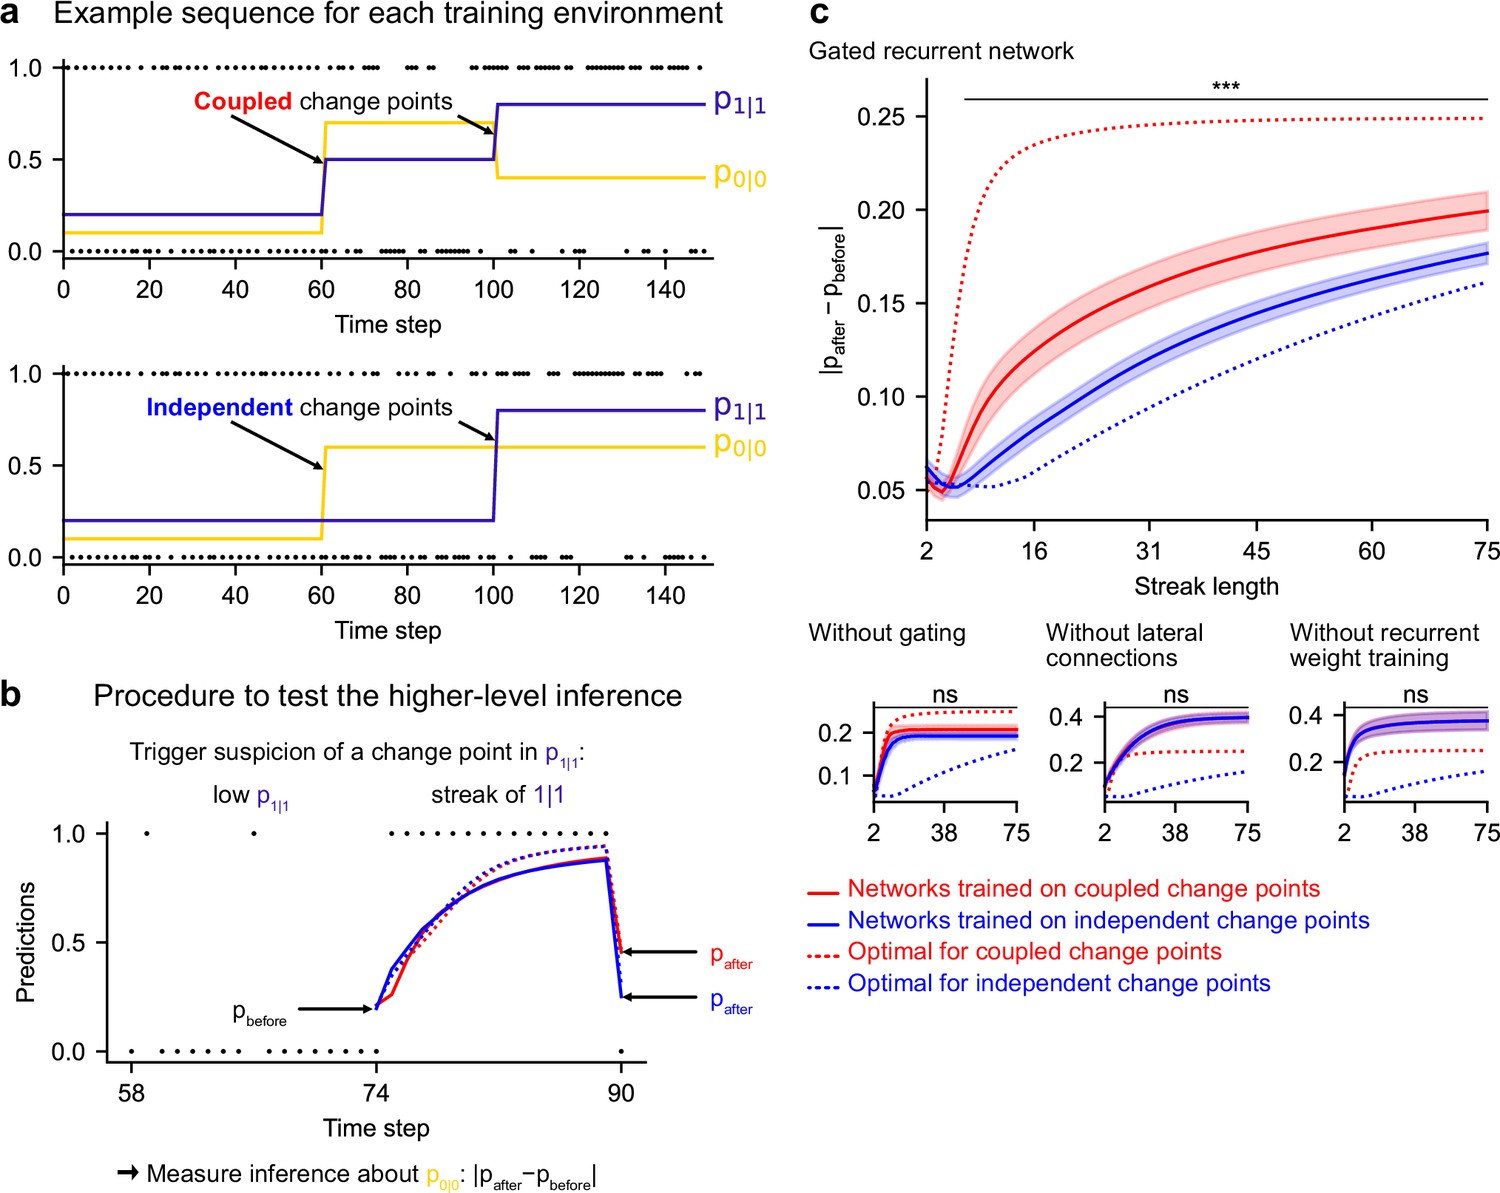
Gated recurrent but not alternative networks leverage a higher-level structure, distinguishing the case where change points are coupled vs. independent.
Procedure to test the higher-level inference: (a) For each network architecture, 20 networks were trained on sequences where the change points of the two latent bigram probabilities are coupled and 20 other networks were trained on sequences where they are independent (the plots show an example training sequence for each case); (b) The networks were then tested on sequences designed to trigger the suspicion of a change point in one bigram probability and measure their inference about the other bigram probability: |pafter−pbefore| should be larger when the agent assumes change points to be coupled rather than independent. The plot shows an example test sequence. Red, blue, solid, and dashed lines: as in (c), except that only the gated recurrent network (out of 20) yielding median performance is shown for illustration purposes. (c) Change in prediction about the unobserved bigram probability of the networks trained on coupled change points (red) and independent change points (blue) for each network architecture, averaged over sequences. Solid lines and bands show the mean and the 95 % confidence interval of the mean over networks. Dotted lines show the corresponding values of the optimal agent for the two cases. Only the gated recurrent architecture yields a significant difference between networks trained on coupled vs. independent change points (one-tailed two independent samples t-test, ***: p < 0.001, n.s.: p > 0.05).
Figure 8 with 1 supplement
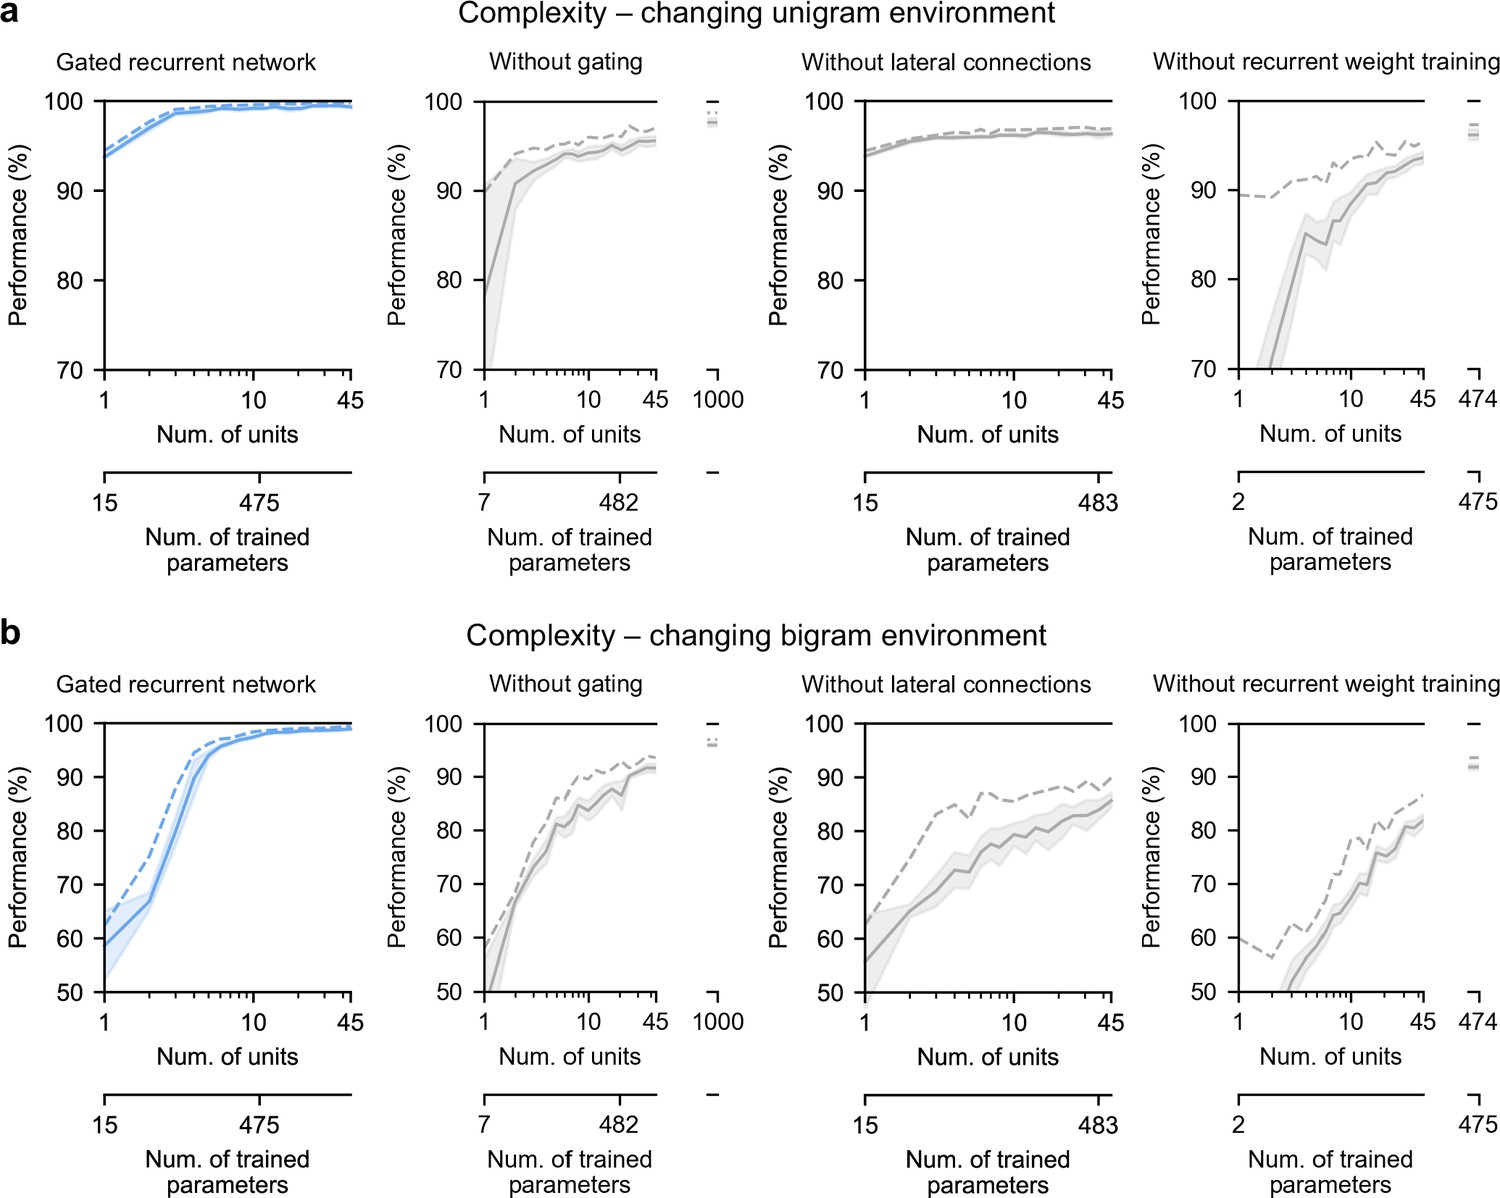
Low-complexity solutions are uniquely enabled by the combination of gating, lateral connections, and recurrent weight training.
(a and b) Prediction performance of each network architecture in the changing unigram environment and the changing bigram environment, respectively, as a function of the number of recurrent units (i.e. space complexity) of the network. For each network architecture and each number of units, 20 networks were trained using hyperparameters that had been optimized prior to training, and prediction performance was measured as the % of optimal log likelihood on new test sequences. Solid lines, bands, and dashed lines show the mean, 95 % confidence interval of the mean, and maximum performance, respectively. At the maximum displayed number of units, all of the alternative architectures have exceeded the complexity of the 11-unit gated recurrent network shown on the left and in previous Figures, both in terms of the number of units and the number of trained parameters (indicated on the twin x-axes), but none of them have yet reached its performance.
Figure 8—figure supplement 1
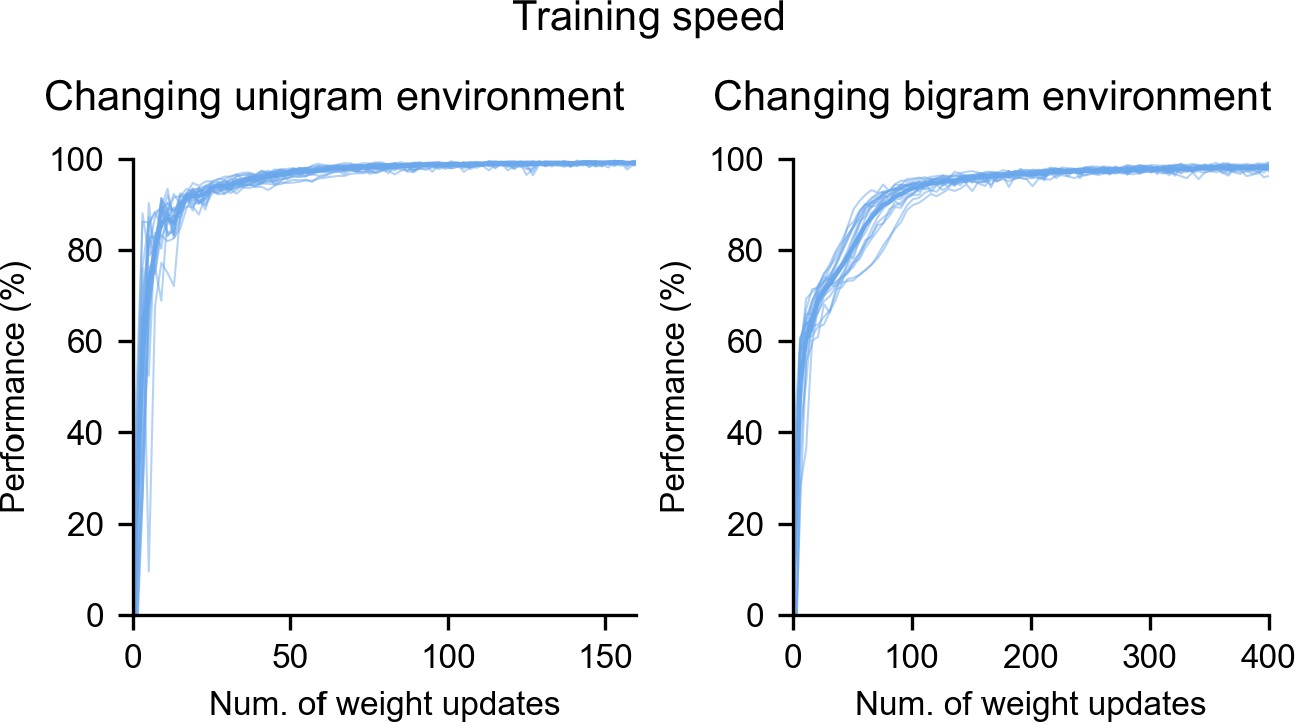
Training speed of the gated recurrent networks in the changing unigram and bigram environments.
During training, the networks’ weights were iteratively updated, with each update based on the evaluation of the cost function on 20 sequences. Prediction performance was repeatedly measured after each iteration as the % of optimal log likelihood on an out-of-sample validation set of 200 sequences. The thin lines and the thick line show the mean and the individual performances of the 20 networks, respectively.
Author response image 1
At an equal number of units, the LSTM matches the GRU in performance but is more complex.
Tables
Table 1
Selected hyperparameter values after optimization.
(*: fixed value.)
| Environment | Network architecture | N | η0 | σ0,x⋅ | σ0,h⋅ | μ0,h⋅,ii |
|---|---|---|---|---|---|---|
| unigram | gated recurrent network | 3 | 8.00E-02 | 0.02 | 0.02 | 0* |
| unigram | gated recurrent network | 11 | 6.60E-02 | 0.43 | 0.21 | 0* |
| unigram | gated recurrent network | 45 | 4.20E-02 | 1 | 0.02 | 0* |
| unigram | without gating | 3 | 2.50E-02 | 1 | 0.07 | 0* |
| unigram | without gating | 11 | 1.70E-02 | 1 | 0.07 | 0* |
| unigram | without gating | 45 | 7.60E-03 | 1 | 0.08 | 0* |
| unigram | without gating | 1,000 | 1.34E-04 | 1 | 0.04 | 0* |
| unigram | without lateral connections | 3 | 5.30E-02 | 0.02 | 0.02 | 1 |
| unigram | without lateral connections | 11 | 2.70E-02 | 1 | 0.02 | 1 |
| unigram | without lateral connections | 45 | 1.30E-02 | 1 | 1 | 1 |
| unigram | without recurrent weight training | 3 | 1.00E-01 | 1.07 | 0.55 | 0* |
| unigram | without recurrent weight training | 11 | 1.00E-01 | 2 | 0.41 | 0* |
| unigram | without recurrent weight training | 45 | 1.00E-01 | 2 | 0.26 | 0* |
| unigram | without recurrent weight training | 474 | 9.60E-03 | 1 | 0.1 | 0* |
| bigram | gated recurrent network | 3 | 6.30E-02 | 0.02 | 1 | 0* |
| bigram | gated recurrent network | 11 | 4.40E-02 | 1 | 0.02 | 0* |
| bigram | gated recurrent network | 45 | 1.60E-02 | 1 | 0.02 | 0* |
| bigram | without gating | 3 | 5.50E-02 | 0.02 | 0.13 | 0* |
| bigram | without gating | 11 | 3.20E-02 | 1 | 0.05 | 0* |
| bigram | without gating | 45 | 8.90E-03 | 1 | 0.06 | 0* |
| bigram | without gating | 1,000 | 5.97E-05 | 1 | 0.03 | 0* |
| bigram | without lateral connections | 3 | 4.30E-02 | 1 | 0.02 | 0 |
| bigram | without lateral connections | 11 | 4.30E-02 | 1 | 1 | 0 |
| bigram | without lateral connections | 45 | 2.80E-02 | 1 | 1 | 0 |
| bigram | without recurrent weight training | 3 | 6.60E-02 | 0.73 | 0.55 | 0* |
| bigram | without recurrent weight training | 11 | 1.00E-01 | 2 | 0.45 | 0* |
Additional files
Download links
A two-part list of links to download the article, or parts of the article, in various formats.
Downloads (link to download the article as PDF)
Open citations (links to open the citations from this article in various online reference manager services)
Cite this article (links to download the citations from this article in formats compatible with various reference manager tools)
Gated recurrence enables simple and accurate sequence prediction in stochastic, changing, and structured environments
eLife 10:e71801.
https://doi.org/10.7554/eLife.71801


