Relationships between community composition, productivity and invasion resistance in semi-natural bacterial microcosms
- Department of Life Sciences, Imperial College London, Silwood Park Campus, United Kingdom
Figures
Figure 1
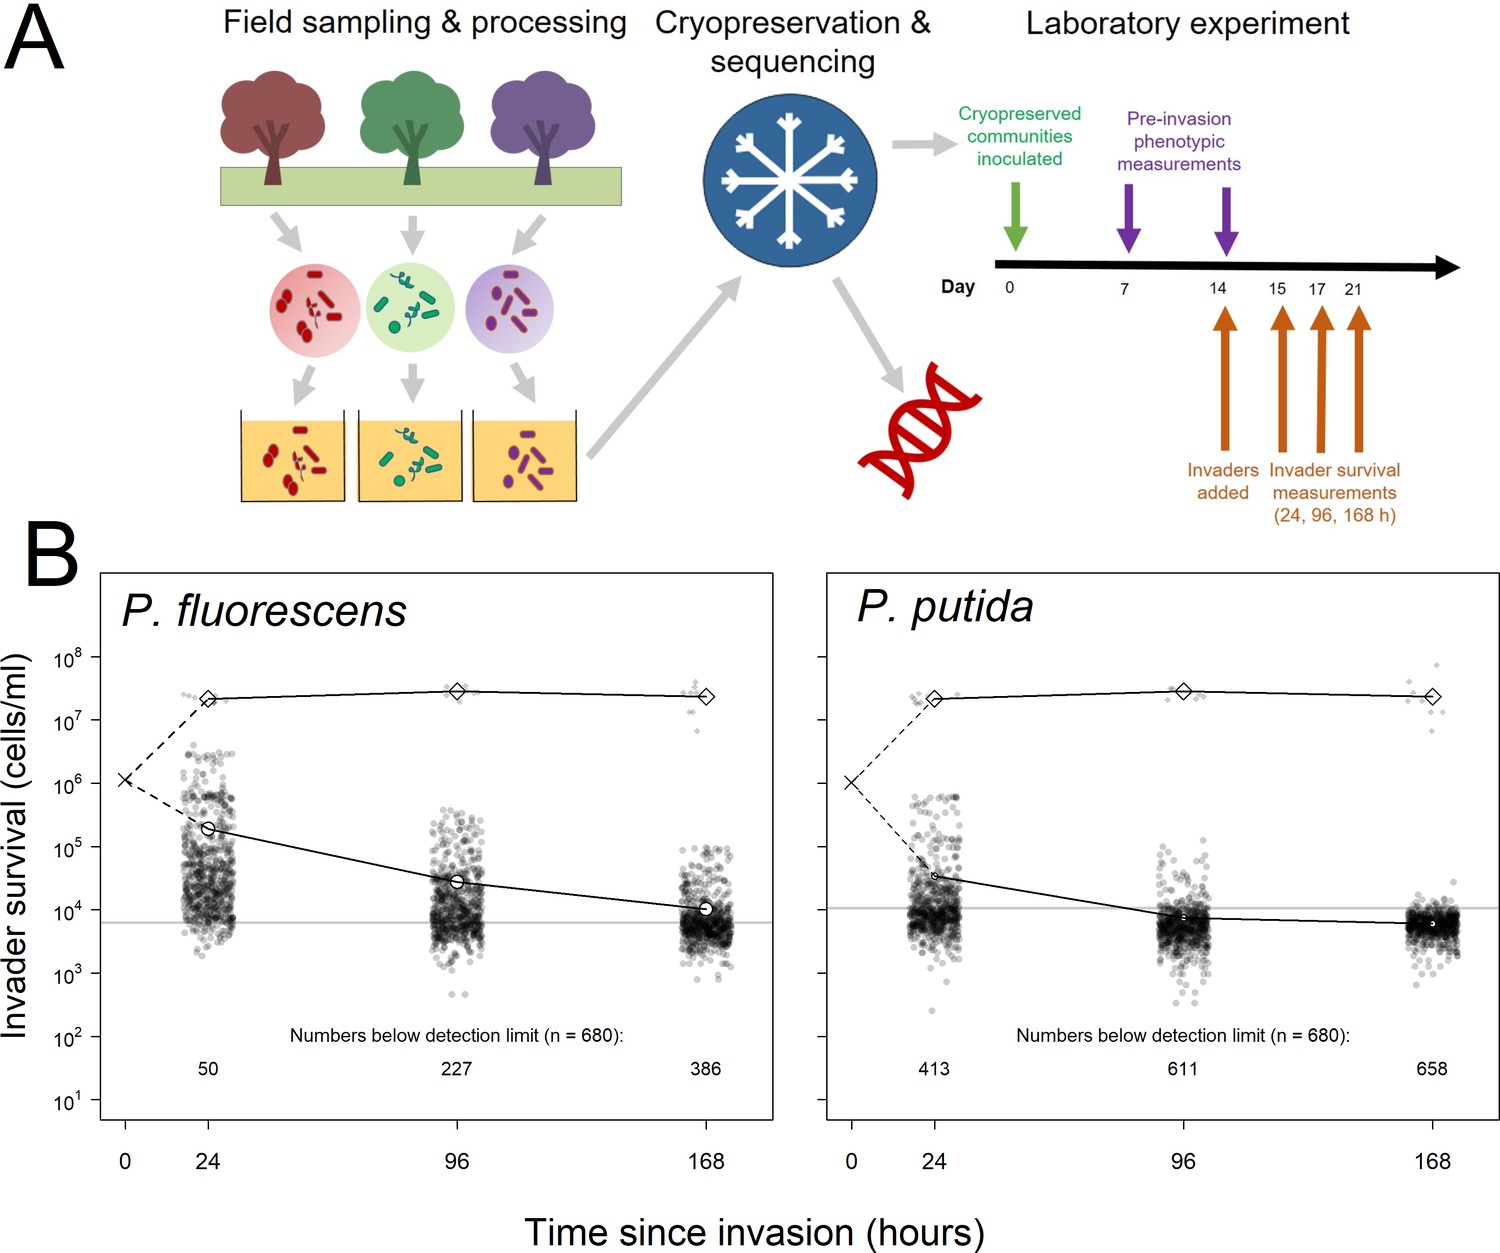
Summary of experimental set-up and broad patterns of invader survival across the three sampling points.
(A) Schematic depicting the sampling and processing of communities (field sampling and growth of lab acclimation of communities), the cryopreservation and sequencing of the lab-acclimated communities, and the setup and sampling scheme of the laboratory experiment described here. (B) Invader survival values for both invaders at each of the three sampling points in monoculture (diamonds) and in communities (circles). Larger, white points represent the means for the respective subsets of the data; grey line represents the estimated cells/ml detection limit; dashed line represent inferred trajectories between the inoculation density and the invasion densities, as the inoculation density was measured in the invader culture prior to its inoculation into communities.
-
Figure 1—source data 1
Invader survival data for each of the 680 communities after averaging across the four pseudoreplicated assays and converting from lux to cells/ml.
The invader survival data columns are labelled in the format ‘invader identity.cell density per ml.hours since invasion’.
- https://cdn.elifesciences.org/articles/71811/elife-71811-fig1-data1-v1.csv
-
Figure 1—source data 2
Data from the growth-curve assay of luminescence and plate count measurements, used to calibrate invader luminescence against cell density.
Key columns are invader (invader assayed – P. fluorescens SBW25 or P. putida KT2440), rep (replicate), the cfu.00 columns (cells per ml at n hours of growth) and the lum.00 columns (lux at n hours of growth).
- https://cdn.elifesciences.org/articles/71811/elife-71811-fig1-data2-v1.csv
-
Figure 1—source data 3
Table in the same format as as Figure 1—source data 1 but with TRUE/FALSE values instead of values indicating which invader survival measurements were below the detection limit of 12 lumens (TRUE) before conversion to cells/ml.
- https://cdn.elifesciences.org/articles/71811/elife-71811-fig1-data3-v1.csv
Figure 2 with 3 supplements
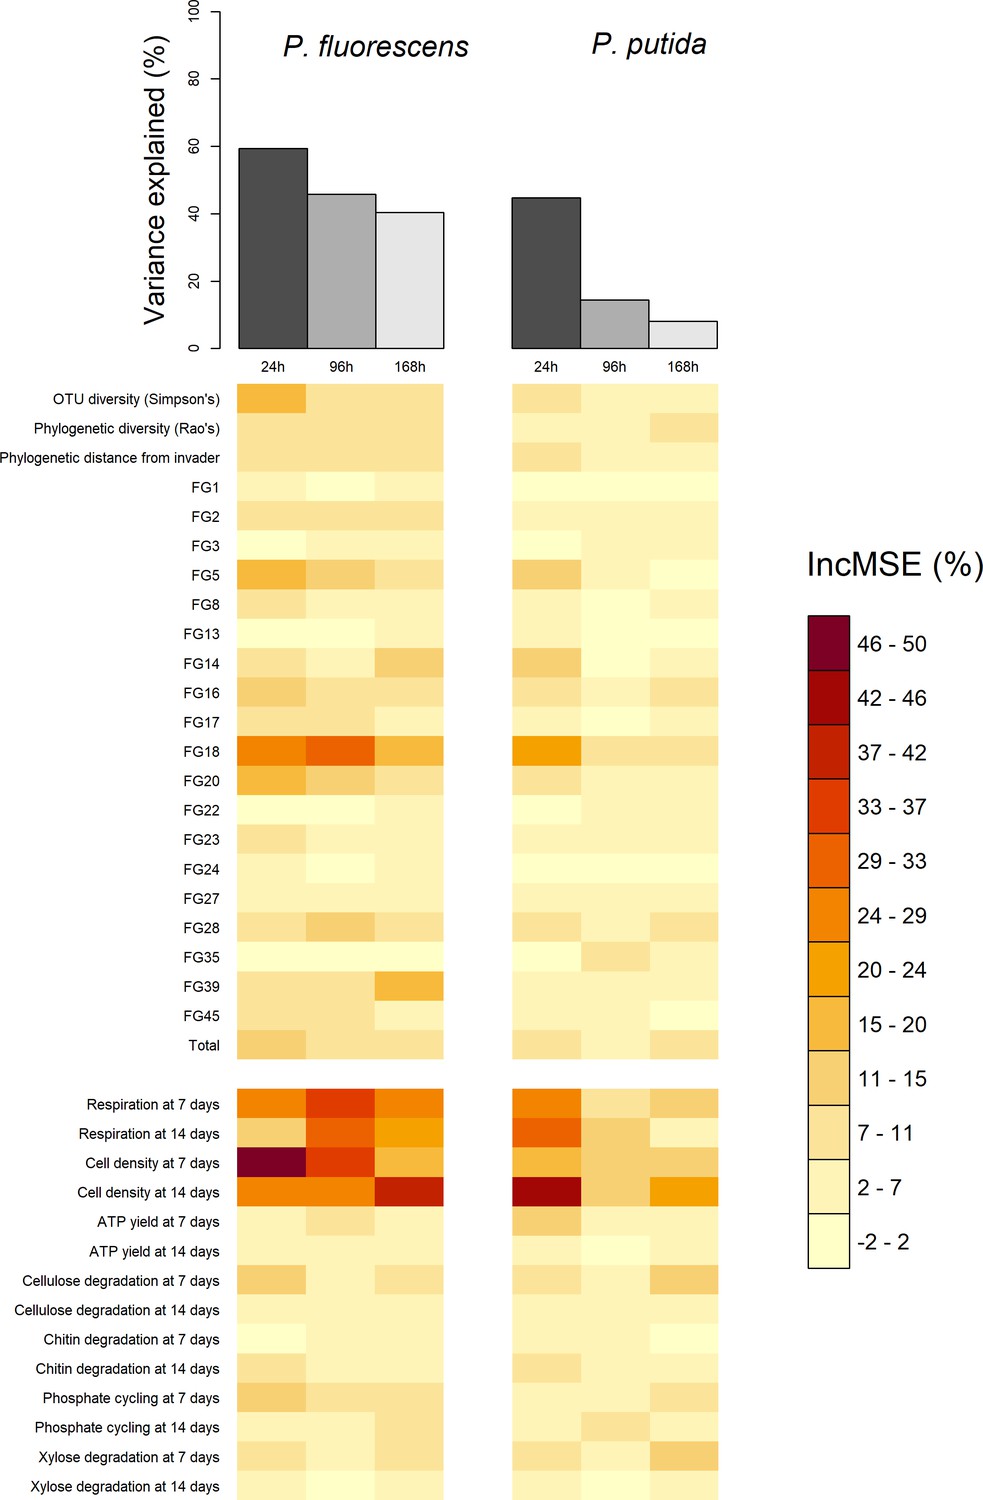
Comparison of total variance explained (top bars) and the variable importance values (bottom heatmap) of the six random forests, computed for each of the two invaders and each of three the invader survival sampling points at 24, 96, and 168 hr post-invasion.
Total variance explained is calculated as pseudo R-squared: 1-Mean Squared Error/variance (invader survival) of the random forest. Variable importance values are the percentage increase in Mean Squared Error (IncMSE %) when the variable is not permuted i.e. a high (low) value represents a variable of high (low) importance to explaining invasion success. Each column in the variable importance heatmap represents the variable importance values of the random forest using functional Groups represented by the orange bar in the top figure. The heatmap is split into compositional (above split) and functional (below split) variables. Compositional variables labelled 'FG+number' refer to the functional group ids.
-
Figure 2—source data 1
Table of the variance explained by each random forest with key columns being invader (invader assayed – P. fluorescens SBW25 or P. putida KT2440), timepoint (time since invasion), and varexp (pseudo R-squared/% variance explained).
- https://cdn.elifesciences.org/articles/71811/elife-71811-fig2-data1-v1.csv
-
Figure 2—source data 2
Invader survival data for each of the 680 communities after averaging across the four pseudoreplicated assays and converting from lux to cells/ml.
The invader survival data columns are labelled in the format ‘invader identity.cell density per ml.hours since invasion’.
- https://cdn.elifesciences.org/articles/71811/elife-71811-fig2-data2-v1.csv
Figure 2—figure supplement 1
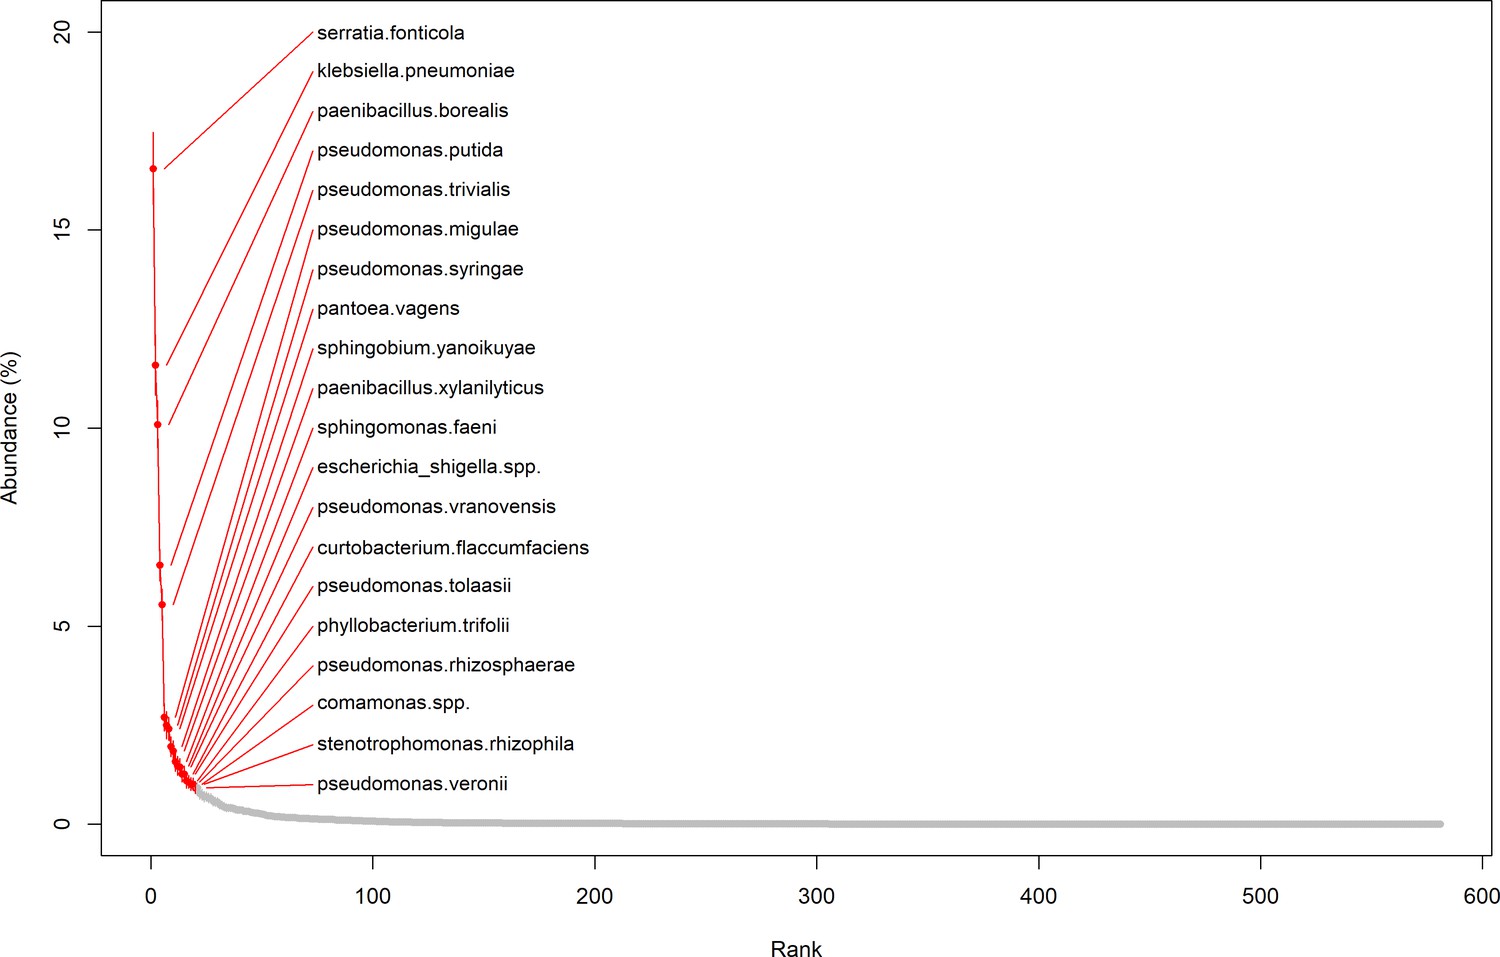
Rank abundance plot of OTUs (mean and standard error of each OTU’s abundance in all communities).
Figure 2—figure supplement 2
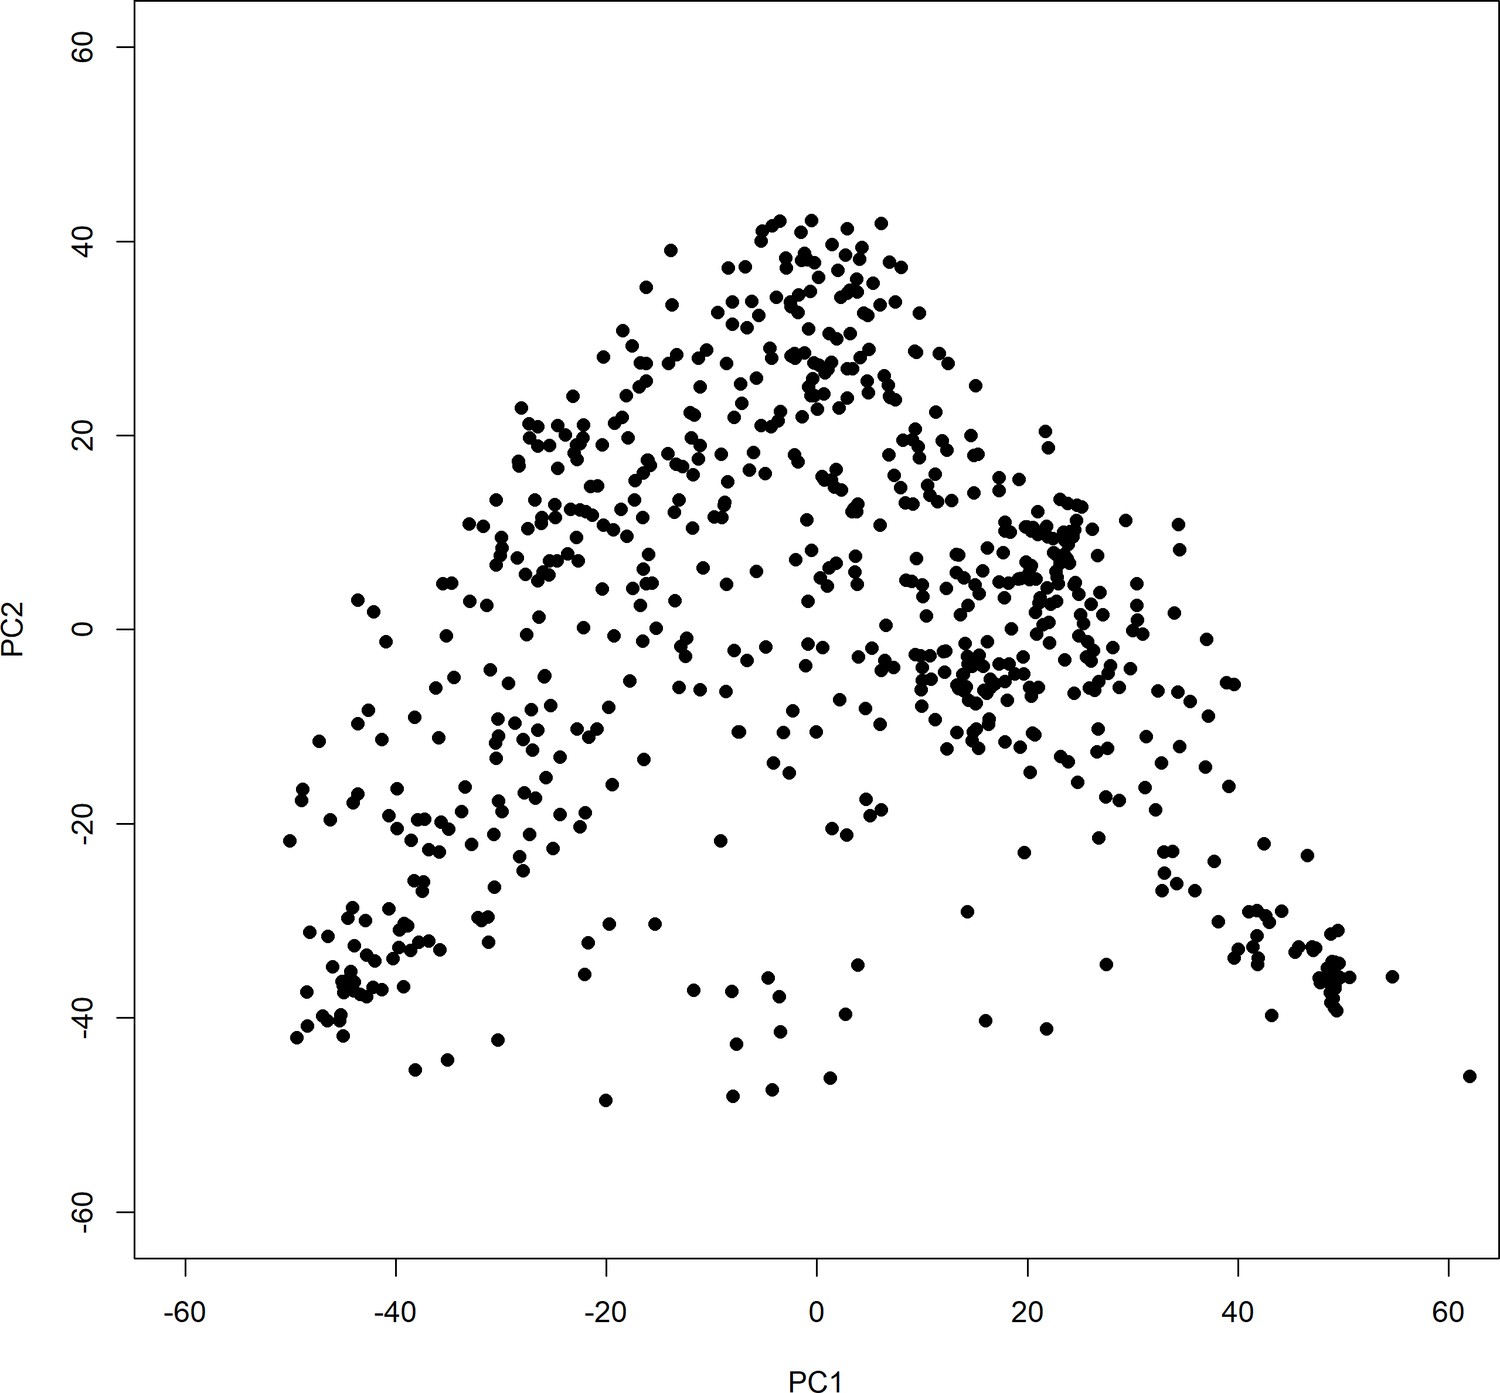
First two coordinates (of five total used in the analysis) of the principal coordinates analysis (PCoA).
The PCoA was performed on the distance matrix of the Jensen-Shannon divergence (Endres and Schindelin, 2003) of OTU abundances using the ‘dudi.pcoa’ function from the ade4 package (Chessel et al., 2004).
Figure 2—figure supplement 3
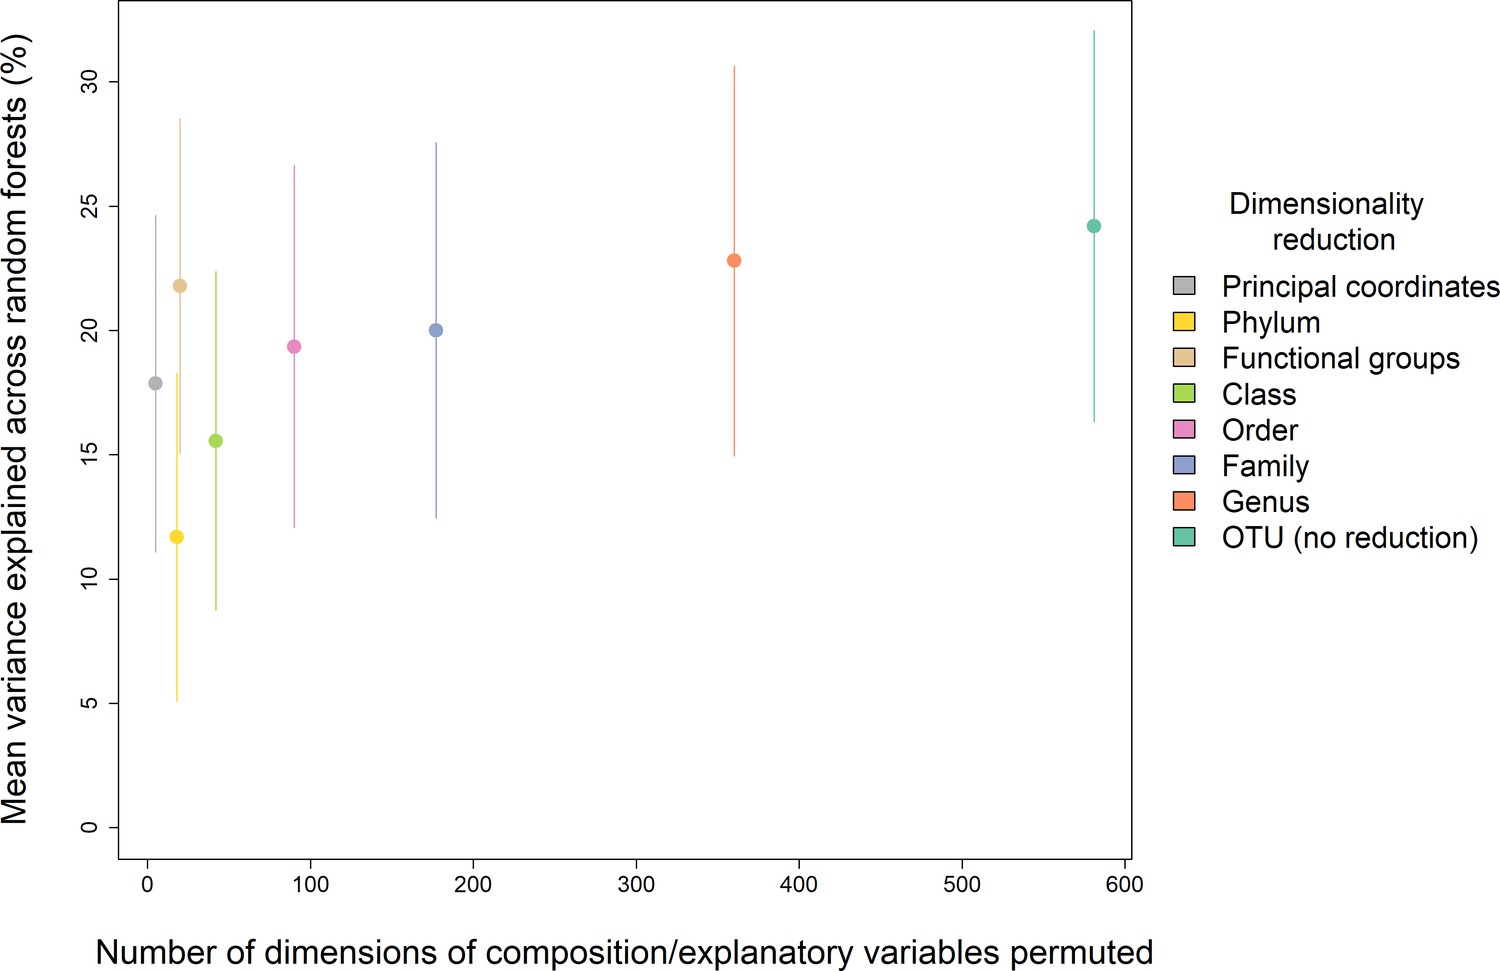
Comparison of the performance of different dimensionality reductions of the starting composition data, shown as mean variance explained vs the number of dimensions in each of the tested reductions. The functional groups approach had a disproportionate explanatory power for its number of dimensions, comparable to no dimensionality reduction, and so we opted for this method for our main analyses.
Figure 3 with 3 supplements
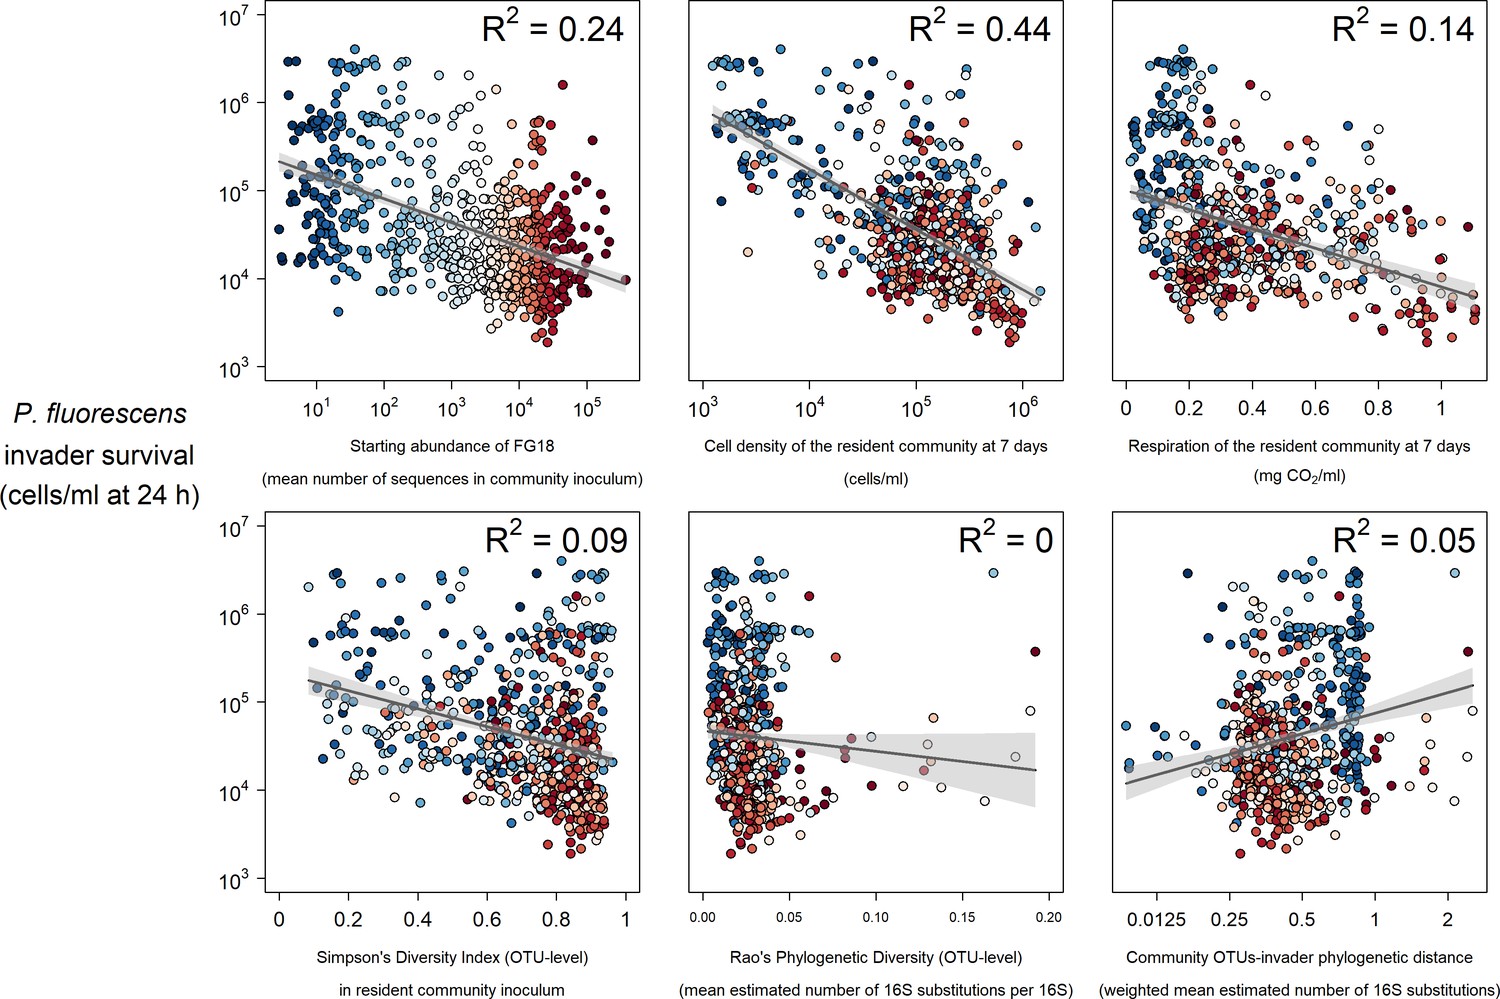
Selected strong (top) and weak (bottom) relationships between explanatory variables and P. fluorescens invasion success at 24 hr post-invasion.
Colours represent the mean abundance of OTUs belong to Functional Group 18 in each community (blue low, red high).
-
Figure 3—source data 1
Invader survival data for each of the 680 communities after averaging across the four pseudoreplicated assays and converting from lux to cells/ml.
The invader survival data columns are labelled in the format ‘invader identity.cell density per ml.hours since invasion’.
- https://cdn.elifesciences.org/articles/71811/elife-71811-fig3-data1-v1.csv
-
Figure 3—source data 2
Diversity metrics for each of the 680 communities (Simpson’s diversity, Rao’s quadratic entropy, and phylogenetic distance of the invader from the community for each of the two invaders).
- https://cdn.elifesciences.org/articles/71811/elife-71811-fig3-data2-v1.csv
-
Figure 3—source data 3
Abundance of each of the functional groups in each of the 680 communities (mean number of sequences in the community inoculum for OTUs belonging to that group).
- https://cdn.elifesciences.org/articles/71811/elife-71811-fig3-data3-v1.csv
-
Figure 3—source data 4
Data relating to the phenotypic assays performed/measurements taken at 7 and 14 days, before invasion at 14 days.
Key column types are mgCO2 (milligrams of CO2 produced), CPM (cells per ml), ATP activity (nM ATP/ml), mG (mg/ml glucosidase), mN (mg/ml chitnase), mX (mg/ml xylosidase), mP (mg/ml phosphatase). Numbers in these column titles represent the day (7 or 14) when the measurement was taken.
- https://cdn.elifesciences.org/articles/71811/elife-71811-fig3-data4-v1.csv
-
Figure 3—source data 5
Diversity and phenotypic assay data, combined into one table for convenience.
- https://cdn.elifesciences.org/articles/71811/elife-71811-fig3-data5-v1.csv
Figure 3—figure supplement 1
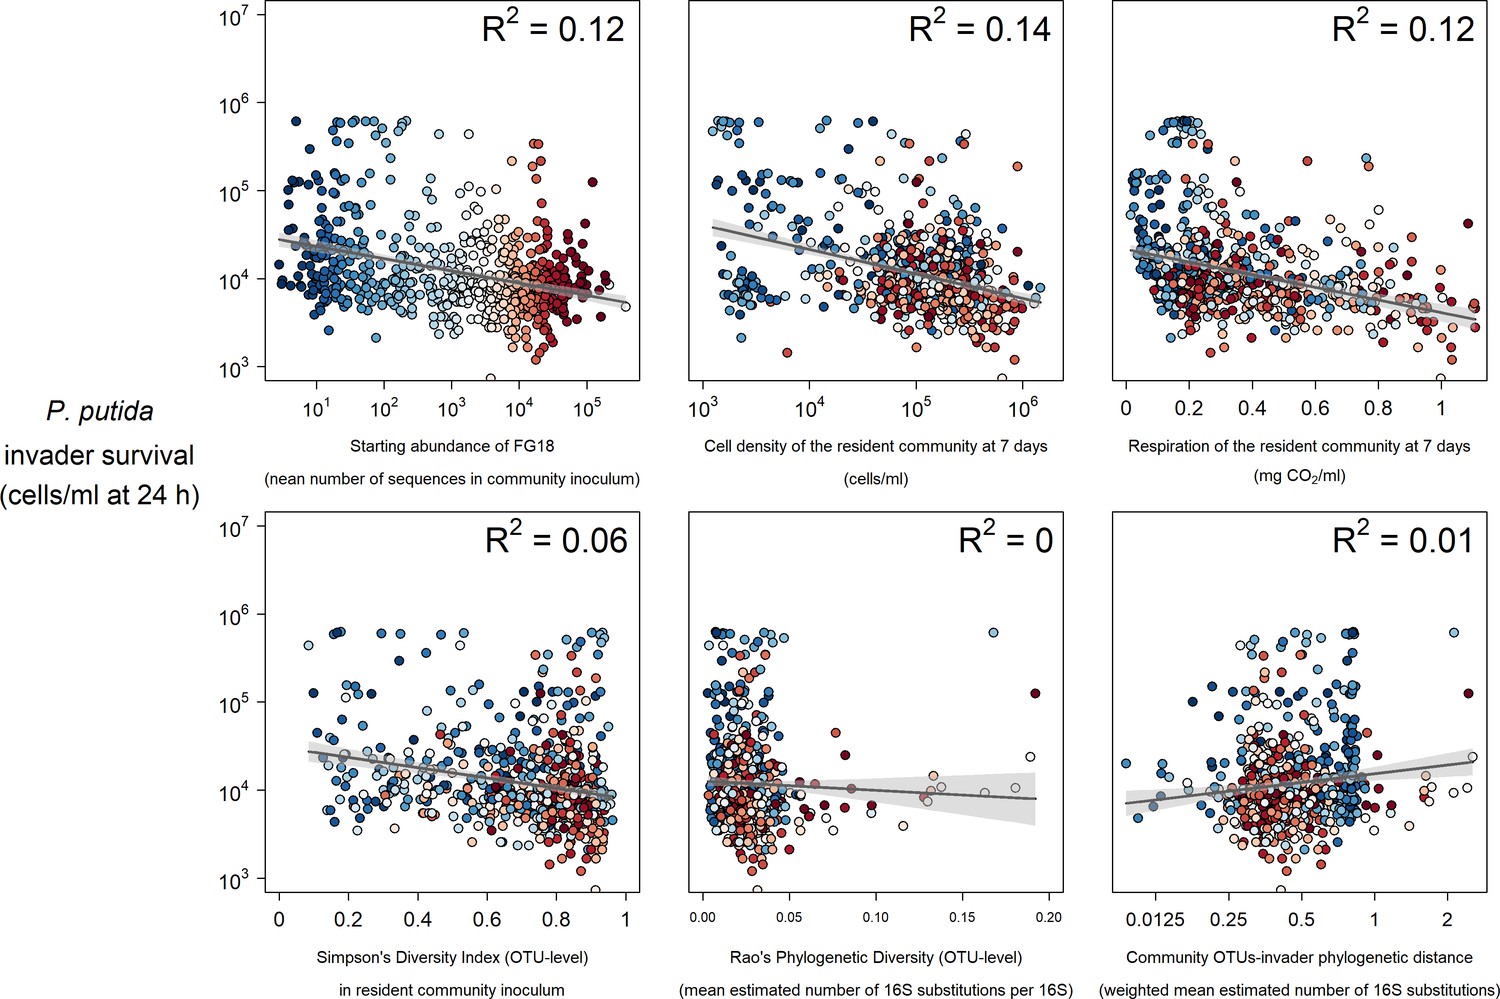
Selected strong (top) and weak (bottom) relationships between explanatory variables and P. putida invader survival at 24 hr post-invasion.
Colours represent the mean abundance of OTUs belong to Functional Group 18 in each community (blue low, red high).
Figure 3—figure supplement 2
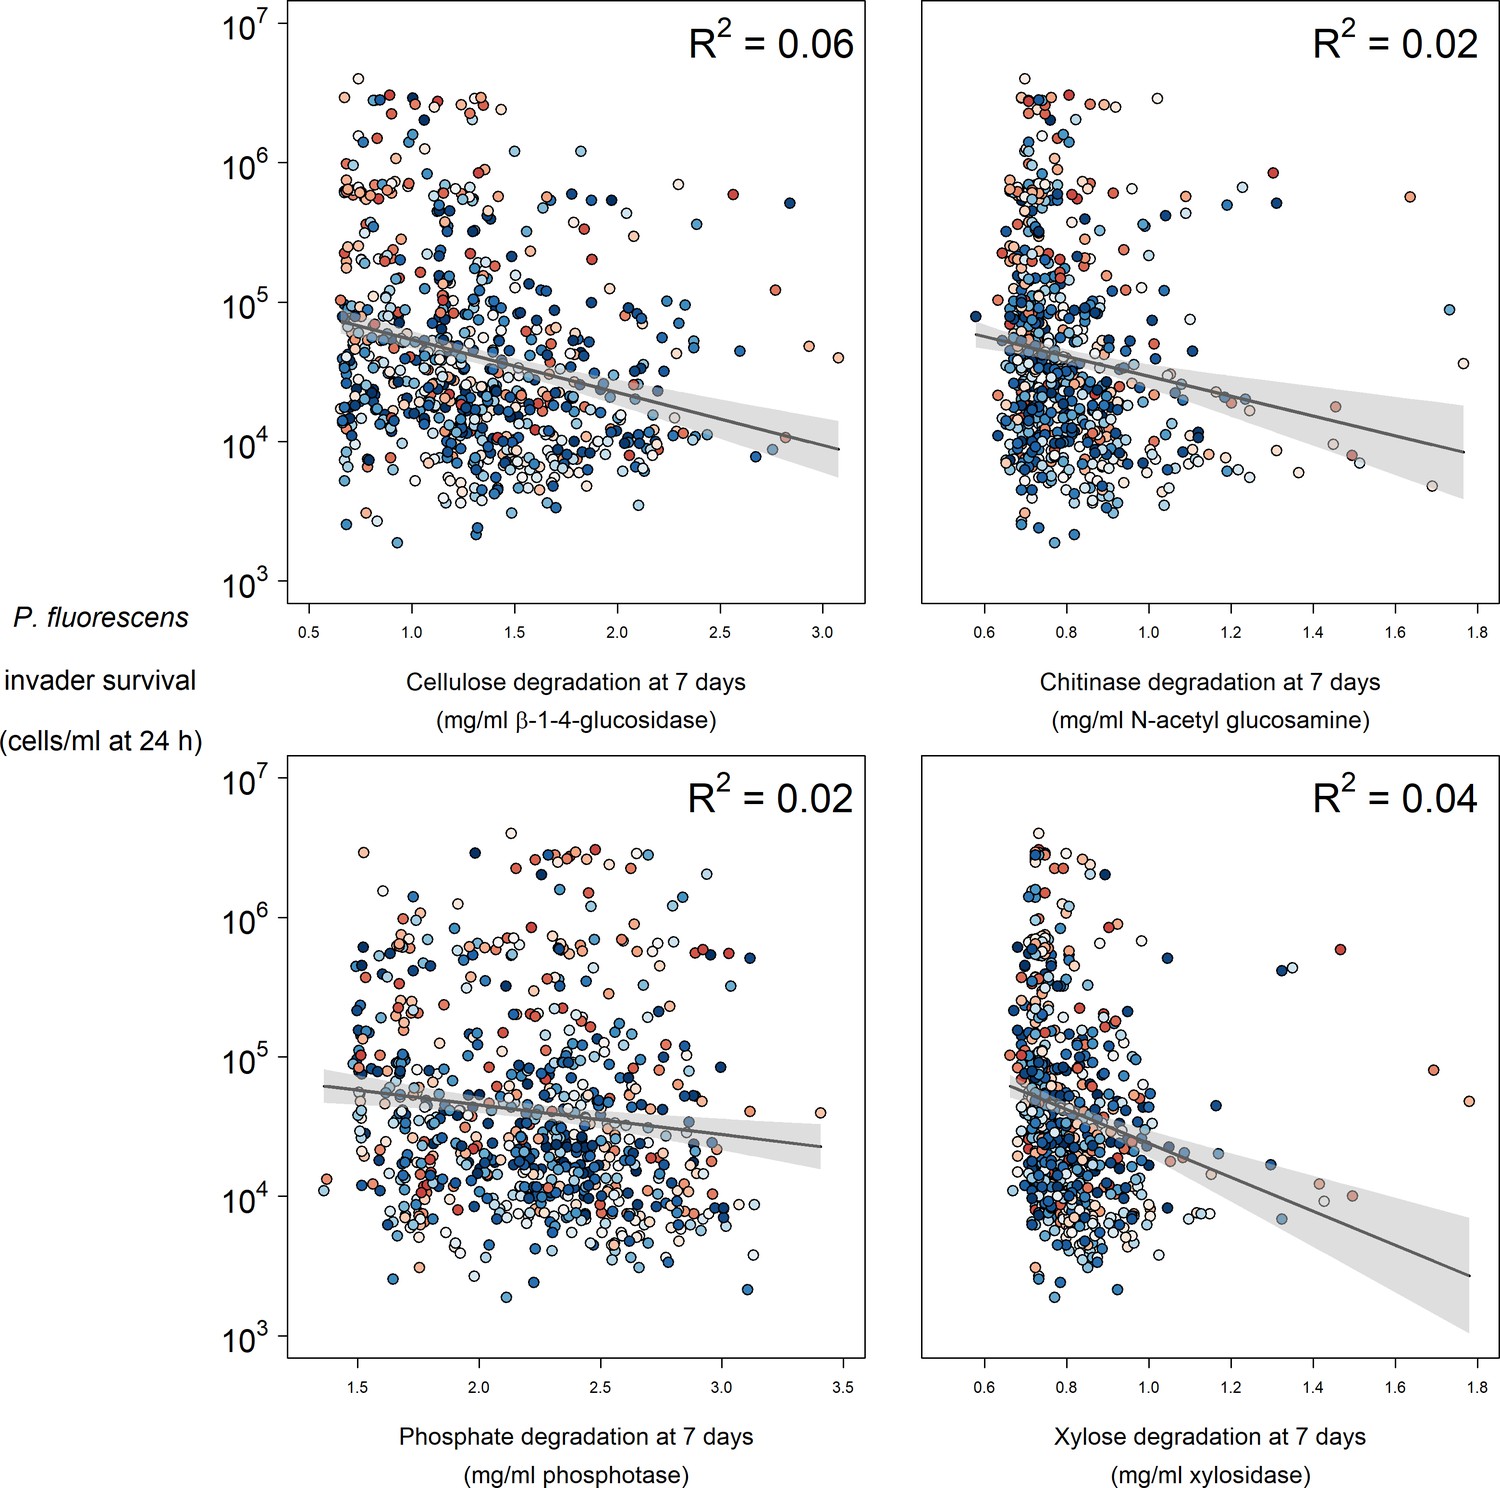
Relationships between enzyme activity and P. fluorescens invader survival at 24 hr post-invasion.
Colours represent the mean abundance of OTUs belong to Functional Group 18 in each community (blue low, red high).
Figure 3—figure supplement 3
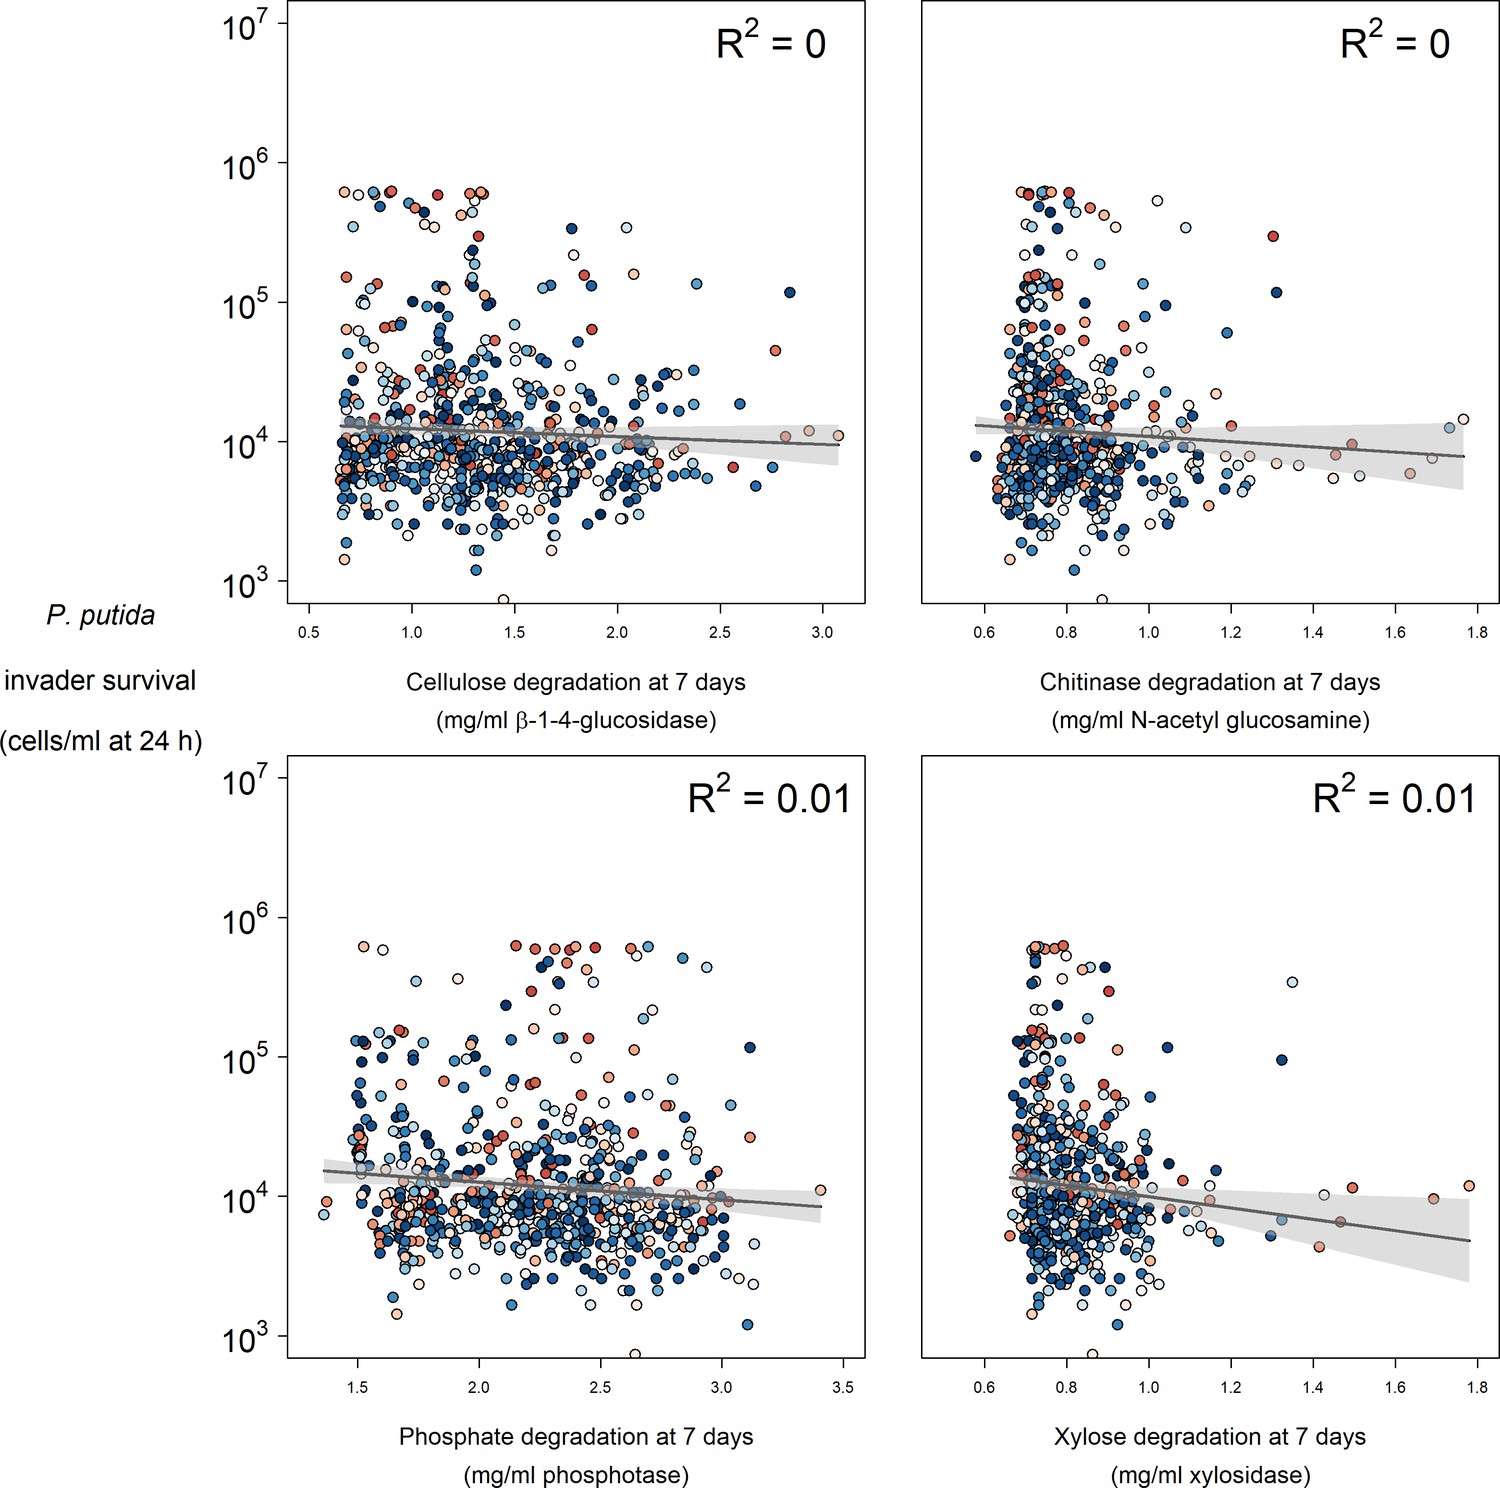
Relationships between enzyme activity and P. putida invader survival at 24 hr post-invasion.
Colours represent the mean abundance of OTUs belong to Functional Group 18 in each community (blue low, red high).
Figure 4 with 3 supplements
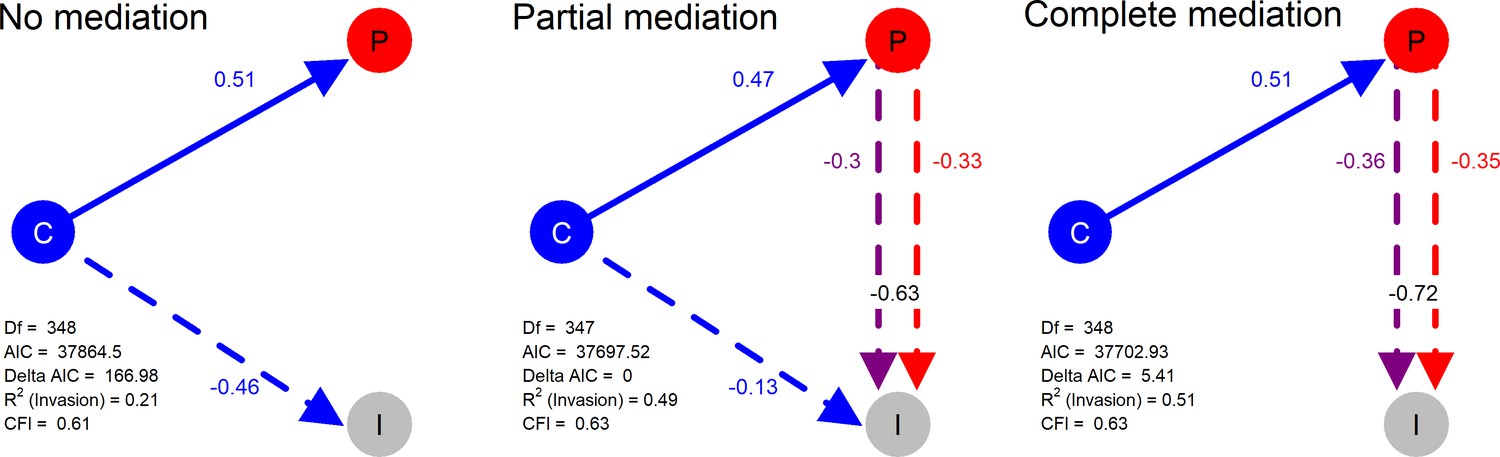
Structural models in a mediation test. Nodes in the diagrams represent latent variables C = Composition (blue), P = Productivity (red), I = Invasion (grey).
Arrows between nodes represent regressions between dependent and independent variables (blue = direct effect of composition, red = direct effect of productivity, purple = composition effect mediated by productivity). Direction and value of each path is indicated by arrow type (positive effect = solid line, dotted line = negative effect) and the standardised regression coefficient adjacent to the arrow. In the path P → I the total effect of productivity (sum of direct and composition-mediated effects) is shown between both lines in black.
-
Figure 4—source data 1
Model comparison results for the three structural equation models.
Key columns are model (model specification type in terms of extent to which productivity mediates the effect of composition), df (degrees of freedom), cfi (comparative fit index), rsq_inv (R2 for invasion), AICc (AIC value), and Delta AICc (delta AIC value).
- https://cdn.elifesciences.org/articles/71811/elife-71811-fig4-data1-v1.csv
-
Figure 4—source data 2
Model coefficients for the three structural equation models.
Key columns include Model (model specification type in terms of extent to which productivity mediates the effect of composition), Interpretation (path being represented by the coefficient), Std.coefficient (standardised regression coefficient).
- https://cdn.elifesciences.org/articles/71811/elife-71811-fig4-data2-v1.csv
Figure 4—figure supplement 1

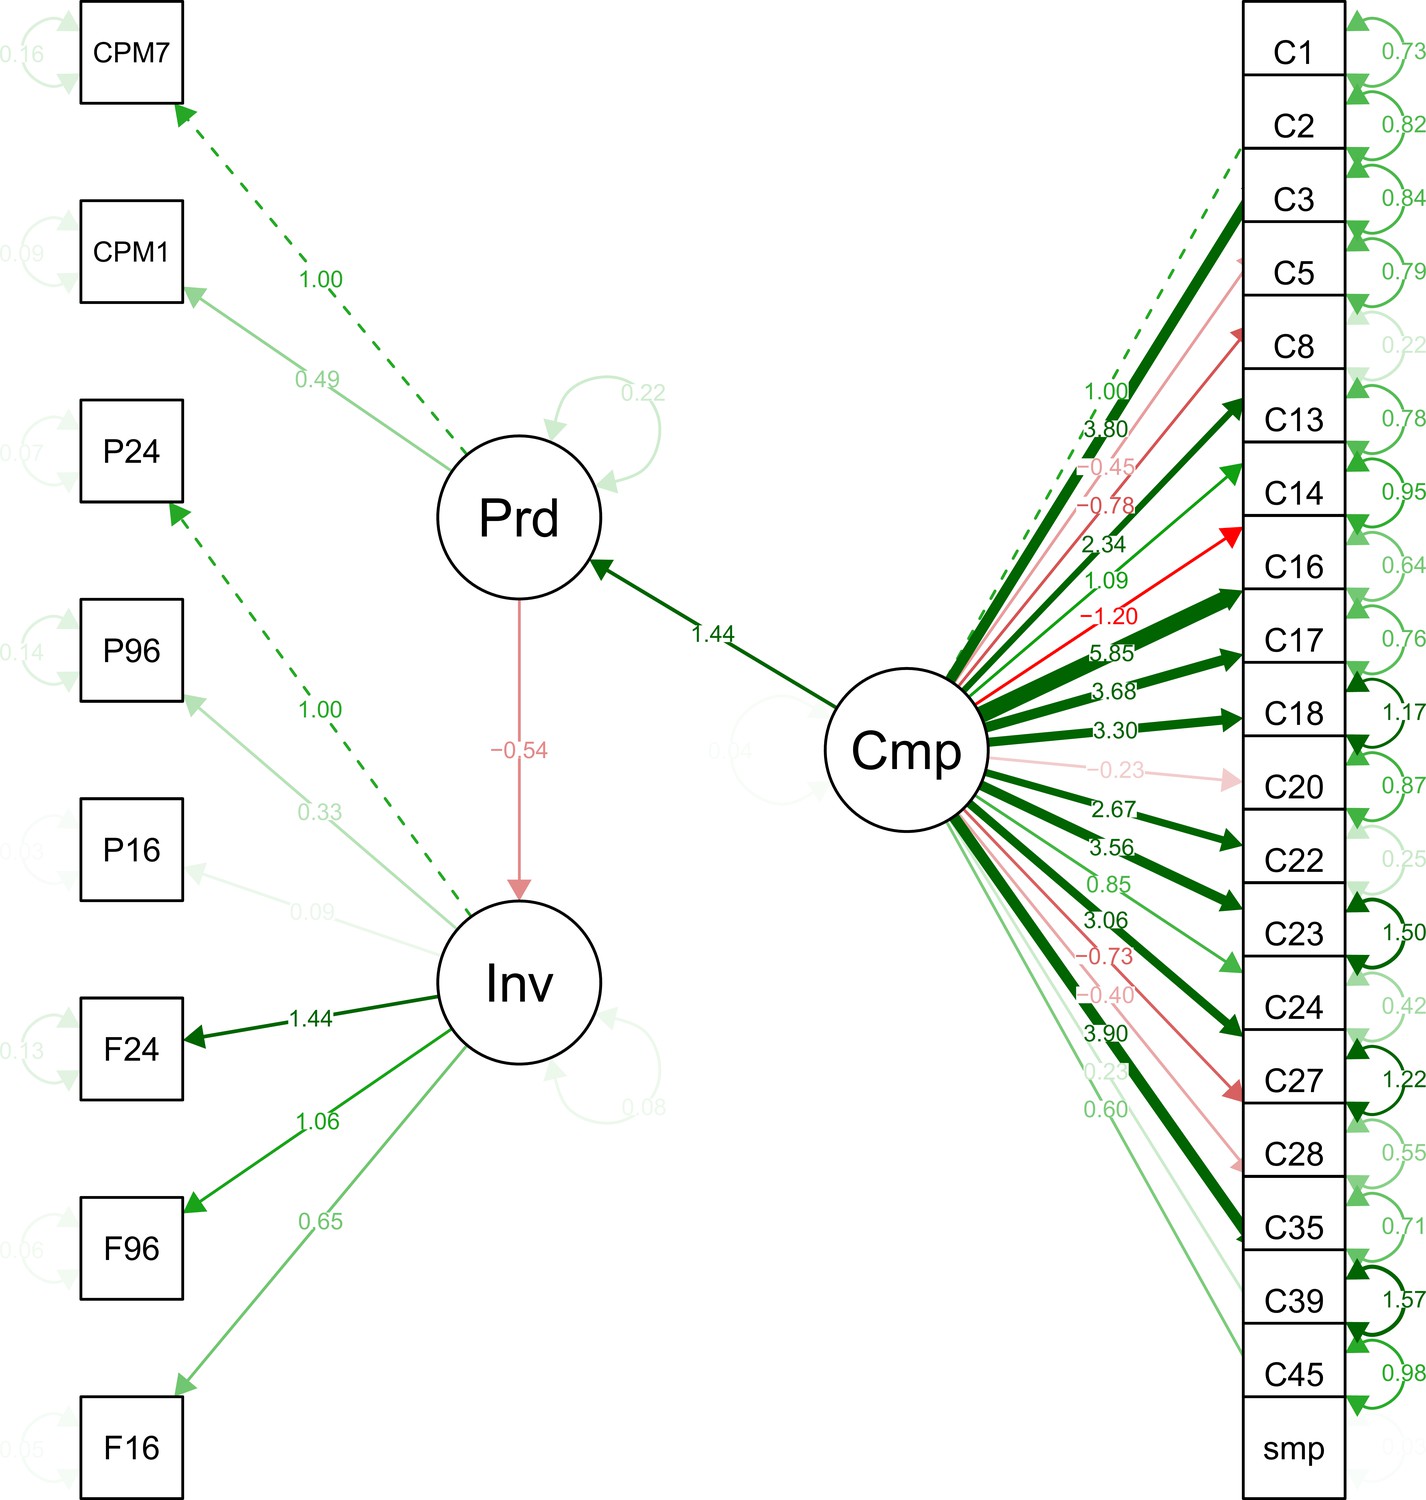
Full structure of Partial Mediation structural equation model.
Figure 4—figure supplement 2
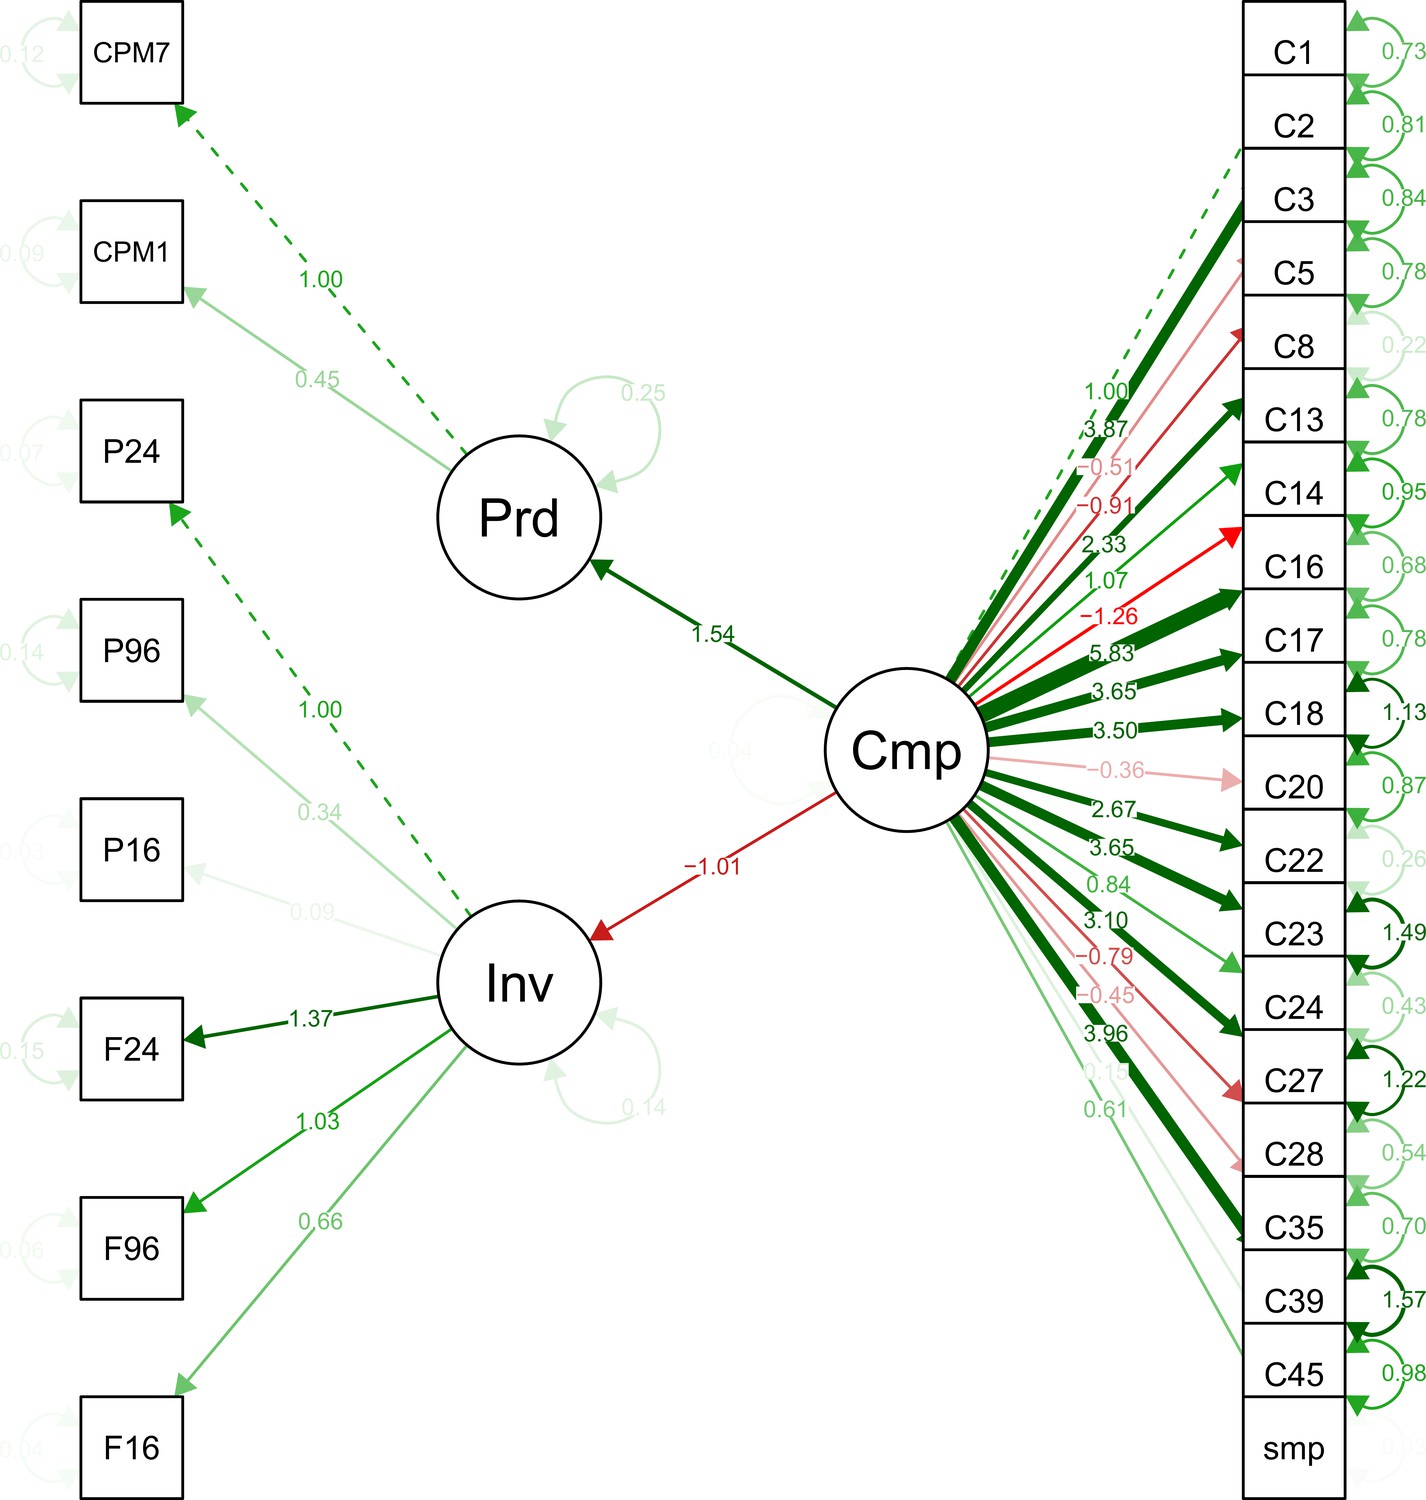
Full structure of Complete Mediation structural equation model.
Figure 4—figure supplement 3
Full structure of No Mediation structural equation model.
Tables
Key resources table
| Reagent type (species) or resource | Designation | Source or reference | Identifiers | Additional information |
|---|---|---|---|---|
| Other | Communities | Rivett and Bell, 2018; 10.1038/s41564-018-0180-0 | NA | Cryopreserved tree hole communities archived in the lab of Professor Thomas Bell |
| Commercial assay, kit | ZR-96 DNA Soil extraction kits | Zymo Research Ltd | 11–324H | DNA extraction kit |
| Other | BLT | Rivett and Bell, 2018; 10.1038/s41564-018-0180-0 | NA | Bespoke culture medium made from Autumn/Fall beech leaves and water |
| Other | BD Accuri C6 Flow Cytometer | BD Biosciences | NA | Flow cytometer used for cell counts with Thiazole Orange (now discontinued) |
| Commercial assay, kit | MicroResp | The James Hutton Institute | 001 | Used for respiration assays |
| Commercial assay, kit | BacTiter-Glo | Promega | G8231 | Used for ATP assays |
| Chemical compound, drug | Xylose (β-xylosidase substrate); chitin (β-N-acetylhexosaminidase substrate); cellulose (β-glucosidase substrate); phosphate groups (phosphatase substrate) | Sigma-Aldrich | M7008; M2133; M3633; M8883 | Fluorescent substrates used for enzyme assays |
| Strain, strain background (Pseudomonas fluorescens) | SBW25 | Labs of Professors Thomas Bell and Craig MacClean; Vogwill et al., 2016 | NA | Lux-transformed P. fluorescens SBW25 invader strain with IPTG-inducable luciferase reported gene |
| Strain, strain background (Pseudomonas putida) | KT2440 | Labs of Professors Thomas Bell and Craig MacClean; Vogwill et al., 2016 | NA | Lux-transformed P. putida KT2440 invader strain with IPTG-inducable luciferase reported gene |
| Chemical compound, drug | IPTG | Sigma-Aldrich | I6758 | Needed to induce luminescence in the lux-tagged strains |
| Software, algorithm | R; RStudio | R Project for Statistical Computing; RStudio | RRID:SCR_001905; RRID:SCR_000432 | Used for the majority of data wrangling and analysis. |
| Software, algorithm | Geneious 2.0 | Biomatters Ltd | RRID:SCR_010519 | Used for construction of phylogenetic tree. |
| Software, algorithm | Functional group abundances | APG’s Github repository version 1.0.0 deposited in Zenodo [DOI: 10.5281/zenodo.5562687; (Pascual-García, 2021) this paper’s OSF repository https://doi.org/10.17605/OSF.IO/HC57W] | NA | Functional group abundances and the computational methods used to produce them (APG’s Github repository). |
Additional files
-
Supplementary file 1
Functional group membership – taxonomic assignments for each of the OTUs in each of the 18 functional groups identified using the functionInk approach.
- https://cdn.elifesciences.org/articles/71811/elife-71811-supp1-v1.docx
-
Source data 1
OTU table for the 680 communities used in the analysis.
OTU names are their species-level taxonomic assignments.
- https://cdn.elifesciences.org/articles/71811/elife-71811-data1-v1.csv
-
Transparent reporting form
- https://cdn.elifesciences.org/articles/71811/elife-71811-transrepform-v1.docx
Download links
A two-part list of links to download the article, or parts of the article, in various formats.
Downloads (link to download the article as PDF)
Open citations (links to open the citations from this article in various online reference manager services)
Cite this article (links to download the citations from this article in formats compatible with various reference manager tools)
Relationships between community composition, productivity and invasion resistance in semi-natural bacterial microcosms
eLife 10:e71811.
https://doi.org/10.7554/eLife.71811


